Estimated zip code population in 2022: 2,547 Zip code population in 2010: 3,810 Zip code population in 2000: 2,425
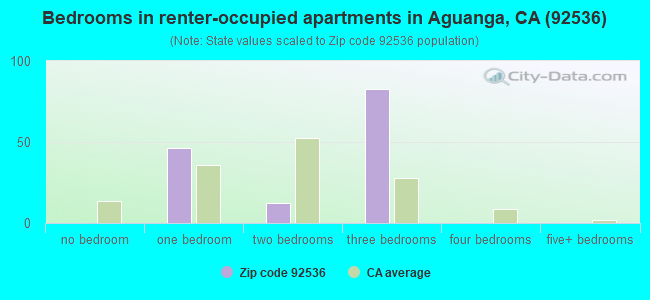
Houses and condos: 1,403 Renter-occupied apartments: 141
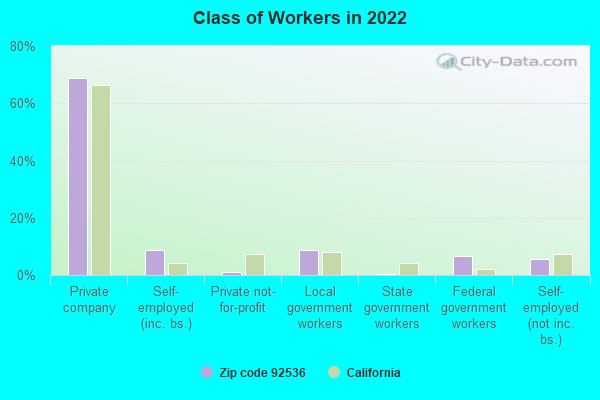
% of renters here:
13%
State:
44%
March 2022 cost of living index in zip code 92536: 75.6 (low, U.S. average is 100)
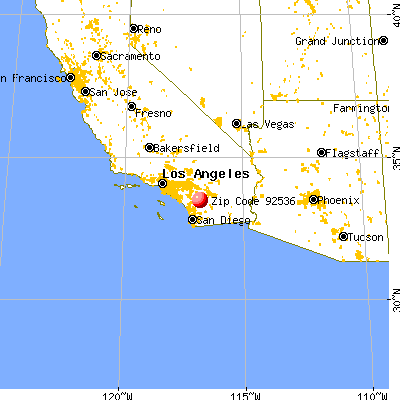
Land area: 124.8 sq. mi. Water area: 0.5 sq. mi.
Population density: 20 people per square mile
(very low).
OSM Map
General Map
Google Map
MSN Map
OSM Map
General Map
Google Map
MSN Map
OSM Map
General Map
Google Map
MSN Map
OSM Map
General Map
Google Map
MSN Map
Please wait while loading the map...
Real estate property taxes paid for housing units in 2022:
This zip code:
0.8% ($3,347)
California:
0.7% ($4,831)
Median real estate property taxes paid for housing units with mortgages in 2022: $3,383 (0.7%) Median real estate property taxes paid for housing units with no mortgage in 2022: $3,386 (0.8%)
Business Search- 14 Million verified businesses
Males: 1,351
(53.0%)
Females: 1,196
(47.0%)
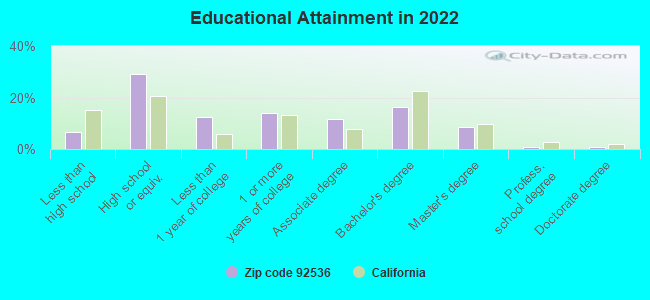
For population 25 years and over in 92536:
High school or higher: 92.8%
Bachelor's degree or higher: 26.2%
Graduate or professional degree: 10.1%
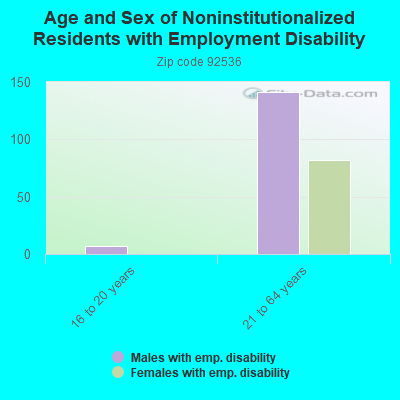
Unemployed: 8.0%
Mean travel time to work (commute): 46.3 minutes
For population 15 years and over in 92536:
Never married: 24.8%
Now married: 60.9%
Separated: 3.6%
Widowed: 2.6%
Divorced: 8.2%
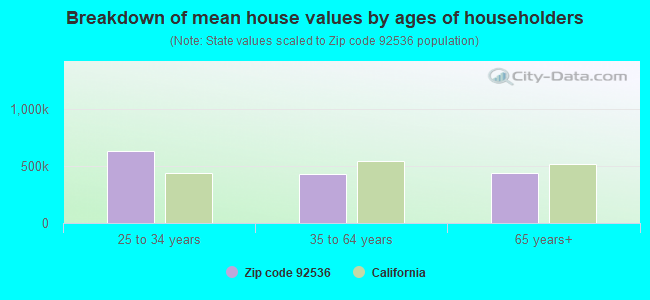
Zip code 92536 compared to state average:
Median house value below state average.
Black race population percentage significantly below state average.
Hispanic race population percentage below state average.
Median age significantly above state average.
Foreign-born population percentage significantly below state average.
Renting percentage significantly below state average.
Length of stay since moving in above state average.
Averages for the 2020 tax year for zip code 92536, filed in 2021:
Average Adjusted Gross Income (AGI) in 2020: $58,815 (Individual Income Tax Returns)
Here:
$58,815
State:
$95,910
Salary/wage: $53,644 (reported on 67.1% of returns)
Here:
$53,644
State:
$77,331
(% of AGI for various income ranges: 969.0% for AGIs below $25k, 3311.2% for AGIs $25k-50k, 5821.5% for AGIs $50k-75k, 8728.0% for AGIs $75k-100k, 19304.5% for AGIs $100k-200k)
Taxable interest for individuals: $570 (reported on 37.6% of returns)
This zip code:
$570
California:
$2,294
(% of AGI for various income ranges: 7.9% for AGIs below $25k, 24.0% for AGIs $25k-50k, 100.0% for AGIs $50k-75k, 44.0% for AGIs $75k-100k, 37.3% for AGIs $100k-200k)
Ordinary dividends: $3,292 (reported on 16.8% of returns)
Here:
$3,292
State:
$10,949
(% of AGI for various income ranges: 40.7% for AGIs below $25k, 52.8% for AGIs $25k-50k, 235.4% for AGIs $50k-75k, 125.0% for AGIs $75k-100k, 129.1% for AGIs $100k-200k)
Net capital gain/loss in AGI: +$6,608 (reported on 17.4% of returns)
Here:
+$6,608
State:
+$49,306
(% of AGI for various income ranges: 5.5% for AGIs below $25k, 55.6% for AGIs $25k-50k, 217.7% for AGIs $50k-75k, 205.0% for AGIs $75k-100k, 977.3% for AGIs $100k-200k)
Profit/loss from business: +$14,747 (reported on 20.1% of returns)
Here:
+$14,747
State:
+$15,671
(% of AGI for various income ranges: 205.5% for AGIs below $25k, 276.0% for AGIs $25k-50k, 375.4% for AGIs $50k-75k, 734.0% for AGIs $75k-100k, 1741.8% for AGIs $100k-200k)
Taxable individual retirement arrangement distribution: $16,873 (reported on 10.1% of returns)
92536:
$16,873
California:
$23,505
(% of AGI for various income ranges: 80.7% for AGIs below $25k, 156.0% for AGIs $25k-50k, 345.4% for AGIs $50k-75k, 597.0% for AGIs $75k-100k, 782.7% for AGIs $100k-200k)
Total itemized deductions: $32,211 (reported on 12.1% of returns)
Here:
$32,211
State:
$39,517
(% of AGI for various income ranges: 192.8% for AGIs below $25k, 990.8% for AGIs $50k-75k, 1268.0% for AGIs $75k-100k, 2439.1% for AGIs $100k-200k)
Charity contributions: $5,921 (reported on 9.4% of returns)
Here:
$5,921
State:
$12,598
(% of AGI for various income ranges: 123.8% for AGIs $50k-75k, 228.0% for AGIs $75k-100k, 400.0% for AGIs $100k-200k)
Taxes paid: $7,950 (reported on 12.1% of returns)
92536:
$7,950
State:
$8,807
(% of AGI for various income ranges: 45.5% for AGIs below $25k, 143.1% for AGIs $50k-75k, 332.0% for AGIs $75k-100k, 710.0% for AGIs $100k-200k)
Earned income credit: $1,970 (reported on 13.4% of returns)
Here:
$1,970
State:
$2,074
(% of AGI for various income ranges: 81.0% for AGIs below $25k, 63.6% for AGIs $25k-50k)
Percentage of individuals using paid preparers for their 2020 taxes: 91.3%
Here:
91%
State:
92%
(% for various income ranges: 91.7% for AGIs below $25k, 91.4% for AGIs $25k-50k, 91.3% for AGIs $50k-75k, 94.1% for AGIs $75k-100k, 90.9% for AGIs $100k-200k, 75.0% for AGIs over 200k)
Averages for the 2012 tax year for zip code 92536, filed in 2013:
Average Adjusted Gross Income (AGI) in 2012: $49,364 (Individual Income Tax Returns)
Here:
$49,364
State:
$72,726
Salary/wage: $42,577 (reported on 67.9% of returns)
Here:
$42,577
State:
$59,079
(% of AGI for various income ranges: 59.2% for AGIs below $25k, 61.5% for AGIs $25k-50k, 60.2% for AGIs $50k-75k, 68.8% for AGIs $75k-100k, 51.1% for AGIs $100k-200k)
Taxable interest for individuals: $1,392 (reported on 37.2% of returns)
This zip code:
$1,392
California:
$2,146
(% of AGI for various income ranges: 2.0% for AGIs below $25k, 1.2% for AGIs $25k-50k, 1.1% for AGIs $50k-75k, 1.4% for AGIs $75k-100k, 0.5% for AGIs $100k-200k)
Ordinary dividends: $3,345 (reported on 16.1% of returns)
Here:
$3,345
State:
$9,308
(% of AGI for various income ranges: 2.6% for AGIs below $25k, 0.9% for AGIs $25k-50k, 1.1% for AGIs $50k-75k, 0.5% for AGIs $75k-100k, 1.0% for AGIs $100k-200k)
Net capital gain/loss in AGI: +$2,445 (reported on 14.6% of returns)
Here:
+$2,445
State:
+$30,460
(% of AGI for various income ranges: 0.7% for AGIs $75k-100k, 1.9% for AGIs $100k-200k)
Profit/loss from business: +$9,490 (reported on 21.9% of returns)
Here:
+$9,490
State:
+$17,064
(% of AGI for various income ranges: 13.4% for AGIs below $25k, 7.5% for AGIs $25k-50k, 4.2% for AGIs $50k-75k, 0.5% for AGIs $75k-100k, 1.7% for AGIs $100k-200k)
Taxable individual retirement arrangement distribution: $15,481 (reported on 11.7% of returns)
92536:
$15,481
California:
$19,557
(% of AGI for various income ranges: 4.9% for AGIs below $25k, 4.4% for AGIs $25k-50k, 6.7% for AGIs $50k-75k, 3.0% for AGIs $100k-200k)
Total itemized deductions: $22,639 (32% of AGI, reported on 39.4% of returns)
Here:
$22,639
State:
$34,004
Here:
31.7% of AGI
State:
22.7% of AGI
(% of AGI for various income ranges: 22.3% for AGIs below $25k, 17.9% for AGIs $25k-50k, 17.1% for AGIs $50k-75k, 17.7% for AGIs $75k-100k, 17.7% for AGIs $100k-200k)
Charity contributions: $2,512 (reported on 29.2% of returns)
Here:
$2,512
State:
$4,659
(% of AGI for various income ranges: 1.2% for AGIs below $25k, 1.1% for AGIs $25k-50k, 1.7% for AGIs $50k-75k, 1.7% for AGIs $75k-100k, 1.5% for AGIs $100k-200k)
Taxes paid: $5,993 (reported on 39.4% of returns)
92536:
$5,993
State:
$14,448
(% of AGI for various income ranges: 4.1% for AGIs below $25k, 3.6% for AGIs $25k-50k, 3.5% for AGIs $50k-75k, 5.1% for AGIs $75k-100k, 6.1% for AGIs $100k-200k)
Earned income credit: $1,979 (reported on 17.5% of returns)
Here:
$1,979
State:
$2,286
(% of AGI for various income ranges: 5.0% for AGIs below $25k, 1.1% for AGIs $25k-50k)
Percentage of individuals using paid preparers for their 2012 taxes: 63.5%
Here:
64%
State:
64%
(% for various income ranges: 58.2% for AGIs below $25k, 61.8% for AGIs $25k-50k, 66.7% for AGIs $50k-75k, 69.2% for AGIs $75k-100k, 78.6% for AGIs $100k-200k)
Averages for the 2004 tax year for zip code 92536, filed in 2005:
Average Adjusted Gross Income (AGI) in 2004: $41,684 (Individual Income Tax Returns)
Here:
$41,684
State:
$58,600
Salary/wage: $38,418 (reported on 74.4% of returns)
Here:
$38,418
State:
$49,455
(% of AGI for various income ranges: 156.1% for AGIs below $10k, 60.6% for AGIs $10k-25k, 73.2% for AGIs $25k-50k, 77.8% for AGIs $50k-75k, 79.0% for AGIs $75k-100k, 49.2% for AGIs over 100k)
Taxable interest for individuals: $1,842 (reported on 45.8% of returns)
This zip code:
$1,842
California:
$2,365
(% of AGI for various income ranges: 18.7% for AGIs below $10k, 3.0% for AGIs $10k-25k, 2.2% for AGIs $25k-50k, 1.0% for AGIs $50k-75k, 0.5% for AGIs $75k-100k, 2.9% for AGIs over 100k)
Taxable dividends: $1,905 (reported on 16.6% of returns)
Here:
$1,905
State:
$4,746
(% of AGI for various income ranges: 7.3% for AGIs below $10k, 1.9% for AGIs $10k-25k, 0.3% for AGIs $25k-50k, 0.5% for AGIs $50k-75k, 0.2% for AGIs $75k-100k, 1.1% for AGIs over 100k)
Net capital gain/loss: +$16,083 (reported on 17.0% of returns)
Here:
+$16,083
State:
+$23,418
(% of AGI for various income ranges: -11.8% for AGIs below $10k, 0.6% for AGIs $10k-25k, 0.9% for AGIs $25k-50k, 1.5% for AGIs $50k-75k, 5.8% for AGIs $75k-100k, 19.8% for AGIs over 100k)
Profit/loss from business: +$11,257 (reported on 22.9% of returns)
Here:
+$11,257
State:
+$16,826
(% of AGI for various income ranges: 51.4% for AGIs below $10k, 12.8% for AGIs $10k-25k, 7.6% for AGIs $25k-50k, 3.7% for AGIs $50k-75k, 2.6% for AGIs $75k-100k, 5.4% for AGIs over 100k)
IRA payment deduction: $3,296 (reported on 2.1% of returns)
92536:
$3,296
California:
$3,192
Total itemized deductions: $19,726 (31% of AGI, reported on 42.6% of returns)
Here:
$19,726
State:
$28,113
Here:
30.8% of AGI
State:
25.3% of AGI
(% of AGI for various income ranges: 55.9% for AGIs below $10k, 18.8% for AGIs $10k-25k, 19.4% for AGIs $25k-50k, 21.3% for AGIs $50k-75k, 21.8% for AGIs $75k-100k, 18.0% for AGIs over 100k)
Charity contributions deductions: $2,624 (4% of AGI, reported on 35.3% of returns)
Here:
$2,624
State:
$3,923
Here:
3.9% of AGI
State:
3.3% of AGI
(% of AGI for various income ranges: 2.4% for AGIs below $10k, 1.3% for AGIs $10k-25k, 2.0% for AGIs $25k-50k, 2.1% for AGIs $50k-75k, 2.0% for AGIs $75k-100k, 3.0% for AGIs over 100k)
Total tax: $5,281 (reported on 76.1% of returns)
92536:
$5,281
State:
$10,761
(% of AGI for various income ranges: 12.0% for AGIs below $10k, 4.9% for AGIs $10k-25k, 7.0% for AGIs $25k-50k, 8.2% for AGIs $50k-75k, 9.3% for AGIs $75k-100k, 15.4% for AGIs over 100k)
Earned income credit: $1,650 (reported on 14.4% of returns)
Here:
$1,650
State:
$1,763
Percentage of individuals using paid preparers for their 2004 taxes: 67.3%
Here:
67%
State:
66%
(% for various income ranges: 58.7% for AGIs below $10k, 65.3% for AGIs $10k-25k, 65.6% for AGIs $25k-50k, 69.7% for AGIs $50k-75k, 79.0% for AGIs $75k-100k, 83.7% for AGIs over 100k)
Likely homosexual households (counted as self-reported same-sex unmarried-partner households)
Lesbian couples: 1.3% of all households
Gay men: 0.0% of all households
Household received Food Stamps/SNAP in the past 12 months: 162 Household did not receive Food Stamps/SNAP in the past 12 months: 901
Women who did not have a birth in the past 12 months: 318 (203 now married, 112 unmarried)
Housing units in zip code 92536 with a mortgage: 429 (24 second mortgage, 15 both second mortgage and home equity loan) Median monthly owner costs for units with a mortgage: $2,053 Median monthly owner costs for units without a mortgage: $770
Residents with income below the poverty level in 2022:
This zip code:
14.5%
Whole state:
12.2%
Residents with income below 50% of the poverty level in 2022:
This zip code:
10.8%
Whole state:
6.2%
Median number of rooms in houses and condos:
Here:
5.6
State:
6.0
Median number of rooms in apartments:
Here:
4.7
State:
3.9
Notable locations in this zip code not listed on our city pages
Notable locations in zip code 92536: Vail Lake Boat Launch (A), Dry Ranch (B), Rincon Mesa Campground (C), Rancho California Lake Club (D), Palomar Mesa Campground (E), Ormsby Campground (F), Crossbar Oaks Campground (G), Butterfield County Recreational Vehicle Park (H), Riverside County Fire Department Station 77 - Lake Riverside (I), Riverside County Fire Department Station 52 Cottonwood (J). Display/hide their locations on the map
Creeks: Cottonwood Creek (A), Arroyo Seco Creek (B), Spring Creek (C), Tule Creek (D), Cahuilla Creek (E), Wilson Creek (F), Kolb Creek (G). Display/hide their locations on the map
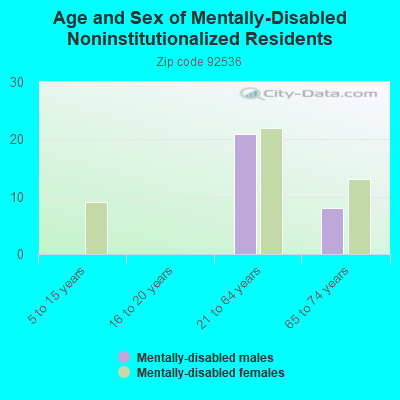
In group quarters: 27 (-1 institutionalized population)
Size of family households: 378 2-persons, 167 3-persons, 129 4-persons, 37 5-persons, 32 6-persons
Size of nonfamily households: 300 1-person, 12 2-persons
310 married couples with children.
113 single-parent households (14 men, 99 women).
86.6% of residents of 92536 zip code speak English at home.
3.8% of residents speak Spanish at home (100% very well).
5.1% of residents speak other Indo-European language at home (100% very well).
0.4% of residents speak Asian or Pacific Island language at home (100% very well).
4.4% of residents speak other language at home (88% very well, 12% well).
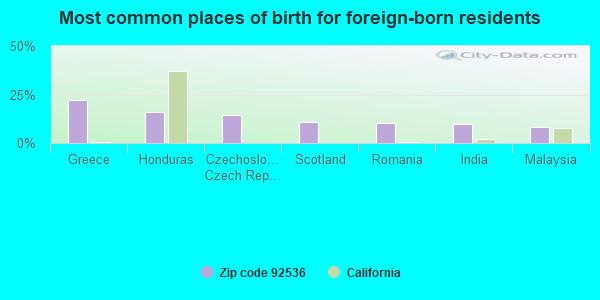
Foreign born population: 252 (9.9%) (69.4% of them are naturalized citizens)
This zip code:
9.9%
Whole state:
26.7%
22%Greece
16%Honduras
14%Czechoslovakia (includes Czech Republic and Slovakia)
11%Scotland
10%Romania
10%India
8%Malaysia
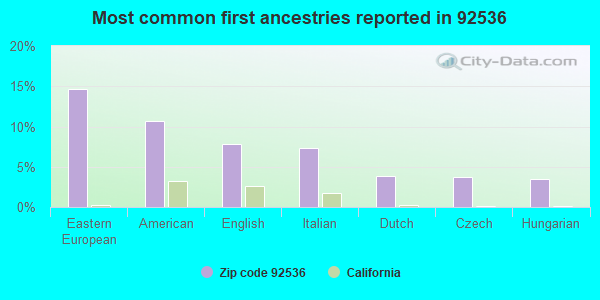
15%Eastern European
11%American
8%English
7%Italian
4%Dutch
4%Czech
3%Hungarian
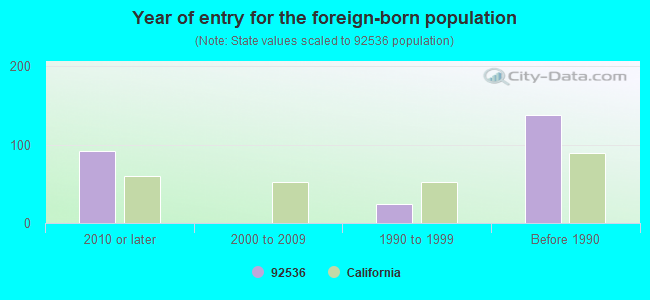
Year of entry for the foreign-born population
922010 or later
02000 to 2009
241990 to 1999
138Before 1990
Facilities with environmental interests located in this zip code:
JAMES MURPHY (38450 HIGHWAY 79 SOUTH in AGUANGA, CA)
TRANSPORTER (Resource Conservation and Recovery Act (tracking hazardous waste)) - notification Organizations: DON SNYDER (CONTACT/OWNER)
C L PHARRIS GROUP (41751 HWY 79 in AGUANGA, CA)
Small Quantity Generators, between 100 kg and 1000 kg of hazardous waste/month (Resource Conservation and Recovery Act (tracking hazardous waste))
Housing units lacking complete plumbing facilities: 8.9% Housing units lacking complete kitchen facilities: 9.6%
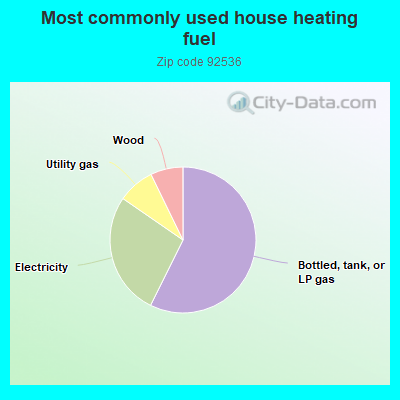
57.4%Bottled, tank, or LP gas
27.3%Electricity
8.2%Utility gas
7.2%Wood
Population in 1990: 2,309. Population change in the 1990s: +116 (+5.0%).
Place of birth for U.S.-born residents:
This state: 1,496
Northeast: 123
Midwest: 253
South: 200
West: 201
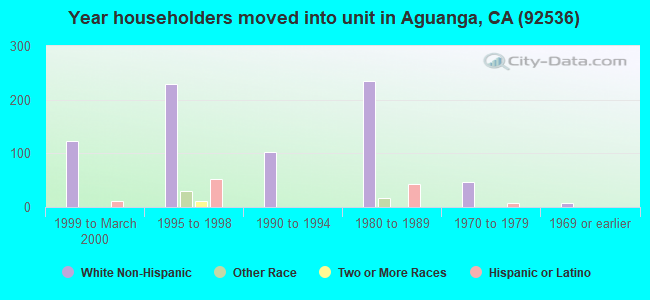
41% of the 92536 zip code residents lived in the same house 5 years ago. Out of people who lived in different houses, 67% lived in this county. Out of people who lived in different counties, 50% lived in California.
84% of the 92536 zip code residents lived in the same house 1 year ago. Out of people who lived in different houses, 46% moved from this county. Out of people who lived in different houses, 52% moved from different county within same state.
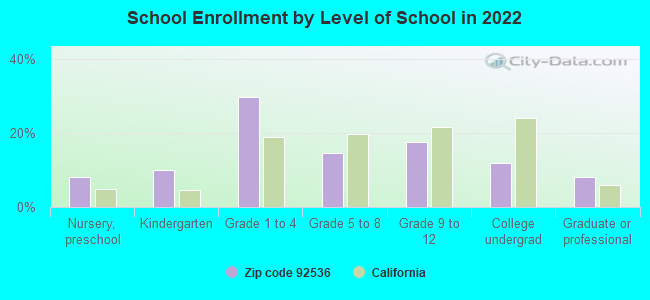
Private vs. public school enrollment:
Students in private schools in grades 1 to 8 (elementary and middle school):
Here:
0.0%
California:
10.5%
Students in private schools in grades 9 to 12 (high school):
Here:
0.0%
California:
8.5%
Students in private undergraduate colleges: 27
Here:
47.2%
California:
15.9%
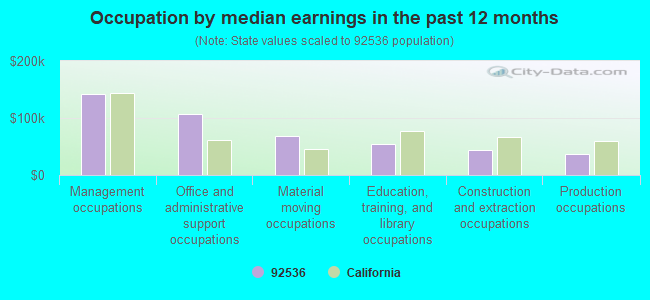
Occupation by median earnings in the past 12 months ($)
142,917Management occupations
107,519Office and administrative support occupations
69,132Material moving occupations
54,216Education, training, and library occupations
44,338Construction and extraction occupations
36,621Production occupations
Top industries in this zip code by the number of employees in 2005:
Other Services (except Public Administration): Other Similar Organizations (except Business, Professional, Labor, and Political Organizations) (20-49 employees: 1 establishment)
Real Estate and Rental and Leasing: Offices of Real Estate Agents and Brokers (20-49: 1)
Accommodation and Food Services: RV (Recreational Vehicle) Parks and Campgrounds (10-19: 2)
Accommodation and Food Services: Full-Service Restaurants (10-19: 1, 1-4: 2)
Construction: Site Preparation Contractors (5-9: 2)
Accommodation and Food Services: Caterers (5-9: 1)
Real Estate and Rental and Leasing: Residential Property Managers (5-9: 1)
Professional, Scientific, and Technical Services: Other Accounting Services (5-9: 1)
Construction: New Single-Family Housing Construction (except Operative Builders) (1-4: 3)
Construction: All Other Specialty Trade Contractors (1-4: 2)
People in group quarters in 2010:
17 people in residential treatment centers for adults
Fatal accident statistics in 2014:
Fatal accident count: 2
Vehicles involved in fatal accidents: 3
Fatal accidents caused by drunken drivers: 1
Fatalities: 2
Persons involved in fatal accidents: 3
Pedestrians involved in fatal accidents: 0
Fatal accident statistics in 2013:
Fatal accident count: 1
Vehicles involved in fatal accidents: 1
Fatal accidents caused by drunken drivers: 0
Fatalities: 1
Persons involved in fatal accidents: 1
Pedestrians involved in fatal accidents: 0
Home Mortgage Disclosure Act Aggregated Statistics For Year 2009 (Based on 6 partial tracts)
A) FHA, FSA/RHS & VA Home Purchase Loans
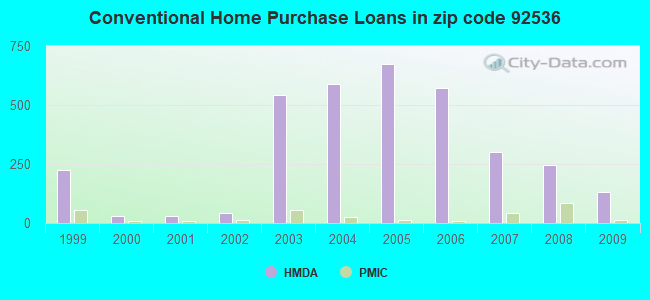
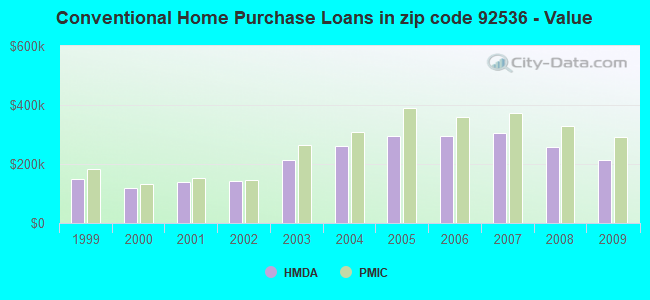
B) Conventional Home Purchase Loans
C) Refinancings
D) Home Improvement Loans
F) Non-occupant Loans on < 5 Family Dwellings (A B C & D)
G) Loans On Manufactured Home Dwelling (A B C & D)
Number
Average Value
Number
Average Value
Number
Average Value
Number
Average Value
Number
Average Value
Number
Average Value
LOANS ORIGINATED
249
$270,279
130
$214,510
220
$253,042
14
$72,775
54
$193,694
21
$189,641
APPLICATIONS APPROVED, NOT ACCEPTED
24
$296,270
26
$234,470
26
$268,105
2
$64,940
12
$208,962
3
$176,643
APPLICATIONS DENIED
38
$250,011
30
$239,752
115
$260,668
12
$76,459
25
$209,712
12
$163,048
APPLICATIONS WITHDRAWN
36
$278,380
22
$243,349
79
$267,948
4
$116,855
11
$239,245
9
$187,807
FILES CLOSED FOR INCOMPLETENESS
7
$270,773
4
$175,868
17
$242,370
0
$0
2
$196,910
1
$222,450
Aggregated Statistics For Year 2008 (Based on 6 partial tracts)
A) FHA, FSA/RHS & VA Home Purchase Loans
B) Conventional Home Purchase Loans
C) Refinancings
D) Home Improvement Loans
F) Non-occupant Loans on < 5 Family Dwellings (A B C & D)
G) Loans On Manufactured Home Dwelling (A B C & D)
Number
Average Value
Number
Average Value
Number
Average Value
Number
Average Value
Number
Average Value
Number
Average Value
LOANS ORIGINATED
174
$303,668
244
$259,185
131
$267,183
15
$114,796
59
$218,169
22
$190,615
APPLICATIONS APPROVED, NOT ACCEPTED
19
$304,740
52
$274,079
42
$294,323
5
$119,414
9
$250,172
8
$186,405
APPLICATIONS DENIED
45
$308,795
80
$280,344
170
$313,301
31
$126,755
30
$239,795
16
$212,284
APPLICATIONS WITHDRAWN
29
$290,772
49
$258,348
65
$297,703
6
$188,292
17
$244,644
6
$178,113
FILES CLOSED FOR INCOMPLETENESS
4
$313,462
12
$287,480
14
$302,827
5
$108,578
3
$207,927
3
$114,937
Aggregated Statistics For Year 2007 (Based on 6 partial tracts)
A) FHA, FSA/RHS & VA Home Purchase Loans
B) Conventional Home Purchase Loans
C) Refinancings
D) Home Improvement Loans
F) Non-occupant Loans on < 5 Family Dwellings (A B C & D)
G) Loans On Manufactured Home Dwelling (A B C & D)
Number
Average Value
Number
Average Value
Number
Average Value
Number
Average Value
Number
Average Value
Number
Average Value
LOANS ORIGINATED
14
$350,581
301
$304,900
451
$308,340
55
$190,403
61
$321,316
50
$210,282
APPLICATIONS APPROVED, NOT ACCEPTED
3
$237,427
82
$314,667
133
$331,489
20
$124,924
19
$288,891
11
$228,934
APPLICATIONS DENIED
3
$275,547
121
$341,283
439
$347,725
69
$179,068
45
$329,215
43
$224,847
APPLICATIONS WITHDRAWN
1
$456,750
51
$331,840
170
$338,577
17
$212,406
15
$374,437
7
$194,133
FILES CLOSED FOR INCOMPLETENESS
0
$0
16
$306,664
55
$373,172
6
$224,380
6
$430,648
4
$238,842
Aggregated Statistics For Year 2006 (Based on 6 partial tracts)
A) FHA, FSA/RHS & VA Home Purchase Loans
B) Conventional Home Purchase Loans
C) Refinancings
D) Home Improvement Loans
F) Non-occupant Loans on < 5 Family Dwellings (A B C & D)
G) Loans On Manufactured Home Dwelling (A B C & D)
Number
Average Value
Number
Average Value
Number
Average Value
Number
Average Value
Number
Average Value
Number
Average Value
LOANS ORIGINATED
12
$326,874
574
$296,441
764
$307,595
90
$179,309
101
$300,464
60
$214,311
APPLICATIONS APPROVED, NOT ACCEPTED
1
$305,230
133
$300,332
168
$312,089
20
$157,124
29
$328,003
9
$202,371
APPLICATIONS DENIED
2
$357,330
194
$311,234
469
$327,508
80
$150,349
43
$315,237
40
$210,983
APPLICATIONS WITHDRAWN
2
$249,355
103
$333,259
281
$340,274
21
$226,309
25
$344,786
12
$207,382
FILES CLOSED FOR INCOMPLETENESS
0
$0
31
$278,432
76
$338,276
5
$175,556
4
$291,565
4
$233,410
Aggregated Statistics For Year 2005 (Based on 6 partial tracts)
A) FHA, FSA/RHS & VA Home Purchase Loans
B) Conventional Home Purchase Loans
C) Refinancings
D) Home Improvement Loans
F) Non-occupant Loans on < 5 Family Dwellings (A B C & D)
G) Loans On Manufactured Home Dwelling (A B C & D)
Number
Average Value
Number
Average Value
Number
Average Value
Number
Average Value
Number
Average Value
Number
Average Value
LOANS ORIGINATED
8
$252,399
674
$293,704
847
$309,251
117
$186,367
103
$302,952
74
$192,025
APPLICATIONS APPROVED, NOT ACCEPTED
0
$0
140
$292,949
144
$313,445
19
$173,439
18
$298,131
14
$135,986
APPLICATIONS DENIED
3
$284,040
191
$296,766
391
$310,494
81
$135,266
36
$303,338
46
$183,754
APPLICATIONS WITHDRAWN
1
$306,560
173
$295,667
317
$303,747
39
$206,546
30
$258,396
28
$191,067
FILES CLOSED FOR INCOMPLETENESS
1
$214,920
41
$327,684
119
$328,684
6
$192,350
9
$234,588
8
$165,334
Aggregated Statistics For Year 2004 (Based on 6 partial tracts)
A) FHA, FSA/RHS & VA Home Purchase Loans
B) Conventional Home Purchase Loans
C) Refinancings
D) Home Improvement Loans
F) Non-occupant Loans on < 5 Family Dwellings (A B C & D)
G) Loans On Manufactured Home Dwelling (A B C & D)
Number
Average Value
Number
Average Value
Number
Average Value
Number
Average Value
Number
Average Value
Number
Average Value
LOANS ORIGINATED
11
$198,586
590
$262,087
930
$259,004
87
$170,295
104
$250,653
63
$164,866
APPLICATIONS APPROVED, NOT ACCEPTED
1
$174,440
115
$258,913
178
$256,623
17
$136,274
17
$222,525
20
$147,338
APPLICATIONS DENIED
2
$226,230
138
$271,832
328
$245,819
64
$109,369
34
$240,034
38
$144,853
APPLICATIONS WITHDRAWN
1
$239,700
95
$261,193
294
$257,688
33
$144,719
14
$223,428
15
$172,189
FILES CLOSED FOR INCOMPLETENESS
0
$0
29
$234,345
73
$263,888
5
$71,860
6
$177,150
4
$166,175
Aggregated Statistics For Year 2003 (Based on 6 partial tracts)
A) FHA, FSA/RHS & VA Home Purchase Loans
B) Conventional Home Purchase Loans
C) Refinancings
D) Home Improvement Loans
E) Loans on Dwellings For 5+ Families
F) Non-occupant Loans on < 5 Family Dwellings (A B C & D)
Number
Average Value
Number
Average Value
Number
Average Value
Number
Average Value
Number
Average Value
Number
Average Value
LOANS ORIGINATED
22
$194,448
541
$214,109
1,279
$199,575
40
$87,915
0
$0
87
$179,871
APPLICATIONS APPROVED, NOT ACCEPTED
1
$262,900
99
$199,999
200
$207,676
12
$46,268
0
$0
13
$173,923
APPLICATIONS DENIED
3
$206,100
84
$208,612
361
$194,856
35
$62,358
1
$12,327,980
17
$174,684
APPLICATIONS WITHDRAWN
5
$180,798
82
$221,563
361
$201,882
10
$67,648
0
$0
11
$201,472
FILES CLOSED FOR INCOMPLETENESS
0
$0
14
$237,556
59
$209,803
7
$55,659
0
$0
3
$198,920
Aggregated Statistics For Year 2002 (Based on 4 partial tracts)
A) FHA, FSA/RHS & VA Home Purchase Loans
B) Conventional Home Purchase Loans
C) Refinancings
D) Home Improvement Loans
F) Non-occupant Loans on < 5 Family Dwellings (A B C & D)
Number
Average Value
Number
Average Value
Number
Average Value
Number
Average Value
Number
Average Value
LOANS ORIGINATED
9
$133,536
41
$142,166
90
$140,924
4
$51,842
13
$121,015
APPLICATIONS APPROVED, NOT ACCEPTED
0
$0
6
$140,017
19
$137,642
2
$42,860
2
$100,655
APPLICATIONS DENIED
0
$0
13
$118,112
52
$132,691
3
$52,073
4
$125,722
APPLICATIONS WITHDRAWN
2
$94,495
5
$146,136
22
$145,906
2
$44,700
2
$102,750
FILES CLOSED FOR INCOMPLETENESS
0
$0
3
$116,160
13
$143,908
0
$0
1
$242,100
Aggregated Statistics For Year 2001 (Based on 4 partial tracts)
A) FHA, FSA/RHS & VA Home Purchase Loans
B) Conventional Home Purchase Loans
C) Refinancings
D) Home Improvement Loans
F) Non-occupant Loans on < 5 Family Dwellings (A B C & D)
Number
Average Value
Number
Average Value
Number
Average Value
Number
Average Value
Number
Average Value
LOANS ORIGINATED
10
$117,681
29
$139,606
63
$129,754
5
$32,012
8
$158,652
APPLICATIONS APPROVED, NOT ACCEPTED
1
$130,260
7
$140,114
15
$165,759
3
$36,923
1
$129,810
APPLICATIONS DENIED
1
$151,040
13
$130,292
37
$131,946
4
$36,235
3
$128,777
APPLICATIONS WITHDRAWN
1
$112,330
8
$159,639
20
$124,066
2
$43,955
3
$91,267
FILES CLOSED FOR INCOMPLETENESS
0
$0
1
$227,670
8
$123,126
1
$29,170
1
$136,340
Aggregated Statistics For Year 2000 (Based on 4 partial tracts)
A) FHA, FSA/RHS & VA Home Purchase Loans
B) Conventional Home Purchase Loans
C) Refinancings
D) Home Improvement Loans
F) Non-occupant Loans on < 5 Family Dwellings (A B C & D)
Number
Average Value
Number
Average Value
Number
Average Value
Number
Average Value
Number
Average Value
LOANS ORIGINATED
12
$98,678
30
$117,240
22
$103,899
5
$19,856
3
$159,103
APPLICATIONS APPROVED, NOT ACCEPTED
1
$141,150
7
$113,636
9
$119,442
2
$38,355
0
$0
APPLICATIONS DENIED
1
$59,680
13
$131,465
30
$99,654
6
$34,320
3
$173,040
APPLICATIONS WITHDRAWN
2
$102,905
7
$94,519
11
$91,069
1
$39,150
0
$0
FILES CLOSED FOR INCOMPLETENESS
0
$0
1
$67,630
5
$99,264
0
$0
0
$0
Aggregated Statistics For Year 1999 (Based on 3 partial tracts)
A) FHA, FSA/RHS & VA Home Purchase Loans
B) Conventional Home Purchase Loans
C) Refinancings
D) Home Improvement Loans
E) Loans on Dwellings For 5+ Families
F) Non-occupant Loans on < 5 Family Dwellings (A B C & D)
2005 - 2018 National Fire Incident Reporting System (NFIRS) incidents
Based on the data from the years 2005 - 2018 the average number of fires per year is 14. The highest number of fires - 30 took place in 2009, and the least - 1 in 2005. The data has a growing trend.
When looking into fire subcategories, the most incidents belonged to: Outside Fires (53.8%), and Structure Fires (21.6%).
Fire incident types reported to NFIRS in Zip Code 92536


 Nearest zip codes: 92060, 92544, 92539, 92592, 92061, 92543.


 Based on the data from the years 2005 - 2018 the average number of fires per year is 14. The highest number of fires - 30 took place in 2009, and the least - 1 in 2005. The data has a growing trend.
 When looking into fire subcategories, the most incidents belonged to: Outside Fires (53.8%), and Structure Fires (21.6%).