Estimated zip code population in 2022: 38,084 Zip code population in 2010: 33,555 Zip code population in 2000: 29,674
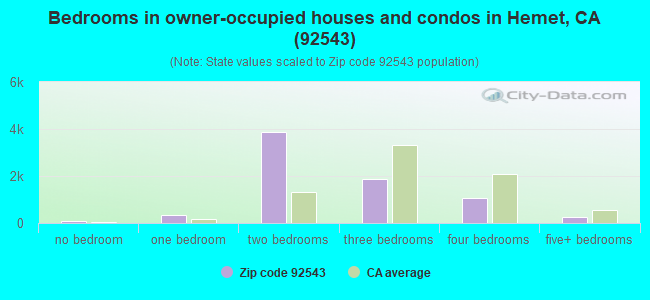
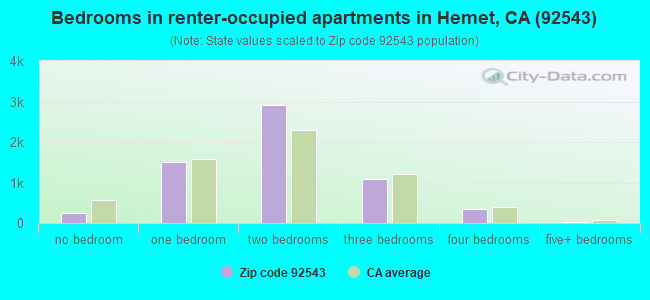
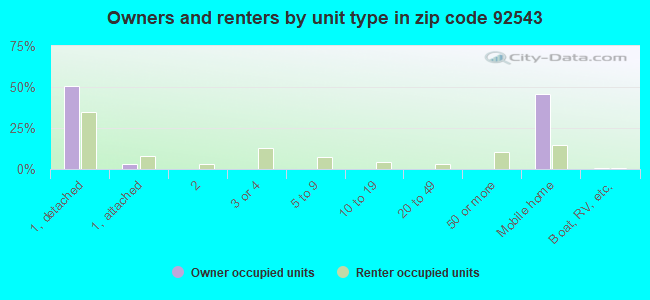
Houses and condos: 14,888 Renter-occupied apartments: 6,161
% of renters here:
45%
State:
44%
March 2022 cost of living index in zip code 92543: 81.1 (low, U.S. average is 100)
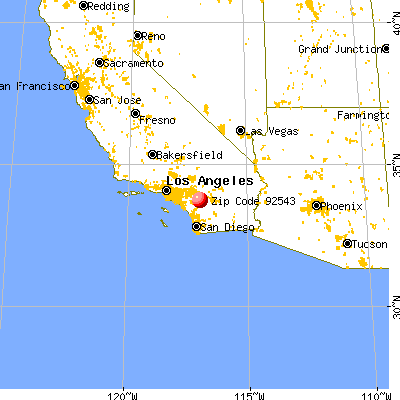
Land area: 17.7 sq. mi. Water area: 0.0 sq. mi.
Population density: 2,156 people per square mile
(low).
OSM Map
General Map
Google Map
MSN Map
OSM Map
General Map
Google Map
MSN Map
OSM Map
General Map
Google Map
MSN Map
OSM Map
General Map
Google Map
MSN Map
Please wait while loading the map...
Real estate property taxes paid for housing units in 2022:
This zip code:
0.7% ($1,507)
California:
0.7% ($4,831)
Median real estate property taxes paid for housing units with mortgages in 2022: $2,133 (0.7%) Median real estate property taxes paid for housing units with no mortgage in 2022: $750 (1.1%)
Averages for the 2020 tax year for zip code 92543, filed in 2021:
Average Adjusted Gross Income (AGI) in 2020: $36,883 (Individual Income Tax Returns)
Here:
$36,883
State:
$95,910
Salary/wage: $34,400 (reported on 80.1% of returns)
Here:
$34,400
State:
$77,331
(% of AGI for various income ranges: 1104.1% for AGIs below $25k, 3606.4% for AGIs $25k-50k, 7047.0% for AGIs $50k-75k, 9920.9% for AGIs $75k-100k, 15884.3% for AGIs $100k-200k)
Taxable interest for individuals: $633 (reported on 17.4% of returns)
This zip code:
$633
California:
$2,294
(% of AGI for various income ranges: 6.3% for AGIs below $25k, 4.5% for AGIs $25k-50k, 20.8% for AGIs $50k-75k, 29.1% for AGIs $75k-100k, 45.4% for AGIs $100k-200k)
Ordinary dividends: $3,749 (reported on 4.5% of returns)
Here:
$3,749
State:
$10,949
(% of AGI for various income ranges: 7.7% for AGIs below $25k, 8.9% for AGIs $25k-50k, 15.9% for AGIs $50k-75k, 59.5% for AGIs $75k-100k, 130.3% for AGIs $100k-200k)
Net capital gain/loss in AGI: +$9,358 (reported on 5.1% of returns)
Here:
+$9,358
State:
+$49,306
(% of AGI for various income ranges: 1.7% for AGIs below $25k, 11.9% for AGIs $25k-50k, 29.7% for AGIs $50k-75k, 94.7% for AGIs $75k-100k, 595.1% for AGIs $100k-200k)
Profit/loss from business: +$7,972 (reported on 14.6% of returns)
Here:
+$7,972
State:
+$15,671
(% of AGI for various income ranges: 152.0% for AGIs below $25k, 95.4% for AGIs $25k-50k, 139.4% for AGIs $50k-75k, 185.1% for AGIs $75k-100k, 405.7% for AGIs $100k-200k)
Taxable individual retirement arrangement distribution: $13,100 (reported on 3.2% of returns)
92543:
$13,100
California:
$23,505
(% of AGI for various income ranges: 23.6% for AGIs below $25k, 39.7% for AGIs $25k-50k, 64.4% for AGIs $50k-75k, 106.1% for AGIs $75k-100k, 663.7% for AGIs $100k-200k)
Total itemized deductions: $28,397 (reported on 5.8% of returns)
Here:
$28,397
State:
$39,517
(% of AGI for various income ranges: 31.9% for AGIs below $25k, 141.0% for AGIs $25k-50k, 403.3% for AGIs $50k-75k, 812.6% for AGIs $75k-100k, 1788.3% for AGIs $100k-200k)
Charity contributions: $6,297 (reported on 4.5% of returns)
Here:
$6,297
State:
$12,598
(% of AGI for various income ranges: 3.0% for AGIs below $25k, 20.2% for AGIs $25k-50k, 57.7% for AGIs $50k-75k, 137.0% for AGIs $75k-100k, 414.3% for AGIs $100k-200k)
Taxes paid: $6,220 (reported on 5.8% of returns)
92543:
$6,220
State:
$8,807
(% of AGI for various income ranges: 4.7% for AGIs below $25k, 25.0% for AGIs $25k-50k, 85.7% for AGIs $50k-75k, 200.4% for AGIs $75k-100k, 460.9% for AGIs $100k-200k)
Earned income credit: $2,472 (reported on 30.1% of returns)
Here:
$2,472
State:
$2,074
(% of AGI for various income ranges: 143.0% for AGIs below $25k, 104.9% for AGIs $25k-50k, 3.0% for AGIs $50k-75k)
Percentage of individuals using paid preparers for their 2020 taxes: 93.6%
Here:
94%
State:
92%
(% for various income ranges: 92.7% for AGIs below $25k, 94.2% for AGIs $25k-50k, 94.0% for AGIs $50k-75k, 94.0% for AGIs $75k-100k, 96.6% for AGIs $100k-200k, 100.0% for AGIs over 200k)
Averages for the 2012 tax year for zip code 92543, filed in 2013:
Average Adjusted Gross Income (AGI) in 2012: $30,425 (Individual Income Tax Returns)
Here:
$30,425
State:
$72,726
Salary/wage: $27,972 (reported on 76.3% of returns)
Here:
$27,972
State:
$59,079
(% of AGI for various income ranges: 68.1% for AGIs below $25k, 76.6% for AGIs $25k-50k, 72.6% for AGIs $50k-75k, 66.6% for AGIs $75k-100k, 68.8% for AGIs $100k-200k, 45.3% for AGIs over 200k)
Taxable interest for individuals: $934 (reported on 20.5% of returns)
This zip code:
$934
California:
$2,146
(% of AGI for various income ranges: 0.8% for AGIs below $25k, 0.4% for AGIs $25k-50k, 0.4% for AGIs $50k-75k, 0.9% for AGIs $75k-100k, 0.9% for AGIs $100k-200k, 0.3% for AGIs over 200k)
Ordinary dividends: $3,092 (reported on 7.5% of returns)
Here:
$3,092
State:
$9,308
(% of AGI for various income ranges: 0.8% for AGIs below $25k, 0.6% for AGIs $25k-50k, 0.8% for AGIs $50k-75k, 0.8% for AGIs $75k-100k, 1.1% for AGIs $100k-200k)
Net capital gain/loss in AGI: +$1,179 (reported on 6.5% of returns)
Here:
+$1,179
State:
+$30,460
(% of AGI for various income ranges: 0.2% for AGIs $25k-50k, 0.3% for AGIs $50k-75k, 0.8% for AGIs $75k-100k, 0.9% for AGIs $100k-200k)
Profit/loss from business: +$10,019 (reported on 15.4% of returns)
Here:
+$10,019
State:
+$17,064
(% of AGI for various income ranges: 12.2% for AGIs below $25k, 2.5% for AGIs $25k-50k, 1.5% for AGIs $50k-75k, 2.4% for AGIs $75k-100k, 6.9% for AGIs $100k-200k)
Taxable individual retirement arrangement distribution: $10,471 (reported on 7.0% of returns)
92543:
$10,471
California:
$19,557
(% of AGI for various income ranges: 2.1% for AGIs below $25k, 1.8% for AGIs $25k-50k, 2.5% for AGIs $50k-75k, 4.5% for AGIs $75k-100k, 3.7% for AGIs $100k-200k)
Total itemized deductions: $20,247 (31% of AGI, reported on 17.1% of returns)
Here:
$20,247
State:
$34,004
Here:
31.0% of AGI
State:
22.7% of AGI
(% of AGI for various income ranges: 5.8% for AGIs below $25k, 9.6% for AGIs $25k-50k, 13.5% for AGIs $50k-75k, 15.6% for AGIs $75k-100k, 18.1% for AGIs $100k-200k, 17.2% for AGIs over 200k)
Charity contributions: $3,099 (reported on 12.8% of returns)
Here:
$3,099
State:
$4,659
(% of AGI for various income ranges: 0.5% for AGIs below $25k, 1.0% for AGIs $25k-50k, 1.3% for AGIs $50k-75k, 1.9% for AGIs $75k-100k, 2.8% for AGIs $100k-200k, 2.2% for AGIs over 200k)
Taxes paid: $4,979 (reported on 17.0% of returns)
92543:
$4,979
State:
$14,448
(% of AGI for various income ranges: 0.9% for AGIs below $25k, 1.5% for AGIs $25k-50k, 3.0% for AGIs $50k-75k, 4.1% for AGIs $75k-100k, 5.8% for AGIs $100k-200k, 9.0% for AGIs over 200k)
Earned income credit: $2,690 (reported on 37.6% of returns)
Here:
$2,690
State:
$2,286
(% of AGI for various income ranges: 10.9% for AGIs below $25k, 2.0% for AGIs $25k-50k)
Percentage of individuals using paid preparers for their 2012 taxes: 62.4%
Here:
62%
State:
64%
(% for various income ranges: 59.0% for AGIs below $25k, 64.6% for AGIs $25k-50k, 68.0% for AGIs $50k-75k, 72.5% for AGIs $75k-100k, 74.2% for AGIs $100k-200k, 100.0% for AGIs over 200k)
Averages for the 2004 tax year for zip code 92543, filed in 2005:
Average Adjusted Gross Income (AGI) in 2004: $28,779 (Individual Income Tax Returns)
Here:
$28,779
State:
$58,600
Salary/wage: $26,589 (reported on 77.1% of returns)
Here:
$26,589
State:
$49,455
(% of AGI for various income ranges: 76.6% for AGIs below $10k, 71.7% for AGIs $10k-25k, 79.5% for AGIs $25k-50k, 76.7% for AGIs $50k-75k, 72.6% for AGIs $75k-100k, 40.9% for AGIs over 100k)
Taxable interest for individuals: $1,895 (reported on 31.3% of returns)
This zip code:
$1,895
California:
$2,365
(% of AGI for various income ranges: 6.5% for AGIs below $10k, 2.7% for AGIs $10k-25k, 1.7% for AGIs $25k-50k, 1.4% for AGIs $50k-75k, 1.6% for AGIs $75k-100k, 2.1% for AGIs over 100k)
Taxable dividends: $2,279 (reported on 12.9% of returns)
Here:
$2,279
State:
$4,746
(% of AGI for various income ranges: 3.8% for AGIs below $10k, 1.4% for AGIs $10k-25k, 0.8% for AGIs $25k-50k, 0.7% for AGIs $50k-75k, 0.7% for AGIs $75k-100k, 0.9% for AGIs over 100k)
Net capital gain/loss: +$13,310 (reported on 11.7% of returns)
Here:
+$13,310
State:
+$23,418
(% of AGI for various income ranges: -1.6% for AGIs below $10k, 0.3% for AGIs $10k-25k, 0.8% for AGIs $25k-50k, 1.3% for AGIs $50k-75k, 4.5% for AGIs $75k-100k, 32.4% for AGIs over 100k)
Profit/loss from business: +$9,854 (reported on 11.6% of returns)
Here:
+$9,854
State:
+$16,826
(% of AGI for various income ranges: 7.8% for AGIs below $10k, 4.5% for AGIs $10k-25k, 2.1% for AGIs $25k-50k, 2.8% for AGIs $50k-75k, 5.1% for AGIs $75k-100k, 7.5% for AGIs over 100k)
Profit/loss from farming: +$2,727 (reported on 0.1% of returns)
Here:
+$2,727
State:
-$7,562
IRA payment deduction: $2,548 (reported on 1.4% of returns)
92543:
$2,548
California:
$3,192
(% of AGI for various income ranges: 0.1% for AGIs $10k-25k, 0.2% for AGIs $25k-50k, 0.1% for AGIs $50k-75k, 0.2% for AGIs $75k-100k, 0.1% for AGIs over 100k)
Self-employed pension: $16,640 (reported on 0.2% of returns)
Here:
$16,640
California:
$17,688
Total itemized deductions: $17,685 (32% of AGI, reported on 21.6% of returns)
Here:
$17,685
State:
$28,113
Here:
31.8% of AGI
State:
25.3% of AGI
(% of AGI for various income ranges: 9.6% for AGIs below $10k, 8.0% for AGIs $10k-25k, 12.7% for AGIs $25k-50k, 17.4% for AGIs $50k-75k, 19.4% for AGIs $75k-100k, 14.0% for AGIs over 100k)
Charity contributions deductions: $2,518 (4% of AGI, reported on 17.5% of returns)
Here:
$2,518
State:
$3,923
Here:
4.4% of AGI
State:
3.3% of AGI
(% of AGI for various income ranges: 0.5% for AGIs below $10k, 0.8% for AGIs $10k-25k, 1.4% for AGIs $25k-50k, 1.8% for AGIs $50k-75k, 2.5% for AGIs $75k-100k, 2.2% for AGIs over 100k)
Total tax: $3,333 (reported on 62.4% of returns)
92543:
$3,333
State:
$10,761
(% of AGI for various income ranges: 2.4% for AGIs below $10k, 3.2% for AGIs $10k-25k, 5.4% for AGIs $25k-50k, 8.0% for AGIs $50k-75k, 10.4% for AGIs $75k-100k, 16.1% for AGIs over 100k)
Earned income credit: $1,922 (reported on 27.1% of returns)
Here:
$1,922
State:
$1,763
Percentage of individuals using paid preparers for their 2004 taxes: 67.9%
Here:
68%
State:
66%
(% for various income ranges: 62.6% for AGIs below $10k, 69.3% for AGIs $10k-25k, 67.9% for AGIs $25k-50k, 71.4% for AGIs $50k-75k, 71.7% for AGIs $75k-100k, 82.5% for AGIs over 100k)
Likely homosexual households (counted as self-reported same-sex unmarried-partner households)
Lesbian couples: 0.3% of all households
Gay men: 0.0% of all households
Household received Food Stamps/SNAP in the past 12 months: 4,202 Household did not receive Food Stamps/SNAP in the past 12 months: 10,030
Women who had a birth in the past 12 months: 459 (213 now married, 248 unmarried) Women who did not have a birth in the past 12 months: 7,342 (2,816 now married, 4,530 unmarried)
Housing units in zip code 92543 with a mortgage: 3,958 (151 second mortgage, 6 home equity loan, 150 both second mortgage and home equity loan) Houses without a mortgage: 10
Median monthly owner costs for units with a mortgage: $1,490 Median monthly owner costs for units without a mortgage: $472
Residents with income below the poverty level in 2022:
This zip code:
25.9%
Whole state:
12.2%
Residents with income below 50% of the poverty level in 2022:
This zip code:
13.2%
Whole state:
6.2%
Median number of rooms in houses and condos:
Here:
5.1
State:
6.0
Median number of rooms in apartments:
Here:
4.0
State:
3.9
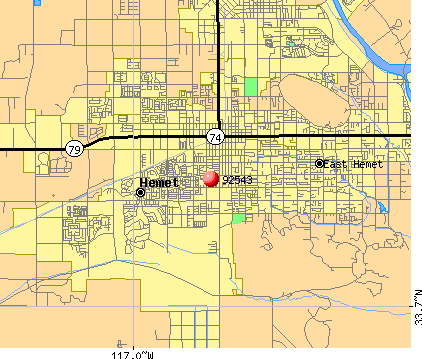
Notable locations in this zip code not listed on our city pages
Notable locations in zip code 92543: Goodhart Ranch (A), Searl Ranch (B), Diamond Valley Golf Range (C), Panorama Golf Course (D), Echo Hills Golf Course (E), Lynch Ambulance (F), American Medical Response Hemet (G), Hemet Civic Center (H), Hemet Chamber of Commerce (I), International Bank Note Society Library (J), Hemet Public Library (K), Simpson Neighborhood Center (L), Hemet Fire Department Station 2 (M), Hemet Fire Department Station 1 (N). Display/hide their locations on the map
Churches in zip code 92543 include: Congregation Beth Hatikoa (A), Calvary Baptist Church (B), Church of Christ (C), First Assembly of God Church (D), First Christian Church (E), Episcopal Church of the Good Shepherd (F), Hemet United Methodist Church (G), Hemet Valley Christian Church (H), Our Lady of the Valley Catholic Church (I). Display/hide their locations on the map
4,256 married couples with children.
3,879 single-parent households (1,234 men, 2,645 women).
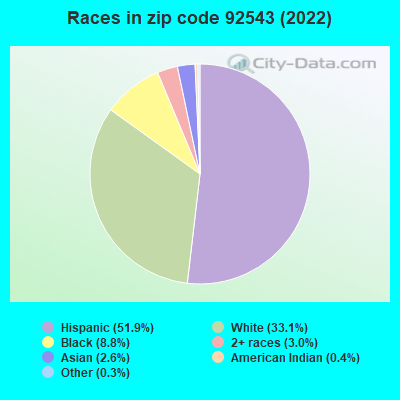
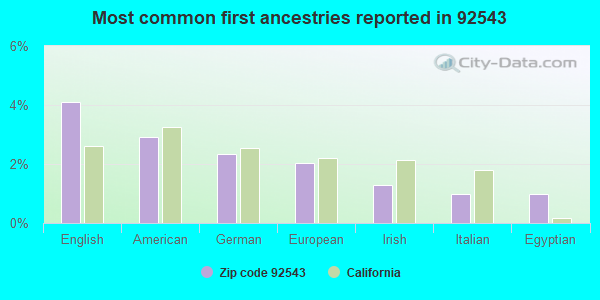
61.0% of residents of 92543 zip code speak English at home.
35.6% of residents speak Spanish at home (64% very well, 19% well, 10% not well, 7% not at all).
0.9% of residents speak other Indo-European language at home (82% very well, 12% well, 7% not well).
1.6% of residents speak Asian or Pacific Island language at home (45% very well, 34% well, 16% not well, 4% not at all).
1.2% of residents speak other language at home (78% very well, 2% well, 20% not at all).
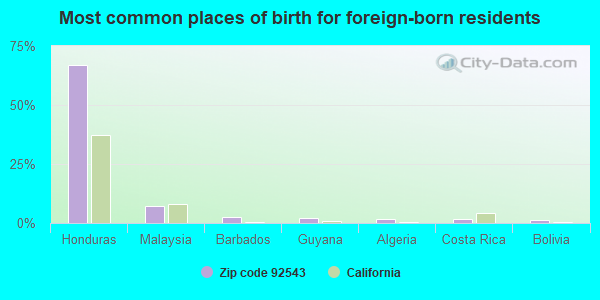
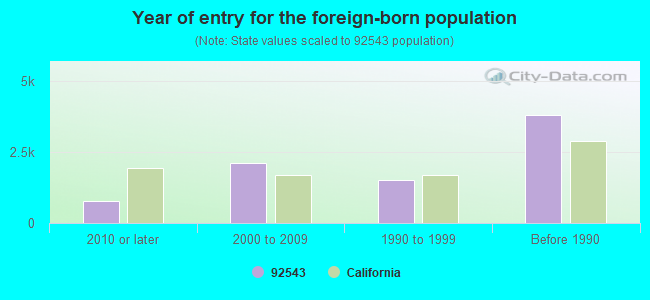
Foreign born population: 7,781 (20.4%) (58.8% of them are naturalized citizens)
Major facilities with environmental interests located in this zip code:
JIM HAMZA CHRYSLER PLYMOUTH (1950 WEST FLORIDA AVE in HEMET, CA)
STATE MASTER (California - Hazardous Waste Tracking) - HAZARDOU WASTE PROGRAM Small Quantity Generators, between 100 kg and 1000 kg of hazardous waste/month (Resource Conservation and Recovery Act (tracking hazardous waste)) - notification Small Quantity Generators, between 100 kg and 1000 kg of hazardous waste/month (Resource Conservation and Recovery Act (tracking hazardous waste)) Organizations: BOBBY SMITH (CONTACT/OWNER)
Alternative names: HEMET CHRYSLER CENTER, JIM HAMZA CHRVS - PLY
ACACIA MIDDLE SCHOOL (1200 EAST ACACIA AVE in HEMET, CA)
(Geographic Names Information System) (National Center for Education Statistics) - STATE ID-6084628 Organizations: HEMET UNIFIED (SCHOOL DISTRICT)
ALS KUBOTA TRACTOR (687 N SAN JACINTO ST in HEMET, CA)
STATE MASTER (California - Hazardous Waste Tracking) - HAZARDOU WASTE PROGRAM Small Quantity Generators, between 100 kg and 1000 kg of hazardous waste/month (Resource Conservation and Recovery Act (tracking hazardous waste)) - notification Organizations: ROGER D GARWOOD (CONTACT/OWNER)
G S A FLEET SVC HEMET (824 N STATE ST in HEMET, CA)
STATE MASTER (California - Hazardous Waste Tracking) - HAZARDOU WASTE PROGRAM Small Quantity Generators, between 100 kg and 1000 kg of hazardous waste/month (Resource Conservation and Recovery Act (tracking hazardous waste)) - notification Organizations: G S A FLEET SVC CO OF RIVERSIDE (CONTACT/OWNER)
Alternative names: CO OF RIVERSIDE FLEET SERVICES-HEMET
JIM MCCOMAS AUTO BODY & PAINT (200 S GILBERT AVE in HEMET, CA)
STATE MASTER (California - Hazardous Waste Tracking) - HAZARDOU WASTE PROGRAM Small Quantity Generators, between 100 kg and 1000 kg of hazardous waste/month (Resource Conservation and Recovery Act (tracking hazardous waste)) Business NAICS classification: AUTOMOTIVE BODY, PAINT, AND INTERIOR REPAIR AND MAINTENANCE.
CHEVRON STATION NO 94279 (1101 S STATE ST in HEMET, CA)
STATE MASTER (California - Hazardous Waste Tracking) - HAZARDOU WASTE PROGRAM Small Quantity Generators, between 100 kg and 1000 kg of hazardous waste/month (Resource Conservation and Recovery Act (tracking hazardous waste)) - notification Organizations: CHEVRON PRODUCTS CO (CONTACT/OWNER)
METROPOLITAN WATER DIST OF STHRN CAL (30380 MCKERNIE ST in HEMET, CA) . Federal Facility
STATE MASTER (California - Hazardous Waste Tracking) - HAZARDOU WASTE PROGRAM HAZARDOUS WASTE BIENNIAL REPORTER (Resource Conservation and Recovery Act (tracking hazardous waste)) Small Quantity Generators, between 100 kg and 1000 kg of hazardous waste/month (Resource Conservation and Recovery Act (tracking hazardous waste)) Alternative names: DOMENIGONI VALLEY RESERVOIR, METROPOLITAN WATER DISTRICT OF SOUTHERN
HEMET ELEMENTARY (633 E. KIMBALL AVE. in HEMET, CA)
(National Center for Education Statistics) - STATE ID-6032106 Organizations: HEMET UNIFIED (SCHOOL DISTRICT)
JACKSON (HELEN HUNT) ALTERNATIVE HIGH (26866 SAN JACINTO ST. in HEMET, CA)
(National Center for Education Statistics) - STATE ID-3330503 Organizations: HEMET UNIFIED (SCHOOL DISTRICT)
AMCAST AEROSPACE PRODUCTS HEMET DIV. (760 WEST ACACIA AVENUE in HEMET, CA)
COMPLIANCE ACTIVITY (Tracking inspections of insecticide, fungicide, and rodenticide, and toxic substances) Small Quantity Generators, between 100 kg and 1000 kg of hazardous waste/month (Resource Conservation and Recovery Act (tracking hazardous waste)) - notification TRI REPORTER (Tracking of toxic chemicals releasing facilities) Business SIC classification: ALUMINUM DIE-CASTINGS; ALUMINUM FOUNDRIES Business NAICS classification: OTHER NONFERROUS FOUNDRIES (EXCEPT DIE-CASTING). Organizations: AMCAST INDUSTRIAL CORP (CONTACT/OWNER)
Alternative names: HEMET CASTING CO, HEMET CASTINGS
NELSON SUBSTATION (LYON AVE. & ESPLANADE AVE. in HEMET, CA)
HAZARDOUS WASTE BIENNIAL REPORTER (Resource Conservation and Recovery Act (tracking hazardous waste)) Large Quantity Generators, more that 1000 kg of hazardous waste/month (Resource Conservation and Recovery Act (tracking hazardous waste)) Business NAICS classification: ELECTRIC POWER DISTRIBUTION.
HEMET HEALTHCARE SURGERY CTR INC (301 N SAN JACINTO ST in HEMET, CA)
Small Quantity Generators, between 100 kg and 1000 kg of hazardous waste/month (Resource Conservation and Recovery Act (tracking hazardous waste)) Business NAICS classification: FREESTANDING AMBULATORY SURGICAL AND EMERGENCY CENTERS. Organizations: KMS STRATEGIC MGMT (CONTACT/OPERATOR)
, WILLIAM BLASE MD (CONTACT/OWNER)
HEMET UNIFIED SCHOOL DIST (2350 W LATHAM in HEMET, CA)
Small Quantity Generators, between 100 kg and 1000 kg of hazardous waste/month (Resource Conservation and Recovery Act (tracking hazardous waste)) - notification Organizations: HEMET UNIFIED SCHOOL DISTRICT (CONTACT/OWNER)
Housing units lacking complete plumbing facilities: 0.9% Housing units lacking complete kitchen facilities: 2.8%
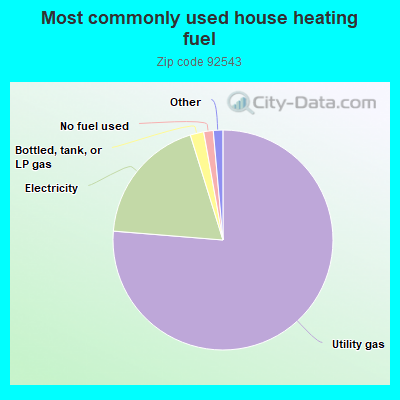
76.3%Utility gas
18.9%Electricity
2.0%Bottled, tank, or LP gas
1.4%No fuel used
0.7%Solar energy
0.6%Wood
Population in 1990: 26,985. Population change in the 1990s: +2,689 (+10.0%).
Place of birth for U.S.-born residents:
This state: 23,324
Northeast: 1,273
Midwest: 1,935
South: 2,149
West: 936
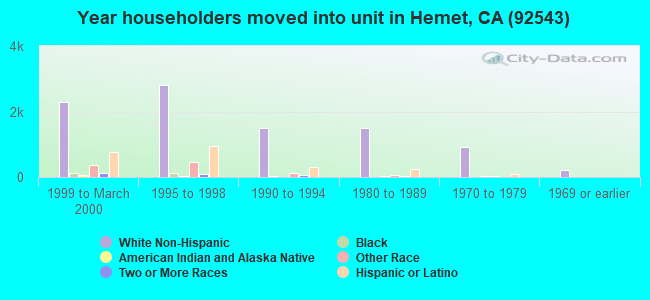
41% of the 92543 zip code residents lived in the same house 5 years ago. Out of people who lived in different houses, 68% lived in this county. Out of people who lived in different counties, 50% lived in California.
87% of the 92543 zip code residents lived in the same house 1 year ago. Out of people who lived in different houses, 61% moved from this county. Out of people who lived in different houses, 28% moved from different county within same state. Out of people who lived in different houses, 6% moved from different state. Out of people who lived in different houses, 3% moved from abroad.
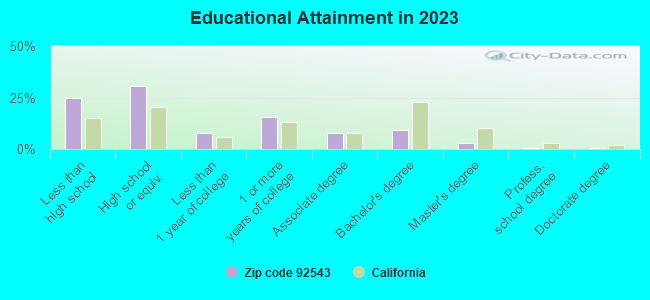
Private vs. public school enrollment:
Students in private schools in grades 1 to 8 (elementary and middle school): 611
Here:
13.7%
California:
10.5%
Students in private schools in grades 9 to 12 (high school):
Here:
0.0%
California:
8.5%
Students in private undergraduate colleges: 115
Here:
9.0%
California:
15.9%
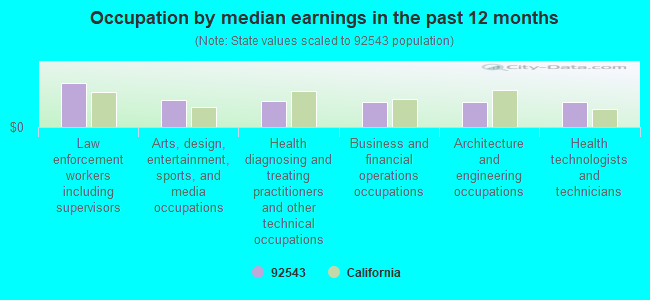
Occupation by median earnings in the past 12 months ($)
116,189Law enforcement workers including supervisors
71,083Arts, design, entertainment, sports, and media occupations
69,427Health diagnosing and treating practitioners and other technical occupations
67,297Business and financial operations occupations
66,633Architecture and engineering occupations
65,313Health technologists and technicians
Companies with federal contracts located in this zip code:
D&B INDUSTRIAL SAFETY SUPPLY L (1000 N STATE STREET S in HEMET, CA; small business) : $1,154,822 in 36 contractsfrom 2000 to 2005
Contracts for Safety and Rescue Equipment, Paints, Dopes, Varnishes, and Related Products, Drums and Cans, Bags and Sacks, and moreby Navy, Drug Enforcement Administration Signed by year:2000: $50,000; 2001: $100,000; 2002: $79,752; 2003: $0; 2004: $483,876; 2005: $441,194; 2006: $0.
Biggest contracts:
$275,044 with Navy for Safety and Rescue Equipment. Signed on 2004-02-06. Completion date: 2004-02-16.
$100,000 with Navy for Paints, Dopes, Varnishes, and Related Products. Signed on 2001-11-15. Completion date: 2002-07-31.
$80,000 with Navy for Drums and Cans. Signed on 2005-09-30. Completion date: 2006-01-31.
$79,752, same as above.Signed on 2002-08-23. Completion date: 2002-07-31.
ROTOCO, INC (796 NORTH STATE ST in HEMET, CA; small business)
$3,570 with Defense Commissary Agency for Waste Treatment and Storage. Signed on 2005-09-01. Completion date: 2003-07-01.
Top industries in this zip code by the number of employees in 2005:
Health Care and Social Assistance: General Medical and Surgical Hospitals (over 1000 employees: 1 establishment)
Health Care and Social Assistance: Offices of Physicians (except Mental Health Specialists) (20-49: 2, 10-19: 7, 5-9: 17, 1-4: 43)
2005 - 2018 National Fire Incident Reporting System (NFIRS) incidents
Based on the data from the years 2005 - 2018 the average number of fire incidents per year is 79. The highest number of fires - 183 took place in 2017, and the least - 1 in 2009. The data has an increasing trend.
When looking into fire subcategories, the most incidents belonged to: Structure Fires (45.6%), and Outside Fires (39.2%).
Fire incident types reported to NFIRS in Zip Code 92543


+$2,727
-$7,562
 Nearest zip codes: 92544, 92596, 92545, 92583, 92582, 92548.


 Based on the data from the years 2005 - 2018 the average number of fire incidents per year is 79. The highest number of fires - 183 took place in 2017, and the least - 1 in 2009. The data has an increasing trend.
 When looking into fire subcategories, the most incidents belonged to: Structure Fires (45.6%), and Outside Fires (39.2%).