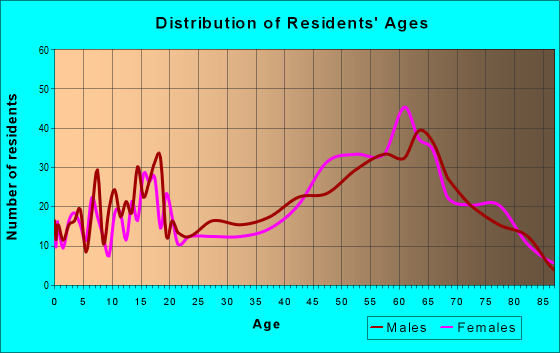
Estimated zip code population in 2022: 3,167 Zip code population in 2010: 3,699 Zip code population in 2000: 3,527
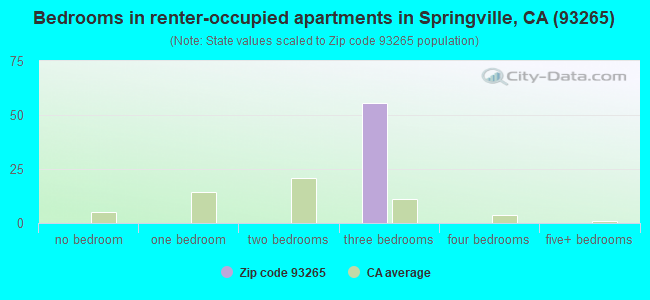
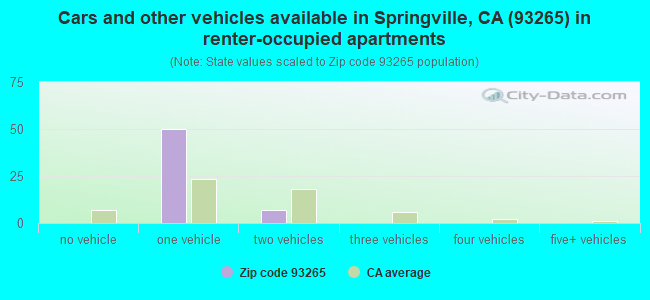
Houses and condos: 1,887 Renter-occupied apartments: 55
% of renters here:
5%
State:
44%
March 2022 cost of living index in zip code 93265: 92.6 (less than average, U.S. average is 100)
Land area: 374.1 sq. mi. Water area: 0.2 sq. mi.
Population density: 8 people per square mile
(very low).
OSM Map
General Map
Google Map
MSN Map
OSM Map
General Map
Google Map
MSN Map
OSM Map
General Map
Google Map
MSN Map
OSM Map
General Map
Google Map
MSN Map
Please wait while loading the map...
Real estate property taxes paid for housing units in 2022:
This zip code:
0.7% ($2,540)
California:
0.7% ($4,831)
Median real estate property taxes paid for housing units with mortgages in 2022: $2,586 (0.7%) Median real estate property taxes paid for housing units with no mortgage in 2022: $2,582 (0.7%)
Averages for the 2020 tax year for zip code 93265, filed in 2021:
Average Adjusted Gross Income (AGI) in 2020: $82,105 (Individual Income Tax Returns)
Here:
$82,105
State:
$95,910
Salary/wage: $71,991 (reported on 65.2% of returns)
Here:
$71,991
State:
$77,331
(% of AGI for various income ranges: 1075.5% for AGIs below $25k, 3533.9% for AGIs $25k-50k, 5790.0% for AGIs $50k-75k, 8723.3% for AGIs $75k-100k, 19557.5% for AGIs $100k-200k, 63190.0% for AGIs over 200k)
Taxable interest for individuals: $1,290 (reported on 49.5% of returns)
This zip code:
$1,290
California:
$2,294
(% of AGI for various income ranges: 52.4% for AGIs below $25k, 46.1% for AGIs $25k-50k, 135.0% for AGIs $50k-75k, 43.3% for AGIs $75k-100k, 305.0% for AGIs $100k-200k, 467.5% for AGIs over 200k)
Ordinary dividends: $6,944 (reported on 21.2% of returns)
Here:
$6,944
State:
$10,949
(% of AGI for various income ranges: 44.5% for AGIs below $25k, 69.1% for AGIs $25k-50k, 166.4% for AGIs $50k-75k, 193.3% for AGIs $75k-100k, 567.5% for AGIs $100k-200k, 2617.5% for AGIs over 200k)
Net capital gain/loss in AGI: +$16,476 (reported on 22.8% of returns)
Here:
+$16,476
State:
+$49,306
(% of AGI for various income ranges: 30.7% for AGIs below $25k, 118.3% for AGIs $25k-50k, 272.1% for AGIs $50k-75k, 240.0% for AGIs $75k-100k, 1154.4% for AGIs $100k-200k, 10107.5% for AGIs over 200k)
Profit/loss from business: +$17,106 (reported on 19.6% of returns)
Here:
+$17,106
State:
+$15,671
(% of AGI for various income ranges: 181.7% for AGIs below $25k, 400.0% for AGIs $25k-50k, 373.6% for AGIs $50k-75k, 650.8% for AGIs $75k-100k, 1150.6% for AGIs $100k-200k, 3915.0% for AGIs over 200k)
Taxable individual retirement arrangement distribution: $17,120 (reported on 10.9% of returns)
93265:
$17,120
California:
$23,505
(% of AGI for various income ranges: 93.1% for AGIs below $25k, 171.3% for AGIs $25k-50k, 352.9% for AGIs $50k-75k, 360.8% for AGIs $75k-100k, 739.4% for AGIs $100k-200k, 1625.0% for AGIs over 200k)
Total itemized deductions: $33,757 (reported on 15.2% of returns)
Here:
$33,757
State:
$39,517
(% of AGI for various income ranges: 324.8% for AGIs $25k-50k, 799.3% for AGIs $50k-75k, 969.2% for AGIs $75k-100k, 2226.9% for AGIs $100k-200k, 7150.0% for AGIs over 200k)
Charity contributions: $10,238 (reported on 13.0% of returns)
Here:
$10,238
State:
$12,598
(% of AGI for various income ranges: 22.1% for AGIs below $25k, 96.4% for AGIs $50k-75k, 146.7% for AGIs $75k-100k, 471.9% for AGIs $100k-200k, 3317.5% for AGIs over 200k)
Taxes paid: $8,254 (reported on 15.2% of returns)
93265:
$8,254
State:
$8,807
(% of AGI for various income ranges: 53.8% for AGIs below $25k, 170.7% for AGIs $50k-75k, 231.7% for AGIs $75k-100k, 630.6% for AGIs $100k-200k, 1572.5% for AGIs over 200k)
Earned income credit: $2,327 (reported on 12.0% of returns)
Here:
$2,327
State:
$2,074
(% of AGI for various income ranges: 111.0% for AGIs below $25k, 82.6% for AGIs $25k-50k)
Percentage of individuals using paid preparers for their 2020 taxes: 88.6%
Here:
89%
State:
92%
(% for various income ranges: 88.0% for AGIs below $25k, 88.9% for AGIs $25k-50k, 92.0% for AGIs $50k-75k, 86.4% for AGIs $75k-100k, 89.5% for AGIs $100k-200k, 84.6% for AGIs over 200k)
Averages for the 2012 tax year for zip code 93265, filed in 2013:
Average Adjusted Gross Income (AGI) in 2012: $72,404 (Individual Income Tax Returns)
Here:
$72,404
State:
$72,726
Salary/wage: $57,340 (reported on 70.6% of returns)
Here:
$57,340
State:
$59,079
(% of AGI for various income ranges: 59.9% for AGIs below $25k, 60.8% for AGIs $25k-50k, 55.3% for AGIs $50k-75k, 62.3% for AGIs $75k-100k, 65.9% for AGIs $100k-200k, 38.8% for AGIs over 200k)
Taxable interest for individuals: $1,720 (reported on 51.2% of returns)
This zip code:
$1,720
California:
$2,146
(% of AGI for various income ranges: 2.6% for AGIs below $25k, 1.4% for AGIs $25k-50k, 2.5% for AGIs $50k-75k, 0.5% for AGIs $75k-100k, 0.8% for AGIs $100k-200k, 1.1% for AGIs over 200k)
Ordinary dividends: $4,120 (reported on 25.0% of returns)
Here:
$4,120
State:
$9,308
(% of AGI for various income ranges: 2.8% for AGIs below $25k, 2.0% for AGIs $25k-50k, 1.7% for AGIs $50k-75k, 1.0% for AGIs $75k-100k, 1.1% for AGIs $100k-200k, 1.4% for AGIs over 200k)
Net capital gain/loss in AGI: +$32,950 (reported on 21.2% of returns)
Here:
+$32,950
State:
+$30,460
(% of AGI for various income ranges: 1.2% for AGIs $100k-200k, 35.4% for AGIs over 200k)
Profit/loss from business: +$13,997 (reported on 22.5% of returns)
Here:
+$13,997
State:
+$17,064
(% of AGI for various income ranges: 14.7% for AGIs below $25k, 3.8% for AGIs $25k-50k, 6.0% for AGIs $50k-75k, 2.6% for AGIs $75k-100k, 3.3% for AGIs $100k-200k, 3.8% for AGIs over 200k)
Taxable individual retirement arrangement distribution: $15,859 (reported on 13.8% of returns)
93265:
$15,859
California:
$19,557
(% of AGI for various income ranges: 4.0% for AGIs below $25k, 4.5% for AGIs $25k-50k, 3.8% for AGIs $50k-75k, 3.7% for AGIs $75k-100k, 4.3% for AGIs $100k-200k)
Total itemized deductions: $26,697 (23% of AGI, reported on 46.2% of returns)
Here:
$26,697
State:
$34,004
Here:
22.5% of AGI
State:
22.7% of AGI
(% of AGI for various income ranges: 18.9% for AGIs below $25k, 18.8% for AGIs $25k-50k, 19.2% for AGIs $50k-75k, 16.8% for AGIs $75k-100k, 19.4% for AGIs $100k-200k, 12.3% for AGIs over 200k)
Charity contributions: $4,306 (reported on 40.0% of returns)
Here:
$4,306
State:
$4,659
(% of AGI for various income ranges: 1.5% for AGIs below $25k, 2.2% for AGIs $25k-50k, 2.1% for AGIs $50k-75k, 1.9% for AGIs $75k-100k, 2.6% for AGIs $100k-200k, 2.7% for AGIs over 200k)
Taxes paid: $9,075 (reported on 45.6% of returns)
93265:
$9,075
State:
$14,448
(% of AGI for various income ranges: 3.8% for AGIs below $25k, 3.6% for AGIs $25k-50k, 5.1% for AGIs $50k-75k, 4.7% for AGIs $75k-100k, 6.9% for AGIs $100k-200k, 6.4% for AGIs over 200k)
Earned income credit: $2,095 (reported on 13.1% of returns)
Here:
$2,095
State:
$2,286
(% of AGI for various income ranges: 5.6% for AGIs below $25k, 0.8% for AGIs $25k-50k)
Percentage of individuals using paid preparers for their 2012 taxes: 64.4%
Here:
64%
State:
64%
(% for various income ranges: 53.8% for AGIs below $25k, 64.5% for AGIs $25k-50k, 68.0% for AGIs $50k-75k, 73.7% for AGIs $75k-100k, 73.1% for AGIs $100k-200k, 71.4% for AGIs over 200k)
Averages for the 2004 tax year for zip code 93265, filed in 2005:
Average Adjusted Gross Income (AGI) in 2004: $50,949 (Individual Income Tax Returns)
Here:
$50,949
State:
$58,600
Salary/wage: $46,797 (reported on 71.0% of returns)
Here:
$46,797
State:
$49,455
(% of AGI for various income ranges: 58.3% for AGIs $10k-25k, 61.6% for AGIs $25k-50k, 65.9% for AGIs $50k-75k, 64.0% for AGIs $75k-100k, 57.6% for AGIs over 100k)
Taxable interest for individuals: $2,301 (reported on 59.7% of returns)
This zip code:
$2,301
California:
$2,365
(% of AGI for various income ranges: 4.5% for AGIs $10k-25k, 2.3% for AGIs $25k-50k, 2.4% for AGIs $50k-75k, 1.3% for AGIs $75k-100k, 2.3% for AGIs over 100k)
Taxable dividends: $3,813 (reported on 31.1% of returns)
Here:
$3,813
State:
$4,746
(% of AGI for various income ranges: 2.9% for AGIs $10k-25k, 1.8% for AGIs $25k-50k, 1.9% for AGIs $50k-75k, 1.4% for AGIs $75k-100k, 2.5% for AGIs over 100k)
Net capital gain/loss: +$13,392 (reported on 28.8% of returns)
Here:
+$13,392
State:
+$23,418
(% of AGI for various income ranges: 0.1% for AGIs $10k-25k, 2.3% for AGIs $25k-50k, 1.5% for AGIs $50k-75k, 4.3% for AGIs $75k-100k, 13.1% for AGIs over 100k)
Profit/loss from business: +$18,019 (reported on 23.0% of returns)
Here:
+$18,019
State:
+$16,826
(% of AGI for various income ranges: 12.0% for AGIs $10k-25k, 7.7% for AGIs $25k-50k, 6.8% for AGIs $50k-75k, 6.6% for AGIs $75k-100k, 7.2% for AGIs over 100k)
IRA payment deduction: $3,562 (reported on 3.0% of returns)
93265:
$3,562
California:
$3,192
Self-employed pension: $15,148 (reported on 1.7% of returns)
Here:
$15,148
California:
$17,688
Total itemized deductions: $20,913 (25% of AGI, reported on 45.8% of returns)
Here:
$20,913
State:
$28,113
Here:
24.9% of AGI
State:
25.3% of AGI
(% of AGI for various income ranges: 17.0% for AGIs $10k-25k, 15.9% for AGIs $25k-50k, 19.3% for AGIs $50k-75k, 17.8% for AGIs $75k-100k, 17.1% for AGIs over 100k)
Charity contributions deductions: $3,343 (4% of AGI, reported on 39.6% of returns)
Here:
$3,343
State:
$3,923
Here:
3.8% of AGI
State:
3.3% of AGI
(% of AGI for various income ranges: 2.1% for AGIs $10k-25k, 1.7% for AGIs $25k-50k, 2.5% for AGIs $50k-75k, 2.4% for AGIs $75k-100k, 2.7% for AGIs over 100k)
Total tax: $8,211 (reported on 80.0% of returns)
93265:
$8,211
State:
$10,761
(% of AGI for various income ranges: 4.7% for AGIs $10k-25k, 7.4% for AGIs $25k-50k, 9.3% for AGIs $50k-75k, 10.7% for AGIs $75k-100k, 16.7% for AGIs over 100k)
Earned income credit: $1,483 (reported on 11.2% of returns)
Here:
$1,483
State:
$1,763
Percentage of individuals using paid preparers for their 2004 taxes: 68.1%
Here:
68%
State:
66%
(% for various income ranges: 58.2% for AGIs below $10k, 62.2% for AGIs $10k-25k, 66.7% for AGIs $25k-50k, 69.6% for AGIs $50k-75k, 76.2% for AGIs $75k-100k, 83.4% for AGIs over 100k)
Household received Food Stamps/SNAP in the past 12 months: 74 Household did not receive Food Stamps/SNAP in the past 12 months: 1,121
Women who had a birth in the past 12 months: 12 (12 now married, 0 unmarried) Women who did not have a birth in the past 12 months: 558 (297 now married, 257 unmarried)
Housing units in zip code 93265 with a mortgage: 703 (25 second mortgage, 26 both second mortgage and home equity loan) Median monthly owner costs for units with a mortgage: $1,927 Median monthly owner costs for units without a mortgage: $709
Residents with income below the poverty level in 2022:
This zip code:
10.5%
Whole state:
12.2%
Residents with income below 50% of the poverty level in 2022:
This zip code:
3.9%
Whole state:
6.2%
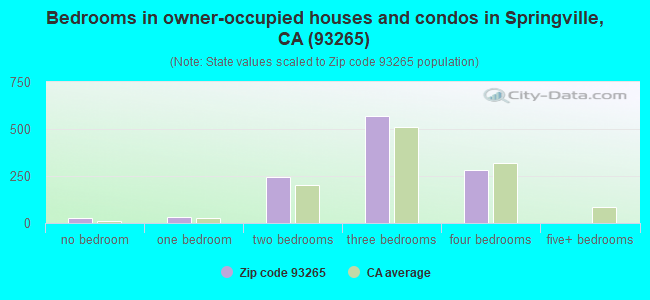
Median number of rooms in houses and condos:
Here:
5.7
State:
6.0
Median number of rooms in apartments:
Here:
5.1
State:
3.9
Notable locations in this zip code not listed on our city pages
Lakes and reservoirs: Maggie Lakes (A), Frog Lakes (B), Hidden Lake (C), Summit Lake (D), Twin Lakes (E), Carl Lake (F), Hedrick Mill Pond (G). Display/hide their locations on the map
Rivers and creeks: Hickman Creek (A), Needlerock Creek (B), Dome Creek (C), Mountaineer Creek (D), Meadow Creek (E), Lloyd Meadows Creek (F), Little Kern River (G), Bear Creek (H), Kramer Creek (I). Display/hide their locations on the map
In group quarters: 46 (-1 institutionalized population)
Size of family households: 388 2-persons, 149 3-persons, 229 4-persons, 38 5-persons, 18 6-persons
Size of nonfamily households: 360 1-person, 8 2-persons, 18 3-persons
540 married couples with children.
29 single-parent households (29 men).
89.8% of residents of 93265 zip code speak English at home.
5.9% of residents speak Spanish at home (84% very well, 9% well, 7% not well).
4.0% of residents speak Asian or Pacific Island language at home (84% very well, 16% well).
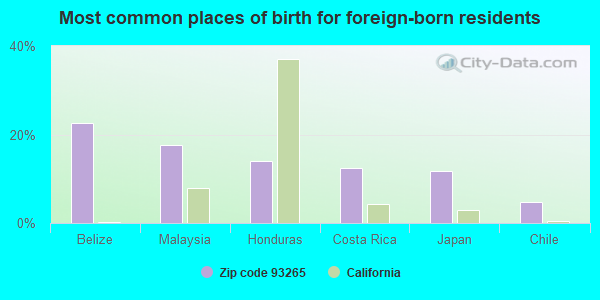
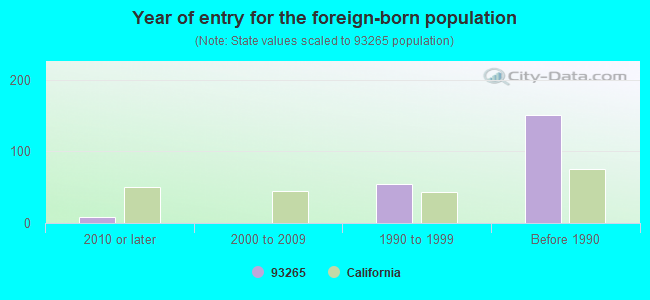
Foreign born population: 187 (5.9%) (81.6% of them are naturalized citizens)
This zip code:
5.9%
Whole state:
26.7%
23%Belize
18%Malaysia
14%Honduras
12%Costa Rica
12%Japan
5%Chile
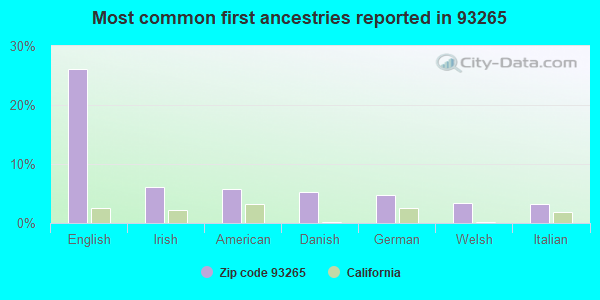
26%English
6%Irish
6%American
5%Danish
5%German
3%Welsh
3%Italian
Year of entry for the foreign-born population
92010 or later
02000 to 2009
551990 to 1999
151Before 1990
Facilities with environmental interests located in this zip code:
MTN HOME CONSERVATION CAMP (45260 BEAR CREEK RD in SPRINGVILLE, CA)
National Pollutant Discharge Elimination System NON-MAJOR (Tracking pollutant discharge elimination systems) - permit Business SIC classification: CORRECTIONAL INSTITUTIONS Organizations: CA DEPT OF FORESTRY (CONTACT/OWNER)
Alternative names: CA DEPT OF FORESTRY
BABA RAM DEVA LLC/SPRINGVILLE FOOD MART (35514 HWY 190 in SPRINGVILLE, CA)
CRITERIA AND HAZARDOUS AIR POLLUTANT INVENTORY (Inventory of air pollution sources) Business SIC classification: GASOLINE SERVICE STATIONS
Housing units lacking complete plumbing facilities: 2.4% Housing units lacking complete kitchen facilities: 2.3%
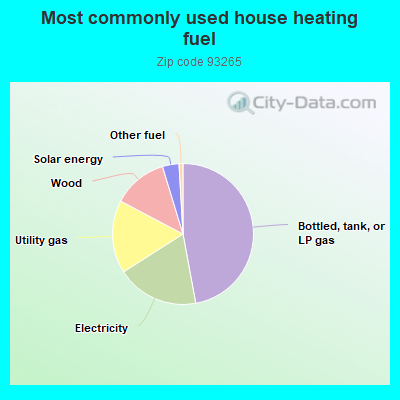
47.2%Bottled, tank, or LP gas
18.9%Electricity
16.8%Utility gas
12.6%Wood
3.8%Solar energy
0.9%Other fuel
Population in 1990: 3,374. Population change in the 1990s: +153 (+4.5%).
Place of birth for U.S.-born residents:
This state: 2,295
Northeast: 79
Midwest: 319
South: 100
West: 131
58% of the 93265 zip code residents lived in the same house 5 years ago. Out of people who lived in different houses, 58% lived in this county. Out of people who lived in different counties, 50% lived in California.
84% of the 93265 zip code residents lived in the same house 1 year ago. Out of people who lived in different houses, 29% moved from this county. Out of people who lived in different houses, 55% moved from different county within same state. Out of people who lived in different houses, 15% moved from different state.
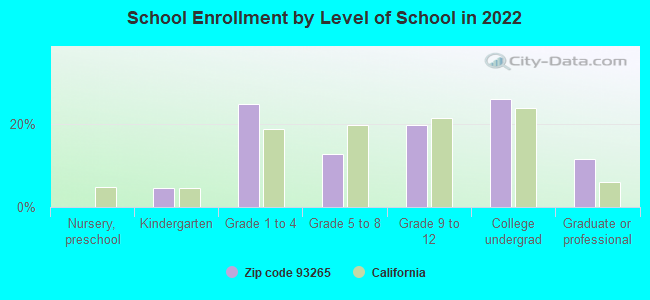
Private vs. public school enrollment:
Students in private schools in grades 1 to 8 (elementary and middle school):
Here:
0.0%
California:
10.5%
Students in private schools in grades 9 to 12 (high school):
Here:
0.0%
California:
8.5%
Students in private undergraduate colleges: 14
Here:
7.7%
California:
15.9%
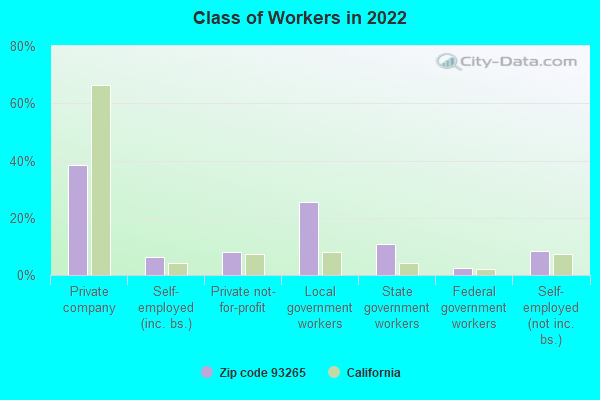
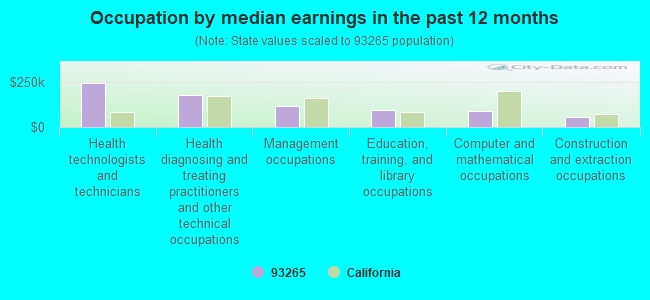
Occupation by median earnings in the past 12 months ($)
246,465Health technologists and technicians
177,496Health diagnosing and treating practitioners and other technical occupations
116,500Management occupations
96,970Education, training, and library occupations
89,867Computer and mathematical occupations
54,324Construction and extraction occupations
Top industries in this zip code by the number of employees in 2005:
Construction: New Single-Family Housing Construction (except Operative Builders) (20-49 employees: 1 establishment, 1-4 employees: 4 establishments)
Accommodation and Food Services: Full-Service Restaurants (10-19: 1, 5-9: 1)
Professional, Scientific, and Technical Services: Administrative Management and General Management Consulting Services (10-19: 1, 1-4: 1)
Health Care and Social Assistance: Child Day Care Services (10-19: 1)
Accommodation and Food Services: Limited-Service Restaurants (5-9: 1, 1-4: 1)
Construction: Plumbing, Heating, and Air-Conditioning Contractors (5-9: 1, 1-4: 1)
Wholesale Trade: Metal Service Centers and Other Metal Merchant Wholesalers (5-9: 1)
Other Services (except Public Administration): Religious Organizations (5-9: 1)
People in group quarters in 2010:
88 people in state prisons
People in group quarters in 2000:
108 people in state prisons
Fatal accident statistics in 2010:
Fatal accident count: 1
Vehicles involved in fatal accidents: 1
Fatal accidents caused by drunken drivers: 1
Fatalities: 1
Persons involved in fatal accidents: 3
Pedestrians involved in fatal accidents: 0
Home Mortgage Disclosure Act Aggregated Statistics For Year 2009 (Based on 2 partial tracts)
A) FHA, FSA/RHS & VA Home Purchase Loans
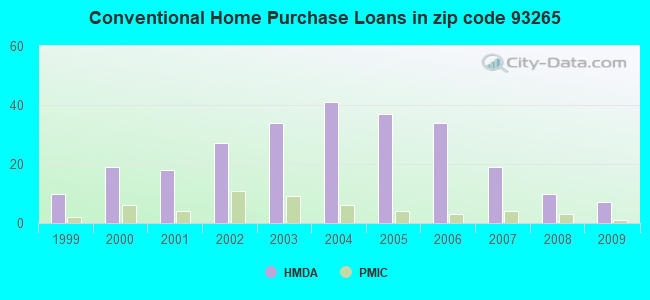
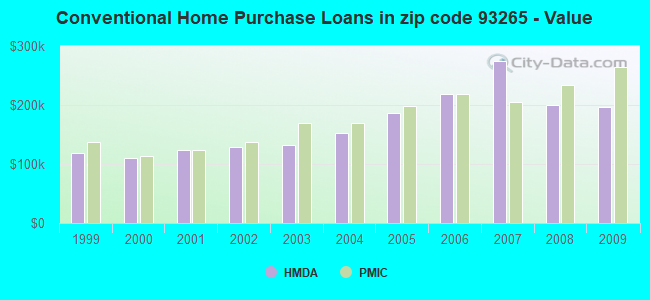
B) Conventional Home Purchase Loans
C) Refinancings
D) Home Improvement Loans
F) Non-occupant Loans on < 5 Family Dwellings (A B C & D)
G) Loans On Manufactured Home Dwelling (A B C & D)
Number
Average Value
Number
Average Value
Number
Average Value
Number
Average Value
Number
Average Value
Number
Average Value
LOANS ORIGINATED
3
$213,820
7
$196,779
26
$174,578
2
$143,370
11
$132,726
1
$104,240
APPLICATIONS APPROVED, NOT ACCEPTED
0
$0
1
$367,000
3
$236,763
0
$0
1
$149,650
0
$0
APPLICATIONS DENIED
1
$210,490
3
$143,180
18
$213,851
1
$33,700
5
$172,674
3
$163,267
APPLICATIONS WITHDRAWN
1
$75,400
1
$107,100
11
$206,177
0
$0
3
$141,373
1
$80,820
FILES CLOSED FOR INCOMPLETENESS
0
$0
0
$0
1
$249,330
0
$0
1
$99,670
0
$0
Aggregated Statistics For Year 2008 (Based on 2 partial tracts)
A) FHA, FSA/RHS & VA Home Purchase Loans
B) Conventional Home Purchase Loans
C) Refinancings
D) Home Improvement Loans
F) Non-occupant Loans on < 5 Family Dwellings (A B C & D)
G) Loans On Manufactured Home Dwelling (A B C & D)
Number
Average Value
Number
Average Value
Number
Average Value
Number
Average Value
Number
Average Value
Number
Average Value
LOANS ORIGINATED
2
$195,780
10
$200,834
27
$217,881
2
$148,225
11
$193,403
2
$178,070
APPLICATIONS APPROVED, NOT ACCEPTED
0
$0
3
$174,407
3
$199,920
1
$48,550
1
$229,050
0
$0
APPLICATIONS DENIED
1
$110,810
3
$193,447
17
$254,621
5
$176,330
3
$171,073
1
$195,920
APPLICATIONS WITHDRAWN
1
$170,500
1
$236,480
8
$251,970
1
$76,260
1
$264,750
1
$97,390
FILES CLOSED FOR INCOMPLETENESS
0
$0
0
$0
2
$229,765
0
$0
0
$0
0
$0
Aggregated Statistics For Year 2007 (Based on 2 partial tracts)
A) FHA, FSA/RHS & VA Home Purchase Loans
B) Conventional Home Purchase Loans
C) Refinancings
D) Home Improvement Loans
F) Non-occupant Loans on < 5 Family Dwellings (A B C & D)
G) Loans On Manufactured Home Dwelling (A B C & D)
Number
Average Value
Number
Average Value
Number
Average Value
Number
Average Value
Number
Average Value
Number
Average Value
LOANS ORIGINATED
1
$148,510
19
$273,785
37
$212,178
8
$94,176
13
$204,336
3
$134,517
APPLICATIONS APPROVED, NOT ACCEPTED
0
$0
3
$134,327
7
$239,823
2
$44,555
2
$180,215
1
$105,670
APPLICATIONS DENIED
0
$0
6
$306,210
31
$215,886
4
$160,222
7
$200,940
3
$159,937
APPLICATIONS WITHDRAWN
0
$0
2
$274,890
14
$213,425
1
$115,670
3
$223,243
1
$141,370
FILES CLOSED FOR INCOMPLETENESS
0
$0
0
$0
6
$240,332
1
$79,970
0
$0
1
$112,810
Aggregated Statistics For Year 2006 (Based on 2 partial tracts)
B) Conventional Home Purchase Loans
C) Refinancings
D) Home Improvement Loans
F) Non-occupant Loans on < 5 Family Dwellings (A B C & D)
G) Loans On Manufactured Home Dwelling (A B C & D)
Number
Average Value
Number
Average Value
Number
Average Value
Number
Average Value
Number
Average Value
LOANS ORIGINATED
34
$218,476
50
$226,195
13
$121,665
23
$165,139
4
$160,650
APPLICATIONS APPROVED, NOT ACCEPTED
4
$181,855
10
$225,024
2
$140,945
2
$127,235
1
$172,220
APPLICATIONS DENIED
12
$253,137
26
$208,773
4
$137,018
6
$152,987
3
$142,897
APPLICATIONS WITHDRAWN
4
$205,845
20
$221,097
4
$88,392
4
$197,350
1
$71,400
FILES CLOSED FOR INCOMPLETENESS
2
$183,210
8
$206,452
1
$97,100
1
$112,240
1
$104,240
Aggregated Statistics For Year 2005 (Based on 2 partial tracts)
B) Conventional Home Purchase Loans
C) Refinancings
D) Home Improvement Loans
F) Non-occupant Loans on < 5 Family Dwellings (A B C & D)
G) Loans On Manufactured Home Dwelling (A B C & D)
Number
Average Value
Number
Average Value
Number
Average Value
Number
Average Value
Number
Average Value
LOANS ORIGINATED
37
$186,975
54
$202,295
9
$91,170
21
$151,626
3
$133,757
APPLICATIONS APPROVED, NOT ACCEPTED
7
$254,470
8
$181,499
2
$76,255
2
$218,625
1
$122,240
APPLICATIONS DENIED
7
$254,877
24
$200,598
6
$99,388
3
$159,270
2
$136,375
APPLICATIONS WITHDRAWN
7
$171,116
28
$180,591
4
$168,360
5
$118,582
3
$107,387
FILES CLOSED FOR INCOMPLETENESS
1
$180,500
3
$167,360
0
$0
0
$0
0
$0
Aggregated Statistics For Year 2004 (Based on 2 partial tracts)
A) FHA, FSA/RHS & VA Home Purchase Loans
B) Conventional Home Purchase Loans
C) Refinancings
D) Home Improvement Loans
F) Non-occupant Loans on < 5 Family Dwellings (A B C & D)
G) Loans On Manufactured Home Dwelling (A B C & D)
Number
Average Value
Number
Average Value
Number
Average Value
Number
Average Value
Number
Average Value
Number
Average Value
LOANS ORIGINATED
1
$106,810
41
$153,256
46
$154,727
7
$85,966
20
$111,898
4
$116,595
APPLICATIONS APPROVED, NOT ACCEPTED
0
$0
6
$162,458
14
$134,579
1
$73,400
4
$122,522
1
$45,700
APPLICATIONS DENIED
0
$0
12
$181,070
30
$125,521
7
$71,156
5
$152,624
3
$79,207
APPLICATIONS WITHDRAWN
0
$0
4
$196,065
25
$145,622
2
$50,980
2
$153,940
1
$149,650
FILES CLOSED FOR INCOMPLETENESS
0
$0
1
$162,510
5
$203,232
1
$96,250
0
$0
0
$0
Aggregated Statistics For Year 2003 (Based on 2 partial tracts)
A) FHA, FSA/RHS & VA Home Purchase Loans
B) Conventional Home Purchase Loans
C) Refinancings
D) Home Improvement Loans
F) Non-occupant Loans on < 5 Family Dwellings (A B C & D)
Number
Average Value
Number
Average Value
Number
Average Value
Number
Average Value
Number
Average Value
LOANS ORIGINATED
1
$42,270
34
$131,846
85
$135,149
3
$70,923
29
$88,497
APPLICATIONS APPROVED, NOT ACCEPTED
0
$0
3
$147,847
15
$111,460
0
$0
3
$113,573
APPLICATIONS DENIED
0
$0
7
$173,114
26
$144,415
2
$47,265
3
$95,677
APPLICATIONS WITHDRAWN
0
$0
6
$116,668
17
$160,188
0
$0
2
$56,690
FILES CLOSED FOR INCOMPLETENESS
0
$0
0
$0
2
$143,800
1
$25,700
0
$0
Aggregated Statistics For Year 2002 (Based on 2 partial tracts)
A) FHA, FSA/RHS & VA Home Purchase Loans
B) Conventional Home Purchase Loans
C) Refinancings
D) Home Improvement Loans
F) Non-occupant Loans on < 5 Family Dwellings (A B C & D)
Number
Average Value
Number
Average Value
Number
Average Value
Number
Average Value
Number
Average Value
LOANS ORIGINATED
2
$151,510
27
$129,102
47
$135,271
5
$38,498
17
$87,814
APPLICATIONS APPROVED, NOT ACCEPTED
0
$0
2
$105,815
8
$115,311
1
$44,550
1
$99,390
APPLICATIONS DENIED
1
$55,690
5
$88,022
19
$151,969
1
$50,550
2
$90,535
APPLICATIONS WITHDRAWN
0
$0
4
$122,950
14
$137,455
1
$35,700
1
$101,670
FILES CLOSED FOR INCOMPLETENESS
0
$0
2
$68,260
2
$148,655
0
$0
1
$45,120
Aggregated Statistics For Year 2001 (Based on 2 partial tracts)
A) FHA, FSA/RHS & VA Home Purchase Loans
B) Conventional Home Purchase Loans
C) Refinancings
D) Home Improvement Loans
F) Non-occupant Loans on < 5 Family Dwellings (A B C & D)
Number
Average Value
Number
Average Value
Number
Average Value
Number
Average Value
Number
Average Value
LOANS ORIGINATED
1
$80,250
18
$123,919
35
$119,234
3
$57,597
11
$84,979
APPLICATIONS APPROVED, NOT ACCEPTED
0
$0
3
$99,863
5
$110,412
1
$36,270
2
$85,110
APPLICATIONS DENIED
0
$0
1
$94,250
10
$96,676
2
$19,705
2
$68,970
APPLICATIONS WITHDRAWN
0
$0
2
$87,965
11
$134,232
0
$0
1
$16,850
FILES CLOSED FOR INCOMPLETENESS
0
$0
0
$0
2
$116,095
0
$0
1
$26,280
Aggregated Statistics For Year 2000 (Based on 2 partial tracts)
A) FHA, FSA/RHS & VA Home Purchase Loans
B) Conventional Home Purchase Loans
C) Refinancings
D) Home Improvement Loans
F) Non-occupant Loans on < 5 Family Dwellings (A B C & D)
Number
Average Value
Number
Average Value
Number
Average Value
Number
Average Value
Number
Average Value
LOANS ORIGINATED
2
$131,375
19
$110,768
15
$105,577
3
$26,940
7
$74,909
APPLICATIONS APPROVED, NOT ACCEPTED
0
$0
2
$99,675
3
$99,960
1
$18,850
1
$89,390
APPLICATIONS DENIED
0
$0
3
$98,817
12
$95,605
1
$66,260
1
$121,950
APPLICATIONS WITHDRAWN
0
$0
2
$103,385
7
$77,683
1
$42,840
1
$53,120
FILES CLOSED FOR INCOMPLETENESS
0
$0
0
$0
1
$56,830
0
$0
0
$0
Aggregated Statistics For Year 1999 (Based on 1 partial tract)
A) FHA, FSA/RHS & VA Home Purchase Loans
B) Conventional Home Purchase Loans
C) Refinancings
D) Home Improvement Loans
F) Non-occupant Loans on < 5 Family Dwellings (A B C & D)
Detailed PMIC statistics for the following Tracts:0027.00
2006 - 2018 National Fire Incident Reporting System (NFIRS) incidents
According to the data from the years 2006 - 2018 the average number of fires per year is 23. The highest number of reported fires - 62 took place in 2017, and the least - 6 in 2006. The data has an increasing trend.
When looking into fire subcategories, the most reports belonged to: Outside Fires (79.9%), and Structure Fires (11.9%).
Fire incident types reported to NFIRS in Zip Code 93265


 Nearest zip codes: 93208, 93271, 93257, 93221, 93207, 93267.


 According to the data from the years 2006 - 2018 the average number of fires per year is 23. The highest number of reported fires - 62 took place in 2017, and the least - 6 in 2006. The data has an increasing trend.
 When looking into fire subcategories, the most reports belonged to: Outside Fires (79.9%), and Structure Fires (11.9%).