Estimated zip code population in 2022: 6,005 Zip code population in 2010: 6,314 Zip code population in 2000: 6,515
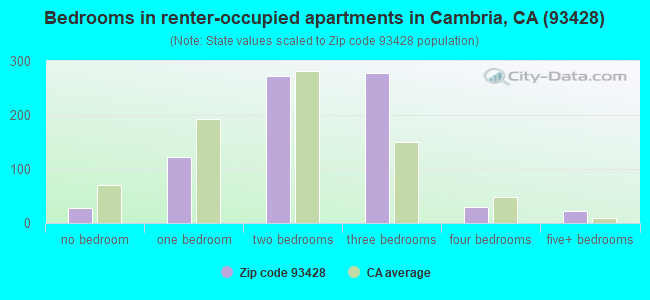
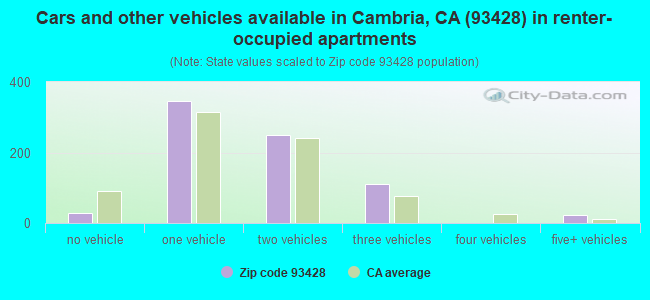
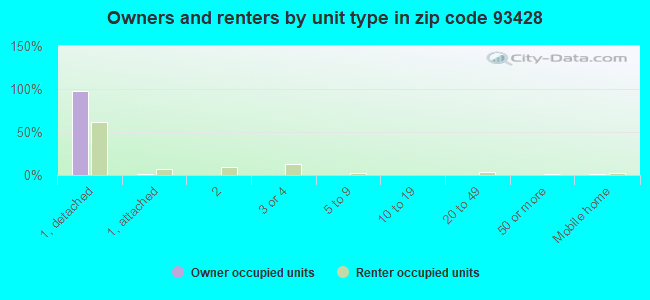
Houses and condos: 4,308 Renter-occupied apartments: 754
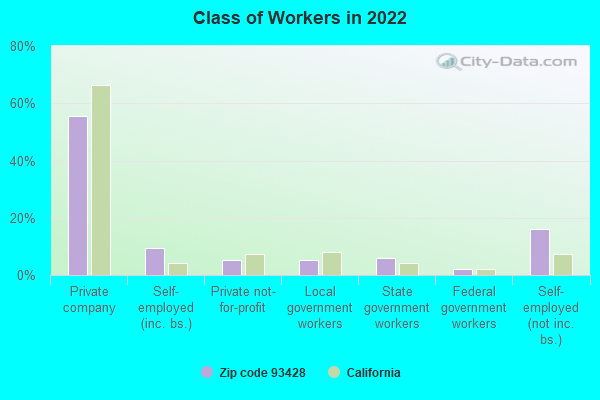
% of renters here:
26%
State:
44%
March 2022 cost of living index in zip code 93428: 108.4 (more than average, U.S. average is 100)
Land area: 77.0 sq. mi. Water area: 2.0 sq. mi.
Population density: 78 people per square mile
(very low).
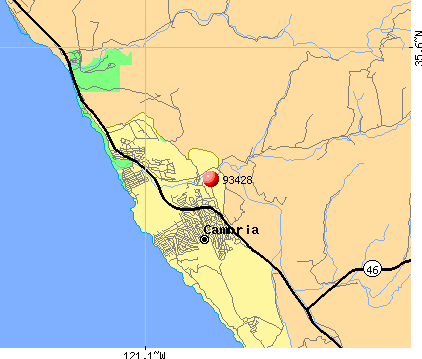
OSM Map
General Map
Google Map
MSN Map
OSM Map
General Map
Google Map
MSN Map
OSM Map
General Map
Google Map
MSN Map
OSM Map
General Map
Google Map
MSN Map
Please wait while loading the map...
Real estate property taxes paid for housing units in 2022:
This zip code:
0.7% ($6,359)
California:
0.7% ($4,831)
Median real estate property taxes paid for housing units with mortgages in 2022: $6,495 (0.7%) Median real estate property taxes paid for housing units with no mortgage in 2022: $6,130 (0.6%)
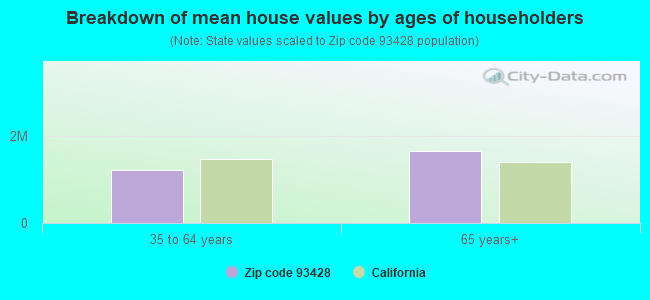
Estimated median house/condo value in 2022: $915,805
93428:
$915,805
California:
$715,900
According to our research of California and other state lists, there was 1 registered sex offender living in 93428 zip code as of April 26, 2024. The ratio of all residents to sex offenders in zip code 93428 is 6,399 to 1. The ratio of registered sex offenders to all residents in this zip code is much lower than the state average.
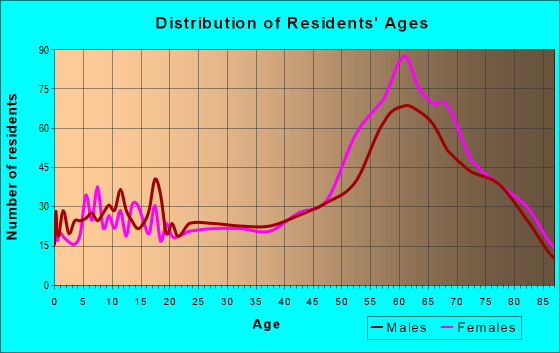
Median resident age:
This zip code:
61.1 years
California median age:
37.9 years
Average household size:
This zip code:
2.0 people
California:
2.8 people
Averages for the 2020 tax year for zip code 93428, filed in 2021:
Average Adjusted Gross Income (AGI) in 2020: $89,223 (Individual Income Tax Returns)
Here:
$89,223
State:
$95,910
Salary/wage: $57,097 (reported on 56.3% of returns)
Here:
$57,097
State:
$77,331
(% of AGI for various income ranges: 1213.6% for AGIs below $25k, 3679.7% for AGIs $25k-50k, 5588.6% for AGIs $50k-75k, 5784.0% for AGIs $75k-100k, 10605.4% for AGIs $100k-200k, 71898.3% for AGIs over 200k)
Taxable interest for individuals: $3,416 (reported on 53.7% of returns)
This zip code:
$3,416
California:
$2,294
(% of AGI for various income ranges: 63.8% for AGIs below $25k, 122.6% for AGIs $25k-50k, 233.8% for AGIs $50k-75k, 398.0% for AGIs $75k-100k, 772.9% for AGIs $100k-200k, 4148.3% for AGIs over 200k)
Ordinary dividends: $17,161 (reported on 37.8% of returns)
Here:
$17,161
State:
$10,949
(% of AGI for various income ranges: 138.0% for AGIs below $25k, 272.4% for AGIs $25k-50k, 564.3% for AGIs $50k-75k, 1040.0% for AGIs $75k-100k, 1673.3% for AGIs $100k-200k, 22466.7% for AGIs over 200k)
Net capital gain/loss in AGI: +$26,841 (reported on 36.3% of returns)
Here:
+$26,841
State:
+$49,306
(% of AGI for various income ranges: 37.0% for AGIs below $25k, 100.5% for AGIs $25k-50k, 517.1% for AGIs $50k-75k, 850.0% for AGIs $75k-100k, 1812.9% for AGIs $100k-200k, 42893.3% for AGIs over 200k)
Profit/loss from business: +$29,565 (reported on 22.1% of returns)
Here:
+$29,565
State:
+$15,671
(% of AGI for various income ranges: 267.4% for AGIs below $25k, 601.8% for AGIs $25k-50k, 802.9% for AGIs $50k-75k, 1016.0% for AGIs $75k-100k, 1527.1% for AGIs $100k-200k, 19458.3% for AGIs over 200k)
Taxable individual retirement arrangement distribution: $25,391 (reported on 20.1% of returns)
93428:
$25,391
California:
$23,505
(% of AGI for various income ranges: 138.2% for AGIs below $25k, 311.8% for AGIs $25k-50k, 742.4% for AGIs $50k-75k, 1304.7% for AGIs $75k-100k, 2775.0% for AGIs $100k-200k, 8690.0% for AGIs over 200k)
Self-employed (Keogh) retirement plans: $39,425 (reported on 1.2% of returns)
93428:
$39,425
California:
$30,163
(% of AGI for various income ranges: 133.8% for AGIs $50k-75k, 2160.0% for AGIs over 200k)
Total itemized deductions: $38,059 (reported on 20.9% of returns)
Here:
$38,059
State:
$39,517
(% of AGI for various income ranges: 324.0% for AGIs below $25k, 659.7% for AGIs $25k-50k, 1472.9% for AGIs $50k-75k, 1996.0% for AGIs $75k-100k, 3326.3% for AGIs $100k-200k, 14708.3% for AGIs over 200k)
Charity contributions: $7,368 (reported on 17.4% of returns)
Here:
$7,368
State:
$12,598
(% of AGI for various income ranges: 8.0% for AGIs below $25k, 44.7% for AGIs $25k-50k, 151.0% for AGIs $50k-75k, 230.7% for AGIs $75k-100k, 568.8% for AGIs $100k-200k, 3515.0% for AGIs over 200k)
Taxes paid: $8,526 (reported on 20.6% of returns)
93428:
$8,526
State:
$8,807
(% of AGI for various income ranges: 75.8% for AGIs below $25k, 129.2% for AGIs $25k-50k, 393.3% for AGIs $50k-75k, 495.3% for AGIs $75k-100k, 892.9% for AGIs $100k-200k, 2310.0% for AGIs over 200k)
Earned income credit: $1,792 (reported on 7.7% of returns)
Here:
$1,792
State:
$2,074
(% of AGI for various income ranges: 61.4% for AGIs below $25k, 41.8% for AGIs $25k-50k)
Percentage of individuals using paid preparers for their 2020 taxes: 92.3%
Here:
92%
State:
92%
(% for various income ranges: 89.8% for AGIs below $25k, 93.2% for AGIs $25k-50k, 91.5% for AGIs $50k-75k, 91.2% for AGIs $75k-100k, 94.8% for AGIs $100k-200k, 96.4% for AGIs over 200k)
Averages for the 2012 tax year for zip code 93428, filed in 2013:
Average Adjusted Gross Income (AGI) in 2012: $71,445 (Individual Income Tax Returns)
Here:
$71,445
State:
$72,726
Salary/wage: $41,711 (reported on 60.4% of returns)
Here:
$41,711
State:
$59,079
(% of AGI for various income ranges: 59.6% for AGIs below $25k, 54.8% for AGIs $25k-50k, 40.6% for AGIs $50k-75k, 31.6% for AGIs $75k-100k, 35.9% for AGIs $100k-200k, 22.9% for AGIs over 200k)
Taxable interest for individuals: $2,416 (reported on 52.1% of returns)
This zip code:
$2,416
California:
$2,146
(% of AGI for various income ranges: 2.7% for AGIs below $25k, 2.6% for AGIs $25k-50k, 2.3% for AGIs $50k-75k, 1.5% for AGIs $75k-100k, 1.7% for AGIs $100k-200k, 1.2% for AGIs over 200k)
Ordinary dividends: $9,610 (reported on 34.8% of returns)
Here:
$9,610
State:
$9,308
(% of AGI for various income ranges: 5.3% for AGIs below $25k, 4.4% for AGIs $25k-50k, 3.6% for AGIs $50k-75k, 5.3% for AGIs $75k-100k, 4.1% for AGIs $100k-200k, 5.2% for AGIs over 200k)
Net capital gain/loss in AGI: +$12,649 (reported on 31.7% of returns)
Here:
+$12,649
State:
+$30,460
(% of AGI for various income ranges: 0.3% for AGIs $25k-50k, 0.5% for AGIs $50k-75k, 2.5% for AGIs $75k-100k, 3.0% for AGIs $100k-200k, 13.2% for AGIs over 200k)
Profit/loss from business: +$18,874 (reported on 25.9% of returns)
Here:
+$18,874
State:
+$17,064
(% of AGI for various income ranges: 14.9% for AGIs below $25k, 9.4% for AGIs $25k-50k, 7.2% for AGIs $50k-75k, 6.1% for AGIs $75k-100k, 6.5% for AGIs $100k-200k, 4.8% for AGIs over 200k)
Taxable individual retirement arrangement distribution: $21,304 (reported on 22.3% of returns)
93428:
$21,304
California:
$19,557
(% of AGI for various income ranges: 5.1% for AGIs below $25k, 4.8% for AGIs $25k-50k, 7.2% for AGIs $50k-75k, 7.4% for AGIs $75k-100k, 8.6% for AGIs $100k-200k, 5.8% for AGIs over 200k)
Self-employment retirement plans: $20,020 (reported on 1.5% of returns)
93428:
$20,020
California:
$24,530
Total itemized deductions: $31,896 (27% of AGI, reported on 44.8% of returns)
Here:
$31,896
State:
$34,004
Here:
26.6% of AGI
State:
22.7% of AGI
(% of AGI for various income ranges: 27.4% for AGIs below $25k, 18.9% for AGIs $25k-50k, 23.6% for AGIs $50k-75k, 20.6% for AGIs $75k-100k, 20.8% for AGIs $100k-200k, 17.0% for AGIs over 200k)
Charity contributions: $3,854 (reported on 36.9% of returns)
Here:
$3,854
State:
$4,659
(% of AGI for various income ranges: 1.2% for AGIs below $25k, 1.5% for AGIs $25k-50k, 2.2% for AGIs $50k-75k, 1.8% for AGIs $75k-100k, 2.5% for AGIs $100k-200k, 1.9% for AGIs over 200k)
Taxes paid: $13,318 (reported on 44.8% of returns)
93428:
$13,318
State:
$14,448
(% of AGI for various income ranges: 6.2% for AGIs below $25k, 4.4% for AGIs $25k-50k, 6.3% for AGIs $50k-75k, 7.3% for AGIs $75k-100k, 7.9% for AGIs $100k-200k, 11.4% for AGIs over 200k)
Earned income credit: $1,700 (reported on 10.1% of returns)
Here:
$1,700
State:
$2,286
(% of AGI for various income ranges: 2.8% for AGIs below $25k, 0.4% for AGIs $25k-50k)
Percentage of individuals using paid preparers for their 2012 taxes: 66.5%
Here:
66%
State:
64%
(% for various income ranges: 61.2% for AGIs below $25k, 64.4% for AGIs $25k-50k, 72.3% for AGIs $50k-75k, 69.0% for AGIs $75k-100k, 69.8% for AGIs $100k-200k, 86.7% for AGIs over 200k)
Averages for the 2004 tax year for zip code 93428, filed in 2005:
Average Adjusted Gross Income (AGI) in 2004: $59,249 (Individual Income Tax Returns)
Here:
$59,249
State:
$58,600
Salary/wage: $37,711 (reported on 59.3% of returns)
Here:
$37,711
State:
$49,455
(% of AGI for various income ranges: 54.1% for AGIs $10k-25k, 48.3% for AGIs $25k-50k, 43.5% for AGIs $50k-75k, 38.2% for AGIs $75k-100k, 29.4% for AGIs over 100k)
Taxable interest for individuals: $3,872 (reported on 63.3% of returns)
This zip code:
$3,872
California:
$2,365
(% of AGI for various income ranges: 6.2% for AGIs $10k-25k, 4.1% for AGIs $25k-50k, 4.9% for AGIs $50k-75k, 4.6% for AGIs $75k-100k, 3.1% for AGIs over 100k)
Taxable dividends: $5,351 (reported on 41.9% of returns)
Here:
$5,351
State:
$4,746
(% of AGI for various income ranges: 5.2% for AGIs $10k-25k, 4.2% for AGIs $25k-50k, 3.5% for AGIs $50k-75k, 3.8% for AGIs $75k-100k, 3.3% for AGIs over 100k)
Net capital gain/loss: +$19,174 (reported on 38.9% of returns)
Here:
+$19,174
State:
+$23,418
(% of AGI for various income ranges: -0.3% for AGIs $10k-25k, 2.6% for AGIs $25k-50k, 1.8% for AGIs $50k-75k, 4.0% for AGIs $75k-100k, 21.5% for AGIs over 100k)
Profit/loss from business: +$18,116 (reported on 27.7% of returns)
Here:
+$18,116
State:
+$16,826
(% of AGI for various income ranges: 11.8% for AGIs $10k-25k, 9.8% for AGIs $25k-50k, 10.4% for AGIs $50k-75k, 11.5% for AGIs $75k-100k, 6.6% for AGIs over 100k)
Profit/loss from farming: +$528 (reported on 1.1% of returns)
Here:
+$528
State:
-$7,562
IRA payment deduction: $3,739 (reported on 4.3% of returns)
93428:
$3,739
California:
$3,192
(% of AGI for various income ranges: 0.3% for AGIs $10k-25k, 0.5% for AGIs $25k-50k, 0.4% for AGIs $50k-75k, 0.3% for AGIs $75k-100k, 0.1% for AGIs over 100k)
Self-employed pension: $13,222 (reported on 2.4% of returns)
Here:
$13,222
California:
$17,688
(% of AGI for various income ranges: 0.4% for AGIs $10k-25k, 0.3% for AGIs $25k-50k, 0.4% for AGIs $50k-75k, 0.7% for AGIs $75k-100k, 0.6% for AGIs over 100k)
Total itemized deductions: $26,273 (27% of AGI, reported on 47.9% of returns)
Here:
$26,273
State:
$28,113
Here:
27.0% of AGI
State:
25.3% of AGI
(% of AGI for various income ranges: 26.1% for AGIs $10k-25k, 24.5% for AGIs $25k-50k, 23.1% for AGIs $50k-75k, 22.6% for AGIs $75k-100k, 17.5% for AGIs over 100k)
Charity contributions deductions: $2,947 (3% of AGI, reported on 42.3% of returns)
Here:
$2,947
State:
$3,923
Here:
3.2% of AGI
State:
3.3% of AGI
(% of AGI for various income ranges: 2.0% for AGIs $10k-25k, 2.1% for AGIs $25k-50k, 2.0% for AGIs $50k-75k, 3.0% for AGIs $75k-100k, 1.8% for AGIs over 100k)
Total tax: $9,845 (reported on 78.2% of returns)
93428:
$9,845
State:
$10,761
(% of AGI for various income ranges: 5.2% for AGIs $10k-25k, 7.4% for AGIs $25k-50k, 9.6% for AGIs $50k-75k, 11.2% for AGIs $75k-100k, 16.3% for AGIs over 100k)
Earned income credit: $1,325 (reported on 8.9% of returns)
Here:
$1,325
State:
$1,763
Percentage of individuals using paid preparers for their 2004 taxes: 68.8%
Here:
69%
State:
66%
(% for various income ranges: 61.1% for AGIs below $10k, 64.8% for AGIs $10k-25k, 70.2% for AGIs $25k-50k, 73.3% for AGIs $50k-75k, 68.7% for AGIs $75k-100k, 80.4% for AGIs over 100k)
Household received Food Stamps/SNAP in the past 12 months: 83 Household did not receive Food Stamps/SNAP in the past 12 months: 2,781
Women who had a birth in the past 12 months: 30 (30 now married, 0 unmarried) Women who did not have a birth in the past 12 months: 789 (426 now married, 358 unmarried)
Housing units in zip code 93428 with a mortgage: 1,350 (101 second mortgage, 82 both second mortgage and home equity loan) Houses without a mortgage: 15
Median monthly owner costs for units with a mortgage: $2,589 Median monthly owner costs for units without a mortgage: $918
Residents with income below the poverty level in 2022:
This zip code:
8.6%
Whole state:
12.2%
Residents with income below 50% of the poverty level in 2022:
This zip code:
4.4%
Whole state:
6.2%
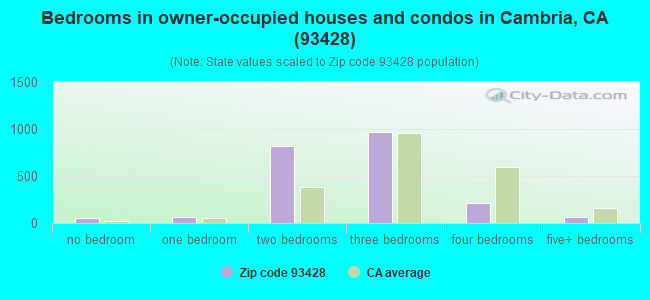
Median number of rooms in houses and condos:
Here:
5.7
State:
6.0
Median number of rooms in apartments:
Here:
4.7
State:
3.9
Notable locations in this zip code not listed on our city pages
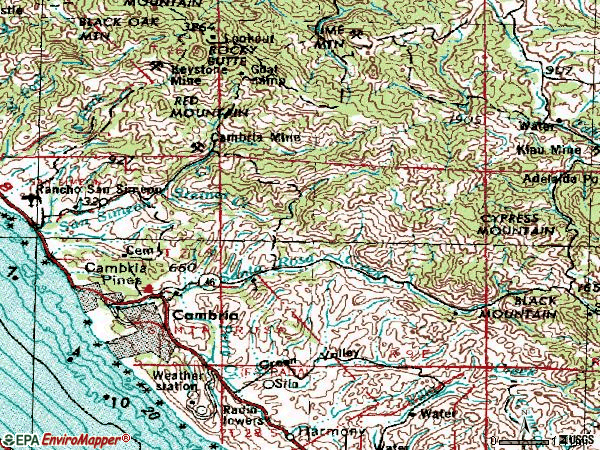
Notable locations in zip code 93428: Camp Yeager (A), Camp Ocean Pines (B), Crows Nest (C), Leffingwell Landing (D), Cambria Community Service Center (E), Cambria Chamber of Commerce (F), Cambria Branch San Luis Obispo City-County Library (G), Allied Arts Gallery (H), Cambria Community Healthcare District (I), California Department of Forestry and Fire Protection Station 10 Cambria (J), Cambria Fire Department (K). Display/hide their locations on the map
Streams, rivers, and creeks: Green Valley Creek (A), Van Gordon Creek (B), Steiner Creek (C), South Fork San Simeon Creek (D), Santa Rosa Creek (E), Rioly Run (F), Perry Creek (G), North Fork San Simeon Creek (H), Leffingwell Creek (I). Display/hide their locations on the map
In group quarters: 4 (-1 institutionalized population)
Size of family households: 1,171 2-persons, 278 3-persons, 161 4-persons, 91 5-persons, 27 6-persons, 27 7-or-more-persons
Size of nonfamily households: 1,031 1-person, 133 2-persons, 31 3-persons
539 married couples with children.
88 single-parent households (66 men, 22 women).
80.7% of residents of 93428 zip code speak English at home.
17.9% of residents speak Spanish at home (61% very well, 13% well, 17% not well, 8% not at all).
1.5% of residents speak other Indo-European language at home (91% very well, 9% well).
0.6% of residents speak Asian or Pacific Island language at home (52% very well, 48% well).
0.1% of residents speak other language at home (100% very well).
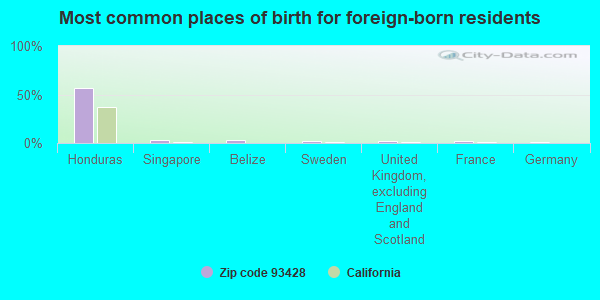
Foreign born population: 716 (11.9%) (53.5% of them are naturalized citizens)
This zip code:
11.9%
Whole state:
26.7%
57%Honduras
3%Singapore
3%Belize
2%Sweden
2%United Kingdom, excluding England and Scotland
2%France
2%Germany
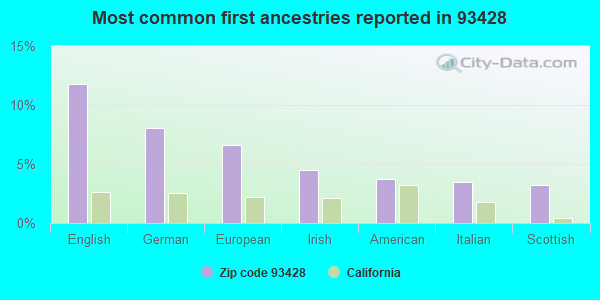
12%English
8%German
7%European
4%Irish
4%American
3%Italian
3%Scottish
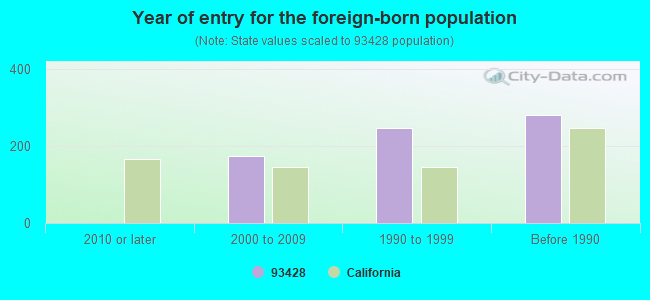
Year of entry for the foreign-born population
02010 or later
1752000 to 2009
2461990 to 1999
280Before 1990
Facilities with environmental interests located in this zip code:
LEFFINGWELL CONT. HIGH (2820 SANTA ROSA CREEK RD. in CAMBRIA, CA)
(National Center for Education Statistics) - STATE ID-4030144 Organizations: COAST UNIFIED (SCHOOL DISTRICT)
CAMBRIA COMMUNITY DAY (2840 SANTA ROSA CREEK ROAD in CAMBRIA, CA)
(National Center for Education Statistics) - STATE ID-4030219 Organizations: COAST UNIFIED (SCHOOL DISTRICT)
CAMBRIA ELEMENTARY (1350 MAIN ST. in CAMBRIA, CA)
(National Center for Education Statistics) - STATE ID-6042972 Organizations: COAST UNIFIED (SCHOOL DISTRICT)
CAMBRIA MAINTENANCE STATION (3130 HWY 46 in CAMBRIA, CA)
Small Quantity Generators, between 100 kg and 1000 kg of hazardous waste/month (Resource Conservation and Recovery Act (tracking hazardous waste)) Organizations: CALTRANS (CONTACT/OPERATOR)
Alternative names: CALTRANS DISTRICT 05
CAMBRIA WASTEWATER PLANT (5500 HEATH LN in CAMBRIA, CA)
Small Quantity Generators, between 100 kg and 1000 kg of hazardous waste/month (Resource Conservation and Recovery Act (tracking hazardous waste)) - notification
JUST FINISHED (2405 F VILLAGE LN. in CAMBRIA, CA)
CRITERIA AND HAZARDOUS AIR POLLUTANT INVENTORY (Inventory of air pollution sources) Business SIC classification: WOOD HOUSEHOLD FURNITURE, EXCEPT UPHOLSTERED
CAMBRIA AUTO RESTORATION (2485 VILLAGE LANE in CAMBRIA, CA)
CRITERIA AND HAZARDOUS AIR POLLUTANT INVENTORY (Inventory of air pollution sources) Business SIC classification: TOP, BODY, AND UPHOLSTERY REPAIR SHOPS AND PAINT SHOPS
CAMBRIA GENERAL STORE (850 MAIN STREET in CAMBRIA, CA)
CRITERIA AND HAZARDOUS AIR POLLUTANT INVENTORY (Inventory of air pollution sources) Business SIC classification: GASOLINE SERVICE STATIONS
CAMBRIA ROCK/S&G (2000 SAN SIMEON CRK RD in CAMBRIA, CA)
CRITERIA AND HAZARDOUS AIR POLLUTANT INVENTORY (Inventory of air pollution sources) Business SIC classification: CONSTRUCTION SAND AND GRAVEL
Housing units lacking complete plumbing facilities: 0.1% Housing units lacking complete kitchen facilities: 1.1%
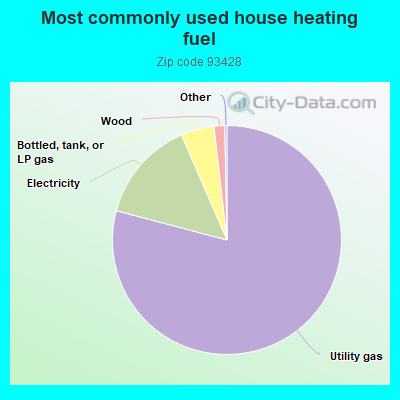
79.2%Utility gas
14.4%Electricity
4.7%Bottled, tank, or LP gas
1.5%Wood
Population in 1990: 5,635. Population change in the 1990s: +880 (+15.6%).
Place of birth for U.S.-born residents:
This state: 3,468
Northeast: 420
Midwest: 555
South: 548
West: 241
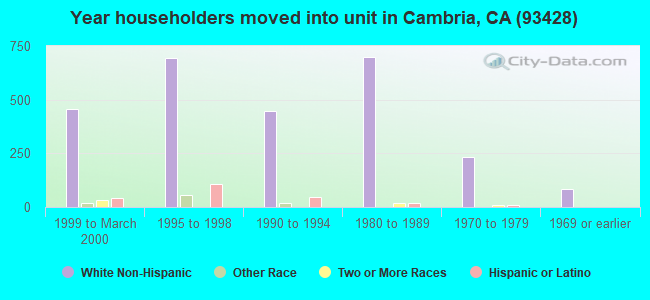
55% of the 93428 zip code residents lived in the same house 5 years ago. Out of people who lived in different houses, 45% lived in this county. Out of people who lived in different counties, 50% lived in California.
86% of the 93428 zip code residents lived in the same house 1 year ago. Out of people who lived in different houses, 32% moved from this county. Out of people who lived in different houses, 60% moved from different county within same state. Out of people who lived in different houses, 8% moved from different state.
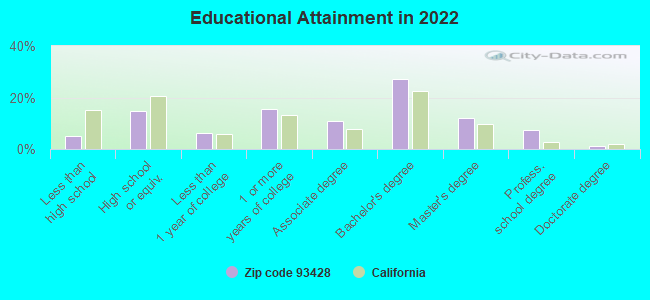
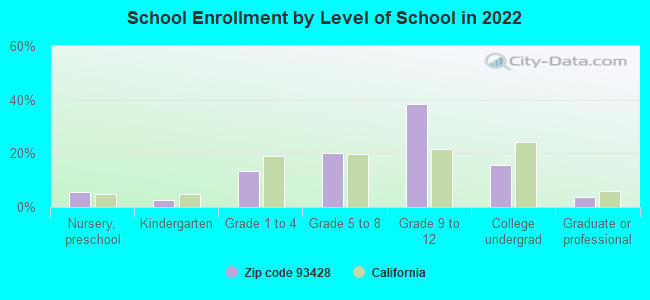
Private vs. public school enrollment:
Students in private schools in grades 1 to 8 (elementary and middle school): 62
Here:
22.8%
California:
10.5%
Students in private schools in grades 9 to 12 (high school): 15
Here:
5.1%
California:
8.5%
Students in private undergraduate colleges:
Here:
0.0%
California:
15.9%
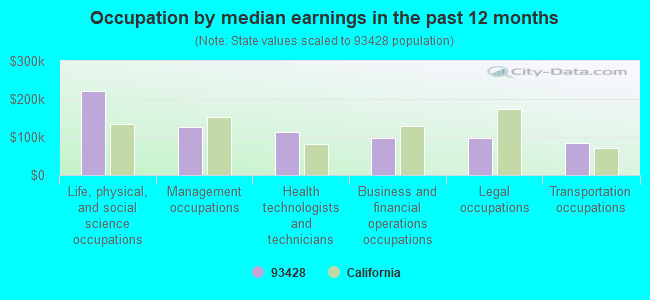
Occupation by median earnings in the past 12 months ($)
221,087Life, physical, and social science occupations
126,917Management occupations
111,947Health technologists and technicians
97,221Business and financial operations occupations
96,655Legal occupations
84,248Transportation occupations
Companies with federal contracts located in this zip code:
RAGAN, JAMES ASSOCIATES (385 LANCASTER ST in CAMBRIA, CA; small business) : $40,548 in 2 contractsin 2005
$20,274 with Army for Public Relations Services(includes writing services, event planning and management, media relations, radio and television analysis, and press services). Signed on 2005-07-20. Completion date: 2005-10-31.
$20,274 with U.S. Army Corps of Engineers - civil program financing only for Public Relations Services(includes writing services, event planning and management, media relations, radio and television analysis, and press services). Signed on 2005-07-20. Completion date: 2005-10-31.
JENNIFER F SMITH (465 NORFOLK ST in CAMBRIA, CA; small business)
$30,310 with Army for Lease or Rental of Equipment -- Toiletries. Signed on 2001-04-26. Completion date: 2001-08-13.
JAMES F JENKINS PE (329 DRAKE ST in CAMBRIA, CA; small business)
$23,768 with Navy for Engineering and Technical Services. Signed on 2005-09-16. Completion date: 2006-02-28.
Top industries in this zip code by the number of employees in 2005:
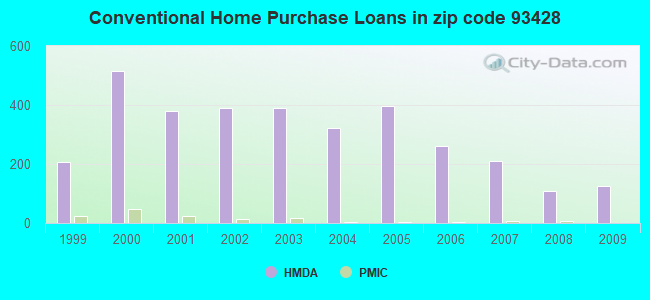
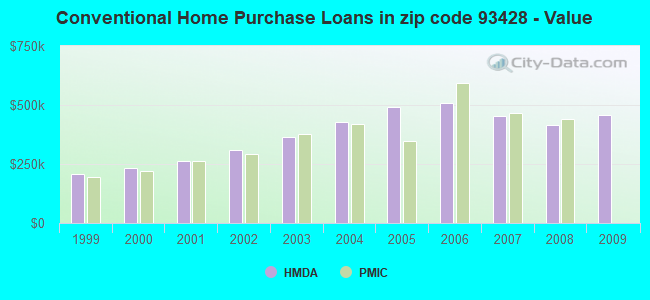
Detailed PMIC statistics for the following Tracts:0104.00
, 0108.00
2005 - 2018 National Fire Incident Reporting System (NFIRS) incidents
According to the data from the years 2005 - 2018 the average number of fire incidents per year is 13. The highest number of fire incidents - 29 took place in 2015, and the least - 2 in 2005. The data has a rising trend.
When looking into fire subcategories, the most incidents belonged to: Outside Fires (69.1%), and Structure Fires (17.7%).
Fire incident types reported to NFIRS in Zip Code 93428


+$528
-$7,562
 Nearest zip codes: 93430, 93452, 93426, 93442, 93465, 93446.


 According to the data from the years 2005 - 2018 the average number of fire incidents per year is 13. The highest number of fire incidents - 29 took place in 2015, and the least - 2 in 2005. The data has a rising trend.
 When looking into fire subcategories, the most incidents belonged to: Outside Fires (69.1%), and Structure Fires (17.7%).