Estimated zip code population in 2022: 3,012 Zip code population in 2010: 3,862 Zip code population in 2000: 3,455
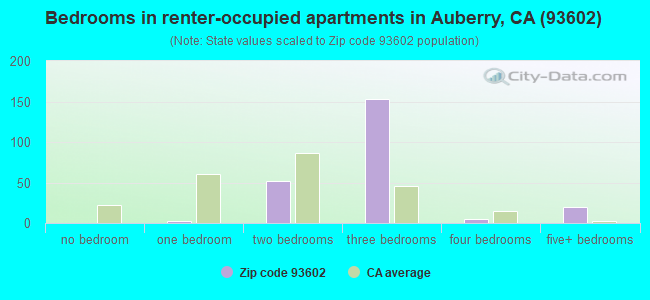
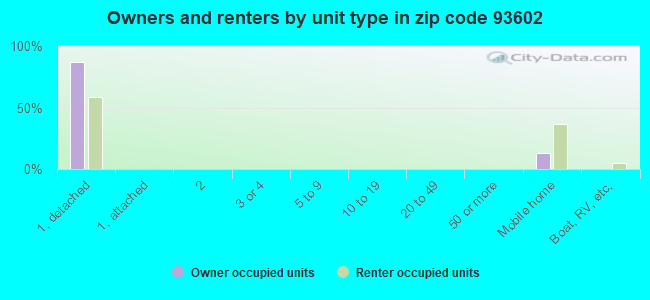
Houses and condos: 1,628 Renter-occupied apartments: 232
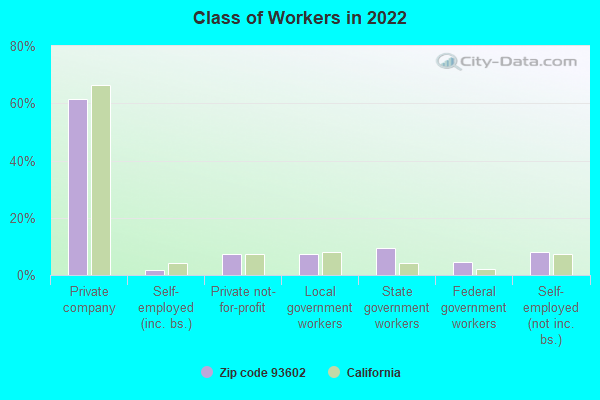
% of renters here:
20%
State:
44%
March 2022 cost of living index in zip code 93602: 96.2 (near average, U.S. average is 100)
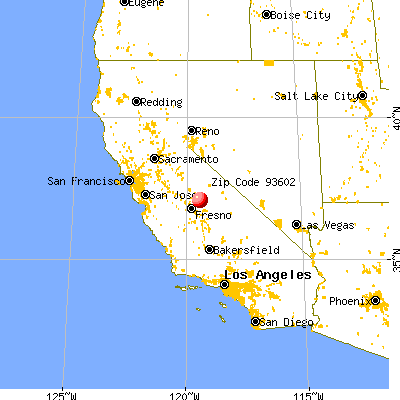
Land area: 143.6 sq. mi. Water area: 0.6 sq. mi.
Population density: 21 people per square mile
(very low).
OSM Map
General Map
Google Map
MSN Map
OSM Map
General Map
Google Map
MSN Map
OSM Map
General Map
Google Map
MSN Map
OSM Map
General Map
Google Map
MSN Map
Please wait while loading the map...
Real estate property taxes paid for housing units in 2022:
This zip code:
0.7% ($2,420)
California:
0.7% ($4,831)
Median real estate property taxes paid for housing units with mortgages in 2022: $2,512 (0.7%) Median real estate property taxes paid for housing units with no mortgage in 2022: $2,375 (0.6%)
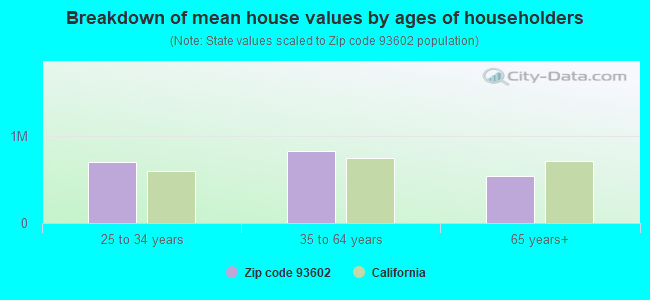
Estimated median house/condo value in 2022: $368,537
93602:
$368,537
California:
$715,900
According to our research of California and other state lists, there were 2 registered sex offenders living in 93602 zip code as of April 27, 2024. The ratio of all residents to sex offenders in zip code 93602 is 2,105 to 1. The ratio of registered sex offenders to all residents in this zip code is much lower than the state average.
Median resident age:
This zip code:
49.4 years
California median age:
37.9 years
Average household size:
This zip code:
2.6 people
California:
2.8 people
Averages for the 2020 tax year for zip code 93602, filed in 2021:
Average Adjusted Gross Income (AGI) in 2020: $71,319 (Individual Income Tax Returns)
Here:
$71,319
State:
$95,910
Salary/wage: $60,846 (reported on 72.6% of returns)
Here:
$60,846
State:
$77,331
(% of AGI for various income ranges: 1132.2% for AGIs below $25k, 3448.2% for AGIs $25k-50k, 6883.1% for AGIs $50k-75k, 9423.3% for AGIs $75k-100k, 18347.5% for AGIs $100k-200k, 72040.0% for AGIs over 200k)
Taxable interest for individuals: $808 (reported on 41.1% of returns)
This zip code:
$808
California:
$2,294
(% of AGI for various income ranges: 13.7% for AGIs below $25k, 35.0% for AGIs $25k-50k, 71.5% for AGIs $50k-75k, 107.8% for AGIs $75k-100k, 110.0% for AGIs $100k-200k, 245.0% for AGIs over 200k)
Ordinary dividends: $4,636 (reported on 15.1% of returns)
Here:
$4,636
State:
$10,949
(% of AGI for various income ranges: 24.4% for AGIs below $25k, 35.0% for AGIs $25k-50k, 82.3% for AGIs $50k-75k, 201.1% for AGIs $75k-100k, 283.3% for AGIs $100k-200k, 1245.0% for AGIs over 200k)
Net capital gain/loss in AGI: +$11,404 (reported on 17.1% of returns)
Here:
+$11,404
State:
+$49,306
(% of AGI for various income ranges: 6.7% for AGIs below $25k, 41.4% for AGIs $25k-50k, 92.3% for AGIs $50k-75k, 140.0% for AGIs $75k-100k, 593.3% for AGIs $100k-200k, 8920.0% for AGIs over 200k)
Profit/loss from business: +$17,775 (reported on 16.4% of returns)
Here:
+$17,775
State:
+$15,671
(% of AGI for various income ranges: 103.0% for AGIs below $25k, 173.6% for AGIs $25k-50k, 510.0% for AGIs $50k-75k, 411.1% for AGIs $75k-100k, 2144.2% for AGIs $100k-200k)
Taxable individual retirement arrangement distribution: $22,925 (reported on 11.0% of returns)
93602:
$22,925
California:
$23,505
(% of AGI for various income ranges: 220.5% for AGIs $25k-50k, 421.5% for AGIs $50k-75k, 432.2% for AGIs $75k-100k, 1871.7% for AGIs $100k-200k)
Total itemized deductions: $41,176 (reported on 11.6% of returns)
Here:
$41,176
State:
$39,517
(% of AGI for various income ranges: 372.6% for AGIs below $25k, 668.5% for AGIs $50k-75k, 1133.3% for AGIs $75k-100k, 2393.3% for AGIs $100k-200k, 6165.0% for AGIs over 200k)
Charity contributions: $7,070 (reported on 6.8% of returns)
Here:
$7,070
State:
$12,598
(% of AGI for various income ranges: 31.5% for AGIs $50k-75k, 323.3% for AGIs $100k-200k, 1390.0% for AGIs over 200k)
Taxes paid: $7,900 (reported on 10.3% of returns)
93602:
$7,900
State:
$8,807
(% of AGI for various income ranges: 272.3% for AGIs $50k-75k, 414.2% for AGIs $100k-200k, 1670.0% for AGIs over 200k)
Earned income credit: $1,925 (reported on 13.7% of returns)
Here:
$1,925
State:
$2,074
(% of AGI for various income ranges: 64.1% for AGIs below $25k, 96.4% for AGIs $25k-50k)
Percentage of individuals using paid preparers for their 2020 taxes: 91.8%
Here:
92%
State:
92%
(% for various income ranges: 90.5% for AGIs below $25k, 93.8% for AGIs $25k-50k, 91.3% for AGIs $50k-75k, 93.8% for AGIs $75k-100k, 92.0% for AGIs $100k-200k, 87.5% for AGIs over 200k)
Averages for the 2012 tax year for zip code 93602, filed in 2013:
Average Adjusted Gross Income (AGI) in 2012: $57,596 (Individual Income Tax Returns)
Here:
$57,596
State:
$72,726
Salary/wage: $49,888 (reported on 75.9% of returns)
Here:
$49,888
State:
$59,079
(% of AGI for various income ranges: 59.0% for AGIs below $25k, 64.8% for AGIs $25k-50k, 65.4% for AGIs $50k-75k, 64.7% for AGIs $75k-100k, 71.4% for AGIs $100k-200k, 56.3% for AGIs over 200k)
Taxable interest for individuals: $687 (reported on 44.5% of returns)
This zip code:
$687
California:
$2,146
(% of AGI for various income ranges: 2.2% for AGIs below $25k, 0.2% for AGIs $25k-50k, 0.4% for AGIs $50k-75k, 0.4% for AGIs $75k-100k, 0.4% for AGIs $100k-200k, 0.4% for AGIs over 200k)
Ordinary dividends: $2,752 (reported on 18.2% of returns)
Here:
$2,752
State:
$9,308
(% of AGI for various income ranges: 2.4% for AGIs below $25k, 0.5% for AGIs $25k-50k, 1.0% for AGIs $50k-75k, 1.1% for AGIs $75k-100k, 0.7% for AGIs $100k-200k)
Net capital gain/loss in AGI: +$1,975 (reported on 14.6% of returns)
Here:
+$1,975
State:
+$30,460
(% of AGI for various income ranges: 1.5% for AGIs $75k-100k, 1.2% for AGIs $100k-200k)
Profit/loss from business: +$9,724 (reported on 18.2% of returns)
Here:
+$9,724
State:
+$17,064
(% of AGI for various income ranges: 11.5% for AGIs below $25k, 4.4% for AGIs $25k-50k, 2.6% for AGIs $50k-75k, 4.1% for AGIs $75k-100k, 1.5% for AGIs $100k-200k)
Taxable individual retirement arrangement distribution: $15,875 (reported on 11.7% of returns)
93602:
$15,875
California:
$19,557
(% of AGI for various income ranges: 3.0% for AGIs below $25k, 2.5% for AGIs $25k-50k, 3.7% for AGIs $50k-75k, 4.5% for AGIs $75k-100k, 3.8% for AGIs $100k-200k)
Total itemized deductions: $22,825 (24% of AGI, reported on 40.1% of returns)
Here:
$22,825
State:
$34,004
Here:
24.2% of AGI
State:
22.7% of AGI
(% of AGI for various income ranges: 14.2% for AGIs below $25k, 12.3% for AGIs $25k-50k, 15.1% for AGIs $50k-75k, 17.0% for AGIs $75k-100k, 17.3% for AGIs $100k-200k, 16.5% for AGIs over 200k)
Charity contributions: $3,139 (reported on 33.6% of returns)
Here:
$3,139
State:
$4,659
(% of AGI for various income ranges: 1.3% for AGIs below $25k, 1.0% for AGIs $25k-50k, 1.4% for AGIs $50k-75k, 1.9% for AGIs $75k-100k, 2.1% for AGIs $100k-200k, 2.9% for AGIs over 200k)
Taxes paid: $7,000 (reported on 40.1% of returns)
93602:
$7,000
State:
$14,448
(% of AGI for various income ranges: 2.0% for AGIs below $25k, 2.8% for AGIs $25k-50k, 3.9% for AGIs $50k-75k, 4.4% for AGIs $75k-100k, 6.1% for AGIs $100k-200k, 7.3% for AGIs over 200k)
Earned income credit: $2,191 (reported on 16.1% of returns)
Here:
$2,191
State:
$2,286
(% of AGI for various income ranges: 5.8% for AGIs below $25k, 1.1% for AGIs $25k-50k)
Percentage of individuals using paid preparers for their 2012 taxes: 58.4%
Here:
58%
State:
64%
(% for various income ranges: 46.9% for AGIs below $25k, 57.1% for AGIs $25k-50k, 66.7% for AGIs $50k-75k, 64.3% for AGIs $75k-100k, 68.2% for AGIs $100k-200k, 100.0% for AGIs over 200k)
Averages for the 2004 tax year for zip code 93602, filed in 2005:
Average Adjusted Gross Income (AGI) in 2004: $46,960 (Individual Income Tax Returns)
Here:
$46,960
State:
$58,600
Salary/wage: $40,732 (reported on 79.0% of returns)
Here:
$40,732
State:
$49,455
(% of AGI for various income ranges: 117.6% for AGIs below $10k, 63.6% for AGIs $10k-25k, 70.3% for AGIs $25k-50k, 73.7% for AGIs $50k-75k, 76.9% for AGIs $75k-100k, 58.6% for AGIs over 100k)
Taxable interest for individuals: $1,080 (reported on 52.5% of returns)
This zip code:
$1,080
California:
$2,365
(% of AGI for various income ranges: 7.8% for AGIs below $10k, 1.8% for AGIs $10k-25k, 1.7% for AGIs $25k-50k, 0.8% for AGIs $50k-75k, 0.9% for AGIs $75k-100k, 1.0% for AGIs over 100k)
Taxable dividends: $2,017 (reported on 22.8% of returns)
Here:
$2,017
State:
$4,746
(% of AGI for various income ranges: 7.6% for AGIs below $10k, 1.5% for AGIs $10k-25k, 0.9% for AGIs $25k-50k, 0.6% for AGIs $50k-75k, 0.8% for AGIs $75k-100k, 1.0% for AGIs over 100k)
Net capital gain/loss: +$11,248 (reported on 20.0% of returns)
Here:
+$11,248
State:
+$23,418
(% of AGI for various income ranges: -7.1% for AGIs below $10k, 0.6% for AGIs $10k-25k, 1.1% for AGIs $25k-50k, 0.7% for AGIs $50k-75k, 1.8% for AGIs $75k-100k, 12.9% for AGIs over 100k)
Profit/loss from business: +$11,934 (reported on 20.6% of returns)
Here:
+$11,934
State:
+$16,826
(% of AGI for various income ranges: 11.2% for AGIs below $10k, 6.2% for AGIs $10k-25k, 5.6% for AGIs $25k-50k, 5.6% for AGIs $50k-75k, 3.6% for AGIs $75k-100k, 5.2% for AGIs over 100k)
IRA payment deduction: $3,184 (reported on 2.5% of returns)
93602:
$3,184
California:
$3,192
(% of AGI for various income ranges: 0.8% for AGIs $10k-25k, 0.2% for AGIs $50k-75k, 0.3% for AGIs $75k-100k)
Self-employed pension: $6,438 (reported on 1.0% of returns)
Here:
$6,438
California:
$17,688
Total itemized deductions: $19,561 (25% of AGI, reported on 39.2% of returns)
Here:
$19,561
State:
$28,113
Here:
25.2% of AGI
State:
25.3% of AGI
(% of AGI for various income ranges: 27.7% for AGIs below $10k, 17.6% for AGIs $10k-25k, 14.9% for AGIs $25k-50k, 16.0% for AGIs $50k-75k, 16.3% for AGIs $75k-100k, 16.6% for AGIs over 100k)
Charity contributions deductions: $2,539 (3% of AGI, reported on 33.9% of returns)
Here:
$2,539
State:
$3,923
Here:
3.2% of AGI
State:
3.3% of AGI
(% of AGI for various income ranges: 0.8% for AGIs below $10k, 1.7% for AGIs $10k-25k, 1.6% for AGIs $25k-50k, 1.7% for AGIs $50k-75k, 2.1% for AGIs $75k-100k, 2.0% for AGIs over 100k)
Total tax: $6,591 (reported on 77.4% of returns)
93602:
$6,591
State:
$10,761
(% of AGI for various income ranges: 5.0% for AGIs below $10k, 4.1% for AGIs $10k-25k, 6.3% for AGIs $25k-50k, 9.2% for AGIs $50k-75k, 10.5% for AGIs $75k-100k, 16.8% for AGIs over 100k)
Earned income credit: $1,796 (reported on 12.4% of returns)
Here:
$1,796
State:
$1,763
Percentage of individuals using paid preparers for their 2004 taxes: 62.0%
Here:
62%
State:
66%
(% for various income ranges: 42.4% for AGIs below $10k, 58.0% for AGIs $10k-25k, 62.5% for AGIs $25k-50k, 69.1% for AGIs $50k-75k, 77.7% for AGIs $75k-100k, 81.4% for AGIs over 100k)
Household received Food Stamps/SNAP in the past 12 months: 77 Household did not receive Food Stamps/SNAP in the past 12 months: 1,080
Women who had a birth in the past 12 months: 8 (4 now married, 4 unmarried) Women who did not have a birth in the past 12 months: 548 (309 now married, 235 unmarried)
Housing units in zip code 93602 with a mortgage: 483 (20 second mortgage, 20 both second mortgage and home equity loan) Houses without a mortgage: 3
Median monthly owner costs for units with a mortgage: $1,871 Median monthly owner costs for units without a mortgage: $555
Residents with income below the poverty level in 2022:
This zip code:
10.0%
Whole state:
12.2%
Residents with income below 50% of the poverty level in 2022:
This zip code:
7.2%
Whole state:
6.2%
Median number of rooms in houses and condos:
Here:
5.6
State:
6.0
Median number of rooms in apartments:
Here:
5.8
State:
3.9
Notable locations in this zip code not listed on our city pages
Notable locations in zip code 93602: Mountain Rest Guard Station (A), Auberry Forest Service Station (B), Camp Mo-Wa-Ha (C), Auberry Guard (D), Black Rock Station (E), Fence Meadow Lookout (F), Lerona Fire Lane (G), Oakie Bear Campground (H), Prescott Mill (I), Mountain Rest Station (J), Nutmeg Campground (K), Oak Flat Campground (L), Ross Crossing Campground (M), Powerhouse (N), Auberry Volunteer Fire Department (O), Bald Mountain Volunteer Fire Department (P). Display/hide their locations on the map
Creeks: Oak Flat Creek (A), Tollhouse Creek (B), Jose Creek (C), Deer Creek (D), Ross Creek (E), Patterson Creek (F), Musick Creek (G), Mill Creek (H), Lost Creek (I). Display/hide their locations on the map
In group quarters: 10 (-1 institutionalized population)
Size of family households: 523 2-persons, 103 3-persons, 109 4-persons, 129 5-persons, 6 6-persons, 16 7-or-more-persons
Size of nonfamily households: 258 1-person, 15 2-persons, 11 3-persons
372 married couples with children.
94 single-parent households (34 men, 60 women).
96.2% of residents of 93602 zip code speak English at home.
2.2% of residents speak Spanish at home (100% very well).
1.5% of residents speak other Indo-European language at home (57% very well, 11% well, 32% not at all).
0.1% of residents speak Asian or Pacific Island language at home (100% well).
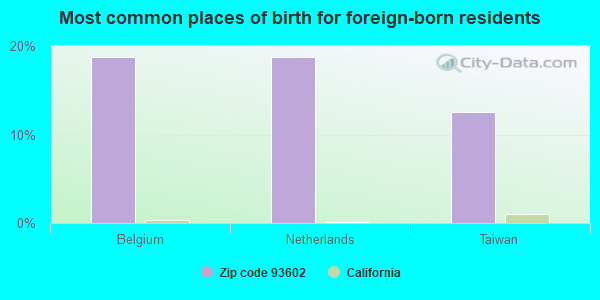
Foreign born population: 17 (0.6%) (82.6% of them are naturalized citizens)
This zip code:
0.6%
Whole state:
26.7%
19%Belgium
19%Netherlands
12%Taiwan
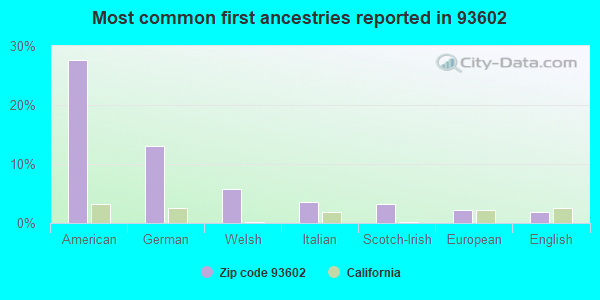
28%American
13%German
6%Welsh
4%Italian
3%Scotch-Irish
2%European
2%English
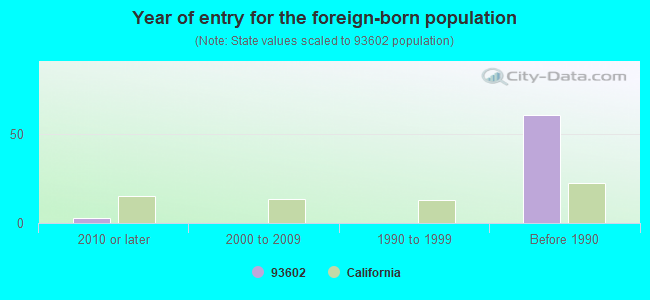
Year of entry for the foreign-born population
32010 or later
02000 to 2009
01990 to 1999
61Before 1990
Facilities with environmental interests located in this zip code:
BALCH CAMP ELEMENTARY (36000 TRIMMER SPRINGS ROAD in AUBERRY, CA)
(National Center for Education Statistics) - STATE ID-6007355 Organizations: SIERRA UNIFIED (SCHOOL DISTRICT)
KNSO (42205 RADIO LANE in AUBERRY, CA)
Small Quantity Generators, between 100 kg and 1000 kg of hazardous waste/month (Resource Conservation and Recovery Act (tracking hazardous waste)) Organizations: TELEMUNDO NETWORK GROUP LLC (CONTACT/OPERATOR)
, BECKMAN AND KENNY TELECOM LLC (CONTACT/OWNER)
HAZEL H HEUSSER TRUST (41990 RADIO LN in AUBERRY, CA)
CRITERIA AND HAZARDOUS AIR POLLUTANT INVENTORY (Inventory of air pollution sources) Business SIC classification: ARCHITECTURAL SERVICES
JOB CORPS SITE (2 SITES S SIDE 21N30 1 MI NE/O in ALDER SPRINGS, CA)
CRITERIA AND HAZARDOUS AIR POLLUTANT INVENTORY (Inventory of air pollution sources) Business SIC classification: REFUSE SYSTEMS Business NAICS classification: SOLID WASTE LANDFILL.
MEADOW LAKES DISTRICT DISPOSAL SITE (FS RD 9S08 1 MI N/O AUBERRY RD in AUBERRY, CA)
CRITERIA AND HAZARDOUS AIR POLLUTANT INVENTORY (Inventory of air pollution sources) Business SIC classification: REFUSE SYSTEMS Business NAICS classification: SOLID WASTE LANDFILL.
Housing units lacking complete plumbing facilities: 5.3% Housing units lacking complete kitchen facilities: 4.5%
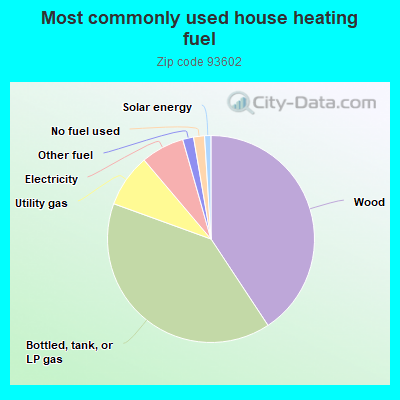
40.8%Wood
39.9%Bottled, tank, or LP gas
8.3%Utility gas
6.8%Electricity
1.7%Other fuel
1.7%No fuel used
1.0%Solar energy
Population in 1990: 3,179. Population change in the 1990s: +276 (+8.7%).
Place of birth for U.S.-born residents:
This state: 2,596
Northeast: 31
Midwest: 111
South: 45
West: 157
61% of the 93602 zip code residents lived in the same house 5 years ago. Out of people who lived in different houses, 72% lived in this county. Out of people who lived in different counties, 50% lived in California.
93% of the 93602 zip code residents lived in the same house 1 year ago. Out of people who lived in different houses, 91% moved from this county. Out of people who lived in different houses, 5% moved from different county within same state.
Private vs. public school enrollment:
Students in private schools in grades 1 to 8 (elementary and middle school): 12
Here:
4.2%
California:
10.5%
Students in private schools in grades 9 to 12 (high school): 6
Here:
7.3%
California:
8.5%
Students in private undergraduate colleges: 22
Here:
31.8%
California:
15.9%
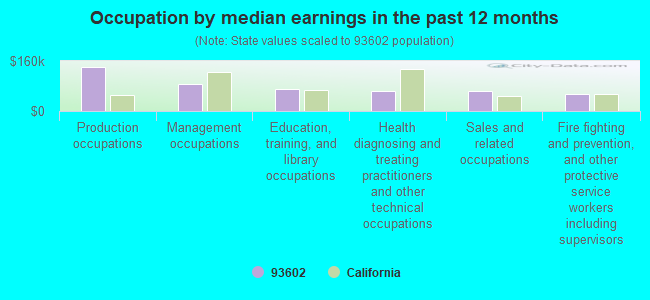
Occupation by median earnings in the past 12 months ($)
140,969Production occupations
85,502Management occupations
70,779Education, training, and library occupations
64,805Health diagnosing and treating practitioners and other technical occupations
62,751Sales and related occupations
55,348Fire fighting and prevention, and other protective service workers including supervisors
Companies with federal contracts located in this zip code:
SIERRA HYDROGRAPHICS (42163 BALD MOUNTAIN RD in AUBERRY, CA; small business) : $3,207,064 in 22 contractsfrom 2000 to 2006
Contracts for Other Special Studies and Analyses, Environmental Studies and Assessments, Other Natural Resources and Conservation Services by U.S. Army Corps of Engineers - civil program financing only, Army Signed by year:2000: $180,357; 2001: $0; 2002: $912,824; 2003: $276,512; 2004: $834,008; 2005: $933,376; 2006: $69,987.
Biggest contracts:
$813,712 with U.S. Army Corps of Engineers - civil program financing only for Other Special Studies and Analyses. Signed on 2002-04-03. Completion date: 2003-04-02.
$493,358 with Army for Other Special Studies and Analyses. Signed on 2005-10-04. Completion date: 2006-09-30.
$417,004 with Army for Environmental Studies and Assessments. Signed on 2004-03-30. Completion date: 2005-04-02.
$417,004 with U.S. Army Corps of Engineers - civil program financing only for Environmental Studies and Assessments. Signed on 2004-03-30. Completion date: 2005-04-02.
WINKENBACH CONSTRUCTION INC (35356 DRAGONFLY LANE in AUBERRY, CA; small business) : $1,191,017 in 5 contractsfrom 2000 to 2001
Contracts for Maintenance, Repair or Alteration of Real Property -- Pollution Abatement and Control Facilities by Navy Signed by year:2000: $894,045; 2001: $296,972; 2002: $0; 2003: $0; 2004: $0; 2005: $0; 2006: $0.
Biggest contracts:
$894,045 with Navy for Maintenance, Repair or Alteration of Real Property -- Pollution Abatement and Control Facilities. Signed on 2000-07-18. Completion date: 2001-01-29.
$165,686, same as above.Signed on 2001-03-02. Completion date: 2001-03-15.
$112,062, same as above.Signed on 2001-04-18. Completion date: 2001-04-14.
$45,474, same as above.Signed on 2001-04-17. Completion date: 2001-04-14.
CENTRAL STATE, INC (33325 FRAZIER ROAD in AUBERRY, CA; small business) : $83,922 in 6 contractsfrom 2002 to 2005
Contracts for Maintenance, Repair or Alteration of Real Property -- Sewage and Waste Facilities, Miscellaneous Service and Trade Equipment by Navy Signed by year:2000: $0; 2001: $0; 2002: $16,055; 2003: $17,482; 2004: $18,028; 2005: $32,357; 2006: $0.
Biggest contracts:
$28,457 with Navy for Maintenance, Repair or Alteration of Real Property -- Sewage and Waste Facilities. Signed on 2005-10-26. Completion date: 2004-09-30.
$18,000, same as above.Signed on 2004-11-01. Completion date: 2004-09-30.
$17,482, same as above.Signed on 2003-09-30. Completion date: 2004-09-30.
$16,055 with Navy for Miscellaneous Service and Trade Equipment. Signed on 2002-10-22. Completion date: 2003-09-30.
Top industries in this zip code by the number of employees in 2005:
Health Care and Social Assistance: Residential Mental Retardation Facilities (100-249 employees: 1 establishment)
Arts, Entertainment, and Recreation: Casinos (except Casino Hotels) (100-249: 1)
Utilities: Hydroelectric Power Generation (20-49: 1, 1-4: 1)
Accommodation and Food Services: Full-Service Restaurants (20-49: 1)
Arts, Entertainment, and Recreation: Other Gambling Industries (20-49: 1)
Construction: Site Preparation Contractors (5-9: 2, 1-4: 1)
Administrative and Support and Waste Management and Remediation Services: Landscaping Services (10-19: 1)
Other Services (except Public Administration): General Automotive Repair (5-9: 2)
Construction: Plumbing, Heating, and Air-Conditioning Contractors (5-9: 1, 1-4: 1)
Other Services (except Public Administration): Religious Organizations (5-9: 1, 1-4: 1)
People in group quarters in 2010:
134 people in nursing facilities/skilled-nursing facilities
People in group quarters in 2000:
108 people in nursing homes
14 people in other noninstitutional group quarters
Fatal accident statistics in 2014:
Fatal accident count: 1
Vehicles involved in fatal accidents: 1
Fatal accidents caused by drunken drivers: 0
Fatalities: 1
Persons involved in fatal accidents: 2
Pedestrians involved in fatal accidents: 0
Fatal accident statistics in 2010:
Fatal accident count: 1
Vehicles involved in fatal accidents: 1
Fatal accidents caused by drunken drivers: 0
Fatalities: 1
Persons involved in fatal accidents: 2
Pedestrians involved in fatal accidents: 1
Home Mortgage Disclosure Act Aggregated Statistics For Year 2009 (Based on 2 partial tracts)
A) FHA, FSA/RHS & VA Home Purchase Loans
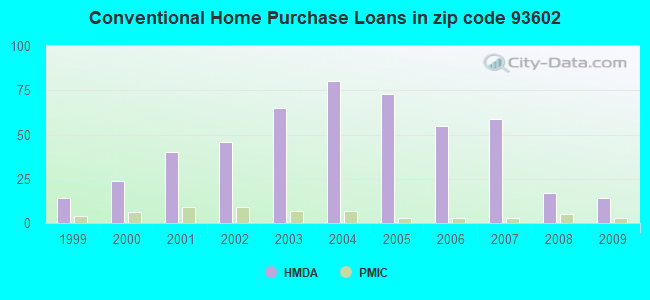
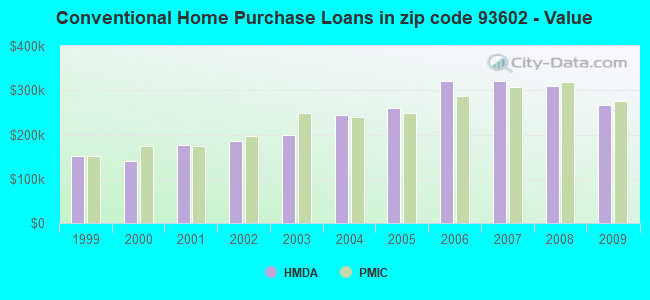
B) Conventional Home Purchase Loans
C) Refinancings
D) Home Improvement Loans
F) Non-occupant Loans on < 5 Family Dwellings (A B C & D)
G) Loans On Manufactured Home Dwelling (A B C & D)
Number
Average Value
Number
Average Value
Number
Average Value
Number
Average Value
Number
Average Value
Number
Average Value
LOANS ORIGINATED
10
$228,385
14
$265,881
52
$236,225
8
$112,341
4
$153,130
4
$153,615
APPLICATIONS APPROVED, NOT ACCEPTED
1
$202,770
2
$183,690
7
$231,647
0
$0
0
$0
2
$85,055
APPLICATIONS DENIED
2
$160,085
4
$360,510
25
$274,851
5
$115,712
2
$157,010
3
$77,293
APPLICATIONS WITHDRAWN
2
$241,580
2
$97,020
13
$266,258
2
$138,900
2
$176,740
3
$130,113
FILES CLOSED FOR INCOMPLETENESS
0
$0
1
$265,190
4
$313,618
1
$99,280
0
$0
0
$0
Aggregated Statistics For Year 2008 (Based on 2 partial tracts)
A) FHA, FSA/RHS & VA Home Purchase Loans
B) Conventional Home Purchase Loans
C) Refinancings
D) Home Improvement Loans
F) Non-occupant Loans on < 5 Family Dwellings (A B C & D)
G) Loans On Manufactured Home Dwelling (A B C & D)
Number
Average Value
Number
Average Value
Number
Average Value
Number
Average Value
Number
Average Value
Number
Average Value
LOANS ORIGINATED
5
$235,306
17
$309,132
45
$278,577
5
$201,220
5
$170,302
4
$125,560
APPLICATIONS APPROVED, NOT ACCEPTED
1
$285,890
4
$431,820
12
$269,554
1
$45,920
2
$563,850
1
$161,380
APPLICATIONS DENIED
1
$387,760
5
$247,724
40
$304,538
5
$69,336
5
$287,050
4
$125,318
APPLICATIONS WITHDRAWN
1
$326,310
3
$287,610
13
$258,521
1
$69,530
1
$339,250
1
$92,490
FILES CLOSED FOR INCOMPLETENESS
0
$0
1
$237,050
4
$375,548
0
$0
0
$0
0
$0
Aggregated Statistics For Year 2007 (Based on 2 partial tracts)
A) FHA, FSA/RHS & VA Home Purchase Loans
B) Conventional Home Purchase Loans
C) Refinancings
D) Home Improvement Loans
F) Non-occupant Loans on < 5 Family Dwellings (A B C & D)
G) Loans On Manufactured Home Dwelling (A B C & D)
Number
Average Value
Number
Average Value
Number
Average Value
Number
Average Value
Number
Average Value
Number
Average Value
LOANS ORIGINATED
1
$292,350
59
$321,323
70
$298,457
13
$122,395
11
$275,125
7
$152,830
APPLICATIONS APPROVED, NOT ACCEPTED
0
$0
10
$274,211
23
$272,865
5
$192,358
4
$278,285
5
$108,922
APPLICATIONS DENIED
0
$0
17
$379,843
54
$329,227
10
$237,279
5
$355,870
7
$141,834
APPLICATIONS WITHDRAWN
1
$175,930
11
$311,170
24
$308,672
2
$38,000
2
$248,370
1
$243,520
FILES CLOSED FOR INCOMPLETENESS
0
$0
1
$309,820
11
$378,495
2
$106,885
0
$0
0
$0
Aggregated Statistics For Year 2006 (Based on 2 partial tracts)
A) FHA, FSA/RHS & VA Home Purchase Loans
B) Conventional Home Purchase Loans
C) Refinancings
D) Home Improvement Loans
F) Non-occupant Loans on < 5 Family Dwellings (A B C & D)
G) Loans On Manufactured Home Dwelling (A B C & D)
Number
Average Value
Number
Average Value
Number
Average Value
Number
Average Value
Number
Average Value
Number
Average Value
LOANS ORIGINATED
1
$150,700
55
$320,795
90
$292,914
24
$139,547
13
$230,087
9
$146,572
APPLICATIONS APPROVED, NOT ACCEPTED
0
$0
16
$257,790
20
$295,232
5
$173,084
1
$255,160
1
$113,190
APPLICATIONS DENIED
0
$0
27
$287,431
42
$284,523
13
$193,119
5
$305,290
8
$146,015
APPLICATIONS WITHDRAWN
0
$0
10
$346,847
30
$291,340
3
$232,093
2
$162,025
2
$175,120
FILES CLOSED FOR INCOMPLETENESS
0
$0
4
$240,368
5
$315,380
1
$157,170
0
$0
0
$0
Aggregated Statistics For Year 2005 (Based on 2 partial tracts)
A) FHA, FSA/RHS & VA Home Purchase Loans
B) Conventional Home Purchase Loans
C) Refinancings
D) Home Improvement Loans
F) Non-occupant Loans on < 5 Family Dwellings (A B C & D)
G) Loans On Manufactured Home Dwelling (A B C & D)
Number
Average Value
Number
Average Value
Number
Average Value
Number
Average Value
Number
Average Value
Number
Average Value
LOANS ORIGINATED
0
$0
73
$258,764
119
$268,504
21
$138,508
16
$246,451
13
$140,256
APPLICATIONS APPROVED, NOT ACCEPTED
0
$0
19
$234,005
18
$258,325
3
$117,717
2
$331,160
3
$108,663
APPLICATIONS DENIED
1
$82,140
34
$238,726
47
$254,530
10
$142,619
5
$280,840
11
$137,239
APPLICATIONS WITHDRAWN
0
$0
21
$241,349
55
$243,450
7
$145,946
3
$282,437
4
$139,790
FILES CLOSED FOR INCOMPLETENESS
0
$0
4
$197,598
8
$223,792
2
$124,025
1
$213,770
1
$89,260
Aggregated Statistics For Year 2004 (Based on 2 partial tracts)
A) FHA, FSA/RHS & VA Home Purchase Loans
B) Conventional Home Purchase Loans
C) Refinancings
D) Home Improvement Loans
F) Non-occupant Loans on < 5 Family Dwellings (A B C & D)
G) Loans On Manufactured Home Dwelling (A B C & D)
Number
Average Value
Number
Average Value
Number
Average Value
Number
Average Value
Number
Average Value
Number
Average Value
LOANS ORIGINATED
0
$0
80
$244,547
113
$209,243
14
$108,362
13
$194,911
10
$124,250
APPLICATIONS APPROVED, NOT ACCEPTED
0
$0
11
$289,120
20
$210,663
3
$49,697
2
$132,430
3
$93,463
APPLICATIONS DENIED
1
$94,760
26
$245,087
46
$196,761
12
$115,158
5
$191,776
7
$77,616
APPLICATIONS WITHDRAWN
0
$0
14
$194,618
40
$201,527
4
$142,215
3
$175,713
3
$134,320
FILES CLOSED FOR INCOMPLETENESS
0
$0
5
$309,624
9
$195,513
1
$32,340
1
$304,640
0
$0
Aggregated Statistics For Year 2003 (Based on 2 partial tracts)
A) FHA, FSA/RHS & VA Home Purchase Loans
B) Conventional Home Purchase Loans
C) Refinancings
D) Home Improvement Loans
F) Non-occupant Loans on < 5 Family Dwellings (A B C & D)
Number
Average Value
Number
Average Value
Number
Average Value
Number
Average Value
Number
Average Value
LOANS ORIGINATED
2
$167,035
65
$199,727
221
$174,182
7
$56,317
16
$145,651
APPLICATIONS APPROVED, NOT ACCEPTED
0
$0
10
$188,833
30
$178,452
1
$59,180
3
$181,860
APPLICATIONS DENIED
0
$0
15
$145,789
62
$163,474
5
$55,430
2
$230,910
APPLICATIONS WITHDRAWN
0
$0
10
$163,026
43
$168,897
1
$162,670
3
$188,757
FILES CLOSED FOR INCOMPLETENESS
0
$0
6
$272,142
9
$194,004
0
$0
1
$127,420
Aggregated Statistics For Year 2002 (Based on 2 partial tracts)
A) FHA, FSA/RHS & VA Home Purchase Loans
B) Conventional Home Purchase Loans
C) Refinancings
D) Home Improvement Loans
F) Non-occupant Loans on < 5 Family Dwellings (A B C & D)
Number
Average Value
Number
Average Value
Number
Average Value
Number
Average Value
Number
Average Value
LOANS ORIGINATED
2
$142,620
46
$185,252
145
$168,565
3
$30,723
8
$127,864
APPLICATIONS APPROVED, NOT ACCEPTED
1
$40,100
5
$149,282
20
$163,883
1
$50,450
2
$61,770
APPLICATIONS DENIED
1
$82,140
10
$136,281
33
$156,232
3
$50,343
2
$145,205
APPLICATIONS WITHDRAWN
0
$0
11
$167,492
36
$156,768
0
$0
2
$108,825
FILES CLOSED FOR INCOMPLETENESS
0
$0
3
$249,340
7
$150,334
0
$0
0
$0
Aggregated Statistics For Year 2001 (Based on 2 partial tracts)
A) FHA, FSA/RHS & VA Home Purchase Loans
B) Conventional Home Purchase Loans
C) Refinancings
D) Home Improvement Loans
F) Non-occupant Loans on < 5 Family Dwellings (A B C & D)
Number
Average Value
Number
Average Value
Number
Average Value
Number
Average Value
Number
Average Value
LOANS ORIGINATED
5
$124,704
40
$175,315
87
$146,645
2
$33,795
5
$122,116
APPLICATIONS APPROVED, NOT ACCEPTED
0
$0
5
$146,758
12
$137,822
1
$35,570
2
$92,005
APPLICATIONS DENIED
2
$80,205
10
$97,731
28
$159,332
1
$28,780
2
$182,720
APPLICATIONS WITHDRAWN
1
$152,000
5
$145,078
27
$153,340
1
$51,740
1
$220,240
FILES CLOSED FOR INCOMPLETENESS
0
$0
2
$116,425
5
$171,596
1
$29,110
0
$0
Aggregated Statistics For Year 2000 (Based on 2 partial tracts)
A) FHA, FSA/RHS & VA Home Purchase Loans
B) Conventional Home Purchase Loans
C) Refinancings
D) Home Improvement Loans
F) Non-occupant Loans on < 5 Family Dwellings (A B C & D)
Number
Average Value
Number
Average Value
Number
Average Value
Number
Average Value
Number
Average Value
LOANS ORIGINATED
2
$125,640
24
$140,463
30
$107,725
6
$37,407
5
$85,702
APPLICATIONS APPROVED, NOT ACCEPTED
0
$0
5
$102,906
6
$157,172
2
$31,045
1
$97,990
APPLICATIONS DENIED
1
$88,610
8
$116,666
17
$137,806
2
$24,095
2
$96,375
APPLICATIONS WITHDRAWN
1
$151,670
3
$129,577
11
$106,045
1
$62,090
0
$0
FILES CLOSED FOR INCOMPLETENESS
0
$0
1
$85,050
3
$122,677
0
$0
1
$109,630
Aggregated Statistics For Year 1999 (Based on 1 partial tract)
A) FHA, FSA/RHS & VA Home Purchase Loans
B) Conventional Home Purchase Loans
C) Refinancings
D) Home Improvement Loans
F) Non-occupant Loans on < 5 Family Dwellings (A B C & D)
Detailed PMIC statistics for the following Tracts:0064.01
2002 - 2018 National Fire Incident Reporting System (NFIRS) incidents
Based on the data from the years 2002 - 2018 the average number of fires per year is 14. The highest number of reported fire incidents - 30 took place in 2015, and the least - 0 in 2003. The data has a growing trend.
When looking into fire subcategories, the most reports belonged to: Outside Fires (65.5%), and Mobile Property/Vehicle Fires (16.4%).
Fire incident types reported to NFIRS in Zip Code 93602


 Nearest zip codes: 93667, 93664, 93605, 93651, 93643, 93657.


 Based on the data from the years 2002 - 2018 the average number of fires per year is 14. The highest number of reported fire incidents - 30 took place in 2015, and the least - 0 in 2003. The data has a growing trend.
 When looking into fire subcategories, the most reports belonged to: Outside Fires (65.5%), and Mobile Property/Vehicle Fires (16.4%).