Estimated zip code population in 2022: 23,597 Zip code population in 2010: 23,833 Zip code population in 2000: 19,383
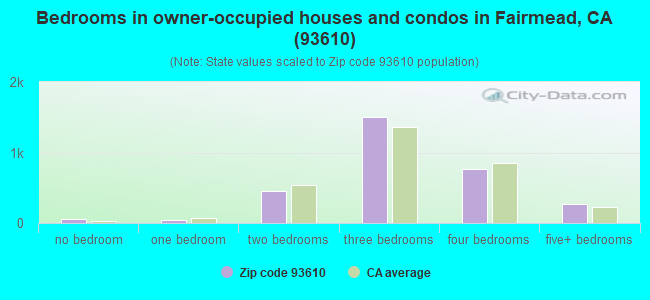
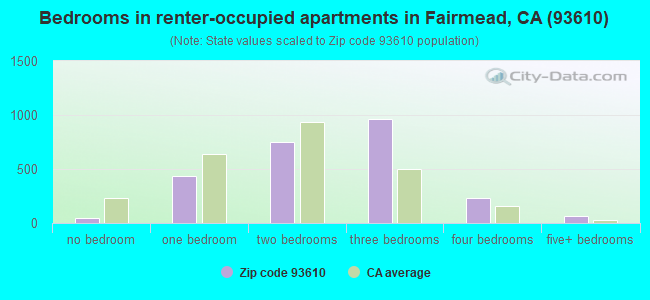
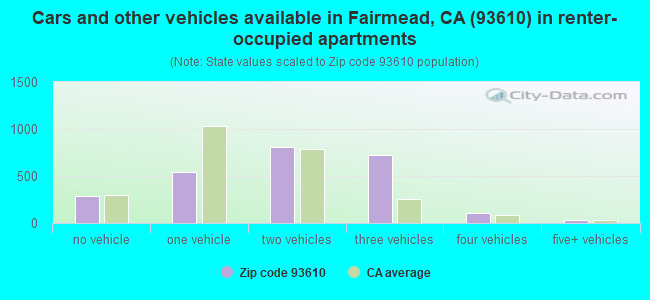
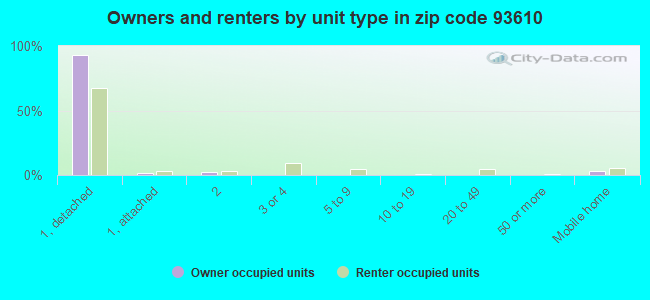
Houses and condos: 5,954 Renter-occupied apartments: 2,508
% of renters here:
45%
State:
44%
March 2022 cost of living index in zip code 93610: 94.8 (less than average, U.S. average is 100)
Land area: 272.2 sq. mi. Water area: 0.9 sq. mi.
Population density: 87 people per square mile
(very low).
OSM Map
General Map
Google Map
MSN Map
OSM Map
General Map
Google Map
MSN Map
OSM Map
General Map
Google Map
MSN Map
OSM Map
General Map
Google Map
MSN Map
Please wait while loading the map...
Real estate property taxes paid for housing units in 2022:
This zip code:
0.8% ($2,494)
California:
0.7% ($4,831)
Median real estate property taxes paid for housing units with mortgages in 2022: $2,549 (0.7%) Median real estate property taxes paid for housing units with no mortgage in 2022: $2,353 (0.8%)
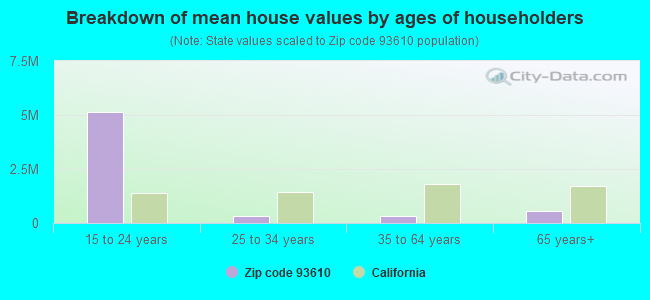
Estimated median house/condo value in 2022: $326,406
93610:
$326,406
California:
$715,900
According to our research of California and other state lists, there were 33 registered sex offenders living in 93610 zip code as of April 27, 2024. The ratio of all residents to sex offenders in zip code 93610 is 730 to 1. The ratio of registered sex offenders to all residents in this zip code is near the state average.
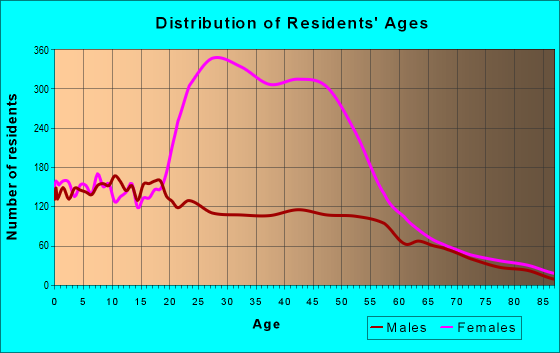
Median resident age:
This zip code:
35.2 years
California median age:
37.9 years
Average household size:
This zip code:
3.2 people
California:
2.8 people
Averages for the 2020 tax year for zip code 93610, filed in 2021:
Average Adjusted Gross Income (AGI) in 2020: $51,654 (Individual Income Tax Returns)
Here:
$51,654
State:
$95,910
Salary/wage: $44,690 (reported on 79.6% of returns)
Here:
$44,690
State:
$77,331
(% of AGI for various income ranges: 1345.2% for AGIs below $25k, 4212.1% for AGIs $25k-50k, 7691.0% for AGIs $50k-75k, 10613.5% for AGIs $75k-100k, 20622.1% for AGIs $100k-200k, 63705.0% for AGIs over 200k)
Taxable interest for individuals: $1,441 (reported on 28.1% of returns)
This zip code:
$1,441
California:
$2,294
(% of AGI for various income ranges: 9.2% for AGIs below $25k, 15.2% for AGIs $25k-50k, 33.5% for AGIs $50k-75k, 35.1% for AGIs $75k-100k, 113.5% for AGIs $100k-200k, 5070.0% for AGIs over 200k)
Ordinary dividends: $15,494 (reported on 6.5% of returns)
Here:
$15,494
State:
$10,949
(% of AGI for various income ranges: 10.3% for AGIs below $25k, 11.7% for AGIs $25k-50k, 40.8% for AGIs $50k-75k, 124.6% for AGIs $75k-100k, 247.1% for AGIs $100k-200k, 14855.0% for AGIs over 200k)
Net capital gain/loss in AGI: +$50,826 (reported on 7.3% of returns)
Here:
+$50,826
State:
+$49,306
(% of AGI for various income ranges: 8.1% for AGIs below $25k, 18.8% for AGIs $25k-50k, 161.8% for AGIs $50k-75k, 146.2% for AGIs $75k-100k, 766.5% for AGIs $100k-200k, 60552.5% for AGIs over 200k)
Profit/loss from business: +$13,242 (reported on 12.8% of returns)
Here:
+$13,242
State:
+$15,671
(% of AGI for various income ranges: 135.4% for AGIs below $25k, 182.0% for AGIs $25k-50k, 369.2% for AGIs $50k-75k, 315.1% for AGIs $75k-100k, 446.8% for AGIs $100k-200k, 6990.0% for AGIs over 200k)
Taxable individual retirement arrangement distribution: $16,417 (reported on 3.1% of returns)
93610:
$16,417
California:
$23,505
(% of AGI for various income ranges: 15.5% for AGIs below $25k, 31.3% for AGIs $25k-50k, 114.6% for AGIs $50k-75k, 191.1% for AGIs $75k-100k, 483.8% for AGIs $100k-200k)
Total itemized deductions: $36,516 (reported on 6.2% of returns)
Here:
$36,516
State:
$39,517
(% of AGI for various income ranges: 29.3% for AGIs below $25k, 97.9% for AGIs $25k-50k, 328.3% for AGIs $50k-75k, 703.5% for AGIs $75k-100k, 1457.1% for AGIs $100k-200k, 14815.0% for AGIs over 200k)
Charity contributions: $14,411 (reported on 4.8% of returns)
Here:
$14,411
State:
$12,598
(% of AGI for various income ranges: 14.0% for AGIs $25k-50k, 32.8% for AGIs $50k-75k, 101.4% for AGIs $75k-100k, 363.8% for AGIs $100k-200k, 8525.0% for AGIs over 200k)
Taxes paid: $7,831 (reported on 6.1% of returns)
93610:
$7,831
State:
$8,807
(% of AGI for various income ranges: 5.2% for AGIs below $25k, 18.9% for AGIs $25k-50k, 69.6% for AGIs $50k-75k, 185.1% for AGIs $75k-100k, 411.5% for AGIs $100k-200k, 1967.5% for AGIs over 200k)
Earned income credit: $2,326 (reported on 21.2% of returns)
Here:
$2,326
State:
$2,074
(% of AGI for various income ranges: 126.9% for AGIs below $25k, 103.7% for AGIs $25k-50k, 2.6% for AGIs $50k-75k)
Percentage of individuals using paid preparers for their 2020 taxes: 87.0%
Here:
87%
State:
92%
(% for various income ranges: 77.3% for AGIs below $25k, 91.9% for AGIs $25k-50k, 94.6% for AGIs $50k-75k, 94.9% for AGIs $75k-100k, 94.2% for AGIs $100k-200k, 94.1% for AGIs over 200k)
Averages for the 2012 tax year for zip code 93610, filed in 2013:
Average Adjusted Gross Income (AGI) in 2012: $46,144 (Individual Income Tax Returns)
Here:
$46,144
State:
$72,726
Salary/wage: $36,656 (reported on 86.4% of returns)
Here:
$36,656
State:
$59,079
(% of AGI for various income ranges: 78.5% for AGIs below $25k, 84.6% for AGIs $25k-50k, 80.7% for AGIs $50k-75k, 76.1% for AGIs $75k-100k, 71.0% for AGIs $100k-200k, 21.5% for AGIs over 200k)
Taxable interest for individuals: $2,188 (reported on 23.6% of returns)
This zip code:
$2,188
California:
$2,146
(% of AGI for various income ranges: 0.6% for AGIs below $25k, 0.4% for AGIs $25k-50k, 0.7% for AGIs $50k-75k, 1.2% for AGIs $75k-100k, 1.1% for AGIs $100k-200k, 2.8% for AGIs over 200k)
Ordinary dividends: $3,093 (reported on 7.2% of returns)
Here:
$3,093
State:
$9,308
(% of AGI for various income ranges: 0.3% for AGIs below $25k, 0.3% for AGIs $25k-50k, 0.3% for AGIs $50k-75k, 0.4% for AGIs $75k-100k, 0.6% for AGIs $100k-200k, 0.9% for AGIs over 200k)
Net capital gain/loss in AGI: +$23,448 (reported on 7.3% of returns)
Here:
+$23,448
State:
+$30,460
(% of AGI for various income ranges: 0.4% for AGIs below $25k, 0.4% for AGIs $25k-50k, 0.6% for AGIs $50k-75k, 1.3% for AGIs $75k-100k, 2.0% for AGIs $100k-200k, 17.1% for AGIs over 200k)
Profit/loss from business: +$10,926 (reported on 12.8% of returns)
Here:
+$10,926
State:
+$17,064
(% of AGI for various income ranges: 7.2% for AGIs below $25k, 4.3% for AGIs $25k-50k, 1.8% for AGIs $50k-75k, 1.9% for AGIs $75k-100k, 3.3% for AGIs $100k-200k)
Taxable individual retirement arrangement distribution: $14,644 (reported on 4.5% of returns)
93610:
$14,644
California:
$19,557
(% of AGI for various income ranges: 1.1% for AGIs below $25k, 0.8% for AGIs $25k-50k, 2.0% for AGIs $50k-75k, 2.1% for AGIs $75k-100k, 2.7% for AGIs $100k-200k)
Self-employment retirement plans: $32,550 (reported on 0.3% of returns)
93610:
$32,550
California:
$24,530
(% of AGI for various income ranges: 1.5% for AGIs $50k-75k)
Total itemized deductions: $24,456 (23% of AGI, reported on 22.6% of returns)
Here:
$24,456
State:
$34,004
Here:
23.1% of AGI
State:
22.7% of AGI
(% of AGI for various income ranges: 5.7% for AGIs below $25k, 7.6% for AGIs $25k-50k, 11.5% for AGIs $50k-75k, 15.4% for AGIs $75k-100k, 18.1% for AGIs $100k-200k, 13.3% for AGIs over 200k)
Charity contributions: $4,347 (reported on 18.6% of returns)
Here:
$4,347
State:
$4,659
(% of AGI for various income ranges: 0.4% for AGIs below $25k, 0.6% for AGIs $25k-50k, 1.2% for AGIs $50k-75k, 2.0% for AGIs $75k-100k, 3.0% for AGIs $100k-200k, 3.3% for AGIs over 200k)
Taxes paid: $7,887 (reported on 22.6% of returns)
93610:
$7,887
State:
$14,448
(% of AGI for various income ranges: 1.0% for AGIs below $25k, 1.5% for AGIs $25k-50k, 3.0% for AGIs $50k-75k, 4.2% for AGIs $75k-100k, 6.2% for AGIs $100k-200k, 6.9% for AGIs over 200k)
Earned income credit: $2,562 (reported on 28.8% of returns)
Here:
$2,562
State:
$2,286
(% of AGI for various income ranges: 8.8% for AGIs below $25k, 2.1% for AGIs $25k-50k)
Percentage of individuals using paid preparers for their 2012 taxes: 65.7%
Here:
66%
State:
64%
(% for various income ranges: 60.8% for AGIs below $25k, 71.2% for AGIs $25k-50k, 67.1% for AGIs $50k-75k, 62.5% for AGIs $75k-100k, 71.4% for AGIs $100k-200k, 77.8% for AGIs over 200k)
Averages for the 2004 tax year for zip code 93610, filed in 2005:
Average Adjusted Gross Income (AGI) in 2004: $33,394 (Individual Income Tax Returns)
Here:
$33,394
State:
$58,600
Salary/wage: $31,221 (reported on 85.0% of returns)
Here:
$31,221
State:
$49,455
(% of AGI for various income ranges: 80.2% for AGIs $10k-25k, 84.8% for AGIs $25k-50k, 82.8% for AGIs $50k-75k, 73.9% for AGIs $75k-100k, 39.3% for AGIs over 100k)
Taxable interest for individuals: $2,725 (reported on 33.9% of returns)
This zip code:
$2,725
California:
$2,365
(% of AGI for various income ranges: 1.6% for AGIs $10k-25k, 0.9% for AGIs $25k-50k, 1.7% for AGIs $50k-75k, 1.9% for AGIs $75k-100k, 4.8% for AGIs over 100k)
Taxable dividends: $1,737 (reported on 10.9% of returns)
Here:
$1,737
State:
$4,746
(% of AGI for various income ranges: 0.5% for AGIs $10k-25k, 0.2% for AGIs $25k-50k, 0.5% for AGIs $50k-75k, 0.5% for AGIs $75k-100k, 0.6% for AGIs over 100k)
Net capital gain/loss: +$26,715 (reported on 11.0% of returns)
Here:
+$26,715
State:
+$23,418
(% of AGI for various income ranges: 1.8% for AGIs $10k-25k, 1.2% for AGIs $25k-50k, 2.1% for AGIs $50k-75k, 6.5% for AGIs $75k-100k, 20.4% for AGIs over 100k)
Profit/loss from business: +$10,778 (reported on 14.4% of returns)
Here:
+$10,778
State:
+$16,826
(% of AGI for various income ranges: 6.0% for AGIs $10k-25k, 4.2% for AGIs $25k-50k, 1.4% for AGIs $50k-75k, 4.3% for AGIs $75k-100k, 4.1% for AGIs over 100k)
IRA payment deduction: $3,766 (reported on 2.2% of returns)
93610:
$3,766
California:
$3,192
(% of AGI for various income ranges: 0.2% for AGIs $10k-25k, 0.2% for AGIs $25k-50k, 0.2% for AGIs $50k-75k, 0.3% for AGIs $75k-100k, 0.2% for AGIs over 100k)
Self-employed pension: $8,529 (reported on 0.4% of returns)
Here:
$8,529
California:
$17,688
Total itemized deductions: $20,220 (26% of AGI, reported on 24.5% of returns)
Here:
$20,220
State:
$28,113
Here:
25.5% of AGI
State:
25.3% of AGI
(% of AGI for various income ranges: 6.6% for AGIs $10k-25k, 9.7% for AGIs $25k-50k, 15.2% for AGIs $50k-75k, 19.8% for AGIs $75k-100k, 15.0% for AGIs over 100k)
Charity contributions deductions: $3,761 (5% of AGI, reported on 21.5% of returns)
Here:
$3,761
State:
$3,923
Here:
4.5% of AGI
State:
3.3% of AGI
(% of AGI for various income ranges: 0.7% for AGIs $10k-25k, 1.0% for AGIs $25k-50k, 2.2% for AGIs $50k-75k, 3.4% for AGIs $75k-100k, 3.4% for AGIs over 100k)
Total tax: $5,950 (reported on 61.9% of returns)
93610:
$5,950
State:
$10,761
(% of AGI for various income ranges: 3.2% for AGIs $10k-25k, 5.4% for AGIs $25k-50k, 7.6% for AGIs $50k-75k, 10.1% for AGIs $75k-100k, 19.2% for AGIs over 100k)
Earned income credit: $1,914 (reported on 26.7% of returns)
Here:
$1,914
State:
$1,763
Percentage of individuals using paid preparers for their 2004 taxes: 69.5%
Here:
70%
State:
66%
(% for various income ranges: 58.7% for AGIs below $10k, 70.3% for AGIs $10k-25k, 72.8% for AGIs $25k-50k, 73.9% for AGIs $50k-75k, 73.2% for AGIs $75k-100k, 78.2% for AGIs over 100k)
Likely homosexual households (counted as self-reported same-sex unmarried-partner households)
Lesbian couples: 0.0% of all households
Gay men: 0.1% of all households
Household received Food Stamps/SNAP in the past 12 months: 1,229 Household did not receive Food Stamps/SNAP in the past 12 months: 4,465
Women who had a birth in the past 12 months: 327 (269 now married, 57 unmarried) Women who did not have a birth in the past 12 months: 6,613 (2,147 now married, 4,485 unmarried)
Housing units in zip code 93610 with a mortgage: 1,963 (37 second mortgage, 23 both second mortgage and home equity loan) Median monthly owner costs for units with a mortgage: $1,743 Median monthly owner costs for units without a mortgage: $576
Residents with income below the poverty level in 2022:
This zip code:
17.0%
Whole state:
12.2%
Residents with income below 50% of the poverty level in 2022:
This zip code:
6.7%
Whole state:
6.2%
Median number of rooms in houses and condos:
Here:
6.0
State:
6.0
Median number of rooms in apartments:
Here:
5.0
State:
3.9
Notable locations in this zip code not listed on our city pages
Churches in zip code 93610 include: Cathedral of Faith Assembly of God Church (A), Chowchilla New Life Apostolic Church (B), Church of Christ (C), First Assembly of God Church (D), First Baptist Church (E), First Presbyterian Church (F), First Southern Baptist Church (G), First United Methodist Church (H), Galilee Missionary Baptist Church (I). Display/hide their locations on the map
2,970 married couples with children.
1,425 single-parent households (370 men, 1,055 women).
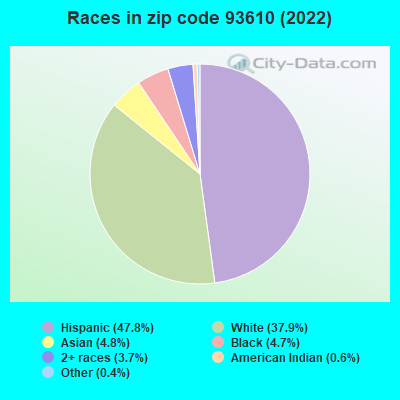
57.2% of residents of 93610 zip code speak English at home.
34.6% of residents speak Spanish at home (73% very well, 10% well, 9% not well, 8% not at all).
4.3% of residents speak other Indo-European language at home (81% very well, 5% well, 5% not well, 9% not at all).
2.4% of residents speak Asian or Pacific Island language at home (97% very well, 1% well, 2% not well).
1.0% of residents speak other language at home (77% very well, 6% well, 16% not well).
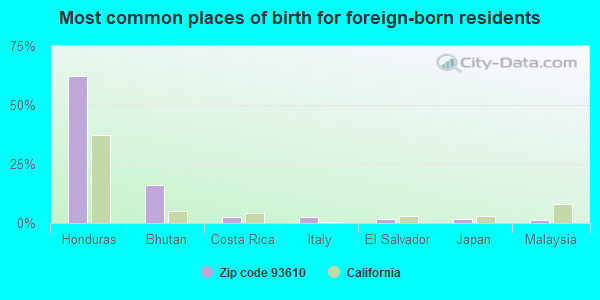
Foreign born population: 3,946 (16.7%) (35.2% of them are naturalized citizens)
This zip code:
16.7%
Whole state:
26.7%
62%Honduras
16%Bhutan
3%Costa Rica
3%Italy
2%El Salvador
2%Japan
1%Malaysia
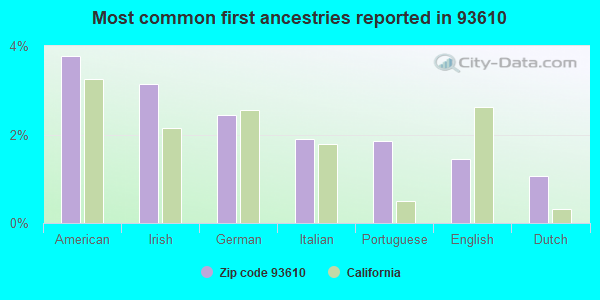
4%American
3%Irish
2%German
2%Italian
2%Portuguese
1%English
1%Dutch
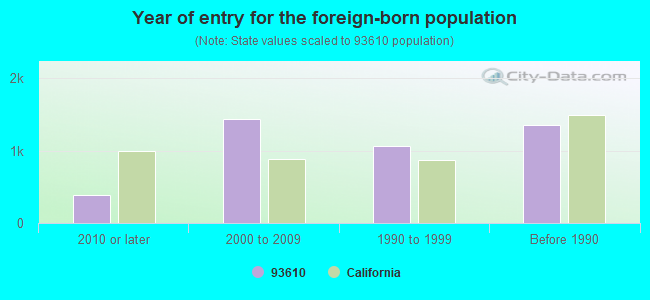
Year of entry for the foreign-born population
3882010 or later
1,4332000 to 2009
1,0671990 to 1999
1,350Before 1990
Major facilities with environmental interests located in this zip code:
CERTAINTEED CORPORATION (17775 AVENUE 23 1/2 in CHOWCHILLA, CA)
AIR MAJOR (AIRS/AFS) STATE MASTER (California - Hazardous Waste Tracking) - HAZARDOU WASTE PROGRAM CRITERIA AND HAZARDOUS AIR POLLUTANT INVENTORY (Inventory of air pollution sources) AIR MAJOR ("Best Available" air pollution technologies tracking) HAZARDOUS WASTE BIENNIAL REPORTER (Resource Conservation and Recovery Act (tracking hazardous waste)) Large Quantity Generators, more that 1000 kg of hazardous waste/month (Resource Conservation and Recovery Act (tracking hazardous waste)) TSD (Resource Conservation and Recovery Act (tracking hazardous waste)) TRI REPORTER (Tracking of toxic chemicals releasing facilities) Business SIC classification: MINERAL WOOL Business NAICS classification: OTHER PRESSED AND BLOWN GLASS AND GLASSWARE MANUFACTURING. Alternative names: CERTAINTEED CHOWCHILLA CORP, CERTAINTEED CHOWCHILLA PLANT, CERTAINTEED CORP.
ANDERSON PUMP CO (24719 W ROBERTSON BLVD in CHOWCHILLA, CA)
AIR SYNTHETIC MINOR (AIRS/AFS) STATE MASTER (California - Hazardous Waste Tracking) - HAZARDOU WASTE PROGRAM CRITERIA AND HAZARDOUS AIR POLLUTANT INVENTORY (Inventory of air pollution sources) Small Quantity Generators, between 100 kg and 1000 kg of hazardous waste/month (Resource Conservation and Recovery Act (tracking hazardous waste)) - notification Business SIC classification: METAL DOORS, SASH, FRAMES, MOLDING, AND TRIM Organizations: LEON ANDERSON (CONTACT/OWNER)
GLADWIN TRUCKING (23211 RD 15 3/4 in CHOWCHILLA, CA)
STATE MASTER (California - Hazardous Waste Tracking) - HAZARDOU WASTE PROGRAM TRANSPORTER (Resource Conservation and Recovery Act (tracking hazardous waste)) - notification USED OIL PROGRAM (Resource Conservation and Recovery Act (tracking hazardous waste)) Organizations: BILL GLADWIN (CONTACT/OWNER)
GATEWAY HIGH (CONT.) (805 HUMBOLDT in CHOWCHILLA, CA)
(National Center for Education Statistics) - STATE ID-2030047 Organizations: CHOWCHILLA UNION HIGH (SCHOOL DISTRICT)
ALVIEW ELEMENTARY (20513 ROAD 4 in CHOWCHILLA, CA)
(National Center for Education Statistics) - STATE ID-6023865 Organizations: ALVIEW-DAIRYLAND UNION ELEMENTARY (SCHOOL DISTRICT)
FAIRMEAD ELEMENTARY (19421 AVENUE 22 3/4 in CHOWCHILLA, CA)
(National Center for Education Statistics) - STATE ID-6023931 Organizations: CHOWCHILLA ELEMENTARY (SCHOOL DISTRICT)
FULLER (MERLE L.) ELEMENTARY (1101 MONTEREY AVE. in CHOWCHILLA, CA)
(National Center for Education Statistics) - STATE ID-6023881 Organizations: CHOWCHILLA ELEMENTARY (SCHOOL DISTRICT)
CHILD TRUCK LINE INCORPORATED (16505 AVENUE 24 1/2 in CHOWCHILLA, CA)
(Resource Conservation and Recovery Act (tracking hazardous waste)) TRANSPORTER (Resource Conservation and Recovery Act (tracking hazardous waste)) Organizations: H RONALD CHILD (CONTACT/OWNER)
, RON CHILD (CONTACT/OWNER)
CHOWCHILLA HIGH (805 HUMBOLDT AVE. in CHOWCHILLA, CA)
(National Center for Education Statistics) - STATE ID-2032357 Organizations: CHOWCHILLA UNION HIGH (SCHOOL DISTRICT)
MADERA DISPOSAL SYSTEMS INC (19170 AVE 22 in CHOWCHILLA, CA)
TRANSPORTER (Resource Conservation and Recovery Act (tracking hazardous waste)) REFUSE DISPOSAL (Solid waste facilities tracking) Organizations: MADERA DISPOSAL SYSTEMS,INC. (CONTACT/OPERATOR)
, COUNTY OF MADERA DEPT PUBLIC WORKS (CONTACT/OWNER)
Alternative names: FAIRMEAD SOLID WASTE DISPOSAL SITE
INENTEC MEDICAL SVCS CALIFORNIA LLC (16457 AVENUE 24 1/2 in CHOWCHILLA, CA)
Conditionally Exempt Small Quantity Generators, less than 100 kg/month of hazardous waste (Resource Conservation and Recovery Act (tracking hazardous waste)) TRANSPORTER (Resource Conservation and Recovery Act (tracking hazardous waste)) Organizations: DAVID L FARMER (CONTACT/OPERATOR)
ANDERSON CLAYTON CORPORATION OIL MILL (25184 ROAD 16 in CHOWCHILLA, CA)
CRITERIA AND HAZARDOUS AIR POLLUTANT INVENTORY (Inventory of air pollution sources) TRI REPORTER (Tracking of toxic chemicals releasing facilities) Business SIC classification: COTTONSEED OIL MILLS Alternative names: ANDERSON CLAYTON CORP., CHOW MILL, WESTERN COTTON SERVICES CORP.
ED GOMES DAIRY (12383 S SCHULTZ RD in CHOWCHILLA, CA)
National Pollutant Discharge Elimination System NON-MAJOR (Tracking pollutant discharge elimination systems) - permit Business SIC classification: DAIRY FARMS Alternative names: GOMES, MARY
Housing units lacking complete plumbing facilities: 2.6% Housing units lacking complete kitchen facilities: 2.1%
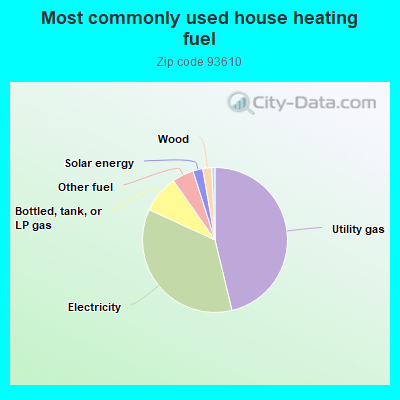
46.2%Utility gas
35.6%Electricity
8.4%Bottled, tank, or LP gas
4.8%Other fuel
2.2%Solar energy
2.0%Wood
0.7%No fuel used
Population in 1990: 10,745. Population change in the 1990s: +8,638 (+80.4%).
Place of birth for U.S.-born residents:
This state: 16,977
Northeast: 484
Midwest: 545
South: 761
West: 531
45% of the 93610 zip code residents lived in the same house 5 years ago. Out of people who lived in different houses, 35% lived in this county. Out of people who lived in different counties, 50% lived in California.
85% of the 93610 zip code residents lived in the same house 1 year ago. Out of people who lived in different houses, 24% moved from this county. Out of people who lived in different houses, 72% moved from different county within same state. Out of people who lived in different houses, 3% moved from different state. Out of people who lived in different houses, 1% moved from abroad.
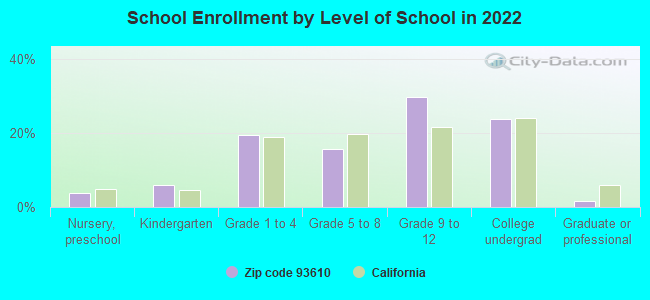
Private vs. public school enrollment:
Students in private schools in grades 1 to 8 (elementary and middle school): 217
Here:
9.3%
California:
10.5%
Students in private schools in grades 9 to 12 (high school): 531
Here:
27.0%
California:
8.5%
Students in private undergraduate colleges: 663
Here:
41.7%
California:
15.9%
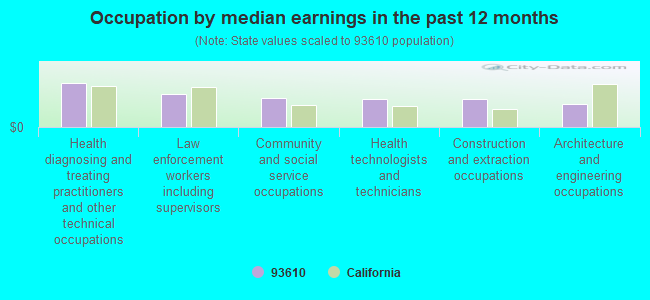
Occupation by median earnings in the past 12 months ($)
108,033Health diagnosing and treating practitioners and other technical occupations
79,957Law enforcement workers including supervisors
72,173Community and social service occupations
69,346Health technologists and technicians
69,148Construction and extraction occupations
55,331Architecture and engineering occupations
Companies with federal contracts located in this zip code:
MEDERE DISPOSAL SYSTEMS INC (21739 RD 19 in CHOWCHILLA, CA; small business) : $0 in 4 contractsin 2004
$13,772 with Army for Trash/Garbage Collection Services - Including Portable Sanitation Services. Signed on 2004-02-20. Completion date: 2004-09-30.
$13,772 with U.S. Army Corps of Engineers - civil program financing only for Trash/Garbage Collection Services - Including Portable Sanitation Services. Signed on 2004-02-20. Completion date: 2004-09-30.
-$13,772 with Army for Trash/Garbage Collection Services - Including Portable Sanitation Services. Signed on 2004-02-26. Completion date: 2004-09-30.
-$13,772 with U.S. Army Corps of Engineers - civil program financing only for Trash/Garbage Collection Services - Including Portable Sanitation Services. Signed on 2004-02-26. Completion date: 2004-09-30.
Top industries in this zip code by the number of employees in 2005:
2005 - 2018 National Fire Incident Reporting System (NFIRS) incidents
Based on the data from the years 2005 - 2018 the average number of fires per year is 138. The highest number of reported fire incidents - 215 took place in 2016, and the least - 37 in 2012. The data has a growing trend.
When looking into fire subcategories, the most reports belonged to: Outside Fires (63.5%), and Mobile Property/Vehicle Fires (17.2%).
Fire incident types reported to NFIRS in Zip Code 93610
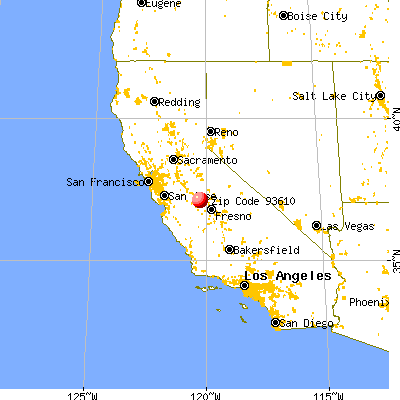


 Nearest zip codes: 95333, 93637, 95317, 95365, 93638, 95341.
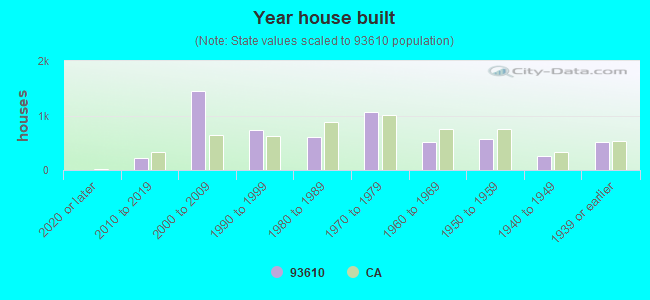


 Based on the data from the years 2005 - 2018 the average number of fires per year is 138. The highest number of reported fire incidents - 215 took place in 2016, and the least - 37 in 2012. The data has a growing trend.
 When looking into fire subcategories, the most reports belonged to: Outside Fires (63.5%), and Mobile Property/Vehicle Fires (17.2%).