Estimated zip code population in 2022: 51,294 Zip code population in 2010: 49,068 Zip code population in 2000: 49,244
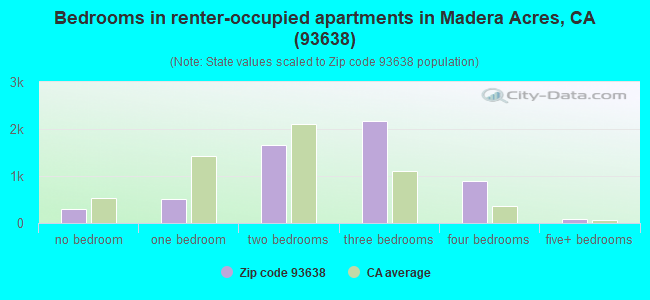
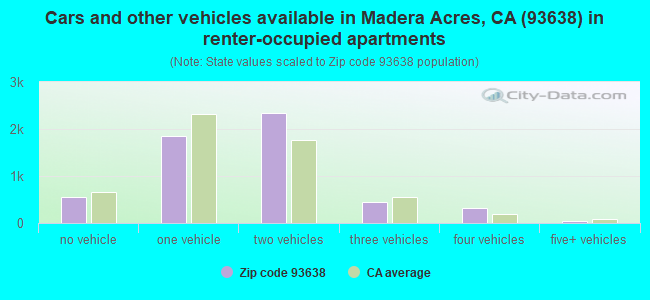
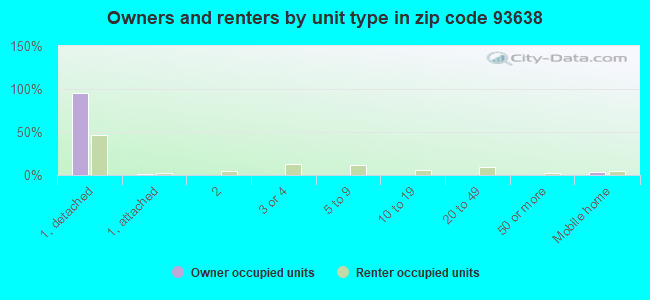
Houses and condos: 13,095 Renter-occupied apartments: 5,603
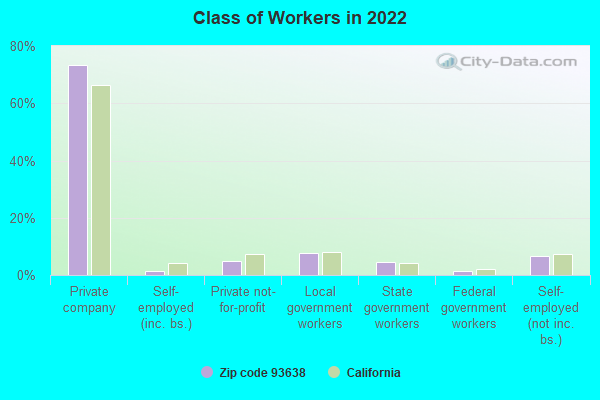
% of renters here:
45%
State:
44%
March 2022 cost of living index in zip code 93638: 95.2 (less than average, U.S. average is 100)
Land area: 94.8 sq. mi. Water area: 0.6 sq. mi.
Population density: 541 people per square mile
(low).
OSM Map
General Map
Google Map
MSN Map
OSM Map
General Map
Google Map
MSN Map
OSM Map
General Map
Google Map
MSN Map
OSM Map
General Map
Google Map
MSN Map
Please wait while loading the map...
Real estate property taxes paid for housing units in 2022:
This zip code:
0.6% ($1,873)
California:
0.7% ($4,831)
Median real estate property taxes paid for housing units with mortgages in 2022: $2,021 (0.7%) Median real estate property taxes paid for housing units with no mortgage in 2022: $1,468 (0.5%)
Averages for the 2020 tax year for zip code 93638, filed in 2021:
Average Adjusted Gross Income (AGI) in 2020: $37,236 (Individual Income Tax Returns)
Here:
$37,236
State:
$95,910
Salary/wage: $33,190 (reported on 89.6% of returns)
Here:
$33,190
State:
$77,331
(% of AGI for various income ranges: 1646.2% for AGIs below $25k, 4281.2% for AGIs $25k-50k, 7438.4% for AGIs $50k-75k, 10849.7% for AGIs $75k-100k, 18912.3% for AGIs $100k-200k, 47666.7% for AGIs over 200k)
Taxable interest for individuals: $255 (reported on 16.9% of returns)
This zip code:
$255
California:
$2,294
(% of AGI for various income ranges: 2.1% for AGIs below $25k, 2.6% for AGIs $25k-50k, 8.2% for AGIs $50k-75k, 10.0% for AGIs $75k-100k, 39.2% for AGIs $100k-200k, 803.3% for AGIs over 200k)
Ordinary dividends: $2,694 (reported on 2.4% of returns)
Here:
$2,694
State:
$10,949
(% of AGI for various income ranges: 2.4% for AGIs below $25k, 3.9% for AGIs $25k-50k, 10.9% for AGIs $50k-75k, 20.1% for AGIs $75k-100k, 70.8% for AGIs $100k-200k, 1140.0% for AGIs over 200k)
Net capital gain/loss in AGI: +$8,558 (reported on 3.2% of returns)
Here:
+$8,558
State:
+$49,306
(% of AGI for various income ranges: 1.0% for AGIs below $25k, 14.0% for AGIs $50k-75k, 48.6% for AGIs $75k-100k, 377.9% for AGIs $100k-200k, 10980.0% for AGIs over 200k)
Profit/loss from business: +$11,360 (reported on 9.9% of returns)
Here:
+$11,360
State:
+$15,671
(% of AGI for various income ranges: 105.9% for AGIs below $25k, 113.2% for AGIs $25k-50k, 270.9% for AGIs $50k-75k, 390.4% for AGIs $75k-100k, 527.7% for AGIs $100k-200k, 5293.3% for AGIs over 200k)
Taxable individual retirement arrangement distribution: $17,589 (reported on 1.7% of returns)
93638:
$17,589
California:
$23,505
(% of AGI for various income ranges: 9.1% for AGIs below $25k, 14.9% for AGIs $25k-50k, 43.1% for AGIs $50k-75k, 90.6% for AGIs $75k-100k, 765.6% for AGIs $100k-200k)
Total itemized deductions: $26,338 (reported on 3.5% of returns)
Here:
$26,338
State:
$39,517
(% of AGI for various income ranges: 10.1% for AGIs below $25k, 62.7% for AGIs $25k-50k, 245.5% for AGIs $50k-75k, 445.5% for AGIs $75k-100k, 1314.4% for AGIs $100k-200k, 5886.7% for AGIs over 200k)
Charity contributions: $5,436 (reported on 2.7% of returns)
Here:
$5,436
State:
$12,598
(% of AGI for various income ranges: 7.9% for AGIs $25k-50k, 30.8% for AGIs $50k-75k, 54.6% for AGIs $75k-100k, 260.2% for AGIs $100k-200k, 1400.0% for AGIs over 200k)
Taxes paid: $7,160 (reported on 3.5% of returns)
93638:
$7,160
State:
$8,807
(% of AGI for various income ranges: 2.7% for AGIs below $25k, 13.4% for AGIs $25k-50k, 65.3% for AGIs $50k-75k, 142.4% for AGIs $75k-100k, 391.9% for AGIs $100k-200k, 1230.0% for AGIs over 200k)
Earned income credit: $2,563 (reported on 26.1% of returns)
Here:
$2,563
State:
$2,074
(% of AGI for various income ranges: 143.0% for AGIs below $25k, 115.2% for AGIs $25k-50k, 3.6% for AGIs $50k-75k)
Percentage of individuals using paid preparers for their 2020 taxes: 91.1%
Here:
91%
State:
92%
(% for various income ranges: 89.3% for AGIs below $25k, 92.2% for AGIs $25k-50k, 93.2% for AGIs $50k-75k, 92.7% for AGIs $75k-100k, 92.4% for AGIs $100k-200k, 100.0% for AGIs over 200k)
Averages for the 2012 tax year for zip code 93638, filed in 2013:
Average Adjusted Gross Income (AGI) in 2012: $29,467 (Individual Income Tax Returns)
Here:
$29,467
State:
$72,726
Salary/wage: $26,335 (reported on 92.2% of returns)
Here:
$26,335
State:
$59,079
(% of AGI for various income ranges: 87.3% for AGIs below $25k, 88.3% for AGIs $25k-50k, 84.1% for AGIs $50k-75k, 77.8% for AGIs $75k-100k, 75.0% for AGIs $100k-200k, 23.2% for AGIs over 200k)
Taxable interest for individuals: $629 (reported on 14.4% of returns)
This zip code:
$629
California:
$2,146
(% of AGI for various income ranges: 0.2% for AGIs below $25k, 0.3% for AGIs $50k-75k, 0.3% for AGIs $75k-100k, 0.6% for AGIs $100k-200k, 2.4% for AGIs over 200k)
Ordinary dividends: $2,273 (reported on 2.5% of returns)
Here:
$2,273
State:
$9,308
(% of AGI for various income ranges: 0.1% for AGIs below $25k, 0.1% for AGIs $50k-75k, 0.2% for AGIs $75k-100k, 0.2% for AGIs $100k-200k, 1.8% for AGIs over 200k)
Net capital gain/loss in AGI: +$6,348 (reported on 1.9% of returns)
Here:
+$6,348
State:
+$30,460
(% of AGI for various income ranges: 0.8% for AGIs $75k-100k, 0.2% for AGIs $100k-200k, 7.8% for AGIs over 200k)
Profit/loss from business: +$9,908 (reported on 9.2% of returns)
Here:
+$9,908
State:
+$17,064
(% of AGI for various income ranges: 4.8% for AGIs below $25k, 2.9% for AGIs $25k-50k, 1.7% for AGIs $50k-75k, 2.5% for AGIs $75k-100k, 2.4% for AGIs $100k-200k)
Taxable individual retirement arrangement distribution: $15,855 (reported on 1.9% of returns)
93638:
$15,855
California:
$19,557
(% of AGI for various income ranges: 0.4% for AGIs below $25k, 0.6% for AGIs $25k-50k, 1.2% for AGIs $50k-75k, 2.4% for AGIs $75k-100k, 2.7% for AGIs $100k-200k)
Total itemized deductions: $19,122 (28% of AGI, reported on 14.0% of returns)
Here:
$19,122
State:
$34,004
Here:
28.0% of AGI
State:
22.7% of AGI
(% of AGI for various income ranges: 2.8% for AGIs below $25k, 8.0% for AGIs $25k-50k, 13.4% for AGIs $50k-75k, 15.1% for AGIs $75k-100k, 16.9% for AGIs $100k-200k, 13.9% for AGIs over 200k)
Charity contributions: $2,123 (reported on 10.9% of returns)
Here:
$2,123
State:
$4,659
(% of AGI for various income ranges: 0.1% for AGIs below $25k, 0.5% for AGIs $25k-50k, 1.2% for AGIs $50k-75k, 1.7% for AGIs $75k-100k, 2.0% for AGIs $100k-200k, 0.7% for AGIs over 200k)
Taxes paid: $4,827 (reported on 13.9% of returns)
93638:
$4,827
State:
$14,448
(% of AGI for various income ranges: 0.4% for AGIs below $25k, 1.4% for AGIs $25k-50k, 2.9% for AGIs $50k-75k, 4.1% for AGIs $75k-100k, 5.7% for AGIs $100k-200k, 7.8% for AGIs over 200k)
Earned income credit: $2,802 (reported on 32.2% of returns)
Here:
$2,802
State:
$2,286
(% of AGI for various income ranges: 7.8% for AGIs below $25k, 2.4% for AGIs $25k-50k)
Percentage of individuals using paid preparers for their 2012 taxes: 79.0%
Here:
79%
State:
64%
(% for various income ranges: 80.2% for AGIs below $25k, 79.3% for AGIs $25k-50k, 73.3% for AGIs $50k-75k, 69.6% for AGIs $75k-100k, 71.4% for AGIs $100k-200k, 100.0% for AGIs over 200k)
Averages for the 2004 tax year for zip code 93638, filed in 2005:
Average Adjusted Gross Income (AGI) in 2004: $36,569 (Individual Income Tax Returns)
Here:
$36,569
State:
$58,600
Salary/wage: $31,973 (reported on 89.3% of returns)
Here:
$31,973
State:
$49,455
(% of AGI for various income ranges: 112.5% for AGIs below $10k, 82.9% for AGIs $10k-25k, 84.2% for AGIs $25k-50k, 83.3% for AGIs $50k-75k, 82.0% for AGIs $75k-100k, 60.8% for AGIs over 100k)
Taxable interest for individuals: $1,033 (reported on 32.9% of returns)
This zip code:
$1,033
California:
$2,365
(% of AGI for various income ranges: 2.6% for AGIs below $10k, 0.8% for AGIs $10k-25k, 0.6% for AGIs $25k-50k, 0.8% for AGIs $50k-75k, 0.6% for AGIs $75k-100k, 1.4% for AGIs over 100k)
Taxable dividends: $1,743 (reported on 9.7% of returns)
Here:
$1,743
State:
$4,746
(% of AGI for various income ranges: 1.8% for AGIs below $10k, 0.4% for AGIs $10k-25k, 0.2% for AGIs $25k-50k, 0.3% for AGIs $50k-75k, 0.3% for AGIs $75k-100k, 0.9% for AGIs over 100k)
Net capital gain/loss: +$13,204 (reported on 8.8% of returns)
Here:
+$13,204
State:
+$23,418
(% of AGI for various income ranges: 1.9% for AGIs below $10k, 0.2% for AGIs $10k-25k, 0.4% for AGIs $25k-50k, 1.0% for AGIs $50k-75k, 2.0% for AGIs $75k-100k, 9.9% for AGIs over 100k)
Profit/loss from business: +$13,633 (reported on 13.6% of returns)
Here:
+$13,633
State:
+$16,826
(% of AGI for various income ranges: 1.9% for AGIs below $10k, 5.0% for AGIs $10k-25k, 5.1% for AGIs $25k-50k, 4.1% for AGIs $50k-75k, 4.8% for AGIs $75k-100k, 6.2% for AGIs over 100k)
IRA payment deduction: $3,311 (reported on 1.5% of returns)
93638:
$3,311
California:
$3,192
(% of AGI for various income ranges: 0.1% for AGIs $10k-25k, 0.1% for AGIs $25k-50k, 0.2% for AGIs $50k-75k, 0.2% for AGIs $75k-100k, 0.2% for AGIs over 100k)
Self-employed pension: $13,361 (reported on 0.5% of returns)
Here:
$13,361
California:
$17,688
(% of AGI for various income ranges: 0.1% for AGIs $25k-50k, 0.1% for AGIs $50k-75k, 0.2% for AGIs $75k-100k, 0.5% for AGIs over 100k)
Total itemized deductions: $19,284 (26% of AGI, reported on 28.7% of returns)
Here:
$19,284
State:
$28,113
Here:
25.7% of AGI
State:
25.3% of AGI
(% of AGI for various income ranges: 7.4% for AGIs below $10k, 7.1% for AGIs $10k-25k, 13.2% for AGIs $25k-50k, 19.5% for AGIs $50k-75k, 20.1% for AGIs $75k-100k, 16.6% for AGIs over 100k)
Charity contributions deductions: $2,528 (3% of AGI, reported on 25.1% of returns)
Here:
$2,528
State:
$3,923
Here:
3.2% of AGI
State:
3.3% of AGI
(% of AGI for various income ranges: 0.4% for AGIs below $10k, 0.6% for AGIs $10k-25k, 1.2% for AGIs $25k-50k, 2.1% for AGIs $50k-75k, 2.4% for AGIs $75k-100k, 2.4% for AGIs over 100k)
Total tax: $5,486 (reported on 59.3% of returns)
93638:
$5,486
State:
$10,761
(% of AGI for various income ranges: 2.5% for AGIs below $10k, 2.6% for AGIs $10k-25k, 4.9% for AGIs $25k-50k, 7.5% for AGIs $50k-75k, 9.7% for AGIs $75k-100k, 17.5% for AGIs over 100k)
Earned income credit: $2,100 (reported on 30.8% of returns)
Here:
$2,100
State:
$1,763
Percentage of individuals using paid preparers for their 2004 taxes: 70.0%
Here:
70%
State:
66%
(% for various income ranges: 63.7% for AGIs below $10k, 73.1% for AGIs $10k-25k, 69.9% for AGIs $25k-50k, 69.9% for AGIs $50k-75k, 67.6% for AGIs $75k-100k, 77.1% for AGIs over 100k)
Likely homosexual households (counted as self-reported same-sex unmarried-partner households)
Lesbian couples: 0.1% of all households
Gay men: 0.1% of all households
Household received Food Stamps/SNAP in the past 12 months: 5,181 Household did not receive Food Stamps/SNAP in the past 12 months: 7,966
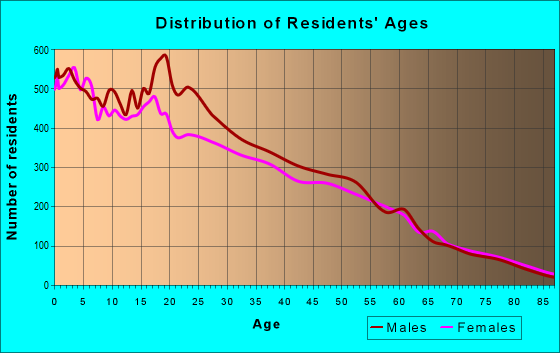
Women who had a birth in the past 12 months: 908 (514 now married, 397 unmarried) Women who did not have a birth in the past 12 months: 12,358 (4,185 now married, 8,202 unmarried)
Housing units in zip code 93638 with a mortgage: 4,748 (253 second mortgage, 252 both second mortgage and home equity loan) Houses without a mortgage: 42
Median monthly owner costs for units with a mortgage: $1,495 Median monthly owner costs for units without a mortgage: $504
Residents with income below the poverty level in 2022:
This zip code:
29.3%
Whole state:
12.2%
Residents with income below 50% of the poverty level in 2022:
This zip code:
18.3%
Whole state:
6.2%
Median number of rooms in houses and condos:
Here:
5.8
State:
6.0
Median number of rooms in apartments:
Here:
4.8
State:
3.9
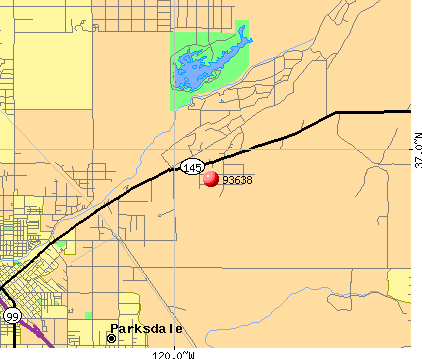
Notable locations in this zip code not listed on our city pages
Notable locations in zip code 93638: Madera Drive-In (A), Circle Dot Ranch (B), Daulton Ranch (C), Adobe Ranch (D), Madera Country Club (E), Madera County Arts Council and Art Gallery (F), Madera County Adult Correctional Facility (G), Madera City Fire Department Station 6 (H), Pistoresi Ambulance Service (I), Madera County Fire Department Station 3 (J). Display/hide their locations on the map
Churches in zip code 93638 include: Bethel Southern Baptist Church (A), Church of God (B), Church of God Eastlake (C), Church of God of Prophecy (D), Evangelical Free Church (E), Grace Assembly of God Church (F), Iglesia Bautista El Calvario (G), Madera Free Will Baptist Church (H), Morning Star Baptist Church (I). Display/hide their locations on the map
Parks in zip code 93638 include: McNally Memorial Park (1), Madera Lake Park and Recreational Area (2), Millview Park (3), Pan-Am Park (4). Display/hide their locations on the map
7,927 married couples with children.
5,191 single-parent households (2,174 men, 3,017 women).
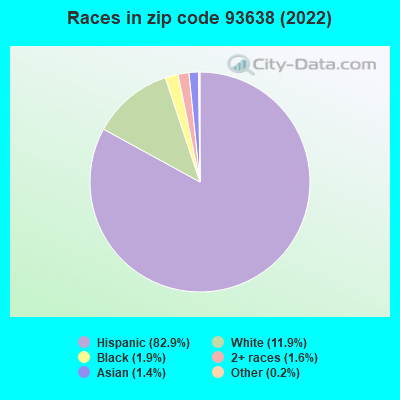
30.5% of residents of 93638 zip code speak English at home.
68.2% of residents speak Spanish at home (51% very well, 15% well, 12% not well, 22% not at all).
1.5% of residents speak other Indo-European language at home (83% very well, 8% well, 2% not well, 7% not at all).
0.2% of residents speak Asian or Pacific Island language at home (43% very well, 20% well, 37% not well).
0.1% of residents speak other language at home (18% well, 23% not well, 59% not at all).
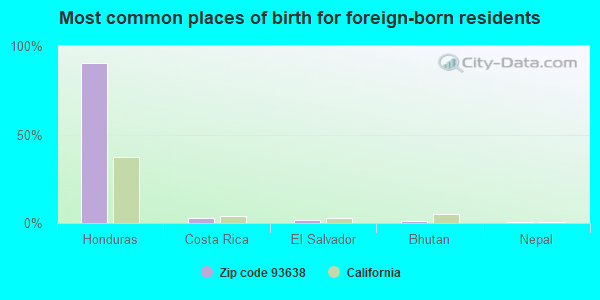
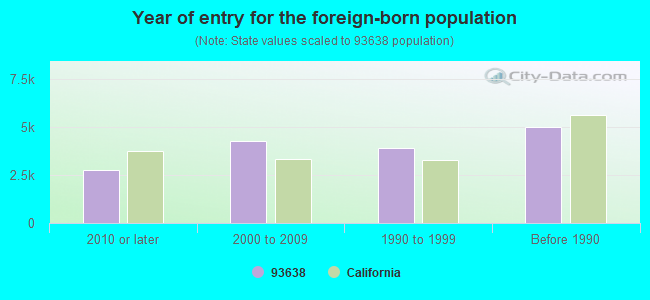
Foreign born population: 15,656 (30.5%) (27.8% of them are naturalized citizens)
Major facilities with environmental interests located in this zip code:
MADERA, CITY OF (205 WEST FOURTH STREET in MADERA, CA)
National Pollutant Discharge Elimination System NON-MAJOR (Tracking pollutant discharge elimination systems) - permit COMMUNITY WATER SYSTEM (SDWIS) - SDWIS-CA2010002 24T, WATER TREATMENT PLANT, SDWIS-CA2010002 25T, SDWIS-CA2010002 27, Organizations: CITY OF MADERA (CONTACT/OWNER)
Alternative names: MADERA-CITY
CHILDRENS HOSPITAL CENTRAL CALIFORNIA (9300 VALLEY CHILDRENS PL in MADERA, CA) . Federal Facility
STATE MASTER (California - Hazardous Waste Tracking) - HAZARDOU WASTE PROGRAM CRITERIA AND HAZARDOUS AIR POLLUTANT INVENTORY (Inventory of air pollution sources) Small Quantity Generators, between 100 kg and 1000 kg of hazardous waste/month (Resource Conservation and Recovery Act (tracking hazardous waste)) - notification Business SIC classification: GENERAL MEDICAL AND SURGICAL HOSPITALS Organizations: CHILDREN`S HOSPITAL CENTRAL CALIFORNIA (CONTACT/OPERATOR)
Alternative names: VALLEY CHILDRENS HOSPITAL
HEARTLAND OPPORTUNITY CENTER (323 N E ST in MADERA, CA)
STATE MASTER (California - Hazardous Waste Tracking) - HAZARDOU WASTE PROGRAM Small Quantity Generators, between 100 kg and 1000 kg of hazardous waste/month (Resource Conservation and Recovery Act (tracking hazardous waste)) - notification Organizations: JOSEPH COULOMBE (CONTACT/OWNER)
MADERA CLEANERS & LAUNDRY INC (321 S C ST in MADERA, CA)
STATE MASTER (California - Hazardous Waste Tracking) - HAZARDOU WASTE PROGRAM CRITERIA AND HAZARDOUS AIR POLLUTANT INVENTORY (Inventory of air pollution sources) Small Quantity Generators, between 100 kg and 1000 kg of hazardous waste/month (Resource Conservation and Recovery Act (tracking hazardous waste)) Business SIC classification: DRYCLEANING PLANTS, EXCEPT RUG CLEANING Business NAICS classification: LINEN SUPPLY.
ALTERNATIVE/OPPORTUNITY (28123 AVENUE 14 in MADERA, CA)
(National Center for Education Statistics) - STATE ID-2030096 Organizations: MADERA CO. OFFICE OF EDUCATION (SCHOOL DISTRICT)
ENTERPRISE SECONDARY SCHOOL (28281 AVENUE 14 in MADERA, CA)
(National Center for Education Statistics) - STATE ID-2030054 Organizations: MADERA CO. OFFICE OF EDUCATION (SCHOOL DISTRICT)
INDEPENDENCE HIGH (37479 AVENUE 12 in MADERA, CA)
(National Center for Education Statistics) - STATE ID-2030179 Organizations: GOLDEN VALLEY UNIFIED SCHOOL DISTRICT (SCHOOL DISTRICT)
JUVENILE HALL (ENDEAVOR/VOYAGER SECONDARY) (28261 AVENUE 14 in MADERA, CA)
(National Center for Education Statistics) - STATE ID-2030153 Organizations: MADERA CO. OFFICE OF EDUCATION (SCHOOL DISTRICT)
KING (MARTIN LUTHER JR.) MIDDLE (601 LILLY ST. in MADERA, CA)
(National Center for Education Statistics) - STATE ID-6112973 Organizations: MADERA UNIFIED (SCHOOL DISTRICT)
LIBERTY HIGH (12220 ROAD 36 in MADERA, CA)
(National Center for Education Statistics) - STATE ID-2030203 Organizations: GOLDEN VALLEY UNIFIED SCHOOL DISTRICT (SCHOOL DISTRICT)
MILLVIEW ELEMENTARY (1609 CLINTON ST. in MADERA, CA)
(National Center for Education Statistics) - STATE ID-6024020 Organizations: MADERA UNIFIED (SCHOOL DISTRICT)
MONROE (JAMES) ELEMENTARY (1819 N. LAKE ST. in MADERA, CA)
(National Center for Education Statistics) - STATE ID-6023998 Organizations: MADERA UNIFIED (SCHOOL DISTRICT)
MOUNTAIN VISTA HIGH (CONTINUATION) (1901 CLINTON ST. in MADERA, CA)
(National Center for Education Statistics) - STATE ID-2030138 Organizations: MADERA UNIFIED (SCHOOL DISTRICT)
Housing units lacking complete plumbing facilities: 1.4% Housing units lacking complete kitchen facilities: 3.5%
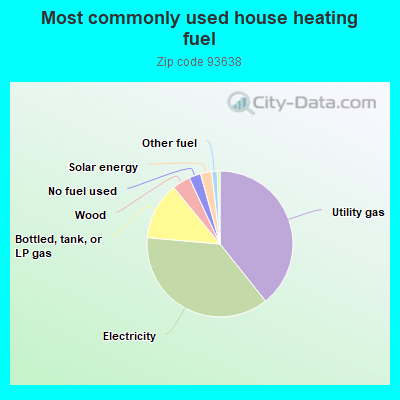
39.3%Utility gas
37.1%Electricity
12.7%Bottled, tank, or LP gas
4.0%Wood
2.6%No fuel used
2.5%Solar energy
1.2%Other fuel
0.6%Fuel oil, kerosene, etc.
Population in 1990: 36,525. Population change in the 1990s: +12,719 (+34.8%).
Place of birth for U.S.-born residents:
This state: 32,435
Northeast: 545
Midwest: 460
South: 1,026
West: 893
58% of the 93638 zip code residents lived in the same house 5 years ago. Out of people who lived in different houses, 68% lived in this county. Out of people who lived in different counties, 50% lived in California.
93% of the 93638 zip code residents lived in the same house 1 year ago. Out of people who lived in different houses, 68% moved from this county. Out of people who lived in different houses, 25% moved from different county within same state. Out of people who lived in different houses, 5% moved from different state. Out of people who lived in different houses, 3% moved from abroad.
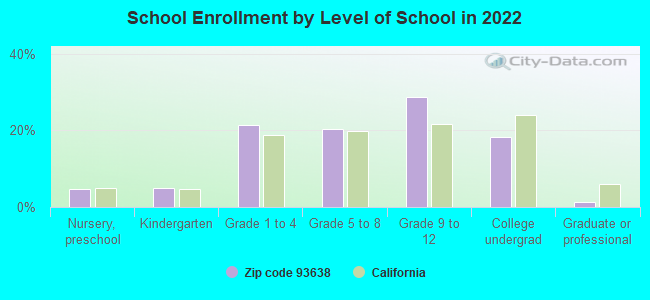
Private vs. public school enrollment:
Students in private schools in grades 1 to 8 (elementary and middle school): 466
Here:
6.9%
California:
10.5%
Students in private schools in grades 9 to 12 (high school): 91
Here:
2.0%
California:
8.5%
Students in private undergraduate colleges: 126
Here:
4.3%
California:
15.9%
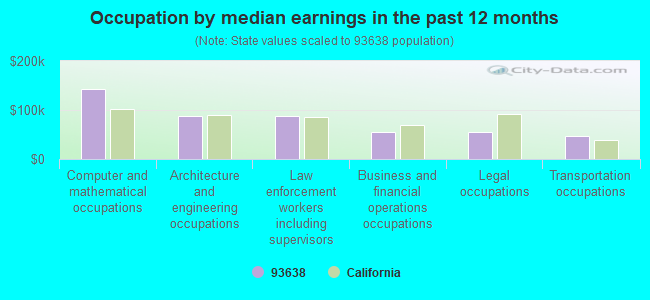
Occupation by median earnings in the past 12 months ($)
142,805Computer and mathematical occupations
88,004Architecture and engineering occupations
87,890Law enforcement workers including supervisors
56,044Business and financial operations occupations
55,118Legal occupations
46,516Transportation occupations
Companies with federal contracts located in this zip code (MADERA, CA):
MICHAEL DEVOTO (1505 NORTH LAKE ST; small business) : $236,838 in 17 contractsfrom 2002 to 2005
Contracts for Trash/Garbage Collection Services - Including Portable Sanitation Services, Custodial Janitorial Services by Army, U.S. Army Corps of Engineers - civil program financing only Signed by year:2000: $0; 2001: $0; 2002: $31,912; 2003: $0; 2004: $91,224; 2005: $113,702; 2006: $0.
Biggest contracts:
$36,061 with Army for Trash/Garbage Collection Services - Including Portable Sanitation Services. Signed on 2005-02-24. Completion date: 2005-09-30.
$36,061 with U.S. Army Corps of Engineers - civil program financing only for Trash/Garbage Collection Services - Including Portable Sanitation Services. Signed on 2005-02-24. Completion date: 2005-09-30.
$35,466 with U.S. Army Corps of Engineers - civil program financing only for Custodial Janitorial Services. Signed on 2004-01-08. Completion date: 2003-09-30.
$35,466 with Army for Custodial Janitorial Services. Signed on 2004-01-08. Completion date: 2003-09-30.
DIAMOND COMMUNICATIONS INC (215 E 4TH ST; small business) : $48,659 in 15 contractsfrom 2003 to 2006
Contracts for Construction of Structures and Facilities -- Miscellaneous Buildings, Invalid code: AB17 by Army, U.S. Army Corps of Engineers - civil program financing only Signed by year:2000: $0; 2001: $0; 2002: $0; 2003: $6,012; 2004: $9,746; 2005: $30,500; 2006: $2,401.
Biggest contracts:
$12,000 with Army for Construction of Structures and Facilities -- Miscellaneous Buildings. Signed on 2005-08-25. Completion date: 2005-12-30.
$12,000 with U.S. Army Corps of Engineers - civil program financing only for Construction of Structures and Facilities -- Miscellaneous Buildings. Signed on 2005-08-25. Completion date: 2005-12-30.
$4,873 with Army for Invalid code: AB17. Signed on 2004-06-21. Completion date: 2004-09-30.
$4,873 with U.S. Army Corps of Engineers - civil program financing only for Invalid code: AB17. Signed on 2004-06-21. Completion date: 2004-09-30.
GARY HUTCHENS ENGINEERING (12212 GLEASON DR; small business)
$26,000 with U.S. Army Corps of Engineers - civil program financing only for Construction of Structures and Facilities -- Highways, Roads, Streets, Bridges, and Railways (includes resurfacing). Signed on 2000-06-26. Completion date: 2000-05-25.
PHOENIX COATINGS INC (19893 BERENDA BLVD; small business) : $19,004 in 2 contractsin 2005
$10,705 with Army for Roofing and Siding Materials. Signed on 2005-01-31. Completion date: 2005-03-31.
$8,299, same as above.Signed on 2005-07-22. Completion date: 2005-08-05.
HAYES, JOSHUA (12465 ROAD 36 1 2; small business)
$9,776 with U.S. Army Corps of Engineers - civil program financing only for Construction of Structures and Facilities -- Miscellaneous Buildings. Signed on 2002-09-26. Completion date: 2002-11-26.
Top industries in this zip code by the number of employees in 2005:
Health Care and Social Assistance: General Medical and Surgical Hospitals (over 1000 employees: 1 establishment)
2004 - 2018 National Fire Incident Reporting System (NFIRS) incidents
Based on the data from the years 2004 - 2018 the average number of fires per year is 207. The highest number of fire incidents - 279 took place in 2005, and the least - 38 in 2004. The data has a rising trend.
When looking into fire subcategories, the most reports belonged to: Outside Fires (57.1%), and Mobile Property/Vehicle Fires (21.8%).
Fire incident types reported to NFIRS in Zip Code 93638
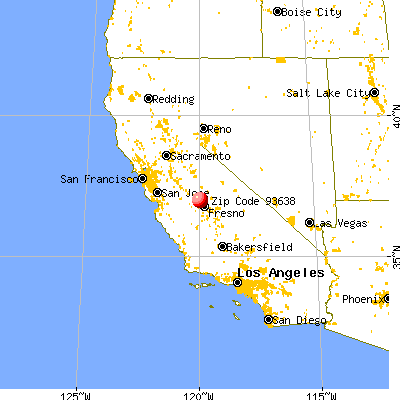


 Nearest zip codes: 93636, 93637, 93653, 93606, 93610, 93723.
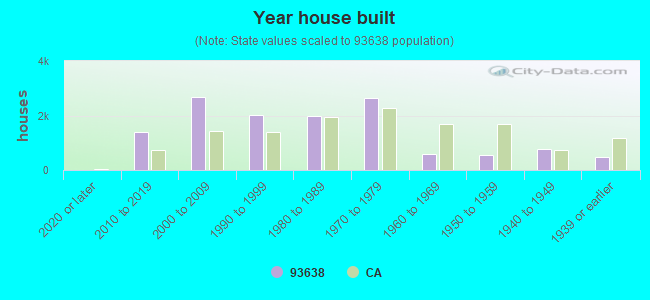


 Based on the data from the years 2004 - 2018 the average number of fires per year is 207. The highest number of fire incidents - 279 took place in 2005, and the least - 38 in 2004. The data has a rising trend.
 When looking into fire subcategories, the most reports belonged to: Outside Fires (57.1%), and Mobile Property/Vehicle Fires (21.8%).