Estimated zip code population in 2022: 66,327 Zip code population in 2010: 59,461 Zip code population in 2000: 53,938
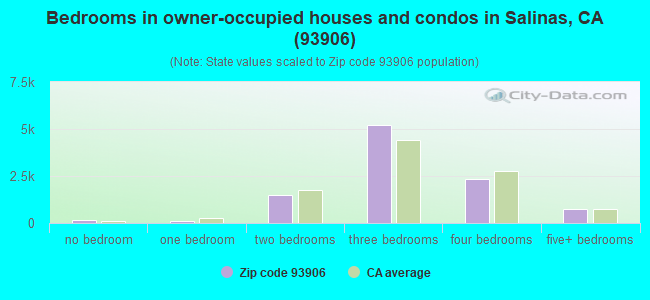
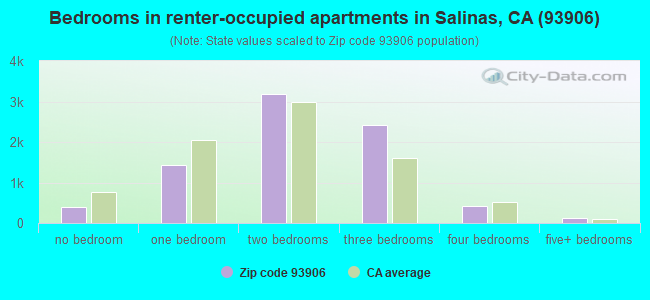
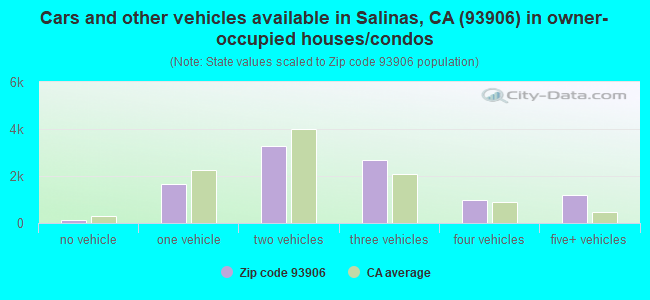
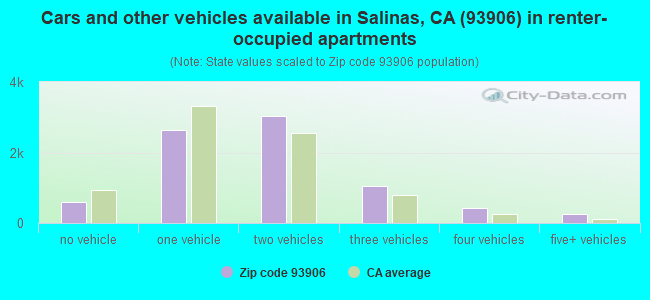
Houses and condos: 18,463 Renter-occupied apartments: 8,028
% of renters here:
44%
State:
44%
March 2022 cost of living index in zip code 93906: 105.8 (more than average, U.S. average is 100)
Land area: 13.1 sq. mi. Water area: 0.0 sq. mi.
Population density: 5,074 people per square mile
(average).
OSM Map
General Map
Google Map
MSN Map
OSM Map
General Map
Google Map
MSN Map
OSM Map
General Map
Google Map
MSN Map
OSM Map
General Map
Google Map
MSN Map
Please wait while loading the map...
Real estate property taxes paid for housing units in 2022:
This zip code:
0.6% ($3,785)
California:
0.7% ($4,831)
Median real estate property taxes paid for housing units with mortgages in 2022: $4,450 (0.7%) Median real estate property taxes paid for housing units with no mortgage in 2022: $2,126 (0.4%)
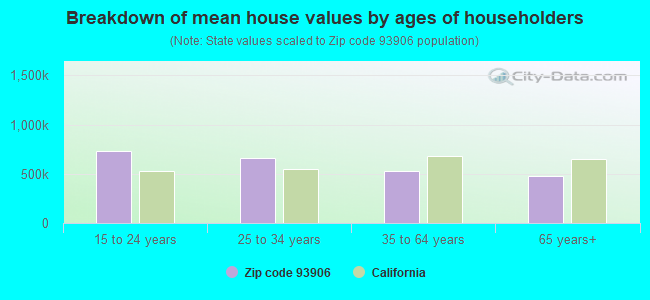
Estimated median house/condo value in 2022: $617,305
93906:
$617,305
California:
$715,900
According to our research of California and other state lists, there were 88 registered sex offenders living in 93906 zip code as of April 26, 2024. The ratio of all residents to sex offenders in zip code 93906 is 736 to 1. The ratio of registered sex offenders to all residents in this zip code is near the state average.
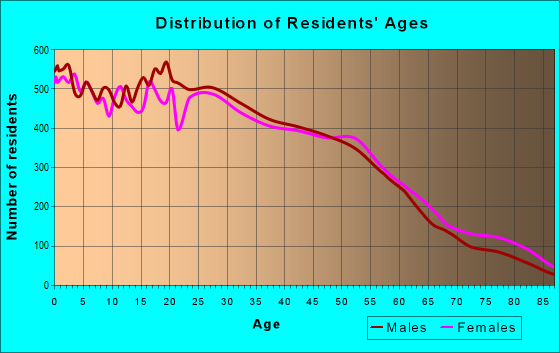
Median resident age:
This zip code:
33.4 years
California median age:
37.9 years
Average household size:
This zip code:
3.6 people
California:
2.8 people
Averages for the 2020 tax year for zip code 93906, filed in 2021:
Average Adjusted Gross Income (AGI) in 2020: $52,442 (Individual Income Tax Returns)
Here:
$52,442
State:
$95,910
Salary/wage: $48,193 (reported on 88.7% of returns)
Here:
$48,193
State:
$77,331
(% of AGI for various income ranges: 1659.2% for AGIs below $25k, 4554.9% for AGIs $25k-50k, 8018.9% for AGIs $50k-75k, 11527.7% for AGIs $75k-100k, 20981.5% for AGIs $100k-200k, 71571.5% for AGIs over 200k)
Taxable interest for individuals: $407 (reported on 22.9% of returns)
This zip code:
$407
California:
$2,294
(% of AGI for various income ranges: 4.7% for AGIs below $25k, 7.1% for AGIs $25k-50k, 15.8% for AGIs $50k-75k, 20.8% for AGIs $75k-100k, 52.4% for AGIs $100k-200k, 243.8% for AGIs over 200k)
Ordinary dividends: $2,311 (reported on 5.9% of returns)
Here:
$2,311
State:
$10,949
(% of AGI for various income ranges: 6.1% for AGIs below $25k, 7.6% for AGIs $25k-50k, 22.5% for AGIs $50k-75k, 27.8% for AGIs $75k-100k, 70.2% for AGIs $100k-200k, 674.6% for AGIs over 200k)
Net capital gain/loss in AGI: +$7,998 (reported on 6.0% of returns)
Here:
+$7,998
State:
+$49,306
(% of AGI for various income ranges: 2.9% for AGIs below $25k, 6.6% for AGIs $25k-50k, 22.8% for AGIs $50k-75k, 60.1% for AGIs $75k-100k, 231.1% for AGIs $100k-200k, 6070.0% for AGIs over 200k)
Profit/loss from business: +$9,027 (reported on 10.9% of returns)
Here:
+$9,027
State:
+$15,671
(% of AGI for various income ranges: 90.8% for AGIs below $25k, 105.6% for AGIs $25k-50k, 194.0% for AGIs $50k-75k, 196.1% for AGIs $75k-100k, 348.5% for AGIs $100k-200k, 1810.0% for AGIs over 200k)
Taxable individual retirement arrangement distribution: $14,436 (reported on 2.7% of returns)
93906:
$14,436
California:
$23,505
(% of AGI for various income ranges: 21.5% for AGIs below $25k, 25.6% for AGIs $25k-50k, 58.7% for AGIs $50k-75k, 129.0% for AGIs $75k-100k, 191.0% for AGIs $100k-200k, 1224.6% for AGIs over 200k)
Total itemized deductions: $28,225 (reported on 9.6% of returns)
Here:
$28,225
State:
$39,517
(% of AGI for various income ranges: 52.8% for AGIs below $25k, 125.9% for AGIs $25k-50k, 416.2% for AGIs $50k-75k, 898.4% for AGIs $75k-100k, 1906.4% for AGIs $100k-200k, 6585.4% for AGIs over 200k)
Charity contributions: $3,862 (reported on 7.6% of returns)
Here:
$3,862
State:
$12,598
(% of AGI for various income ranges: 2.0% for AGIs below $25k, 8.0% for AGIs $25k-50k, 35.6% for AGIs $50k-75k, 77.3% for AGIs $75k-100k, 249.7% for AGIs $100k-200k, 1072.3% for AGIs over 200k)
Taxes paid: $8,181 (reported on 9.6% of returns)
93906:
$8,181
State:
$8,807
(% of AGI for various income ranges: 11.5% for AGIs below $25k, 30.5% for AGIs $25k-50k, 115.6% for AGIs $50k-75k, 274.1% for AGIs $75k-100k, 599.6% for AGIs $100k-200k, 1669.2% for AGIs over 200k)
Earned income credit: $2,251 (reported on 17.1% of returns)
Here:
$2,251
State:
$2,074
(% of AGI for various income ranges: 111.9% for AGIs below $25k, 83.4% for AGIs $25k-50k, 1.5% for AGIs $50k-75k)
Percentage of individuals using paid preparers for their 2020 taxes: 90.1%
Here:
90%
State:
92%
(% for various income ranges: 88.0% for AGIs below $25k, 89.9% for AGIs $25k-50k, 91.8% for AGIs $50k-75k, 92.3% for AGIs $75k-100k, 91.8% for AGIs $100k-200k, 93.5% for AGIs over 200k)
Averages for the 2012 tax year for zip code 93906, filed in 2013:
Average Adjusted Gross Income (AGI) in 2012: $42,465 (Individual Income Tax Returns)
Here:
$42,465
State:
$72,726
Salary/wage: $39,653 (reported on 89.7% of returns)
Here:
$39,653
State:
$59,079
(% of AGI for various income ranges: 81.6% for AGIs below $25k, 86.2% for AGIs $25k-50k, 85.8% for AGIs $50k-75k, 85.3% for AGIs $75k-100k, 84.6% for AGIs $100k-200k, 63.2% for AGIs over 200k)
Taxable interest for individuals: $563 (reported on 22.9% of returns)
This zip code:
$563
California:
$2,146
(% of AGI for various income ranges: 0.3% for AGIs below $25k, 0.2% for AGIs $25k-50k, 0.2% for AGIs $50k-75k, 0.4% for AGIs $75k-100k, 0.3% for AGIs $100k-200k, 0.5% for AGIs over 200k)
Ordinary dividends: $2,323 (reported on 6.5% of returns)
Here:
$2,323
State:
$9,308
(% of AGI for various income ranges: 0.3% for AGIs below $25k, 0.2% for AGIs $25k-50k, 0.2% for AGIs $50k-75k, 0.3% for AGIs $75k-100k, 0.4% for AGIs $100k-200k, 1.7% for AGIs over 200k)
Net capital gain/loss in AGI: +$1,495 (reported on 4.5% of returns)
Here:
+$1,495
State:
+$30,460
(% of AGI for various income ranges: 0.2% for AGIs $75k-100k, 0.3% for AGIs $100k-200k, 1.8% for AGIs over 200k)
Profit/loss from business: +$10,769 (reported on 10.9% of returns)
Here:
+$10,769
State:
+$17,064
(% of AGI for various income ranges: 6.1% for AGIs below $25k, 2.5% for AGIs $25k-50k, 2.0% for AGIs $50k-75k, 1.8% for AGIs $75k-100k, 1.3% for AGIs $100k-200k, 6.9% for AGIs over 200k)
Taxable individual retirement arrangement distribution: $11,757 (reported on 3.8% of returns)
93906:
$11,757
California:
$19,557
(% of AGI for various income ranges: 0.8% for AGIs below $25k, 0.9% for AGIs $25k-50k, 1.0% for AGIs $50k-75k, 1.2% for AGIs $75k-100k, 1.2% for AGIs $100k-200k, 1.7% for AGIs over 200k)
Self-employment retirement plans: $14,333 (reported on 0.1% of returns)
93906:
$14,333
California:
$24,530
Total itemized deductions: $22,881 (29% of AGI, reported on 27.2% of returns)
Here:
$22,881
State:
$34,004
Here:
28.6% of AGI
State:
22.7% of AGI
(% of AGI for various income ranges: 6.2% for AGIs below $25k, 10.3% for AGIs $25k-50k, 16.4% for AGIs $50k-75k, 19.0% for AGIs $75k-100k, 19.4% for AGIs $100k-200k, 17.7% for AGIs over 200k)
Charity contributions: $2,184 (reported on 21.9% of returns)
Here:
$2,184
State:
$4,659
(% of AGI for various income ranges: 0.3% for AGIs below $25k, 0.7% for AGIs $25k-50k, 1.1% for AGIs $50k-75k, 1.5% for AGIs $75k-100k, 1.8% for AGIs $100k-200k, 1.6% for AGIs over 200k)
Taxes paid: $6,519 (reported on 27.2% of returns)
93906:
$6,519
State:
$14,448
(% of AGI for various income ranges: 1.0% for AGIs below $25k, 2.1% for AGIs $25k-50k, 4.0% for AGIs $50k-75k, 5.3% for AGIs $75k-100k, 6.7% for AGIs $100k-200k, 8.1% for AGIs over 200k)
Earned income credit: $2,443 (reported on 24.3% of returns)
Here:
$2,443
State:
$2,286
(% of AGI for various income ranges: 7.3% for AGIs below $25k, 1.6% for AGIs $25k-50k)
Percentage of individuals using paid preparers for their 2012 taxes: 71.4%
Here:
71%
State:
64%
(% for various income ranges: 70.2% for AGIs below $25k, 73.5% for AGIs $25k-50k, 73.5% for AGIs $50k-75k, 69.8% for AGIs $75k-100k, 68.3% for AGIs $100k-200k, 70.0% for AGIs over 200k)
Averages for the 2004 tax year for zip code 93906, filed in 2005:
Average Adjusted Gross Income (AGI) in 2004: $40,438 (Individual Income Tax Returns)
Here:
$40,438
State:
$58,600
Salary/wage: $38,702 (reported on 90.1% of returns)
Here:
$38,702
State:
$49,455
(% of AGI for various income ranges: 138.5% for AGIs below $10k, 83.4% for AGIs $10k-25k, 88.5% for AGIs $25k-50k, 88.6% for AGIs $50k-75k, 89.1% for AGIs $75k-100k, 78.1% for AGIs over 100k)
Taxable interest for individuals: $885 (reported on 35.4% of returns)
This zip code:
$885
California:
$2,365
(% of AGI for various income ranges: 3.5% for AGIs below $10k, 0.8% for AGIs $10k-25k, 0.6% for AGIs $25k-50k, 0.6% for AGIs $50k-75k, 0.6% for AGIs $75k-100k, 1.0% for AGIs over 100k)
Taxable dividends: $1,245 (reported on 10.9% of returns)
Here:
$1,245
State:
$4,746
(% of AGI for various income ranges: 1.7% for AGIs below $10k, 0.3% for AGIs $10k-25k, 0.2% for AGIs $25k-50k, 0.3% for AGIs $50k-75k, 0.2% for AGIs $75k-100k, 0.5% for AGIs over 100k)
Net capital gain/loss: +$8,035 (reported on 8.5% of returns)
Here:
+$8,035
State:
+$23,418
(% of AGI for various income ranges: -0.7% for AGIs below $10k, 0.1% for AGIs $10k-25k, 0.2% for AGIs $25k-50k, 0.4% for AGIs $50k-75k, 0.9% for AGIs $75k-100k, 6.1% for AGIs over 100k)
Profit/loss from business: +$11,104 (reported on 12.2% of returns)
Here:
+$11,104
State:
+$16,826
(% of AGI for various income ranges: 4.8% for AGIs below $10k, 4.2% for AGIs $10k-25k, 3.1% for AGIs $25k-50k, 2.3% for AGIs $50k-75k, 2.1% for AGIs $75k-100k, 5.0% for AGIs over 100k)
IRA payment deduction: $2,948 (reported on 1.6% of returns)
93906:
$2,948
California:
$3,192
(% of AGI for various income ranges: 0.1% for AGIs $10k-25k, 0.1% for AGIs $25k-50k, 0.1% for AGIs $50k-75k, 0.1% for AGIs $75k-100k, 0.1% for AGIs over 100k)
Self-employed pension: $15,712 (reported on 0.3% of returns)
Here:
$15,712
California:
$17,688
Total itemized deductions: $23,453 (34% of AGI, reported on 35.4% of returns)
Here:
$23,453
State:
$28,113
Here:
33.8% of AGI
State:
25.3% of AGI
(% of AGI for various income ranges: 21.6% for AGIs below $10k, 9.5% for AGIs $10k-25k, 18.4% for AGIs $25k-50k, 24.0% for AGIs $50k-75k, 24.3% for AGIs $75k-100k, 22.4% for AGIs over 100k)
Charity contributions deductions: $1,973 (3% of AGI, reported on 30.4% of returns)
Here:
$1,973
State:
$3,923
Here:
2.7% of AGI
State:
3.3% of AGI
(% of AGI for various income ranges: 0.7% for AGIs below $10k, 0.5% for AGIs $10k-25k, 1.0% for AGIs $25k-50k, 1.6% for AGIs $50k-75k, 2.0% for AGIs $75k-100k, 2.1% for AGIs over 100k)
Total tax: $4,941 (reported on 67.0% of returns)
93906:
$4,941
State:
$10,761
(% of AGI for various income ranges: 4.1% for AGIs below $10k, 3.1% for AGIs $10k-25k, 5.4% for AGIs $25k-50k, 7.1% for AGIs $50k-75k, 8.9% for AGIs $75k-100k, 14.8% for AGIs over 100k)
Earned income credit: $1,910 (reported on 19.8% of returns)
Here:
$1,910
State:
$1,763
Percentage of individuals using paid preparers for their 2004 taxes: 71.1%
Here:
71%
State:
66%
(% for various income ranges: 63.0% for AGIs below $10k, 74.6% for AGIs $10k-25k, 72.4% for AGIs $25k-50k, 70.5% for AGIs $50k-75k, 71.4% for AGIs $75k-100k, 69.7% for AGIs over 100k)
Likely homosexual households (counted as self-reported same-sex unmarried-partner households)
Lesbian couples: 0.0% of all households
Gay men: 0.0% of all households
Household received Food Stamps/SNAP in the past 12 months: 1,813 Household did not receive Food Stamps/SNAP in the past 12 months: 16,145
Women who had a birth in the past 12 months: 652 (408 now married, 245 unmarried) Women who did not have a birth in the past 12 months: 15,373 (5,782 now married, 9,603 unmarried)
Housing units in zip code 93906 with a mortgage: 6,491 (406 second mortgage, 5 home equity loan, 401 both second mortgage and home equity loan) Houses without a mortgage: 207
Median monthly owner costs for units with a mortgage: $2,334 Median monthly owner costs for units without a mortgage: $630
Residents with income below the poverty level in 2022:
This zip code:
10.0%
Whole state:
12.2%
Residents with income below 50% of the poverty level in 2022:
This zip code:
6.7%
Whole state:
6.2%
Median number of rooms in houses and condos:
Here:
5.6
State:
6.0
Median number of rooms in apartments:
Here:
4.2
State:
3.9
Notable locations in this zip code not listed on our city pages
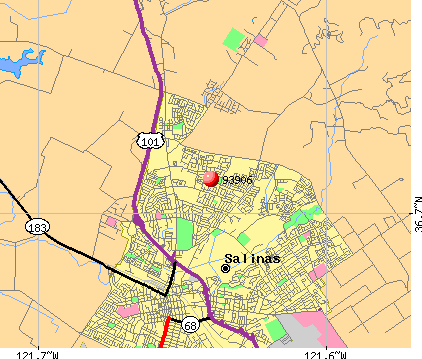
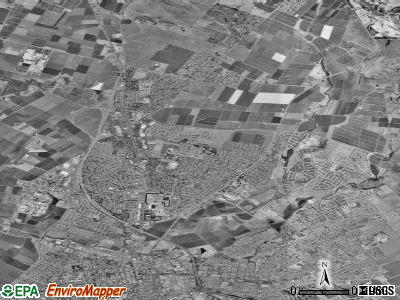
Notable locations in zip code 93906: California Rodeo Grounds (A), Monterey County Sheriff Posse Grounds and Area (B), Salinas Golf and Country Club (C), Salinas Conference Center (D), Monterey County Social Services (E), Monterey County Jail (F), Monterey County Adult Detention Center (G), Salinas Fire Department Station 2 (H), Salinas Fire Department Station 6 (I). Display/hide their locations on the map
Shopping Centers: Salinas Shopping Center (1), Northridge Shopping Center (2), Sherwood Gardens Shopping Center (3), Harden Ranch Shopping Center (4), Alvin Square Shopping Center (5). Display/hide their locations on the map
Parks in zip code 93906 include: El Dorado Community Park (1), Laurel Park (2), Natividad Park (3), Northgate Park (4), Gabilan Creek Wilderness Sanctuary (5), Santa Rita Park (6), Steinbeck Park (7), Sherwood Park (8). Display/hide their locations on the map
10,519 married couples with children.
4,552 single-parent households (1,569 men, 2,983 women).
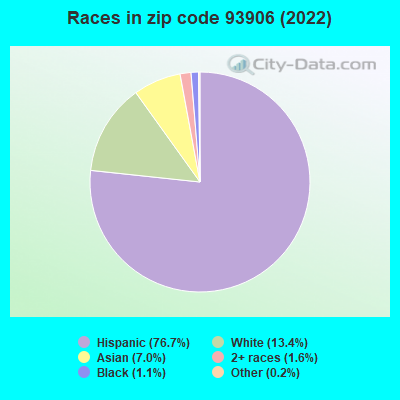
32.2% of residents of 93906 zip code speak English at home.
62.1% of residents speak Spanish at home (57% very well, 13% well, 13% not well, 17% not at all).
1.1% of residents speak other Indo-European language at home (67% very well, 18% well, 10% not well, 4% not at all).
4.3% of residents speak Asian or Pacific Island language at home (57% very well, 31% well, 11% not well).
0.5% of residents speak other language at home (65% very well, 15% well, 5% not well, 14% not at all).
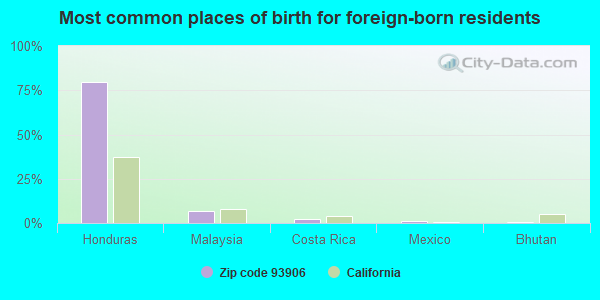
Foreign born population: 22,291 (33.6%) (31.9% of them are naturalized citizens)
Major facilities with environmental interests located in this zip code:
EL GABILAN ELEMENTARY (1256 LINWOOD DR. in SALINAS, CA)
(National Center for Education Statistics) - STATE ID-6026520 Organizations: SALINAS CITY ELEMENTARY (SCHOOL DISTRICT)
EVERETT ALVAREZ HIGH (1900 INDEPENDENCE BLVD. in SALINAS, CA)
(National Center for Education Statistics) - STATE ID-2730166 Organizations: SALINAS UNION HIGH (SCHOOL DISTRICT)
GAVILAN VIEW MIDDLE (18250 VAN BUREN AVE. in SALINAS, CA)
(National Center for Education Statistics) - STATE ID-6102925 Organizations: SANTA RITA UNION ELEMENTARY (SCHOOL DISTRICT)
HARDEN MIDDLE (1561 MCKINNON ST. in SALINAS, CA)
(National Center for Education Statistics) - STATE ID-6110753 Organizations: SALINAS UNION HIGH (SCHOOL DISTRICT)
KAMMANN (HENRY F.) ELEMENTARY (521 ROCHEX ST. in SALINAS, CA)
(National Center for Education Statistics) - STATE ID-6026538 Organizations: SALINAS CITY ELEMENTARY (SCHOOL DISTRICT)
LA JOYA ELEMENTARY (55 ROGGE ROAD in SALINAS, CA)
(National Center for Education Statistics) - STATE ID-6026652 Organizations: SANTA RITA UNION ELEMENTARY (SCHOOL DISTRICT)
LOMA VISTA ELEMENTARY (757 SAUSAL DR. in SALINAS, CA)
(National Center for Education Statistics) - STATE ID-6026553 Organizations: SALINAS CITY ELEMENTARY (SCHOOL DISTRICT)
MCKINNON (2100 MCKINNON in SALINAS, CA)
(National Center for Education Statistics) - STATE ID-6120224 Organizations: SANTA RITA UNION ELEMENTARY (SCHOOL DISTRICT)
BALDWIN PARK COMMUNITY DAY (1121-A BALDWIN ST. in SALINAS, CA)
(National Center for Education Statistics) - STATE ID-6117055 Organizations: SALINAS CITY ELEMENTARY (SCHOOL DISTRICT)
MOUNT TORO HIGH (10 SHERWOOD PLACE in SALINAS, CA)
(National Center for Education Statistics) - STATE ID-2734481 Organizations: SALINAS UNION HIGH (SCHOOL DISTRICT)
NATIVIDAD ELEMENTARY (1465 MODOC AVE. in SALINAS, CA)
(National Center for Education Statistics) - STATE ID-6026595 Organizations: SALINAS CITY ELEMENTARY (SCHOOL DISTRICT)
NORTH SALINAS HIGH (55 KIP DR. in SALINAS, CA)
(National Center for Education Statistics) - STATE ID-2733178 Organizations: SALINAS UNION HIGH (SCHOOL DISTRICT)
GRAPHIC COMMUNICATIONS (1220 NATIVIDAD ROAD in SALINAS, CA)
Large Quantity Generators, more that 1000 kg of hazardous waste/month (Resource Conservation and Recovery Act (tracking hazardous waste)) - notification Organizations: COUNTY OF MONTEREY (CONTACT/OWNER)
Housing units lacking complete plumbing facilities: 0.4% Housing units lacking complete kitchen facilities: 1.3%
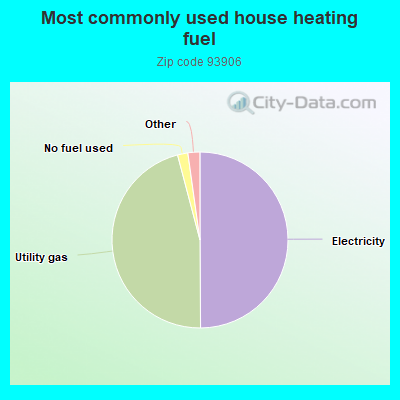
49.9%Electricity
46.0%Utility gas
1.9%No fuel used
0.9%Solar energy
0.7%Wood
0.5%Bottled, tank, or LP gas
Population in 1990: 39,534. Population change in the 1990s: +14,404 (+36.4%).
Place of birth for U.S.-born residents:
This state: 39,402
Northeast: 325
Midwest: 763
South: 1,365
West: 1,179
47% of the 93906 zip code residents lived in the same house 5 years ago. Out of people who lived in different houses, 71% lived in this county. Out of people who lived in different counties, 50% lived in California.
89% of the 93906 zip code residents lived in the same house 1 year ago. Out of people who lived in different houses, 62% moved from this county. Out of people who lived in different houses, 23% moved from different county within same state. Out of people who lived in different houses, 6% moved from different state. Out of people who lived in different houses, 8% moved from abroad.
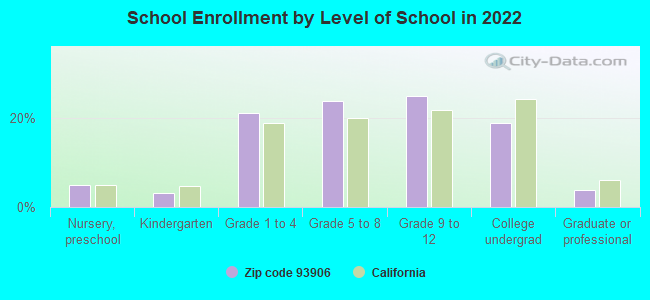
Private vs. public school enrollment:
Students in private schools in grades 1 to 8 (elementary and middle school): 242
Here:
3.0%
California:
10.5%
Students in private schools in grades 9 to 12 (high school): 210
Here:
4.7%
California:
8.5%
Students in private undergraduate colleges: 215
Here:
6.4%
California:
15.9%
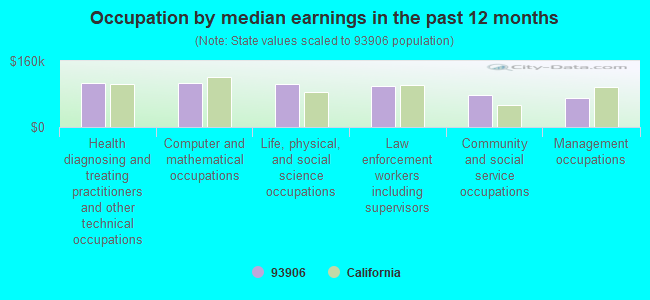
Occupation by median earnings in the past 12 months ($)
107,684Health diagnosing and treating practitioners and other technical occupations
106,387Computer and mathematical occupations
105,305Life, physical, and social science occupations
98,933Law enforcement workers including supervisors
76,856Community and social service occupations
69,121Management occupations
Companies with federal contracts located in this zip code (SALINAS, CA):
VIRTUAL INSTRUMENTATION EFFECT (1687 LITTLE RIVER DR; small business) : $446,203 in 6 contractsfrom 2004 to 2006
Contracts for Mathematical and Computer Sciences -- Basic Research (R&D), Other Research and Development -- Basic Research (R&D), ADP Support Equipment by Navy Signed by year:2000: $0; 2001: $0; 2002: $0; 2003: $0; 2004: $104,376; 2005: $200,051; 2006: $141,776.
Biggest contracts:
$200,051 with Navy for Mathematical and Computer Sciences -- Basic Research (R&D). Signed on 2005-02-03. Completion date: 2007-02-07.
$101,776, same as above.Signed on 2006-02-01. Completion date: 2007-02-07.
$69,997 with Navy for Other Research and Development -- Basic Research (R&D). Signed on 2004-04-30. Completion date: 2004-11-03.
$40,000 with Navy for ADP Support Equipment. Signed on 2006-03-08. Completion date: 2006-04-07.
M K SHIELDS COMPANY (1 BURLINGTON CIRCLE; small business) : $333,861 in 4 contractsfrom 2000 to 2001
$126,510 with Navy for Other Professional Services. Taking place in MD. Signed on 2001-11-15. Completion date: 2002-09-30.
$85,000 with Navy for Defense Electronics and Communication Equipment -- Engineering Development (R&D). Signed on 2000-05-16. Completion date: 2000-09-30.
$61,176, same as above.Signed on 2000-10-01. Completion date: 2001-09-30.
$61,175, same as above.Signed on 2000-10-01. Completion date: 2001-09-30.
CENTRAL COAST ALARM SERVICE (57 NORMAN WAY; small business)
$27,220 with Army for Cameras, Motion Picture. Signed on 2001-09-28. Completion date: 2001-11-29.
HUCHEL, SARAH (127 HARDEN PKWY #H; small business)
$9,960 with Army for Chaplain Services. Signed on 2003-01-15. Completion date: 2003-09-30.
MONTEREY COUNTY (1414 NATIVIDAD ROAD) : $9,000 in 5 contractsfrom 2001 to 2003
Contracts for ADP Systems Development Services, ADP Facility Operation and Maintenance Services by Army Signed by year:2000: $0; 2001: $3,000; 2002: $3,000; 2003: $3,000; 2004: $0; 2005: $0; 2006: $0.
Biggest contracts:
$3,000 with Army for ADP Systems Development Services. Signed on 2003-11-07. Completion date: 2004-09-30.
$3,000 with Army for ADP Facility Operation and Maintenance Services. Signed on 2002-11-25. Completion date: 2003-09-30.
$3,000, same as above.Signed on 2001-11-08. Completion date: 2002-09-30.
$0, same as above.Signed on 2002-11-25. Completion date: 2003-09-30.
COUNTY OF MONTEREY (1270 NATIVIDAD ROAD; small business) : $4,725 in 3 contractsfrom 2002 to 2003
$9,180 with Navy for Water Quality Support Services. Signed on 2002-11-01. Completion date: 2003-07-31.
$630, same as above.Signed on 2003-02-27. Completion date: 2003-07-31.
-$5,085, same as above.Signed on 2003-06-25. Completion date: 2003-07-31.
Top industries in this zip code by the number of employees in 2005:
Health Care and Social Assistance: General Medical and Surgical Hospitals (500-999 employees: 1 establishment)
2005 - 2018 National Fire Incident Reporting System (NFIRS) incidents
Based on the data from the years 2005 - 2018 the average number of fires per year is 35. The highest number of fire incidents - 112 took place in 2016, and the least - 0 in 2014. The data has a declining trend.
When looking into fire subcategories, the most reports belonged to: Outside Fires (47.4%), and Structure Fires (28.3%).
Fire incident types reported to NFIRS in Zip Code 93906


 Nearest zip codes: 93905, 93907, 93908, 93901, 93962, 95012.
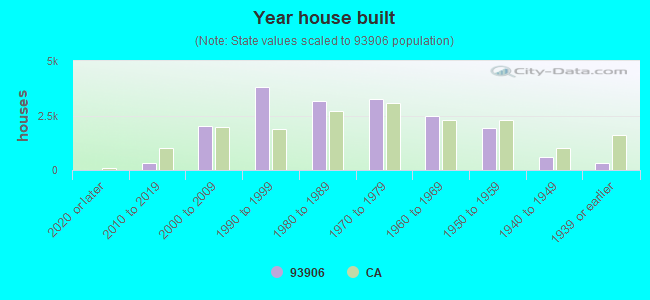


 Based on the data from the years 2005 - 2018 the average number of fires per year is 35. The highest number of fire incidents - 112 took place in 2016, and the least - 0 in 2014. The data has a declining trend.
 When looking into fire subcategories, the most reports belonged to: Outside Fires (47.4%), and Structure Fires (28.3%).