Estimated zip code population in 2022: 18,788 Zip code population in 2010: 18,287 Zip code population in 2000: 16,705
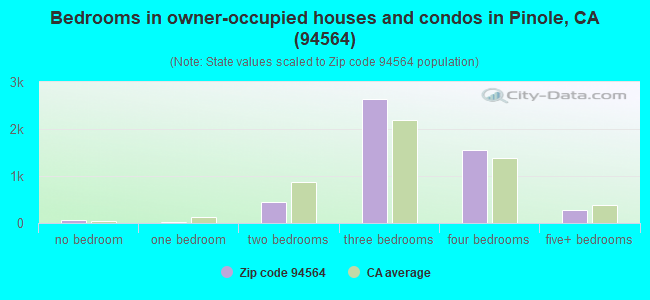
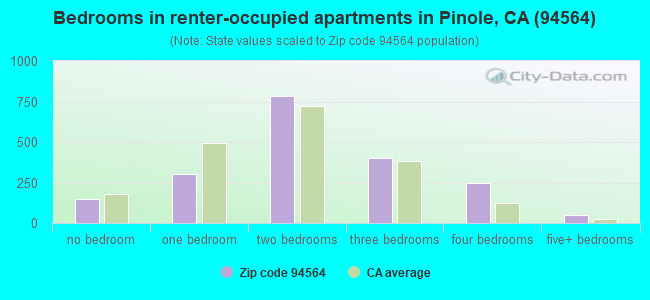
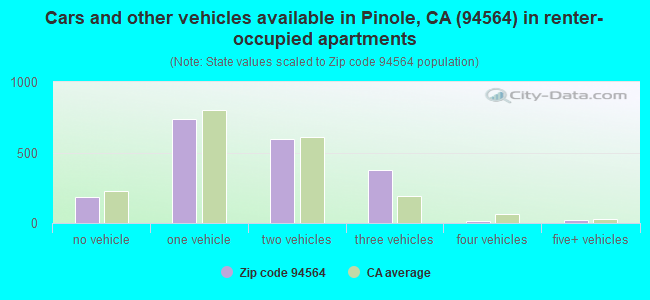
Houses and condos: 7,298 Renter-occupied apartments: 1,922
% of renters here:
28%
State:
44%
March 2022 cost of living index in zip code 94564: 117.2 (more than average, U.S. average is 100)
Land area: 5.6 sq. mi. Water area: 0.5 sq. mi.
Population density: 3,367 people per square mile
(average).
OSM Map
General Map
Google Map
MSN Map
OSM Map
General Map
Google Map
MSN Map
OSM Map
General Map
Google Map
MSN Map
OSM Map
General Map
Google Map
MSN Map
Please wait while loading the map...
Real estate property taxes paid for housing units in 2022:
This zip code:
0.8% ($5,785)
California:
0.7% ($4,831)
Median real estate property taxes paid for housing units with mortgages in 2022: $6,513 (0.9%) Median real estate property taxes paid for housing units with no mortgage in 2022: $4,012 (0.6%)
Estimated median house/condo value in 2022: $723,935
94564:
$723,935
California:
$715,900
According to our research of California and other state lists, there were 7 registered sex offenders living in 94564 zip code as of April 26, 2024. The ratio of all residents to sex offenders in zip code 94564 is 2,754 to 1. The ratio of registered sex offenders to all residents in this zip code is much lower than the state average.
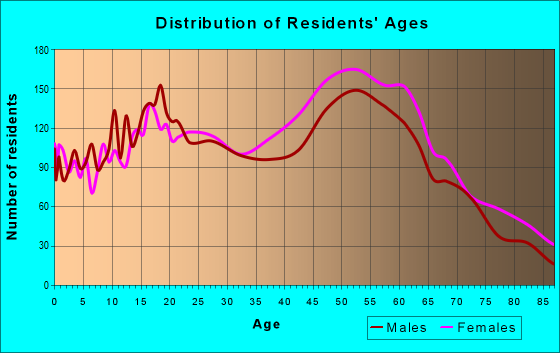
Median resident age:
This zip code:
43.3 years
California median age:
37.9 years
Average household size:
This zip code:
2.7 people
California:
2.8 people
Averages for the 2020 tax year for zip code 94564, filed in 2021:
Average Adjusted Gross Income (AGI) in 2020: $79,162 (Individual Income Tax Returns)
Here:
$79,162
State:
$95,910
Salary/wage: $70,960 (reported on 77.5% of returns)
Here:
$70,960
State:
$77,331
(% of AGI for various income ranges: 1102.4% for AGIs below $25k, 3684.9% for AGIs $25k-50k, 7011.5% for AGIs $50k-75k, 10414.1% for AGIs $75k-100k, 19898.3% for AGIs $100k-200k, 62974.8% for AGIs over 200k)
Taxable interest for individuals: $903 (reported on 42.0% of returns)
This zip code:
$903
California:
$2,294
(% of AGI for various income ranges: 18.8% for AGIs below $25k, 34.5% for AGIs $25k-50k, 53.3% for AGIs $50k-75k, 61.1% for AGIs $75k-100k, 116.0% for AGIs $100k-200k, 408.1% for AGIs over 200k)
Ordinary dividends: $4,433 (reported on 19.5% of returns)
Here:
$4,433
State:
$10,949
(% of AGI for various income ranges: 33.1% for AGIs below $25k, 43.4% for AGIs $25k-50k, 111.7% for AGIs $50k-75k, 181.1% for AGIs $75k-100k, 323.2% for AGIs $100k-200k, 862.4% for AGIs over 200k)
Net capital gain/loss in AGI: +$15,645 (reported on 18.6% of returns)
Here:
+$15,645
State:
+$49,306
(% of AGI for various income ranges: 5.1% for AGIs below $25k, 31.1% for AGIs $25k-50k, 108.4% for AGIs $50k-75k, 150.8% for AGIs $75k-100k, 529.6% for AGIs $100k-200k, 10227.6% for AGIs over 200k)
Profit/loss from business: +$12,399 (reported on 18.7% of returns)
Here:
+$12,399
State:
+$15,671
(% of AGI for various income ranges: 204.3% for AGIs below $25k, 210.8% for AGIs $25k-50k, 348.9% for AGIs $50k-75k, 439.6% for AGIs $75k-100k, 658.1% for AGIs $100k-200k, 1794.8% for AGIs over 200k)
Taxable individual retirement arrangement distribution: $24,022 (reported on 9.2% of returns)
94564:
$24,022
California:
$23,505
(% of AGI for various income ranges: 61.0% for AGIs below $25k, 138.5% for AGIs $25k-50k, 226.9% for AGIs $50k-75k, 440.4% for AGIs $75k-100k, 837.7% for AGIs $100k-200k, 2451.0% for AGIs over 200k)
Self-employed (Keogh) retirement plans: $18,360 (reported on 0.5% of returns)
94564:
$18,360
California:
$30,163
(% of AGI for various income ranges: 85.8% for AGIs $100k-200k)
Total itemized deductions: $29,467 (reported on 19.5% of returns)
Here:
$29,467
State:
$39,517
(% of AGI for various income ranges: 137.5% for AGIs below $25k, 295.7% for AGIs $25k-50k, 707.9% for AGIs $50k-75k, 1277.5% for AGIs $75k-100k, 2232.3% for AGIs $100k-200k, 5779.0% for AGIs over 200k)
Charity contributions: $5,172 (reported on 14.8% of returns)
Here:
$5,172
State:
$12,598
(% of AGI for various income ranges: 8.0% for AGIs below $25k, 28.2% for AGIs $25k-50k, 73.1% for AGIs $50k-75k, 179.7% for AGIs $75k-100k, 312.3% for AGIs $100k-200k, 925.7% for AGIs over 200k)
Taxes paid: $8,826 (reported on 19.4% of returns)
94564:
$8,826
State:
$8,807
(% of AGI for various income ranges: 32.9% for AGIs below $25k, 76.8% for AGIs $25k-50k, 212.3% for AGIs $50k-75k, 394.4% for AGIs $75k-100k, 733.8% for AGIs $100k-200k, 1458.1% for AGIs over 200k)
Earned income credit: $1,675 (reported on 9.1% of returns)
Here:
$1,675
State:
$2,074
(% of AGI for various income ranges: 59.8% for AGIs below $25k, 43.4% for AGIs $25k-50k)
Percentage of individuals using paid preparers for their 2020 taxes: 90.1%
Here:
90%
State:
92%
(% for various income ranges: 88.0% for AGIs below $25k, 90.0% for AGIs $25k-50k, 90.9% for AGIs $50k-75k, 91.2% for AGIs $75k-100k, 91.0% for AGIs $100k-200k, 92.1% for AGIs over 200k)
Averages for the 2012 tax year for zip code 94564, filed in 2013:
Average Adjusted Gross Income (AGI) in 2012: $61,572 (Individual Income Tax Returns)
Here:
$61,572
State:
$72,726
Salary/wage: $56,153 (reported on 80.4% of returns)
Here:
$56,153
State:
$59,079
(% of AGI for various income ranges: 68.6% for AGIs below $25k, 74.7% for AGIs $25k-50k, 73.3% for AGIs $50k-75k, 73.2% for AGIs $75k-100k, 77.2% for AGIs $100k-200k, 62.9% for AGIs over 200k)
Taxable interest for individuals: $749 (reported on 43.6% of returns)
This zip code:
$749
California:
$2,146
(% of AGI for various income ranges: 1.0% for AGIs below $25k, 0.7% for AGIs $25k-50k, 0.6% for AGIs $50k-75k, 0.5% for AGIs $75k-100k, 0.4% for AGIs $100k-200k, 0.4% for AGIs over 200k)
Ordinary dividends: $3,659 (reported on 19.2% of returns)
Here:
$3,659
State:
$9,308
(% of AGI for various income ranges: 1.6% for AGIs below $25k, 1.2% for AGIs $25k-50k, 1.5% for AGIs $50k-75k, 1.0% for AGIs $75k-100k, 1.0% for AGIs $100k-200k, 0.8% for AGIs over 200k)
Net capital gain/loss in AGI: +$4,997 (reported on 13.4% of returns)
Here:
+$4,997
State:
+$30,460
(% of AGI for various income ranges: 0.4% for AGIs $50k-75k, 0.3% for AGIs $75k-100k, 1.0% for AGIs $100k-200k, 5.7% for AGIs over 200k)
Profit/loss from business: +$12,780 (reported on 15.7% of returns)
Here:
+$12,780
State:
+$17,064
(% of AGI for various income ranges: 9.7% for AGIs below $25k, 5.1% for AGIs $25k-50k, 3.0% for AGIs $50k-75k, 2.6% for AGIs $75k-100k, 2.1% for AGIs $100k-200k, 2.4% for AGIs over 200k)
Taxable individual retirement arrangement distribution: $18,402 (reported on 11.1% of returns)
94564:
$18,402
California:
$19,557
(% of AGI for various income ranges: 3.9% for AGIs below $25k, 2.6% for AGIs $25k-50k, 3.1% for AGIs $50k-75k, 3.1% for AGIs $75k-100k, 3.5% for AGIs $100k-200k, 3.9% for AGIs over 200k)
Self-employment retirement plans: $10,180 (reported on 0.5% of returns)
94564:
$10,180
California:
$24,530
Total itemized deductions: $24,119 (25% of AGI, reported on 43.2% of returns)
Here:
$24,119
State:
$34,004
Here:
25.0% of AGI
State:
22.7% of AGI
(% of AGI for various income ranges: 11.8% for AGIs below $25k, 14.0% for AGIs $25k-50k, 16.7% for AGIs $50k-75k, 18.4% for AGIs $75k-100k, 18.8% for AGIs $100k-200k, 15.8% for AGIs over 200k)
Charity contributions: $2,827 (reported on 35.0% of returns)
Here:
$2,827
State:
$4,659
(% of AGI for various income ranges: 0.7% for AGIs below $25k, 1.1% for AGIs $25k-50k, 1.6% for AGIs $50k-75k, 1.7% for AGIs $75k-100k, 1.9% for AGIs $100k-200k, 1.7% for AGIs over 200k)
Taxes paid: $8,729 (reported on 43.2% of returns)
94564:
$8,729
State:
$14,448
(% of AGI for various income ranges: 2.7% for AGIs below $25k, 3.5% for AGIs $25k-50k, 5.0% for AGIs $50k-75k, 6.3% for AGIs $75k-100k, 7.6% for AGIs $100k-200k, 8.1% for AGIs over 200k)
Earned income credit: $1,886 (reported on 11.6% of returns)
Here:
$1,886
State:
$2,286
(% of AGI for various income ranges: 4.2% for AGIs below $25k, 0.7% for AGIs $25k-50k)
Percentage of individuals using paid preparers for their 2012 taxes: 55.3%
Here:
55%
State:
64%
(% for various income ranges: 47.7% for AGIs below $25k, 54.8% for AGIs $25k-50k, 56.6% for AGIs $50k-75k, 61.7% for AGIs $75k-100k, 61.8% for AGIs $100k-200k, 69.6% for AGIs over 200k)
Averages for the 2004 tax year for zip code 94564, filed in 2005:
Average Adjusted Gross Income (AGI) in 2004: $53,265 (Individual Income Tax Returns)
Here:
$53,265
State:
$58,600
Salary/wage: $49,923 (reported on 82.3% of returns)
Here:
$49,923
State:
$49,455
(% of AGI for various income ranges: 148.3% for AGIs below $10k, 68.7% for AGIs $10k-25k, 76.4% for AGIs $25k-50k, 78.4% for AGIs $50k-75k, 81.4% for AGIs $75k-100k, 74.6% for AGIs over 100k)
Taxable interest for individuals: $1,339 (reported on 55.0% of returns)
This zip code:
$1,339
California:
$2,365
(% of AGI for various income ranges: 7.4% for AGIs below $10k, 3.1% for AGIs $10k-25k, 1.6% for AGIs $25k-50k, 1.6% for AGIs $50k-75k, 0.9% for AGIs $75k-100k, 1.0% for AGIs over 100k)
Taxable dividends: $2,102 (reported on 25.1% of returns)
Here:
$2,102
State:
$4,746
(% of AGI for various income ranges: 5.7% for AGIs below $10k, 1.9% for AGIs $10k-25k, 1.4% for AGIs $25k-50k, 1.2% for AGIs $50k-75k, 0.6% for AGIs $75k-100k, 0.7% for AGIs over 100k)
Net capital gain/loss: +$7,160 (reported on 19.1% of returns)
Here:
+$7,160
State:
+$23,418
(% of AGI for various income ranges: -2.3% for AGIs below $10k, 0.7% for AGIs $10k-25k, 0.3% for AGIs $25k-50k, 0.8% for AGIs $50k-75k, 0.7% for AGIs $75k-100k, 6.0% for AGIs over 100k)
Profit/loss from business: +$15,501 (reported on 15.6% of returns)
Here:
+$15,501
State:
+$16,826
(% of AGI for various income ranges: 4.4% for AGIs below $10k, 7.6% for AGIs $10k-25k, 4.6% for AGIs $25k-50k, 4.0% for AGIs $50k-75k, 3.6% for AGIs $75k-100k, 4.8% for AGIs over 100k)
IRA payment deduction: $3,321 (reported on 3.1% of returns)
94564:
$3,321
California:
$3,192
(% of AGI for various income ranges: 0.4% for AGIs $10k-25k, 0.3% for AGIs $25k-50k, 0.2% for AGIs $50k-75k, 0.2% for AGIs $75k-100k, 0.1% for AGIs over 100k)
Self-employed pension: $12,520 (reported on 1.1% of returns)
Here:
$12,520
California:
$17,688
(% of AGI for various income ranges: 0.2% for AGIs $25k-50k, 0.2% for AGIs $50k-75k, 0.3% for AGIs $75k-100k, 0.4% for AGIs over 100k)
Total itemized deductions: $23,653 (29% of AGI, reported on 48.1% of returns)
Here:
$23,653
State:
$28,113
Here:
29.0% of AGI
State:
25.3% of AGI
(% of AGI for various income ranges: 32.7% for AGIs below $10k, 20.8% for AGIs $10k-25k, 18.4% for AGIs $25k-50k, 22.3% for AGIs $50k-75k, 23.5% for AGIs $75k-100k, 21.0% for AGIs over 100k)
Charity contributions deductions: $2,479 (3% of AGI, reported on 42.6% of returns)
Here:
$2,479
State:
$3,923
Here:
3.0% of AGI
State:
3.3% of AGI
(% of AGI for various income ranges: 1.2% for AGIs below $10k, 1.4% for AGIs $10k-25k, 1.6% for AGIs $25k-50k, 2.1% for AGIs $50k-75k, 2.4% for AGIs $75k-100k, 2.0% for AGIs over 100k)
Total tax: $6,921 (reported on 82.6% of returns)
94564:
$6,921
State:
$10,761
(% of AGI for various income ranges: 6.5% for AGIs below $10k, 4.6% for AGIs $10k-25k, 7.2% for AGIs $25k-50k, 9.0% for AGIs $50k-75k, 9.9% for AGIs $75k-100k, 14.9% for AGIs over 100k)
Earned income credit: $1,558 (reported on 8.4% of returns)
Here:
$1,558
State:
$1,763
Percentage of individuals using paid preparers for their 2004 taxes: 62.1%
Here:
62%
State:
66%
(% for various income ranges: 51.3% for AGIs below $10k, 62.2% for AGIs $10k-25k, 61.2% for AGIs $25k-50k, 65.9% for AGIs $50k-75k, 66.9% for AGIs $75k-100k, 66.3% for AGIs over 100k)
Likely homosexual households (counted as self-reported same-sex unmarried-partner households)
Lesbian couples: 0.2% of all households
Gay men: 0.1% of all households
Household received Food Stamps/SNAP in the past 12 months: 591 Household did not receive Food Stamps/SNAP in the past 12 months: 6,250
Women who had a birth in the past 12 months: 293 (192 now married, 101 unmarried) Women who did not have a birth in the past 12 months: 3,773 (1,477 now married, 2,296 unmarried)
Housing units in zip code 94564 with a mortgage: 3,247 (311 second mortgage, 35 home equity loan, 266 both second mortgage and home equity loan) Houses without a mortgage: 88
Median monthly owner costs for units with a mortgage: $2,702 Median monthly owner costs for units without a mortgage: $768
Residents with income below the poverty level in 2022:
This zip code:
5.6%
Whole state:
12.2%
Residents with income below 50% of the poverty level in 2022:
This zip code:
2.3%
Whole state:
6.2%
Median number of rooms in houses and condos:
Here:
6.1
State:
6.0
Median number of rooms in apartments:
Here:
4.4
State:
3.9
Notable locations in this zip code not listed on our city pages
Notable locations in zip code 94564: Pinole/Hercules Wastewater Treatment Plant (A), Pinole City Hall (B), Pinole Branch Contra Costa County Library (C), Pinole Fire Department Station 74 (D), Pinole Fire Department Station 73 (E). Display/hide their locations on the map
Shopping Centers: Appian Eighty Shopping Center (1), Pinole Valley Shopping Center (2), Pinole Vista Shopping Center (3). Display/hide their locations on the map
Churches in zip code 94564 include: Saint Joseph Roman Catholic Church (A), Our Savior Lutheran Church (B), Christ the Lord Episcopal Church (C). Display/hide their locations on the map
Parks in zip code 94564 include: Creekside Park (1), Savage Avenue Park (2), Stewart Draw Park (3), Bayfront Park (4), Fernandez Park (5), Louie Francis Park (6), Meadow Park (7), Pinole Valley Park (8). Display/hide their locations on the map
1,871 married couples with children.
1,027 single-parent households (516 men, 511 women).
64.4% of residents of 94564 zip code speak English at home.
14.4% of residents speak Spanish at home (65% very well, 24% well, 10% not well, 1% not at all).
3.8% of residents speak other Indo-European language at home (72% very well, 20% well, 7% not well).
16.1% of residents speak Asian or Pacific Island language at home (53% very well, 25% well, 11% not well, 11% not at all).
1.7% of residents speak other language at home (79% very well, 17% well, 1% not well, 3% not at all).
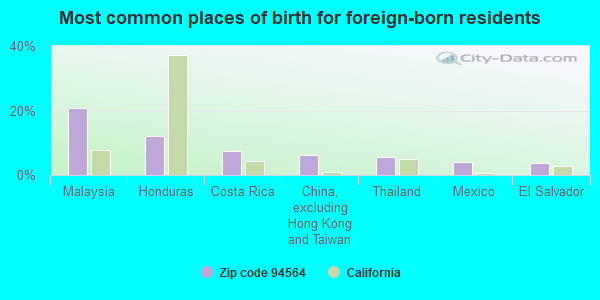
Foreign born population: 5,528 (29.4%) (71.4% of them are naturalized citizens)
This zip code:
29.4%
Whole state:
26.7%
21%Malaysia
12%Honduras
8%Costa Rica
6%China, excluding Hong Kong and Taiwan
6%Thailand
4%Mexico
4%El Salvador
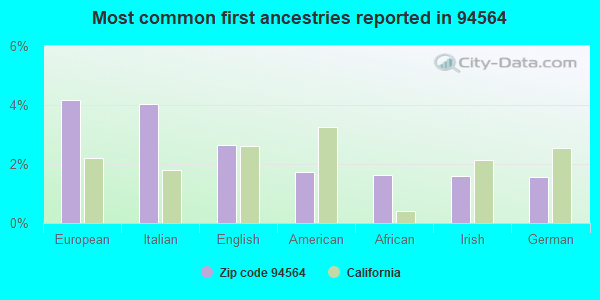
4%European
4%Italian
3%English
2%American
2%African
2%Irish
2%German
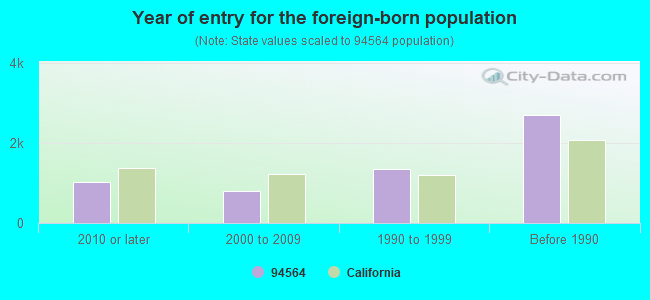
Year of entry for the foreign-born population
1,0162010 or later
8042000 to 2009
1,3601990 to 1999
2,698Before 1990
Facilities with environmental interests located in this zip code:
CHEVRON STATION 95614 (1201 TARA HILLS DR in PINOLE, CA)
STATE MASTER (California - Hazardous Waste Tracking) - HAZARDOU WASTE PROGRAM HAZARDOUS WASTE BIENNIAL REPORTER (Resource Conservation and Recovery Act (tracking hazardous waste)) (Resource Conservation and Recovery Act (tracking hazardous waste)) Organizations: CHEVRON USA INC (CONTACT/OWNER)
Alternative names: CHEVRON 95614, CHEVRON USA INC SERV STA #95614
EQUILON ENTERPRISES (2690 PINOLE VALLEY RD in PINOLE, CA) . Federal Facility
STATE MASTER (California - Hazardous Waste Tracking) - HAZARDOU WASTE PROGRAM Small Quantity Generators, between 100 kg and 1000 kg of hazardous waste/month (Resource Conservation and Recovery Act (tracking hazardous waste)) - notification Organizations: EQUILON ENTERPRISES, LLC (CONTACT/OWNER)
Alternative names: SHELL OIL CO
EQUILON ENTERPRISES LLC (2301 SAN PABLO/TENNANT in PINOLE, CA) . Federal Facility
STATE MASTER (California - Hazardous Waste Tracking) - HAZARDOU WASTE PROGRAM Small Quantity Generators, between 100 kg and 1000 kg of hazardous waste/month (Resource Conservation and Recovery Act (tracking hazardous waste)) - notification Organizations: EQUILON ENTERPRISES, LLC (CONTACT/OWNER)
Alternative names: SHELL OIL CO
ELLERHORST ELEMENTARY (3501 PINOLE VALLEY ROAD in PINOLE, CA)
(National Center for Education Statistics) - STATE ID-6004733 Organizations: WEST CONTRA COSTA UNIFIED (SCHOOL DISTRICT)
CHEVRON STATION 94014 (2695 PINOLE VALLEY RD in PINOLE, CA)
Small Quantity Generators, between 100 kg and 1000 kg of hazardous waste/month (Resource Conservation and Recovery Act (tracking hazardous waste)) - notification HAZARDOUS WASTE BIENNIAL REPORTER (Resource Conservation and Recovery Act (tracking hazardous waste)) (Resource Conservation and Recovery Act (tracking hazardous waste)) Organizations: CHEVRON PRODUCTS CO (CONTACT/OWNER)
Alternative names: CHEVRON STATION NO 94014, CHEVRON USA INC SERV STA #94014
FIELD TRUCKING (2601 LASSEN WAY in PINOLE, CA)
TRANSPORTER (Resource Conservation and Recovery Act (tracking hazardous waste)) Organizations: CURTIS E FIELD (CONTACT/OWNER)
FOUR MILE CLEANERS (1441 TARA HILLS DRIVE in PINOLE, CA)
CRITERIA AND HAZARDOUS AIR POLLUTANT INVENTORY (Inventory of air pollution sources) Small Quantity Generators, between 100 kg and 1000 kg of hazardous waste/month (Resource Conservation and Recovery Act (tracking hazardous waste)) Business SIC classification: DRYCLEANING PLANTS, EXCEPT RUG CLEANING Alternative names: HOLIDAY CLEANERS
KIYOHARA CLEANERS (1576 FITZGERALD DR in PINOLE, CA)
Small Quantity Generators, between 100 kg and 1000 kg of hazardous waste/month (Resource Conservation and Recovery Act (tracking hazardous waste))
APPIAN 80 EXPRESS CLEANERS (1577 TARA HILLS DR in PINOLE, CA)
CRITERIA AND HAZARDOUS AIR POLLUTANT INVENTORY (Inventory of air pollution sources) Business SIC classification: DRYCLEANING PLANTS, EXCEPT RUG CLEANING
JATC TRAINING COMMITTEE OF THE EAST BAY (600 ROBLE AVE. in PINOLE, CA)
COMPLIANCE ACTIVITY (Tracking inspections of insecticide, fungicide, and rodenticide, and toxic substances)
K MART (1500 FITZGERALD in PINOLE, CA)
COMPLIANCE ACTIVITY (Tracking inspections of insecticide, fungicide, and rodenticide, and toxic substances)
CATHEY'S BODY SHOP (720D SAN PABLO AVE in PINOLE, CA)
CRITERIA AND HAZARDOUS AIR POLLUTANT INVENTORY (Inventory of air pollution sources) Business SIC classification: TOP, BODY, AND UPHOLSTERY REPAIR SHOPS AND PAINT SHOPS
Housing units lacking complete plumbing facilities: 1.1% Housing units lacking complete kitchen facilities: 3.4%
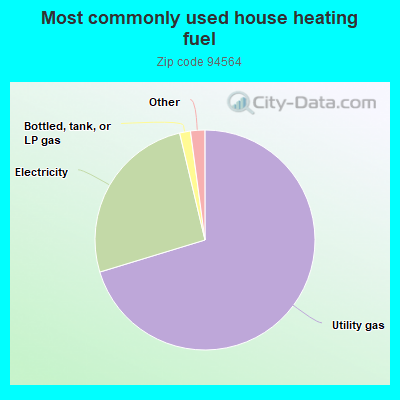
70.3%Utility gas
26.0%Electricity
1.6%Bottled, tank, or LP gas
1.0%Solar energy
0.6%No fuel used
Population in 1990: 16,920.
Place of birth for U.S.-born residents:
This state: 10,275
Northeast: 564
Midwest: 799
South: 716
West: 475
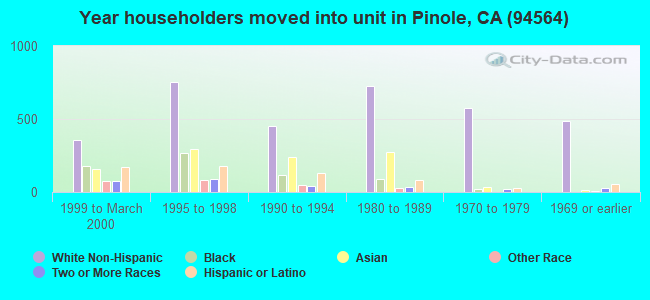
60% of the 94564 zip code residents lived in the same house 5 years ago. Out of people who lived in different houses, 58% lived in this county. Out of people who lived in different counties, 50% lived in California.
91% of the 94564 zip code residents lived in the same house 1 year ago. Out of people who lived in different houses, 41% moved from this county. Out of people who lived in different houses, 40% moved from different county within same state. Out of people who lived in different houses, 9% moved from different state. Out of people who lived in different houses, 13% moved from abroad.
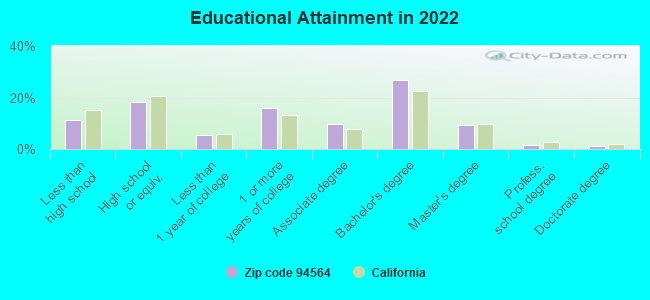
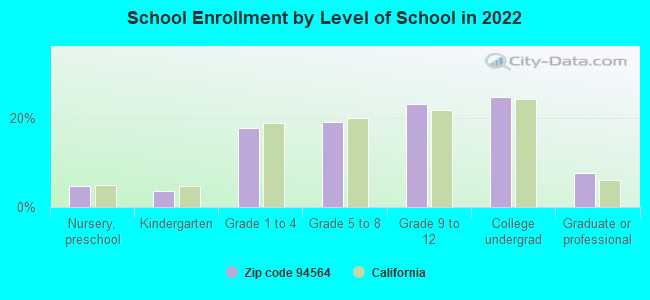
Private vs. public school enrollment:
Students in private schools in grades 1 to 8 (elementary and middle school): 193
Here:
13.9%
California:
10.5%
Students in private schools in grades 9 to 12 (high school): 157
Here:
18.1%
California:
8.5%
Students in private undergraduate colleges: 112
Here:
12.2%
California:
15.9%
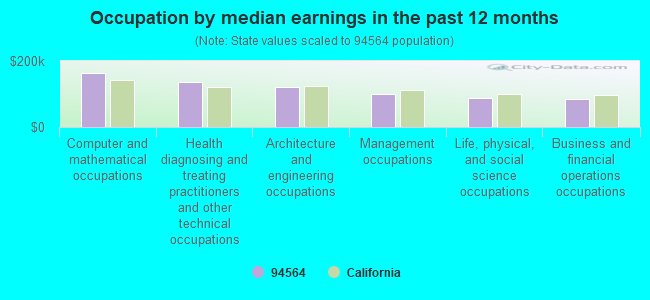
Occupation by median earnings in the past 12 months ($)
164,019Computer and mathematical occupations
136,653Health diagnosing and treating practitioners and other technical occupations
121,538Architecture and engineering occupations
100,935Management occupations
87,789Life, physical, and social science occupations
85,478Business and financial operations occupations
Companies with federal contracts located in this zip code:
FREITAS LANDSCAPE & MAINTENANC (1072 SAN PABLO AVE in PINOLE, CA; small business) : $131,329 in 7 contractsfrom 2003 to 2006
Contracts for Landscaping/Groundskeeping Services by Army Signed by year:2000: $0; 2001: $0; 2002: $0; 2003: $24,683; 2004: $47,626; 2005: $28,256; 2006: $30,764.
Biggest contracts:
$30,764 with Army for Landscaping/Groundskeeping Services. Signed on 2006-03-25. Completion date: 2006-01-31.
$28,256, same as above.Signed on 2005-05-08. Completion date: 2006-01-31.
$27,052, same as above.Signed on 2004-03-20. Completion date: 2005-01-31.
$20,574, same as above.Signed on 2004-05-15. Completion date: 2005-03-31.
ALEXANDER, JASON (2546 DOWNER ST in PINOLE, CA; small business)
$28,500 with Army for Expert Witness. Taking place in KS. Signed on 2005-08-29. Completion date: 2005-06-11.
Top industries in this zip code by the number of employees in 2005:
2002 - 2018 National Fire Incident Reporting System (NFIRS) incidents
According to the data from the years 2002 - 2018 the average number of fire incidents per year is 13. The highest number of fires - 34 took place in 2007, and the least - 0 in 2003. The data has a decreasing trend.
When looking into fire subcategories, the most incidents belonged to: Structure Fires (44.6%), and Outside Fires (32.4%).
Fire incident types reported to NFIRS in Zip Code 94564


 Nearest zip codes: 94547, 94803, 94572, 94806, 94805, 94530.


 According to the data from the years 2002 - 2018 the average number of fire incidents per year is 13. The highest number of fires - 34 took place in 2007, and the least - 0 in 2003. The data has a decreasing trend.
 When looking into fire subcategories, the most incidents belonged to: Structure Fires (44.6%), and Outside Fires (32.4%).