Estimated zip code population in 2022: 10,426 Zip code population in 2010: 7,911 Zip code population in 2000: 5,233
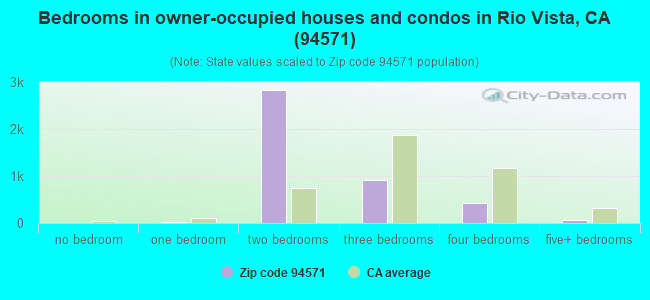
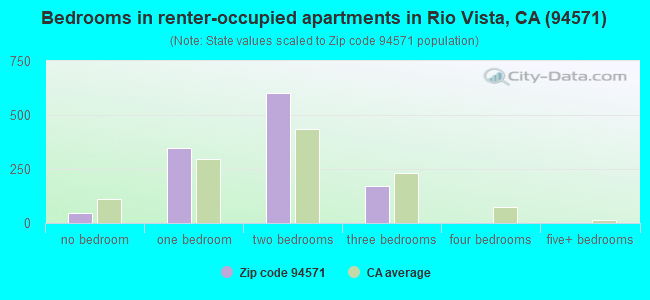
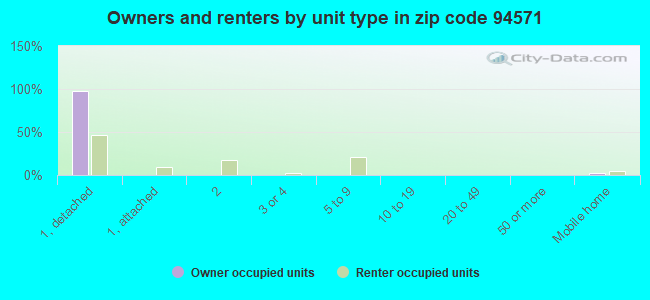
Houses and condos: 5,612 Renter-occupied apartments: 1,170
% of renters here:
22%
State:
44%
March 2022 cost of living index in zip code 94571: 110.2 (more than average, U.S. average is 100)
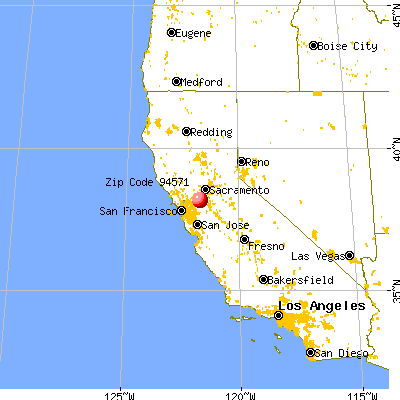
Land area: 117.6 sq. mi. Water area: 20.7 sq. mi.
Population density: 89 people per square mile
(very low).
OSM Map
General Map
Google Map
MSN Map
OSM Map
General Map
Google Map
MSN Map
OSM Map
General Map
Google Map
MSN Map
OSM Map
General Map
Google Map
MSN Map
Please wait while loading the map...
Real estate property taxes paid for housing units in 2022:
This zip code:
0.9% ($4,295)
California:
0.7% ($4,831)
Median real estate property taxes paid for housing units with mortgages in 2022: $4,319 (0.9%) Median real estate property taxes paid for housing units with no mortgage in 2022: $4,393 (0.9%)
Business Search- 14 Million verified businesses
Males: 4,797
(46.0%)
Females: 5,629
(54.0%)
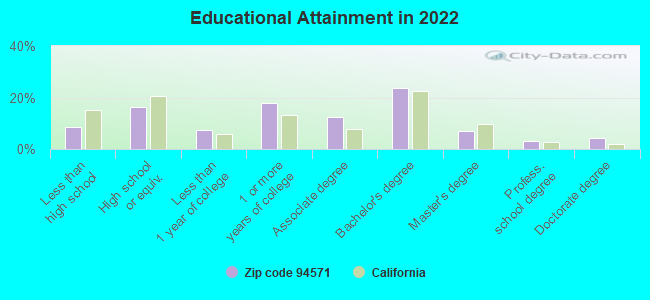
For population 25 years and over in 94571:
High school or higher: 91.2%
Bachelor's degree or higher: 37.8%
Graduate or professional degree: 14.4%
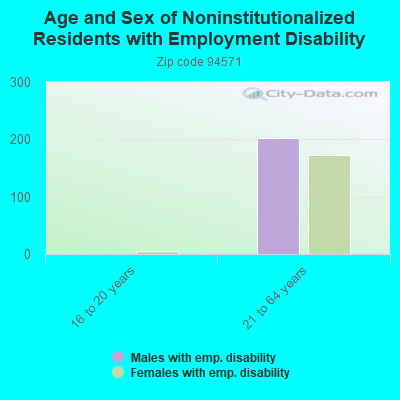
Unemployed: 10.3%
Mean travel time to work (commute): 36.2 minutes
For population 15 years and over in 94571:
Never married: 19.7%
Now married: 54.5%
Separated: 2.6%
Widowed: 9.9%
Divorced: 13.4%
Zip code 94571 compared to state average:
Unemployed percentage above state average.
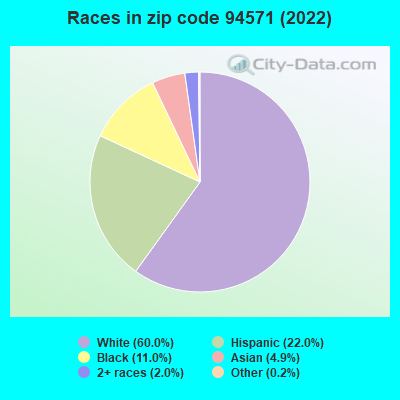
Black race population percentage above state average.
Hispanic race population percentage below state average.
Median age significantly above state average.
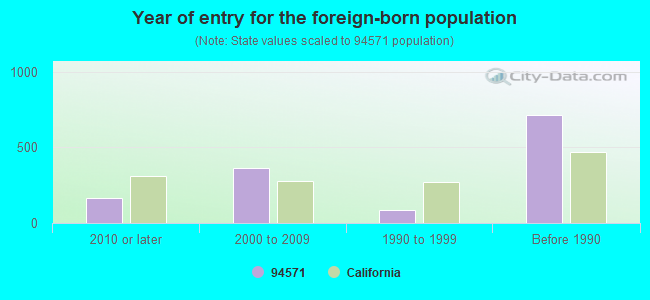
Foreign-born population percentage below state average.
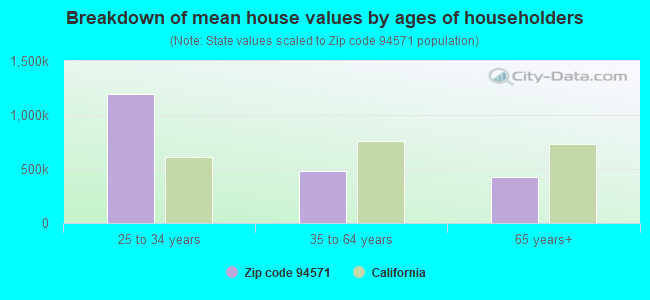
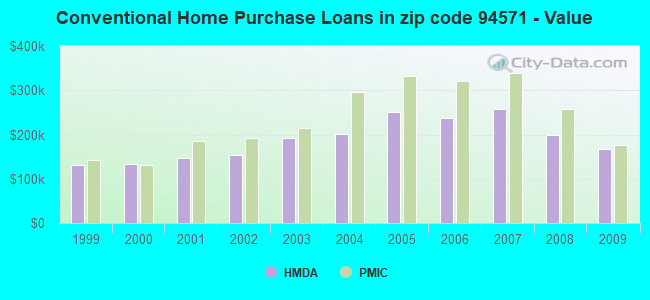
Estimated median house/condo value in 2022: $493,953
94571:
$493,953
California:
$715,900
According to our research of California and other state lists, there were 12 registered sex offenders living in 94571 zip code as of April 27, 2024. The ratio of all residents to sex offenders in zip code 94571 is 744 to 1. The ratio of registered sex offenders to all residents in this zip code is near the state average.
Median resident age:
This zip code:
65.9 years
California median age:
37.9 years
Average household size:
This zip code:
1.9 people
California:
2.8 people
Averages for the 2020 tax year for zip code 94571, filed in 2021:
Average Adjusted Gross Income (AGI) in 2020: $72,971 (Individual Income Tax Returns)
Here:
$72,971
State:
$95,910
Salary/wage: $60,312 (reported on 58.8% of returns)
Here:
$60,312
State:
$77,331
(% of AGI for various income ranges: 838.0% for AGIs below $25k, 2899.5% for AGIs $25k-50k, 5225.2% for AGIs $50k-75k, 8149.7% for AGIs $75k-100k, 14365.4% for AGIs $100k-200k, 46240.0% for AGIs over 200k)
Taxable interest for individuals: $1,057 (reported on 52.6% of returns)
This zip code:
$1,057
California:
$2,294
(% of AGI for various income ranges: 44.4% for AGIs below $25k, 54.3% for AGIs $25k-50k, 70.6% for AGIs $50k-75k, 173.5% for AGIs $75k-100k, 189.8% for AGIs $100k-200k, 402.9% for AGIs over 200k)
Ordinary dividends: $4,868 (reported on 23.6% of returns)
Here:
$4,868
State:
$10,949
(% of AGI for various income ranges: 61.5% for AGIs below $25k, 95.9% for AGIs $25k-50k, 144.3% for AGIs $50k-75k, 210.8% for AGIs $75k-100k, 424.8% for AGIs $100k-200k, 1892.9% for AGIs over 200k)
Net capital gain/loss in AGI: +$17,152 (reported on 22.0% of returns)
Here:
+$17,152
State:
+$49,306
(% of AGI for various income ranges: 7.5% for AGIs below $25k, 59.2% for AGIs $25k-50k, 124.6% for AGIs $50k-75k, 253.5% for AGIs $75k-100k, 676.6% for AGIs $100k-200k, 21950.0% for AGIs over 200k)
Profit/loss from business: +$13,133 (reported on 12.8% of returns)
Here:
+$13,133
State:
+$15,671
(% of AGI for various income ranges: 98.9% for AGIs below $25k, 128.5% for AGIs $25k-50k, 265.6% for AGIs $50k-75k, 276.8% for AGIs $75k-100k, 387.9% for AGIs $100k-200k, 4387.1% for AGIs over 200k)
Taxable individual retirement arrangement distribution: $21,261 (reported on 21.1% of returns)
94571:
$21,261
California:
$23,505
(% of AGI for various income ranges: 224.1% for AGIs below $25k, 448.3% for AGIs $25k-50k, 602.8% for AGIs $50k-75k, 966.5% for AGIs $75k-100k, 1714.3% for AGIs $100k-200k, 5307.1% for AGIs over 200k)
Self-employed (Keogh) retirement plans: $17,767 (reported on 0.5% of returns)
94571:
$17,767
California:
$30,163
(% of AGI for various income ranges: 144.1% for AGIs $75k-100k)
Total itemized deductions: $28,567 (reported on 19.7% of returns)
Here:
$28,567
State:
$39,517
(% of AGI for various income ranges: 244.7% for AGIs below $25k, 469.5% for AGIs $25k-50k, 1066.9% for AGIs $50k-75k, 1467.8% for AGIs $75k-100k, 1901.2% for AGIs $100k-200k, 6272.9% for AGIs over 200k)
Charity contributions: $4,334 (reported on 15.8% of returns)
Here:
$4,334
State:
$12,598
(% of AGI for various income ranges: 13.0% for AGIs below $25k, 55.5% for AGIs $25k-50k, 94.8% for AGIs $50k-75k, 173.8% for AGIs $75k-100k, 278.6% for AGIs $100k-200k, 888.6% for AGIs over 200k)
Taxes paid: $7,689 (reported on 19.7% of returns)
94571:
$7,689
State:
$8,807
(% of AGI for various income ranges: 48.1% for AGIs below $25k, 106.7% for AGIs $25k-50k, 290.9% for AGIs $50k-75k, 419.2% for AGIs $75k-100k, 586.2% for AGIs $100k-200k, 1350.0% for AGIs over 200k)
Earned income credit: $1,718 (reported on 7.1% of returns)
Here:
$1,718
State:
$2,074
(% of AGI for various income ranges: 55.5% for AGIs below $25k, 32.4% for AGIs $25k-50k)
Percentage of individuals using paid preparers for their 2020 taxes: 91.8%
Here:
92%
State:
92%
(% for various income ranges: 90.6% for AGIs below $25k, 92.6% for AGIs $25k-50k, 91.5% for AGIs $50k-75k, 90.5% for AGIs $75k-100k, 92.9% for AGIs $100k-200k, 95.5% for AGIs over 200k)
Averages for the 2012 tax year for zip code 94571, filed in 2013:
Average Adjusted Gross Income (AGI) in 2012: $59,091 (Individual Income Tax Returns)
Here:
$59,091
State:
$72,726
Salary/wage: $48,984 (reported on 62.8% of returns)
Here:
$48,984
State:
$59,079
(% of AGI for various income ranges: 51.8% for AGIs below $25k, 49.0% for AGIs $25k-50k, 47.7% for AGIs $50k-75k, 52.2% for AGIs $75k-100k, 57.9% for AGIs $100k-200k, 44.2% for AGIs over 200k)
Taxable interest for individuals: $1,243 (reported on 52.8% of returns)
This zip code:
$1,243
California:
$2,146
(% of AGI for various income ranges: 2.3% for AGIs below $25k, 1.6% for AGIs $25k-50k, 1.1% for AGIs $50k-75k, 0.6% for AGIs $75k-100k, 1.0% for AGIs $100k-200k, 0.8% for AGIs over 200k)
Ordinary dividends: $3,953 (reported on 25.2% of returns)
Here:
$3,953
State:
$9,308
(% of AGI for various income ranges: 3.1% for AGIs below $25k, 2.0% for AGIs $25k-50k, 2.0% for AGIs $50k-75k, 1.3% for AGIs $75k-100k, 1.3% for AGIs $100k-200k, 1.5% for AGIs over 200k)
Net capital gain/loss in AGI: +$3,513 (reported on 22.1% of returns)
Here:
+$3,513
State:
+$30,460
(% of AGI for various income ranges: 0.4% for AGIs $50k-75k, 0.4% for AGIs $75k-100k, 2.3% for AGIs $100k-200k, 4.6% for AGIs over 200k)
Profit/loss from business: +$13,479 (reported on 13.7% of returns)
Here:
+$13,479
State:
+$17,064
(% of AGI for various income ranges: 4.2% for AGIs below $25k, 3.0% for AGIs $25k-50k, 2.2% for AGIs $50k-75k, 2.0% for AGIs $75k-100k, 3.7% for AGIs $100k-200k, 3.9% for AGIs over 200k)
Taxable individual retirement arrangement distribution: $16,270 (reported on 23.3% of returns)
94571:
$16,270
California:
$19,557
(% of AGI for various income ranges: 9.3% for AGIs below $25k, 6.1% for AGIs $25k-50k, 7.2% for AGIs $50k-75k, 6.1% for AGIs $75k-100k, 6.0% for AGIs $100k-200k, 5.4% for AGIs over 200k)
Self-employment retirement plans: $22,933 (reported on 0.7% of returns)
94571:
$22,933
California:
$24,530
Total itemized deductions: $23,300 (27% of AGI, reported on 46.3% of returns)
Here:
$23,300
State:
$34,004
Here:
27.1% of AGI
State:
22.7% of AGI
(% of AGI for various income ranges: 26.3% for AGIs below $25k, 17.2% for AGIs $25k-50k, 17.9% for AGIs $50k-75k, 17.0% for AGIs $75k-100k, 18.3% for AGIs $100k-200k, 17.0% for AGIs over 200k)
Charity contributions: $2,623 (reported on 38.8% of returns)
Here:
$2,623
State:
$4,659
(% of AGI for various income ranges: 1.4% for AGIs below $25k, 1.4% for AGIs $25k-50k, 1.7% for AGIs $50k-75k, 1.6% for AGIs $75k-100k, 2.0% for AGIs $100k-200k, 1.6% for AGIs over 200k)
Taxes paid: $6,812 (reported on 46.3% of returns)
94571:
$6,812
State:
$14,448
(% of AGI for various income ranges: 4.6% for AGIs below $25k, 3.6% for AGIs $25k-50k, 4.1% for AGIs $50k-75k, 4.8% for AGIs $75k-100k, 6.5% for AGIs $100k-200k, 7.4% for AGIs over 200k)
Earned income credit: $1,927 (reported on 8.9% of returns)
Here:
$1,927
State:
$2,286
(% of AGI for various income ranges: 3.2% for AGIs below $25k, 0.5% for AGIs $25k-50k)
Percentage of individuals using paid preparers for their 2012 taxes: 54.4%
Here:
54%
State:
64%
(% for various income ranges: 46.2% for AGIs below $25k, 50.5% for AGIs $25k-50k, 58.6% for AGIs $50k-75k, 58.3% for AGIs $75k-100k, 66.2% for AGIs $100k-200k, 77.8% for AGIs over 200k)
Averages for the 2004 tax year for zip code 94571, filed in 2005:
Average Adjusted Gross Income (AGI) in 2004: $52,652 (Individual Income Tax Returns)
Here:
$52,652
State:
$58,600
Salary/wage: $45,095 (reported on 71.6% of returns)
Here:
$45,095
State:
$49,455
(% of AGI for various income ranges: 1640.4% for AGIs below $10k, 54.6% for AGIs $10k-25k, 60.4% for AGIs $25k-50k, 67.5% for AGIs $50k-75k, 68.7% for AGIs $75k-100k, 52.3% for AGIs over 100k)
Taxable interest for individuals: $1,677 (reported on 62.7% of returns)
This zip code:
$1,677
California:
$2,365
(% of AGI for various income ranges: 250.5% for AGIs below $10k, 3.8% for AGIs $10k-25k, 2.6% for AGIs $25k-50k, 2.0% for AGIs $50k-75k, 1.2% for AGIs $75k-100k, 1.5% for AGIs over 100k)
Taxable dividends: $2,707 (reported on 29.3% of returns)
Here:
$2,707
State:
$4,746
(% of AGI for various income ranges: 168.7% for AGIs below $10k, 2.5% for AGIs $10k-25k, 2.1% for AGIs $25k-50k, 1.0% for AGIs $50k-75k, 1.2% for AGIs $75k-100k, 1.3% for AGIs over 100k)
Net capital gain/loss: +$16,375 (reported on 22.9% of returns)
Here:
+$16,375
State:
+$23,418
(% of AGI for various income ranges: -173.7% for AGIs below $10k, 0.9% for AGIs $10k-25k, -0.4% for AGIs $25k-50k, 0.9% for AGIs $50k-75k, 2.5% for AGIs $75k-100k, 18.8% for AGIs over 100k)
Profit/loss from business: +$12,696 (reported on 15.3% of returns)
Here:
+$12,696
State:
+$16,826
(% of AGI for various income ranges: -68.7% for AGIs below $10k, 5.3% for AGIs $10k-25k, 3.9% for AGIs $25k-50k, 2.9% for AGIs $50k-75k, 3.2% for AGIs $75k-100k, 4.1% for AGIs over 100k)
IRA payment deduction: $3,699 (reported on 3.3% of returns)
94571:
$3,699
California:
$3,192
(% of AGI for various income ranges: 0.4% for AGIs $10k-25k, 0.3% for AGIs $25k-50k, 0.3% for AGIs $50k-75k, 0.2% for AGIs $75k-100k, 0.1% for AGIs over 100k)
Self-employed pension: $10,655 (reported on 0.8% of returns)
Here:
$10,655
California:
$17,688
Total itemized deductions: $21,678 (28% of AGI, reported on 50.1% of returns)
Here:
$21,678
State:
$28,113
Here:
28.0% of AGI
State:
25.3% of AGI
(% of AGI for various income ranges: 744.4% for AGIs below $10k, 20.2% for AGIs $10k-25k, 19.1% for AGIs $25k-50k, 22.4% for AGIs $50k-75k, 21.4% for AGIs $75k-100k, 18.7% for AGIs over 100k)
Charity contributions deductions: $2,357 (3% of AGI, reported on 43.4% of returns)
Here:
$2,357
State:
$3,923
Here:
2.9% of AGI
State:
3.3% of AGI
(% of AGI for various income ranges: 44.4% for AGIs below $10k, 1.3% for AGIs $10k-25k, 1.6% for AGIs $25k-50k, 2.1% for AGIs $50k-75k, 2.1% for AGIs $75k-100k, 2.0% for AGIs over 100k)
Total tax: $6,876 (reported on 81.0% of returns)
94571:
$6,876
State:
$10,761
(% of AGI for various income ranges: 78.8% for AGIs below $10k, 3.9% for AGIs $10k-25k, 7.1% for AGIs $25k-50k, 8.7% for AGIs $50k-75k, 10.0% for AGIs $75k-100k, 14.9% for AGIs over 100k)
Earned income credit: $1,531 (reported on 7.4% of returns)
Here:
$1,531
State:
$1,763
Percentage of individuals using paid preparers for their 2004 taxes: 63.9%
Here:
64%
State:
66%
(% for various income ranges: 54.0% for AGIs below $10k, 60.7% for AGIs $10k-25k, 65.7% for AGIs $25k-50k, 63.5% for AGIs $50k-75k, 69.2% for AGIs $75k-100k, 73.2% for AGIs over 100k)
Likely homosexual households (counted as self-reported same-sex unmarried-partner households)
Lesbian couples: 0.2% of all households
Gay men: 0.3% of all households
Household received Food Stamps/SNAP in the past 12 months: 65 Household did not receive Food Stamps/SNAP in the past 12 months: 5,237
Women who had a birth in the past 12 months: 16 (16 now married, 0 unmarried) Women who did not have a birth in the past 12 months: 998 (328 now married, 672 unmarried)
Housing units in zip code 94571 with a mortgage: 2,476 (194 second mortgage, 164 both second mortgage and home equity loan) Houses without a mortgage: 18
Median monthly owner costs for units with a mortgage: $2,008 Median monthly owner costs for units without a mortgage: $711
Residents with income below the poverty level in 2022:
This zip code:
9.3%
Whole state:
12.2%
Residents with income below 50% of the poverty level in 2022:
This zip code:
5.2%
Whole state:
6.2%
Median number of rooms in houses and condos:
Here:
5.4
State:
6.0
Median number of rooms in apartments:
Here:
3.9
State:
3.9
Notable locations in this zip code not listed on our city pages
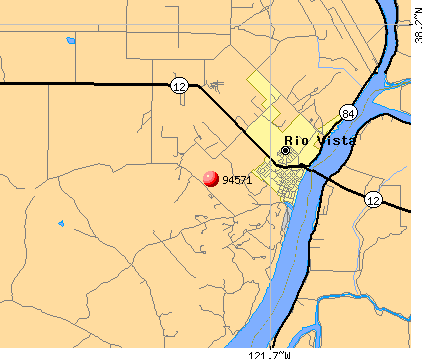
Notable locations in zip code 94571: Peterson Ranch (A), Gutman Landing (B), Larsen Landing (C), Perley Landing (D), Wood-Curtis Landing (E), Decker Landing (F), Toland Landing (G), Baldocchi Landing (H), Liberty Island Ferry (I), Willow Campground (J), Cottonwood Campground (K), Hierlihy Ranch (L), Hamilton Ranch (M), Delta Marina (N), Rio Vista Public Library (O), Rio Vista Museum (P), Rio Vista City Hall (Q), Rio Vista Fire Department - Delta Fire Protection District Main Station (R), Montezuma Fire Protection District Rio Vista Station (S), Brannan Island State Recreation Area Visitor Center (T). Display/hide their locations on the map
Churches in zip code 94571 include: Church of Christ (A), The Church of Jesus Christ of Latter Day Saints (B), Rio Vista Assembly of God Church (C), Saint Joseph Catholic Church (D), Union Baptist Church (E). Display/hide their locations on the map
Streams, rivers, and creeks: Cabin Slough (A), Cache Slough (B), Duck Slough (C), Miner Slough (D), The Big Ditch (E), San Joaquin River (F), Barker Slough (G). Display/hide their locations on the map
Parks in zip code 94571 include: Brannan Island State Recreation Area (1), Sherman Island Waterfowl Management Area (2), Brannon Island State Recreational Area (3), Bruna Vista Park (4), Bruning Park (5), Sandy Beach Park (6), Cliff House Fishing Access Area (7), Sandy Beach Park (8). Display/hide their locations on the map
In group quarters: 7 (-1 institutionalized population)
Size of family households: 2,417 2-persons, 372 3-persons, 210 4-persons, 16 6-persons, 76 7-or-more-persons
Size of nonfamily households: 2,073 1-person, 336 2-persons
374 married couples with children.
66 single-parent households (38 men, 28 women).
82.6% of residents of 94571 zip code speak English at home.
15.0% of residents speak Spanish at home (36% very well, 34% well, 29% not well).
1.3% of residents speak other Indo-European language at home (100% very well).
2.8% of residents speak Asian or Pacific Island language at home (42% very well, 25% well, 28% not well, 5% not at all).
0.2% of residents speak other language at home (100% very well).
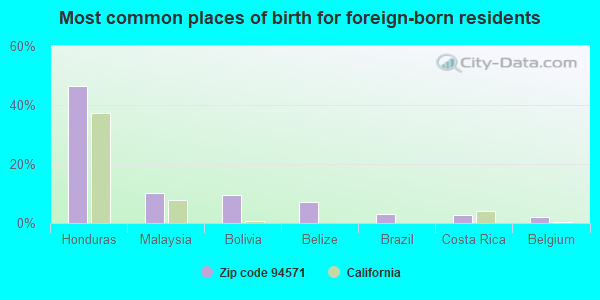
Foreign born population: 1,298 (12.5%) (76.2% of them are naturalized citizens)
This zip code:
12.5%
Whole state:
26.7%
46%Honduras
10%Malaysia
9%Bolivia
7%Belize
3%Brazil
3%Costa Rica
2%Belgium
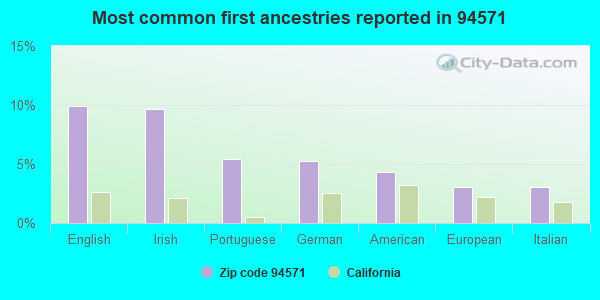
10%English
10%Irish
5%Portuguese
5%German
4%American
3%European
3%Italian
Year of entry for the foreign-born population
1622010 or later
3652000 to 2009
831990 to 1999
713Before 1990
Major facilities with environmental interests located in this zip code:
INSIGHT DESIGNS (910 ST FRANCIS WAY in RIO VISTA, CA)
STATE MASTER (California - Hazardous Waste Tracking) - HAZARDOU WASTE PROGRAM HAZARDOUS WASTE BIENNIAL REPORTER (Resource Conservation and Recovery Act (tracking hazardous waste)) Large Quantity Generators, more that 1000 kg of hazardous waste/month (Resource Conservation and Recovery Act (tracking hazardous waste)) - notification Business NAICS classification: ALL OTHER MISCELLANEOUS FABRICATED METAL PRODUCT MANUFACTURING.; COSTUME JEWELRY AND NOVELTY MANUFACTURING. Organizations: CITY OF RIO VISTA (CONTACT/OWNER)
ABEL CHEVROLET PONTIAC BUICK (280 N FRONT ST in RIO VISTA, CA)
STATE MASTER (California - Hazardous Waste Tracking) - HAZARDOU WASTE PROGRAM CRITERIA AND HAZARDOUS AIR POLLUTANT INVENTORY (Inventory of air pollution sources) Small Quantity Generators, between 100 kg and 1000 kg of hazardous waste/month (Resource Conservation and Recovery Act (tracking hazardous waste)) - notification Business SIC classification: TOP, BODY, AND UPHOLSTERY REPAIR SHOPS AND PAINT SHOPS Organizations: JOHN F ABEL (CONTACT/OWNER)
Alternative names: ABEL CHEVROLET INC
INSTRAT INC (1105 C AIRPORT RD in RIO VISTA, CA)
STATE MASTER (California - Hazardous Waste Tracking) - HAZARDOU WASTE PROGRAM Small Quantity Generators, between 100 kg and 1000 kg of hazardous waste/month (Resource Conservation and Recovery Act (tracking hazardous waste)) Business NAICS classification: OTHER NONHAZARDOUS WASTE TREATMENT AND DISPOSAL.
CHEVRON 206148 (33 N FRONT ST in RIO VISTA, CA)
Large Quantity Generators, more that 1000 kg of hazardous waste/month (Resource Conservation and Recovery Act (tracking hazardous waste)) Organizations: CHEVRON USA INC (CONTACT/OPERATOR)
CAL TRANS (840 HWY 12 in RIO VISTA, CA)
Small Quantity Generators, between 100 kg and 1000 kg of hazardous waste/month (Resource Conservation and Recovery Act (tracking hazardous waste)) - notification Small Quantity Generators, between 100 kg and 1000 kg of hazardous waste/month (Resource Conservation and Recovery Act (tracking hazardous waste)) - notification Organizations: CALTRANS (CONTACT/OWNER)
, CALIFORNIA STATE OF (CONTACT/OWNER)
Alternative names: CALTRANS DIST 4
AERA ENERGY LLC (50 N 2ND ST in RIO VISTA, CA)
Large Quantity Generators, more that 1000 kg of hazardous waste/month (Resource Conservation and Recovery Act (tracking hazardous waste)) - notification Alternative names: AERA SACRAMENTO UNIT
CHEVRON USA INC RIO VISTA PROD AREA (60 RIVER RD in RIO VISTA, CA)
Large Quantity Generators, more that 1000 kg of hazardous waste/month (Resource Conservation and Recovery Act (tracking hazardous waste))
CALTRANS DIST 4 (SOLANO 12 PM 26.4 in RIO VISTA, CA)
Large Quantity Generators, more that 1000 kg of hazardous waste/month (Resource Conservation and Recovery Act (tracking hazardous waste)) - notification
EVI WEATHERFORD CORPORATION (1000 CHURCH ROAD in RIO VISTA, CA)
CRITERIA AND HAZARDOUS AIR POLLUTANT INVENTORY (Inventory of air pollution sources) Small Quantity Generators, between 100 kg and 1000 kg of hazardous waste/month (Resource Conservation and Recovery Act (tracking hazardous waste)) - notification Business SIC classification: OIL AND GAS FIELD MACHINERY AND EQUIPMENT Business NAICS classification: CONSTRUCTION, MINING, AND FORESTRY MACHINERY AND EQUIPMENT RENTAL AND LEASING. Organizations: WEATHERFORD US (CONTACT/OWNER)
Alternative names: WEATHERFORD US
GOMES WARREN E EXCAVATING INC (35 AIRPORT RD in RIO VISTA, CA)
TRANSPORTER (Resource Conservation and Recovery Act (tracking hazardous waste)) Organizations: WARREN E GOMES (CONTACT/OWNER)
GORDEN HANSEN COMPANY (101 N FRONT STREET in RIO VISTA, CA)
Small Quantity Generators, between 100 kg and 1000 kg of hazardous waste/month (Resource Conservation and Recovery Act (tracking hazardous waste)) - notification Organizations: GORDON HANSEN COMPANY LIMITED (CONTACT/OWNER)
HAGAN SERVICES (331 CALIFORNIA ST in RIO VISTA, CA)
TRANSPORTER (Resource Conservation and Recovery Act (tracking hazardous waste)) Organizations: PATRICK N HAGAN (CONTACT/OWNER)
HALLIBURTON SERVICES (265 N FRONT ST in RIO VISTA, CA)
Small Quantity Generators, between 100 kg and 1000 kg of hazardous waste/month (Resource Conservation and Recovery Act (tracking hazardous waste)) - notification Organizations: HALLIBURTON COMPANY (CONTACT/OWNER)
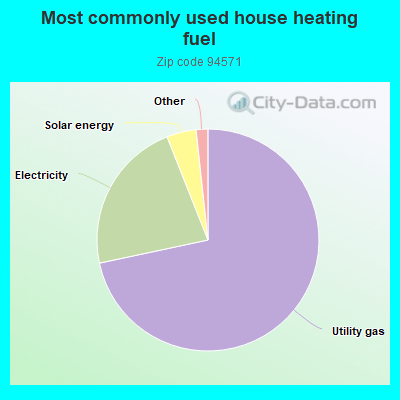
71.6%Utility gas
22.3%Electricity
4.3%Solar energy
0.7%Bottled, tank, or LP gas
0.5%No fuel used
Population in 1990: 4,516. Population change in the 1990s: +717 (+15.9%).
Place of birth for U.S.-born residents:
This state: 5,784
Northeast: 531
Midwest: 1,059
South: 1,045
West: 570
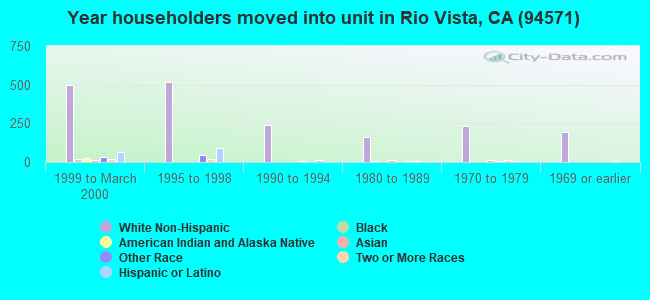
45% of the 94571 zip code residents lived in the same house 5 years ago. Out of people who lived in different houses, 39% lived in this county. Out of people who lived in different counties, 50% lived in California.
90% of the 94571 zip code residents lived in the same house 1 year ago. Out of people who lived in different houses, 26% moved from this county. Out of people who lived in different houses, 55% moved from different county within same state. Out of people who lived in different houses, 18% moved from different state. Out of people who lived in different houses, 3% moved from abroad.
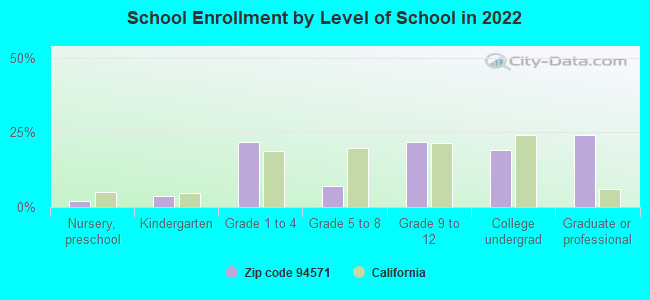
Private vs. public school enrollment:
Students in private schools in grades 1 to 8 (elementary and middle school): 98
Here:
31.3%
California:
10.5%
Students in private schools in grades 9 to 12 (high school):
Here:
0.0%
California:
8.5%
Students in private undergraduate colleges:
Here:
0.0%
California:
15.9%
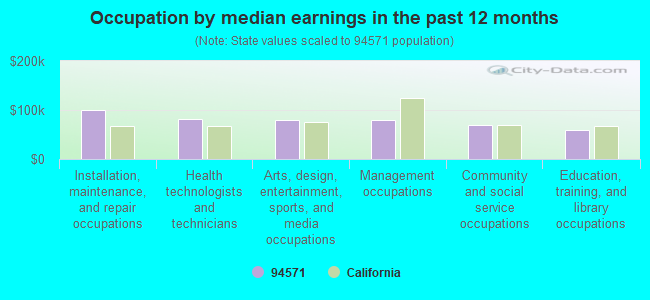
Occupation by median earnings in the past 12 months ($)
100,204Installation, maintenance, and repair occupations
81,419Health technologists and technicians
80,175Arts, design, entertainment, sports, and media occupations
79,727Management occupations
69,071Community and social service occupations
59,618Education, training, and library occupations
Companies with federal contracts located in this zip code:
TRANSFORMER TESTING & REPAIR, (3035 CATTEY LANE in RIO VISTA, CA; small business) : $121,619 in 2 contractsfrom 2000 to 2001
$126,000 with Air Force for Maintenance, Repair or Alteration of Real Property -- Hospitals and Infirmaries. Signed on 2000-09-29. Completion date: 2001-02-26.
-$4,381, same as above.Signed on 2001-09-30. Completion date: 2001-11-03.
SPIRIT OF AMERICA WORLD SPEED (200 N FRONT ST in RIO VISTA, CA; small business)
$25,000 with Army for Miscellaneous Vehicular Components. Taking place in NV. Signed on 2002-07-19. Completion date: 2002-07-19.
Top industries in this zip code by the number of employees in 2005:
Construction: Power and Communication Line and Related Structures Construction (100-249 employees: 1 establishment)
Detailed PMIC statistics for the following Tracts:0098.00
, 2535.00
2005 - 2018 National Fire Incident Reporting System (NFIRS) incidents
Based on the data from the years 2005 - 2018 the average number of fire incidents per year is 44. The highest number of fire incidents - 179 took place in 2007, and the least - 2 in 2011. The data has a declining trend.
When looking into fire subcategories, the most reports belonged to: Outside Fires (65.8%), and Structure Fires (23.5%).
Fire incident types reported to NFIRS in Zip Code 94571


 Nearest zip codes: 94512, 95690, 95641, 94511, 94561, 94509.


 Based on the data from the years 2005 - 2018 the average number of fire incidents per year is 44. The highest number of fire incidents - 179 took place in 2007, and the least - 2 in 2011. The data has a declining trend.
 When looking into fire subcategories, the most reports belonged to: Outside Fires (65.8%), and Structure Fires (23.5%).