Rio Vista, California
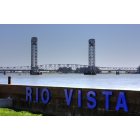
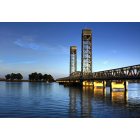
Rio Vista: Rio Vista Bridge as seen from foot of Main Street
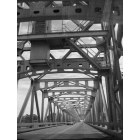
Rio Vista: Rio Vista Bridge
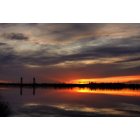
Rio Vista: Sunset @ Rio Vista
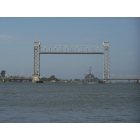
Rio Vista: Rio Vista Bridge
Rio Vista: Rio Vista Bridge
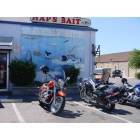
Rio Vista: Hap's Bait
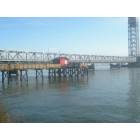
Rio Vista: Rio Vista bridge with the city pier in front
- add
your
Submit your own pictures of this city and show them to the world
- OSM Map
- General Map
- Google Map
- MSN Map

Population change since 2000: +127.0%
| Males: 4,762 | |
| Females: 5,613 |
| Median resident age: | 65.1 years |
| California median age: | 37.9 years |
Zip codes: 94571.
| Rio Vista: | $80,027 |
| CA: | $91,551 |
Estimated per capita income in 2022: $47,447 (it was $24,627 in 2000)
Rio Vista city income, earnings, and wages data
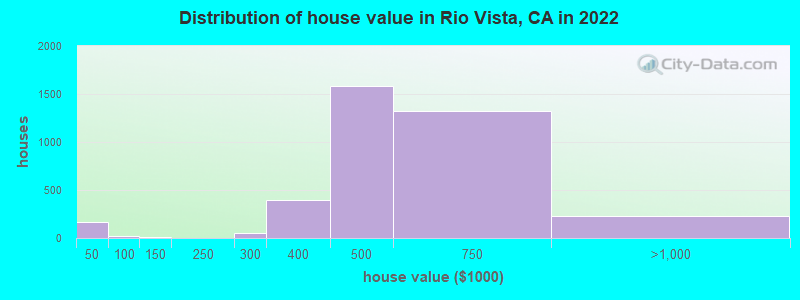
Estimated median house or condo value in 2022: $502,671 (it was $161,100 in 2000)
| Rio Vista: | $502,671 |
| CA: | $715,900 |
Mean prices in 2022: all housing units: $499,271; detached houses: $505,064; mobile homes: $59,739
Median gross rent in 2022: $1,474.
(7.5% for White Non-Hispanic residents, 13.3% for Black residents, 14.2% for Hispanic or Latino residents, 3.1% for other race residents)
Detailed information about poverty and poor residents in Rio Vista, CA
Compare current foreclosures near Rio Vista, CA:
| Photo | Address | Area | Beds / Baths | Price | Details |
|---|---|---|---|---|---|

|
#1
Riverwood Ln
Rio Vista, CA 94571
|
1,391 sq. feet
|
2 baths 2 beds |
show details | |

|
#2
N 4th St
Rio Vista, CA 94571
|
1,271 sq. feet
|
1 baths 2 beds |
show details | |

|
#3
Brockton Pl
Rio Vista, CA 94571
|
1,767 sq. feet
|
2 baths 2 beds |
show details | |

|
#4
De Flores Cir
Rio Vista, CA 94571
|
1,617 sq. feet
|
2 baths 4 beds |
show details | |

|
#5
Riviera Dr
Rio Vista, CA 94571
|
1,912 sq. feet
|
2 baths 2 beds |
show details | |

|
#6
Laurel Way
Rio Vista, CA 94571
|
1,884 sq. feet
|
2 baths 3 beds |
show details | |

|
#7
Tahoe Dr
Rio Vista, CA 94571
|
1,328 sq. feet
|
2 baths 3 beds |
show details | |

|
#8
Marianna Pl
Rio Vista, CA 94571
|
1,767 sq. feet
|
2 baths 2 beds |
show details | |

|
#9
N 4th St
Rio Vista, CA 94571
|
2,236 sq. feet
|
1 baths 3 beds |
show details | |

|
#10
Crescent Dr
Rio Vista, CA 94571
|
- sq. feet
|
- baths - beds |
show details |
| Photo | Address | Area | Beds / Baths | Price | Details |
|---|---|---|---|---|---|

|
#11
Saint Andrews Dr
Rio Vista, CA 94571
|
- sq. feet
|
- baths - beds |
show details | |

|
#12
S 4th St
Rio Vista, CA 94571
|
- sq. feet
|
- baths - beds |
show details | |

|
#13
River Rd Spc 44
Rio Vista, CA 94571
|
- sq. feet
|
- baths - beds |
show details | |

|
#14
Marks Rd
Rio Vista, CA 94571
|
- sq. feet
|
- baths - beds |
show details | |

|
#15
E 12th St
Pittsburg, CA 94565
|
1,345 sq. feet
|
1 baths 2 beds |
$540,000
|
show details |

|
#16
San Jose Dr Unit 228
Antioch, CA 94509
|
830 sq. feet
|
2 baths 2 beds |
show details | |

|
#17
Filbert St
Antioch, CA 94509
|
1,137 sq. feet
|
2 baths 3 beds |
show details | |

|
#18
Merrill Dr
Antioch, CA 94509
|
2,113 sq. feet
|
3 baths 3 beds |
show details | |

|
#19
Yellowstone Dr
Antioch, CA 94509
|
2,128 sq. feet
|
3 baths 4 beds |
show details | |

|
#20
Beede Way
Antioch, CA 94509
|
2,228 sq. feet
|
2 baths 2 beds |
show details |
| Photo | Address | Area | Beds / Baths | Price | Details |
|---|---|---|---|---|---|

|
#21
Sonora Ct
Oakley, CA 94561
|
3,852 sq. feet
|
3 baths 5 beds |
show details | |

|
#22
W 15th St
Antioch, CA 94509
|
1,338 sq. feet
|
2 baths 3 beds |
show details | |

|
#23
Crestwood Dr
Antioch, CA 94509
|
1,360 sq. feet
|
2 baths 3 beds |
show details | |

|
#24
Poplar Dr
Oakley, CA 94561
|
3,341 sq. feet
|
3 baths 4 beds |
show details | |

|
#25
Doyle Rd
Oakley, CA 94561
|
2,067 sq. feet
|
2 baths 4 beds |
show details | |

|
#26
Hilliard Cir
Antioch, CA 94509
|
2,332 sq. feet
|
3 baths 4 beds |
show details | |

|
#27
Shetland Way
Antioch, CA 94531
|
3,249 sq. feet
|
3 baths 5 beds |
show details | |

|
#28
Carpino Ave
Pittsburg, CA 94565
|
975 sq. feet
|
1 baths 3 beds |
show details | |

|
#29
Nandina Ct
Antioch, CA 94531
|
1,267 sq. feet
|
2 baths 3 beds |
show details | |

|
#30
Turnstone Cir
Pittsburg, CA 94565
|
1,805 sq. feet
|
2 baths 3 beds |
show details |
| Photo | Address | Area | Beds / Baths | Price | Details |
|---|---|---|---|---|---|

|
#31
Monitor Pass Way
Antioch, CA 94531
|
1,657 sq. feet
|
2 baths 4 beds |
show details | |

|
#32
Miller St
Antioch, CA 94509
|
1,070 sq. feet
|
1 baths 3 beds |
show details | |

|
#33
Shasta Cir
Pittsburg, CA 94565
|
1,053 sq. feet
|
1 baths 3 beds |
show details | |

|
#34
Pinzano Wy
Antioch, CA 94531
|
- sq. feet
|
2 baths 3 beds |
show details | |

|
#35
Panoramic Ave
Pittsburg, CA 94565
|
1,364 sq. feet
|
1 baths 4 beds |
show details | |

|
#36
Andrews Cir
Suisun City, CA 94585
|
2,216 sq. feet
|
3 baths 3 beds |
show details | |

|
#37
Pendleton Ct
Oakley, CA 94561
|
3,075 sq. feet
|
3 baths 5 beds |
show details | |

|
#38
S Royal Links Cir
Antioch, CA 94509
|
1,219 sq. feet
|
2 baths 3 beds |
show details | |

|
#39
Drake Ct
Oakley, CA 94561
|
1,164 sq. feet
|
2 baths 3 beds |
show details | |

|
#40
W Brannan Island Rd
Isleton, CA 95641
|
- sq. feet
|
2 baths 3 beds |
show details |
| Photo | Address | Area | Beds / Baths | Price | Details |
|---|---|---|---|---|---|

|
#41
Bayside Way
Oakley, CA 94561
|
1,374 sq. feet
|
2 baths 3 beds |
show details | |

|
#42
Stonewood Way
Antioch, CA 94531
|
1,631 sq. feet
|
2 baths 4 beds |
show details | |

|
#43
Monitor Pass Way
Antioch, CA 94531
|
1,657 sq. feet
|
2 baths 4 beds |
show details | |

|
#44
Teresa Ln
Oakley, CA 94561
|
1,167 sq. feet
|
2 baths 3 beds |
show details | |

|
#45
Old Creek Cir
Pittsburg, CA 94565
|
1,349 sq. feet
|
2 baths 3 beds |
show details | |

|
#46
Peppermill Cir
Pittsburg, CA 94565
|
1,280 sq. feet
|
2 baths 3 beds |
show details | |

|
#47
Balsam St
Pittsburg, CA 94565
|
2,135 sq. feet
|
2 baths 4 beds |
show details | |

|
#48
Peppermill Ln
Pittsburg, CA 94565
|
1,092 sq. feet
|
2 baths 2 beds |
show details | |

|
#49
Fuente Ct
Antioch, CA 94509
|
1,666 sq. feet
|
2 baths 4 beds |
show details | |

|
Check over 1 million property listings on Foreclosure.com!
|
browse all offers | |||


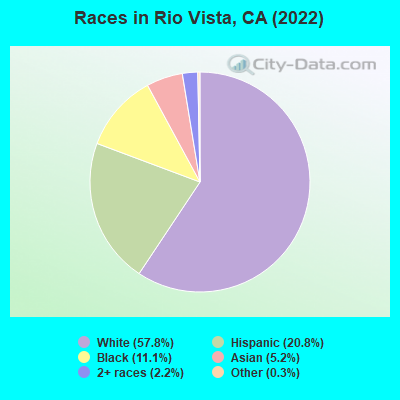
- 5,79857.8%White alone
- 2,08520.8%Hispanic
- 1,11011.1%Black alone
- 5215.2%Asian alone
- 2202.2%Two or more races
- 270.3%Other race alone
According to our research of California and other state lists, there were 12 registered sex offenders living in Rio Vista, California as of April 27, 2024.
The ratio of all residents to sex offenders in Rio Vista is 688 to 1.
The ratio of registered sex offenders to all residents in this city is near the state average.
Type |
2009 |
2010 |
2011 |
2012 |
2013 |
2014 |
2015 |
2016 |
2017 |
2018 |
2019 |
2020 |
2022 |
|---|---|---|---|---|---|---|---|---|---|---|---|---|---|
| Murders (per 100,000) | 0 (0.0) | 0 (0.0) | 0 (0.0) | 0 (0.0) | 0 (0.0) | 0 (0.0) | 0 (0.0) | 0 (0.0) | 0 (0.0) | 0 (0.0) | 0 (0.0) | 0 (0.0) | 0 (0.0) |
| Rapes (per 100,000) | 0 (0.0) | 1 (13.6) | 0 (0.0) | 0 (0.0) | 3 (39.4) | 1 (12.8) | 0 (0.0) | 1 (11.7) | 1 (11.3) | 2 (21.6) | 2 (21.0) | 4 (39.9) | 2 (19.3) |
| Robberies (per 100,000) | 1 (12.1) | 3 (40.8) | 2 (26.9) | 1 (13.4) | 4 (52.5) | 1 (12.8) | 0 (0.0) | 2 (23.4) | 4 (45.1) | 2 (21.6) | 3 (31.6) | 1 (10.0) | 1 (9.7) |
| Assaults (per 100,000) | 49 (593.5) | 23 (312.5) | 43 (577.4) | 38 (507.7) | 25 (328.0) | 36 (460.1) | 32 (387.9) | 29 (339.0) | 36 (405.9) | 17 (183.4) | 6 (63.1) | 19 (189.6) | 33 (318.8) |
| Burglaries (per 100,000) | 65 (787.3) | 55 (747.3) | 58 (778.8) | 41 (547.8) | 113 (1,483) | 40 (511.2) | 31 (375.8) | 24 (280.6) | 40 (451.0) | 32 (345.3) | 31 (326.2) | 30 (299.4) | 10 (96.6) |
| Thefts (per 100,000) | 125 (1,514) | 74 (1,005) | 89 (1,195) | 86 (1,149) | 117 (1,535) | 53 (677.3) | 64 (775.8) | 58 (678.0) | 45 (507.3) | 63 (679.8) | 87 (915.6) | 71 (708.6) | 68 (656.9) |
| Auto thefts (per 100,000) | 10 (121.1) | 9 (122.3) | 14 (188.0) | 18 (240.5) | 15 (196.8) | 23 (293.9) | 13 (157.6) | 17 (198.7) | 9 (101.5) | 23 (248.2) | 22 (231.5) | 21 (209.6) | 12 (115.9) |
| Arson (per 100,000) | 2 (24.2) | 0 (0.0) | 4 (53.7) | 2 (26.7) | 2 (26.2) | 2 (25.6) | 0 (0.0) | 0 (0.0) | 0 (0.0) | 1 (10.8) | 0 (0.0) | 0 (0.0) | 1 (9.7) |
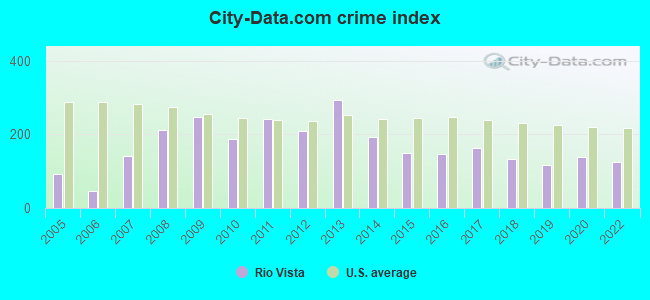
| City-Data.com crime index | 247.7 | 187.9 | 240.9 | 209.1 | 293.8 | 192.5 | 147.5 | 146.8 | 163.7 | 131.6 | 116.9 | 138.9 | 124.4 |
The City-Data.com crime index weighs serious crimes and violent crimes more heavily. Higher means more crime, U.S. average is 246.1. It adjusts for the number of visitors and daily workers commuting into cities.
Crime rate in Rio Vista detailed stats: murders, rapes, robberies, assaults, burglaries, thefts, arson
Full-time law enforcement employees in 2021, including police officers: 14 (12 officers - 12 male; 0 female).
| Officers per 1,000 residents here: | 1.17 |
| California average: | 2.30 |
 Recent articles from our blog. Our writers, many of them Ph.D. graduates or candidates, create easy-to-read articles on a wide variety of topics.

 | Questions about FAIRFIELD, CA (9 replies) |
| Relocating and Househunting (48 replies) |
| Fairfield, CA questions (1 reply) |
| Questions about Elk Grove and river delta areas (7 replies) |
| Driving/commuting question for river delta area (2 replies) |
| Do we underestimate and downplay how Great Sacramento weather really is? (4532 replies) |
Latest news from Rio Vista, CA collected exclusively by city-data.com from local newspapers, TV, and radio stations
Ancestries: Irish (9.6%), English (8.8%), Portuguese (6.0%), German (5.4%), American (3.9%), European (3.8%).
Current Local Time: PST time zone
Elevation: 22 feet
Land area: 6.75 square miles.
Population density: 1,536 people per square mile (low).
1,020 residents are foreign born (6.4% Latin America, 2.9% Asia).
| This city: | 10.2% |
| California: | 26.5% |
Median real estate property taxes paid for housing units with mortgages in 2022: $4,505 (0.9%)
Median real estate property taxes paid for housing units with no mortgage in 2022: $4,475 (0.9%)
Nearest city with pop. 50,000+: Antioch, CA  (13.2 miles , pop. 90,532).
Nearest city with pop. 200,000+: Stockton, CA (25.1 miles , pop. 243,771).
Nearest city with pop. 1,000,000+: Los Angeles, CA (337.5 miles , pop. 3,694,820).
Nearest cities:
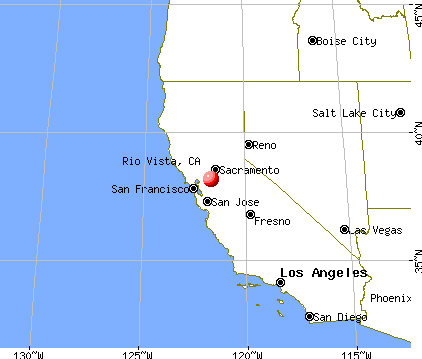
), ), )Latitude: 38.16 N, Longitude: 121.70 W
Area code: 707
Rio Vista, California accommodation & food services, waste management - Economy and Business Data
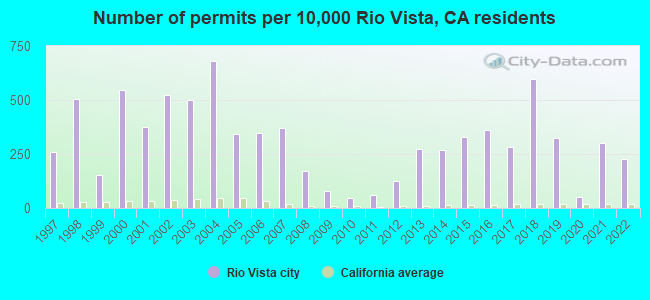
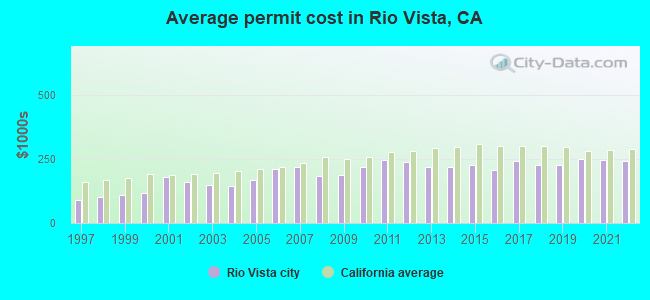
Single-family new house construction building permits:
- 2022: 103 buildings, average cost: $240,900
- 2021: 137 buildings, average cost: $248,100
- 2020: 24 buildings, average cost: $248,900
- 2019: 149 buildings, average cost: $227,100
- 2018: 274 buildings, average cost: $228,900
- 2017: 130 buildings, average cost: $240,600
- 2016: 166 buildings, average cost: $206,900
- 2015: 151 buildings, average cost: $225,700
- 2014: 123 buildings, average cost: $218,800
- 2013: 125 buildings, average cost: $218,600
- 2012: 58 buildings, average cost: $237,400
- 2011: 28 buildings, average cost: $246,800
- 2010: 20 buildings, average cost: $218,700
- 2009: 35 buildings, average cost: $189,400
- 2008: 79 buildings, average cost: $184,100
- 2007: 170 buildings, average cost: $217,900
- 2006: 159 buildings, average cost: $212,800
- 2005: 157 buildings, average cost: $166,800
- 2004: 311 buildings, average cost: $146,000
- 2003: 228 buildings, average cost: $149,000
- 2002: 239 buildings, average cost: $159,400
- 2001: 172 buildings, average cost: $181,800
- 2000: 250 buildings, average cost: $118,700
- 1999: 71 buildings, average cost: $108,100
- 1998: 231 buildings, average cost: $101,200
- 1997: 119 buildings, average cost: $89,300
| Here: | 5.1% |
| California: | 5.1% |
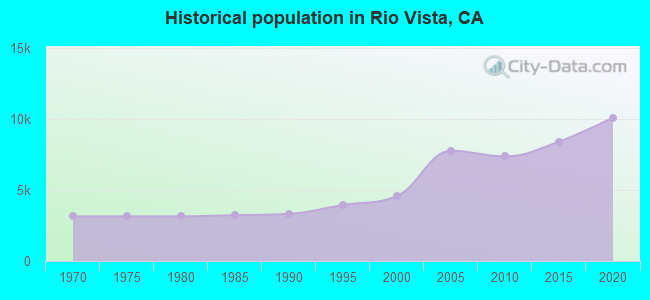
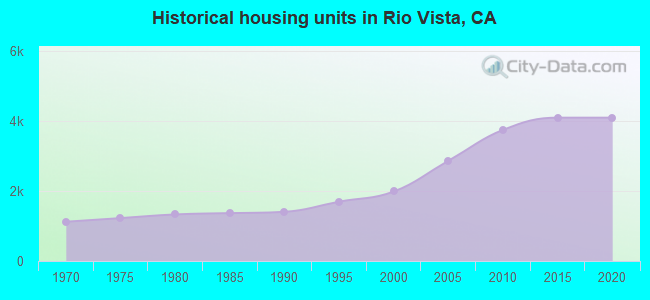
Population change in the 1990s: +1,040 (+29.5%).
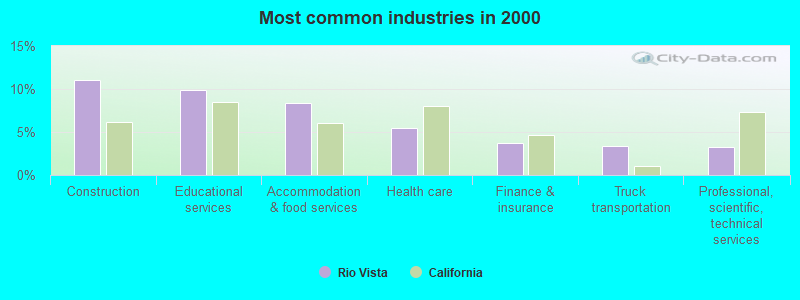
- Construction (11.0%)
- Educational services (9.9%)
- Accommodation & food services (8.3%)
- Health care (5.4%)
- Finance & insurance (3.7%)
- Truck transportation (3.3%)
- Professional, scientific, technical services (3.3%)
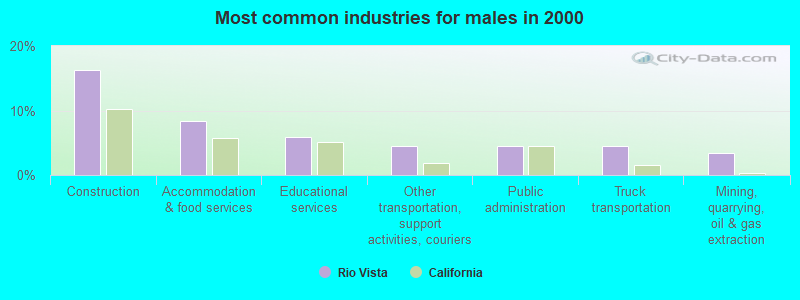
- Construction (16.3%)
- Accommodation & food services (8.4%)
- Educational services (5.8%)
- Other transportation, support activities, couriers (4.5%)
- Public administration (4.5%)
- Truck transportation (4.4%)
- Mining, quarrying, oil & gas extraction (3.5%)
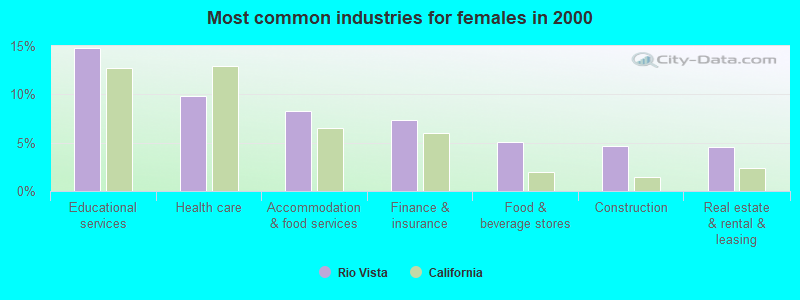
- Educational services (14.8%)
- Health care (9.8%)
- Accommodation & food services (8.3%)
- Finance & insurance (7.4%)
- Food & beverage stores (5.1%)
- Construction (4.7%)
- Real estate & rental & leasing (4.6%)
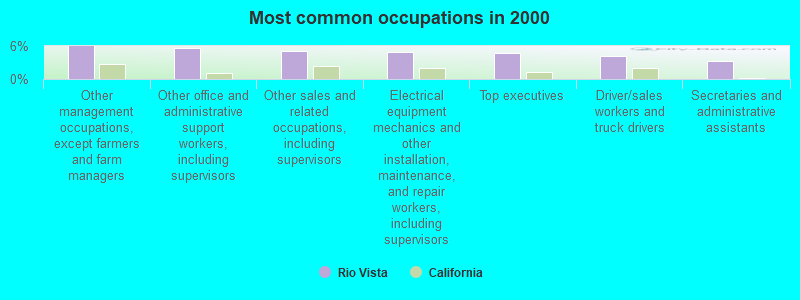
- Other management occupations, except farmers and farm managers (6.0%)
- Other office and administrative support workers, including supervisors (5.7%)
- Other sales and related occupations, including supervisors (5.0%)
- Electrical equipment mechanics and other installation, maintenance, and repair workers, including supervisors (4.8%)
- Top executives (4.7%)
- Driver/sales workers and truck drivers (4.1%)
- Secretaries and administrative assistants (3.2%)
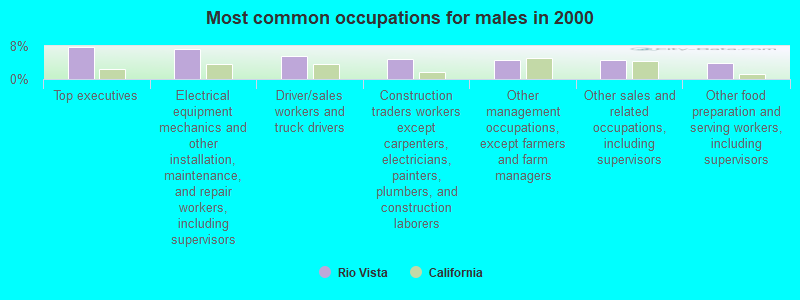
- Top executives (7.8%)
- Electrical equipment mechanics and other installation, maintenance, and repair workers, including supervisors (7.3%)
- Driver/sales workers and truck drivers (5.6%)
- Construction traders workers except carpenters, electricians, painters, plumbers, and construction laborers (4.9%)
- Other management occupations, except farmers and farm managers (4.7%)
- Other sales and related occupations, including supervisors (4.5%)
- Other food preparation and serving workers, including supervisors (3.9%)
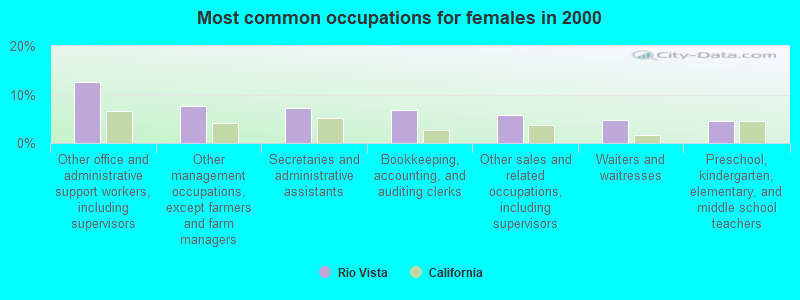
- Other office and administrative support workers, including supervisors (12.6%)
- Other management occupations, except farmers and farm managers (7.6%)
- Secretaries and administrative assistants (7.2%)
- Bookkeeping, accounting, and auditing clerks (6.7%)
- Other sales and related occupations, including supervisors (5.7%)
- Waiters and waitresses (4.8%)
- Preschool, kindergarten, elementary, and middle school teachers (4.4%)
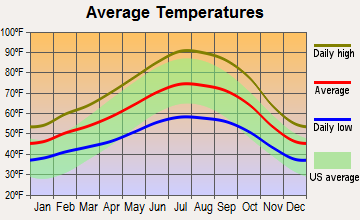
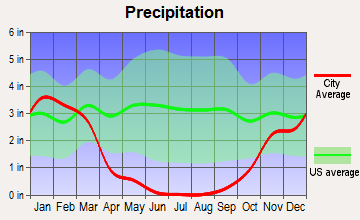
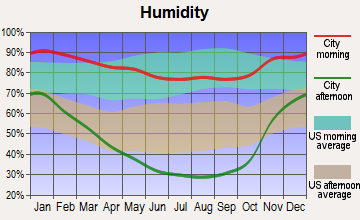
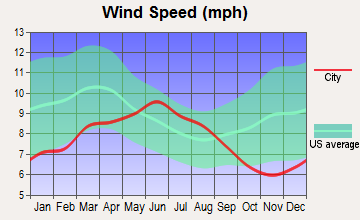
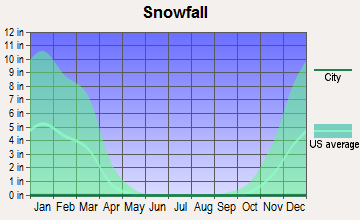
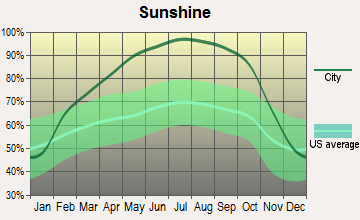
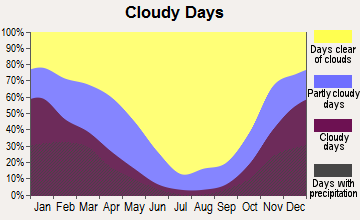
Average climate in Rio Vista, California
Based on data reported by over 4,000 weather stations
|
|

(lower is better)
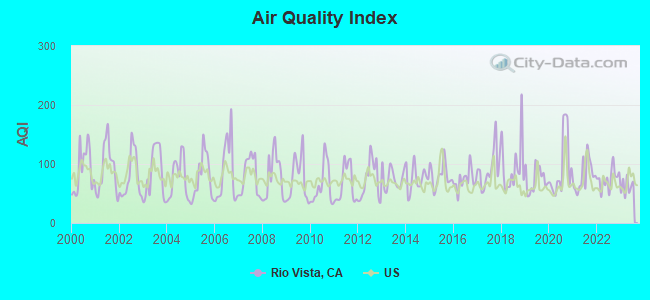
Air Quality Index (AQI) level in 2023 was 61.8. This is about average.
| City: | 61.8 |
| U.S.: | 72.6 |
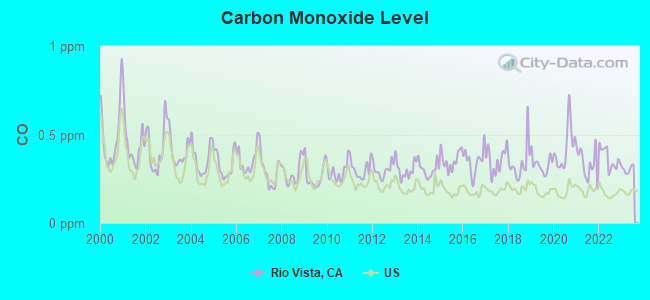
Carbon Monoxide (CO) [ppm] level in 2023 was 0.304. This is worse than average. Closest monitor was 1.4 miles away from the city center.
| City: | 0.304 |
| U.S.: | 0.251 |
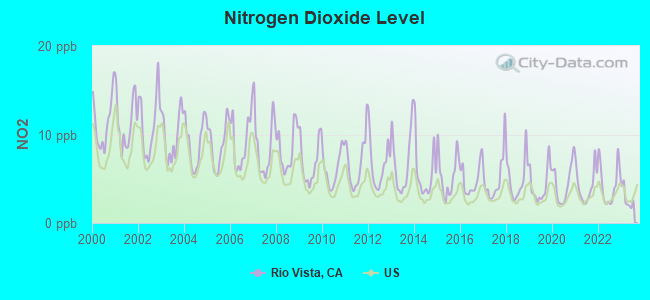
Nitrogen Dioxide (NO2) [ppb] level in 2023 was 2.78. This is significantly better than average. Closest monitor was 1.4 miles away from the city center.
| City: | 2.78 |
| U.S.: | 5.11 |
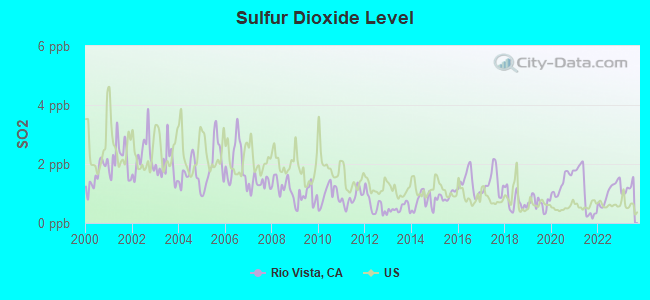
Sulfur Dioxide (SO2) [ppb] level in 2023 was 1.17. This is better than average. Closest monitor was 11.3 miles away from the city center.
| City: | 1.17 |
| U.S.: | 1.51 |
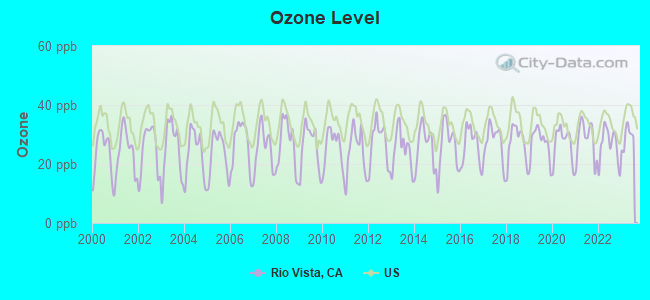
Ozone [ppb] level in 2023 was 29.2. This is about average. Closest monitor was 1.4 miles away from the city center.
| City: | 29.2 |
| U.S.: | 33.3 |
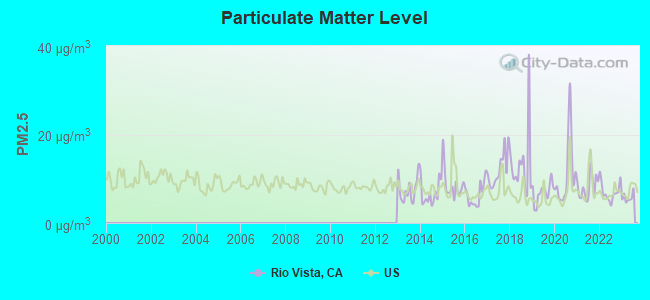
Particulate Matter (PM2.5) [µg/m3] level in 2023 was 5.74. This is significantly better than average. Closest monitor was 23.9 miles away from the city center.
| City: | 5.74 |
| U.S.: | 8.11 |
Earthquake activity:
Rio Vista-area historical earthquake activity is significantly above California state average. It is 7808% greater than the overall U.S. average.On 4/18/1906 at 13:12:21, a magnitude 7.9 (7.9 UK, Class: Major, Intensity: VIII - XII) earthquake occurred 71.9 miles away from the city center, causing $524,000,000 total damage
On 10/18/1989 at 00:04:15, a magnitude 7.1 (6.5 MB, 7.1 MS, 6.9 MW, 7.0 ML) earthquake occurred 73.0 miles away from the city center, causing 62 deaths (62 shaking deaths) and 3757 injuries, causing $1,305,032,704 total damage
On 7/21/1952 at 11:52:14, a magnitude 7.7 (7.7 UK) earthquake occurred 265.1 miles away from Rio Vista center, causing $50,000,000 total damage
On 11/4/1927 at 13:51:53, a magnitude 7.5 (7.5 UK) earthquake occurred 227.7 miles away from the city center
On 1/31/1922 at 13:17:28, a magnitude 7.6 (7.6 UK) earthquake occurred 270.6 miles away from the city center
On 10/3/1915 at 06:52:48, a magnitude 7.6 (7.6 UK) earthquake occurred 276.5 miles away from Rio Vista center
Magnitude types: body-wave magnitude (MB), local magnitude (ML), surface-wave magnitude (MS), moment magnitude (MW)
Natural disasters:
The number of natural disasters in Solano County (23) is greater than the US average (15).Major Disasters (Presidential) Declared: 15
Emergencies Declared: 2
Causes of natural disasters: Floods: 13, Storms: 7, Winter Storms: 5, Fires: 4, Mudslides: 4, Landslides: 3, Earthquakes: 2, Drought: 1, Freeze: 1, Heavy Rain: 1, Hurricane: 1, Tornado: 1, Other: 1 (Note: some incidents may be assigned to more than one category).
Hospitals and medical centers near Rio Vista:
- ANTIOCH CONVALESCENT HOSPITAL (Nursing Home, about 13 miles away; ANTIOCH, CA)
- KC'S SUNSHINE HOMES, ANGELIC II (Hospital, about 14 miles away; OAKLEY, CA)
- ANTIOCH DIALYSIS CENTER (Dialysis Facility, about 14 miles away; ANTIOCH, CA)
- PUTNAM ICF (Hospital, about 14 miles away; ANTIOCH, CA)
- PUTNAM WEST ICF (Hospital, about 14 miles away; ANTIOCH, CA)
- BELLE ICF (Hospital, about 14 miles away; ANTIOCH, CA)
- WINGS I (Hospital, about 14 miles away; ANTIOCH, CA)
Airports located in Rio Vista:
- Rio Vista Municipal Airport (O88) (Runways: 3, Itinerant Ops: 17,500, Local Ops: 17,500)
Amtrak stations near Rio Vista:
- 12 miles: ANTIOCH-PITTSBURG (ANTIOCH, I ST. & SANTA FE TRACKS) . Services: public payphones, full-service food facilities, free short-term parking, free long-term parking, call for taxi service, intercity bus service, public transit connection.
- 20 miles: SUISUN-FAIRFIELD (SUISUN, 177 MAIN ST. (UNDER HWY. 12)) . Services: fully wheelchair accessible, public restrooms, free short-term parking, call for taxi service, intercity bus service.
Colleges/universities with over 2000 students nearest to Rio Vista:
- Los Medanos College (about 15 miles; Pittsburg, CA; Full-time enrollment: 5,289)
- Solano Community College (about 24 miles; Fairfield, CA; FT enrollment: 5,790)
- San Joaquin Delta College (about 24 miles; Stockton, CA; FT enrollment: 12,167)
- Diablo Valley College (about 25 miles; Pleasant Hill, CA; FT enrollment: 13,015)
- University of the Pacific (about 25 miles; Stockton, CA; FT enrollment: 4,999)
- Cosumnes River College (about 25 miles; Sacramento, CA; FT enrollment: 9,327)
- University of California-Davis (about 27 miles; Davis, CA; FT enrollment: 30,845)
Public high schools in Rio Vista:
- RIO VISTA HIGH (Students: 249, Location: 410 S. FOURTH ST., Grades: 9-12)
- RIVER DELTA HIGH/ELEMENTARY (ALTERNATIVE) (Location: 400 ELM WAY., Grades: KG-12)
Public elementary/middle schools in Rio Vista:
- RIVERVIEW MIDDLE (Students: 320, Location: 525 S. SECOND ST., Grades: 6-8)
- D. H. WHITE ELEMENTARY (Students: 218, Location: 500 ELM WAY, Grades: KG-5)
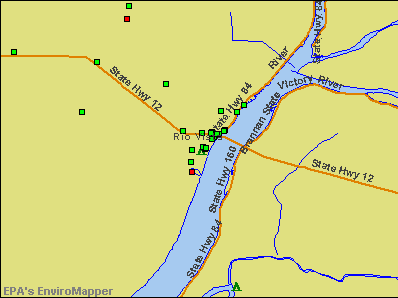
Points of interest:
Notable locations in Rio Vista: Delta Marina (A), Rio Vista Public Library (B), Rio Vista Museum (C), Rio Vista City Hall (D), Rio Vista Fire Department - Delta Fire Protection District Main Station (E), Montezuma Fire Protection District Rio Vista Station (F). Display/hide their locations on the map
Churches in Rio Vista include: Church of Christ (A), The Church of Jesus Christ of Latter Day Saints (B), Rio Vista Assembly of God Church (C), Saint Joseph Catholic Church (D), Union Baptist Church (E). Display/hide their locations on the map
Parks in Rio Vista include: Bruna Vista Park (1), Bruning Park (2). Display/hide their locations on the map
Tourist attraction: Bay Area Electric Railroad Association (Museums; Highway 12).
Birthplace of: Bill Wight - Baseball player.
Drinking water stations with addresses in Rio Vista and their reported violations in the past:
DUCK ISLAND RV PARK (Population served: 110, Groundwater):Past monitoring violations:EDDO S HARBOR & R V PARK (Population served: 75, Groundwater):
- One routine major monitoring violation
Past health violations:
- MCL, Monthly (TCR) - In MAY-2010, Contaminant: Coliform. Follow-up actions: St AO (w/o penalty) issued (MAR-10-2010), St Compliance achieved (JUL-10-2010)
- MCL, Monthly (TCR) - In APR-2010, Contaminant: Coliform. Follow-up actions: St AO (w/o penalty) issued (MAR-10-2010), St Compliance achieved (JUL-10-2010)
- MCL, Monthly (TCR) - In MAR-2010, Contaminant: Coliform. Follow-up actions: St AO (w/o penalty) issued (MAR-10-2010), St Compliance achieved (JUL-10-2010)
- MCL, Monthly (TCR) - In FEB-2010, Contaminant: Coliform. Follow-up actions: St AO (w/o penalty) issued (MAR-10-2010), St Compliance achieved (JUL-10-2010)
- MCL, Monthly (TCR) - In JAN-2010, Contaminant: Coliform. Follow-up actions: St AO (w/o penalty) issued (MAR-10-2010), St Compliance achieved (JUL-10-2010)
- MCL, Monthly (TCR) - In NOV-2009, Contaminant: Coliform. Follow-up actions: St Boil Water Order (OCT-23-2009), St Compliance achieved (JAN-10-2010), St AO (w/o penalty) issued (DEC-04-2010)
- MCL, Acute (TCR) - In OCT-2009, Contaminant: Coliform. Follow-up actions: St Boil Water Order (OCT-23-2009), St Compliance achieved (JAN-10-2010), St AO (w/o penalty) issued (DEC-04-2010)
Drinking water stations with addresses in Rio Vista that have no violations reported:
- RIO VIENTO RV CAMP [SWS] (Population served: 154, Primary Water Source Type: Groundwater)
- HASTINGS ISLAND HUNTING PRESERVE (Population served: 100, Primary Water Source Type: Groundwater)
- OUTRIGGER MARINA & CAFE LLC (Population served: 75, Primary Water Source Type: Groundwater)
| This city: | 2.1 people |
| California: | 2.9 people |
| This city: | 64.9% |
| Whole state: | 68.7% |
| This city: | 4.9% |
| Whole state: | 7.2% |
Likely homosexual households (counted as self-reported same-sex unmarried-partner households)
- Lesbian couples: 0.3% of all households
- Gay men: 0.3% of all households
Banks with branches in Rio Vista (2011 data):
- Bank of Stockton: Rio Vista Branch at 230 Main Street, branch established on 1936/11/02. Info updated 2010/04/08: Bank assets: $2,047.8 mil, Deposits: $1,722.4 mil, headquarters in Stockton, CA, positive income, Commercial Lending Specialization, 16 total offices, Holding Company: 1867 Western Financial Corporation
- Bank of Rio Vista: Bank Of Rio Vista at 101 Main Street, branch established on 1904/04/12. Info updated 2006/11/03: Bank assets: $180.1 mil, Deposits: $156.1 mil, local headquarters, positive income, Commercial Lending Specialization, 3 total offices
For population 15 years and over in Rio Vista:
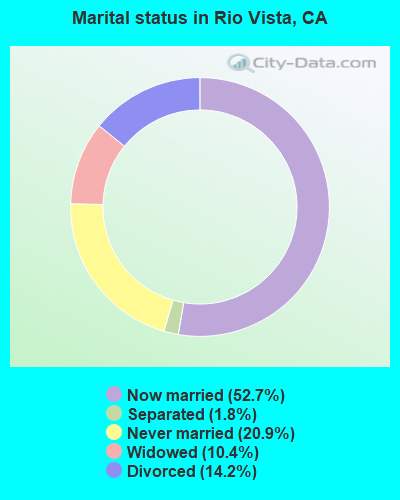
- Never married: 20.9%
- Now married: 52.7%
- Separated: 1.8%
- Widowed: 10.4%
- Divorced: 14.2%
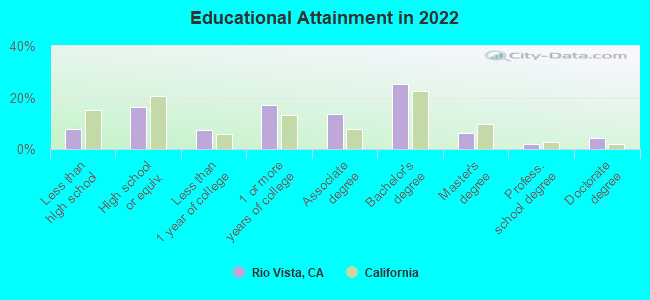
For population 25 years and over in Rio Vista:
- High school or higher: 93.8%
- Bachelor's degree or higher: 37.9%
- Graduate or professional degree: 13.9%
- Unemployed: 4.4%
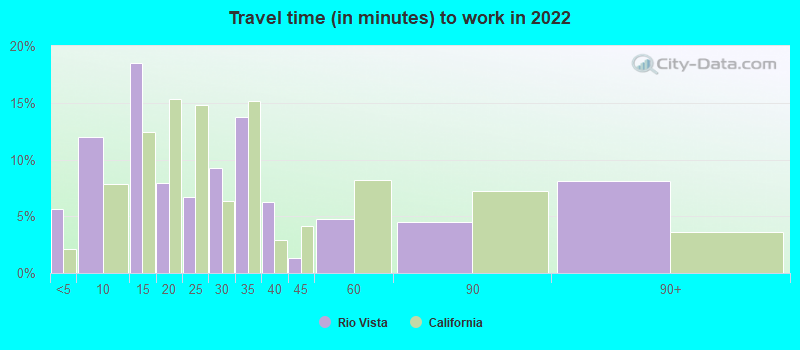
- Mean travel time to work (commute): 28.8 minutes
| Here: | 10.1 |
| California average: | 15.5 |
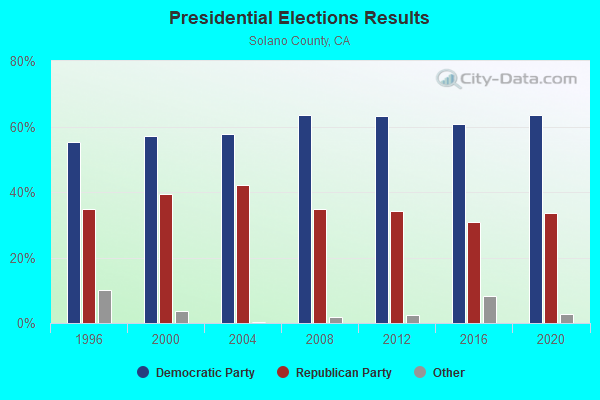
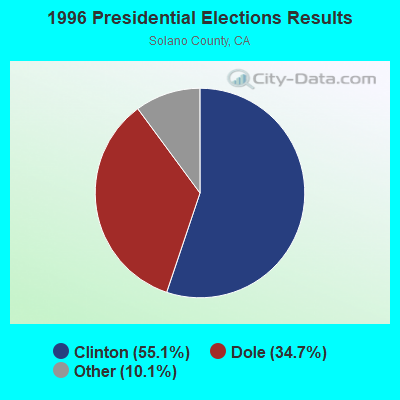
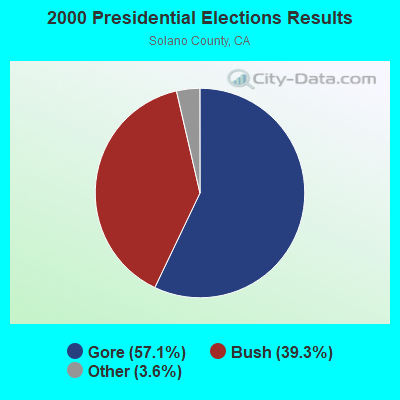
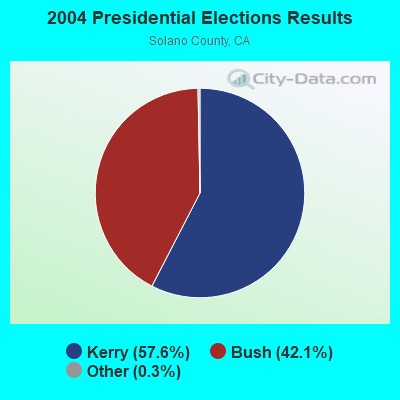
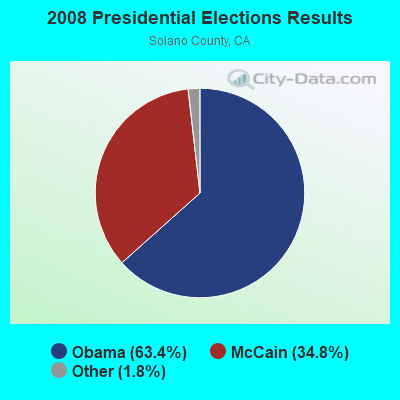
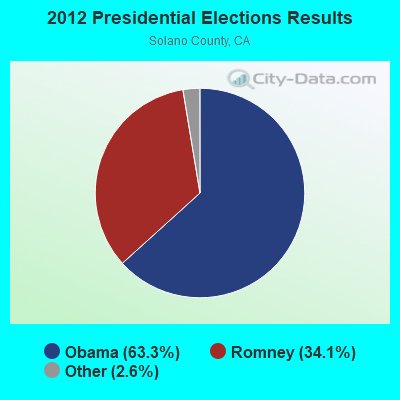
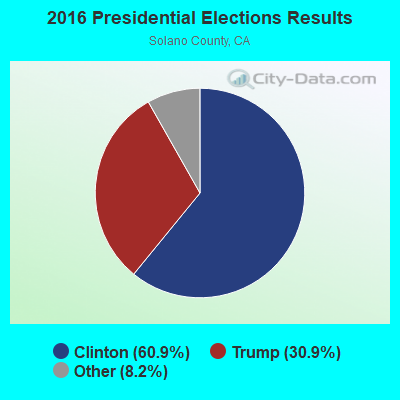
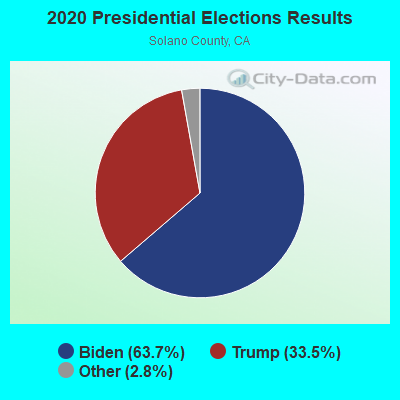
Graphs represent county-level data. Detailed 2008 Election Results
Religion statistics for Rio Vista, CA (based on Solano County data)
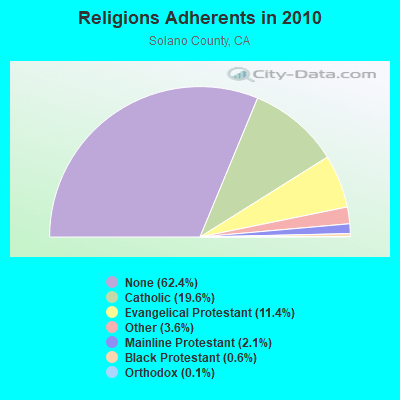
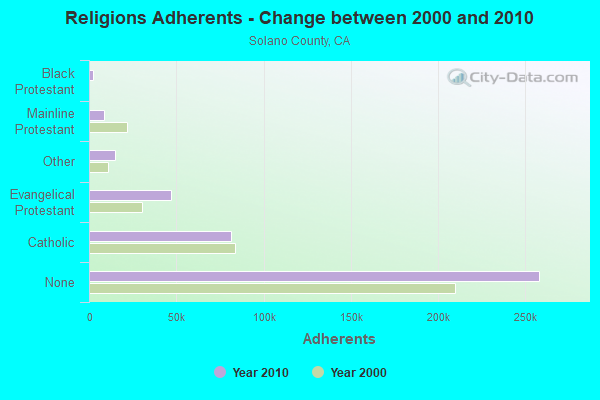
| Religion | Adherents | Congregations |
|---|---|---|
| Catholic | 81,158 | 10 |
| Evangelical Protestant | 47,081 | 181 |
| Other | 15,086 | 45 |
| Mainline Protestant | 8,849 | 40 |
| Black Protestant | 2,567 | 16 |
| Orthodox | 566 | 2 |
| None | 258,037 | - |
Food Environment Statistics:
| Here: | 1.92 / 10,000 pop. |
| State: | 2.14 / 10,000 pop. |
| Here: | 0.10 / 10,000 pop. |
| California: | 0.04 / 10,000 pop. |
| Solano County: | 0.52 / 10,000 pop. |
| State: | 0.62 / 10,000 pop. |
| Here: | 2.24 / 10,000 pop. |
| California: | 1.49 / 10,000 pop. |
| Solano County: | 5.43 / 10,000 pop. |
| State: | 7.42 / 10,000 pop. |
| Solano County: | 9.8% |
| California: | 7.3% |
| Solano County: | 25.1% |
| California: | 21.3% |
| Here: | 17.4% |
| California: | 17.9% |
Health and Nutrition:
| This city: | 50.6% |
| State: | 49.4% |
| Rio Vista: | 47.2% |
| California: | 48.0% |
| This city: | 28.5 |
| California: | 28.1 |
| Rio Vista: | 20.9% |
| California: | 20.2% |
| Rio Vista: | 10.6% |
| California: | 11.2% |
| Rio Vista: | 6.9 |
| California: | 6.8 |
| Here: | 35.2% |
| State: | 31.5% |
| Here: | 55.5% |
| State: | 56.4% |
| Rio Vista: | 76.8% |
| State: | 80.9% |
More about Health and Nutrition of Rio Vista, CA Residents
| Local government employment and payroll (March 2022) | |||||
| Function | Full-time employees | Monthly full-time payroll | Average yearly full-time wage | Part-time employees | Monthly part-time payroll |
|---|---|---|---|---|---|
| Firefighters | 12 | $85,580 | $85,580 | 0 | $0 |
| Sewerage | 10 | $74,512 | $89,414 | 0 | $0 |
| Financial Administration | 5 | $36,653 | $87,967 | 0 | $0 |
| Other Government Administration | 4 | $18,563 | $55,689 | 0 | $0 |
| Parks and Recreation | 2 | $9,727 | $58,362 | 0 | $0 |
| Streets and Highways | 2 | $5,059 | $30,354 | 0 | $0 |
| Police - Other | 1 | $7,744 | $92,928 | 2 | $4,075 |
| Totals for Government | 36 | $237,837 | $79,279 | 2 | $4,075 |
Rio Vista government finances - Expenditure in 2017 (per resident):
- Construction - Regular Highways: $317,000 ($30.55)
Local Fire Protection: $185,000 ($17.83)
Transit Utilities: $139,000 ($13.40)
Parks and Recreation: $115,000 ($11.08)
- Current Operations - Sewerage: $3,081,000 ($296.96)
Police Protection: $2,206,000 ($212.63)
Local Fire Protection: $1,925,000 ($185.54)
Water Utilities: $1,378,000 ($132.82)
Central Staff Services: $1,203,000 ($115.95)
Transit Utilities: $919,000 ($88.58)
Regular Highways: $461,000 ($44.43)
Parks and Recreation: $349,000 ($33.64)
Air Transportation: $327,000 ($31.52)
Protective Inspection and Regulation - Other: $238,000 ($22.94)
Solid Waste Management: $133,000 ($12.82)
Housing and Community Development: $78,000 ($7.52)
General - Other: $51,000 ($4.92)
Health - Other: $46,000 ($4.43)
Libraries: $7,000 ($0.67)
- General - Interest on Debt: $51,000 ($4.92)
- Intergovernmental to Local - Other - Regular Highways: $145,000 ($13.98)
Other - Police Protection: $130,000 ($12.53)
- Other Capital Outlay - Central Staff Services: $127,000 ($12.24)
Local Fire Protection: $107,000 ($10.31)
Air Transportation: $8,000 ($0.77)
- Total Salaries and Wages: $10,000 ($0.96)
- Water Utilities - Interest on Debt: $88,000 ($8.48)
Rio Vista government finances - Revenue in 2017 (per resident):
- Charges - Sewerage: $4,578,000 ($441.25)
Other: $1,173,000 ($113.06)
Solid Waste Management: $305,000 ($29.40)
Air Transportation: $188,000 ($18.12)
Parks and Recreation: $57,000 ($5.49)
- Federal Intergovernmental - Transit Utilities: $405,000 ($39.04)
Other: $302,000 ($29.11)
Air Transportation: $151,000 ($14.55)
Housing and Community Development: $23,000 ($2.22)
- Local Intergovernmental - Transit Utilities: $253,000 ($24.39)
- Miscellaneous - Interest Earnings: $130,000 ($12.53)
Rents: $78,000 ($7.52)
General Revenue - Other: $44,000 ($4.24)
Royalties: $40,000 ($3.86)
Fines and Forfeits: $38,000 ($3.66)
Donations From Private Sources: $14,000 ($1.35)
- Revenue - Water Utilities: $2,737,000 ($263.81)
Transit Utilities: $52,000 ($5.01)
- State Intergovernmental - Other: $420,000 ($40.48)
Highways: $171,000 ($16.48)
Transit Utilities: $65,000 ($6.27)
General Local Government Support: $13,000 ($1.25)
- Tax - Property: $2,738,000 ($263.90)
General Sales and Gross Receipts: $2,249,000 ($216.77)
Other License: $595,000 ($57.35)
Public Utilities Sales: $130,000 ($12.53)
Documentary and Stock Transfer: $89,000 ($8.58)
Occupation and Business License - Other: $52,000 ($5.01)
Other: $44,000 ($4.24)
Other Selective Sales: $19,000 ($1.83)
Rio Vista government finances - Debt in 2017 (per resident):
- Long Term Debt - Beginning Outstanding - Unspecified Public Purpose: $5,476,000 ($527.81)
Outstanding Unspecified Public Purpose: $5,059,000 ($487.61)
Retired Unspecified Public Purpose: $417,000 ($40.19)
Rio Vista government finances - Cash and Securities in 2017 (per resident):
- Bond Funds - Cash and Securities: $5,291,000 ($509.98)
- Other Funds - Cash and Securities: $19,994,000 ($1927.13)
- Sinking Funds - Cash and Securities: $64,000 ($6.17)
6.92% of this county's 2021 resident taxpayers lived in other counties in 2020 ($66,832 average adjusted gross income)
| Here: | 6.92% |
| California average: | 5.19% |
0.10% of residents moved from foreign countries ($924 average AGI)
Solano County: 0.10% California average: 0.03%
Top counties from which taxpayers relocated into this county between 2020 and 2021:
| from Contra Costa County, CA | |
| from Alameda County, CA | |
| from Sacramento County, CA |
7.45% of this county's 2020 resident taxpayers moved to other counties in 2021 ($71,700 average adjusted gross income)
| Here: | 7.45% |
| California average: | 6.14% |
0.08% of residents moved to foreign countries ($756 average AGI)
Solano County: 0.08% California average: 0.02%
Top counties to which taxpayers relocated from this county between 2020 and 2021:
| to Contra Costa County, CA | |
| to Sacramento County, CA | |
| to Alameda County, CA |
| Businesses in Rio Vista, CA | ||||
| Name | Count | Name | Count | |
|---|---|---|---|---|
| Ace Hardware | 1 | McDonald's | 1 | |
| Chevrolet | 1 | RadioShack | 1 | |
| FedEx | 1 | Taco Bell | 1 | |
| Ford | 1 | U-Haul | 1 | |
| KFC | 1 | UPS | 1 | |
Strongest AM radio stations in Rio Vista:
- KATD (990 AM; 10 kW; PITTSBURG, CA; Owner: RADIO UNICA OF SACRAMENTO LICENSE CORP.)
- KHTK (1140 AM; 50 kW; SACRAMENTO, CA; Owner: INFINITY RADIO SUBSIDIARY OPERATIONS INC.)
- KSTE (650 AM; 25 kW; RANCHO CORDOVA, CA; Owner: AMFM RADIO LICENSES, L.L.C.)
- KTRB (860 AM; 50 kW; MODESTO, CA; Owner: PAPPAS RADIO OF CALIFORNIA, A CALIFORNIA LIMITED PARTNERSHIP)
- KCBS (740 AM; 50 kW; SAN FRANCISCO, CA; Owner: INFINITY BROADCASTING OPERATIONS, INC.)
- KNBR (680 AM; 50 kW; SAN FRANCISCO, CA; Owner: KNBR LICO, INC.)
- KTCT (1050 AM; 50 kW; SAN MATEO, CA; Owner: SUSQUEHANNA RADIO CORP.)
- KGO (810 AM; 50 kW; SAN FRANCISCO, CA; Owner: KGO-AM RADIO, INC.)
- KFAX (1100 AM; 50 kW; SAN FRANCISCO, CA; Owner: GOLDEN GATE BROADCASTING CO, INC.)
- KCBC (770 AM; 50 kW; RIVERBANK, CA; Owner: KIERTRON, INC.)
- KIQI (1010 AM; 35 kW; SAN FRANCISCO, CA; Owner: RADIO UNICA OF SAN FRANCISCO LICENSE CORP.)
- KNEW (910 AM; 20 kW; OAKLAND, CA; Owner: AMFM RADIO LICENSES, L.L.C.)
- KFBK (1530 AM; 50 kW; SACRAMENTO, CA; Owner: AMFM RADIO LICENSES, L.L.C.)
Strongest FM radio stations in Rio Vista:
- KRVH (90.9 FM; RIO VISTA, CA; Owner: RIVER DELTA UNIFIED SCHOOL DISTRICT)
- KKSF-FM1 (103.7 FM; PLEASANTON, ETC., CA; Owner: AMFM RADIO LICENSES, L.L.C.)
- KBLX-FM2 (102.9 FM; PLEASANTON, CA; Owner: ICBC BROADCAST HOLDINGS -CA, INC.)
- KSOL-FM3 (98.9 FM; PLEASANTON, CA; Owner: TMS LICENSE CALIFORNIA, INC)
- KFRC-FM3 (99.7 FM; WALNUT CREEK, CA; Owner: INFINITY KFRC-FM, INC.)
- KZBR-FM1 (95.7 FM; WALNUT CREEK, CA; Owner: BONNEVILLE HOLDING COMPANY)
- KMEL-FM1 (106.1 FM; CONCORD, CA; Owner: AMFM RADIO LICENSES, L.L.C.)
- KISQ-FM3 (98.1 FM; CONCORD, CA; Owner: AMFM RADIO LICENSES, L.L.C.)
- KUIC (95.3 FM; VACAVILLE, CA; Owner: KUIC, INC.)
- KJOY (99.3 FM; STOCKTON, CA; Owner: CITADEL BROADCASTING COMPANY)
- KXJZ (88.9 FM; SACRAMENTO, CA; Owner: CALIFORNIA STATE UNIV., SACRAMENTO)
- K238AC (95.5 FM; SALIDA, CA; Owner: FAMILY STATIONS, INC.)
- KOSO (93.1 FM; PATTERSON, CA; Owner: CAPSTAR TX LIMITED PARTNERSHIP)
- KFJO (92.1 FM; WALNUT CREEK, CA; Owner: CHASE RADIO PROPERTIES, L.L.C.)
- KNDL (89.9 FM; ANGWIN, CA; Owner: HOWELL MOUNTAIN BROADCASTING COMPANY)
- KLVR (91.9 FM; SANTA ROSA, CA; Owner: EDUCATIONAL MEDIA FOUNDATION)
- KXTS (100.9 FM; CALISTOGA, CA; Owner: SINCLAIR TELECABLE, INC.)
- KSFB-FM (100.7 FM; SAN RAFAEL, CA; Owner: GOLDEN GATE BROADCASTING COMPANY, INC.)
- KZBR-FM2 (95.7 FM; LIVERMORE, ETC., CA; Owner: BONNEVILLE HOLDING COMPANY)
- KBBF (89.1 FM; SANTA ROSA, CA; Owner: BILINGUAL B/CING. FOUNDATION, INC.)
TV broadcast stations around Rio Vista:
- KOVR (Channel 13; STOCKTON, CA; Owner: SCI - SACRAMENTO LICENSEE, LLC)
- KXTV (Channel 10; SACRAMENTO, CA; Owner: KXTV, INC.)
- KCRA-TV (Channel 3; SACRAMENTO, CA; Owner: KCRA HEARST-ARGYLE TELEVISION, INC.)
- KSPX (Channel 29; SACRAMENTO, CA; Owner: PAXSON SACRAMENTO LICENSE, INC.)
- KTXL (Channel 40; SACRAMENTO, CA; Owner: CHANNEL 40, INC.)
- KUVS (Channel 19; MODESTO, CA; Owner: KUVS LICENSE PARTNERSHIP, G.P.)
- KVIE (Channel 6; SACRAMENTO, CA; Owner: KVIE, INC.)
- KQCA (Channel 58; STOCKTON, CA; Owner: KCRA HEARST-ARGYLE TELEVISION, INC.)
- KMAX-TV (Channel 31; SACRAMENTO, CA; Owner: UPN STATIONS GROUP INC.)
- KMMK-LP (Channel 14; SACRAMENTO, CA; Owner: CABALLERO TELEVISION TEXAS, L.L.C.)
- KQED (Channel 9; SAN FRANCISCO, CA; Owner: KQED, INC.)
- KEZT-CA (Channel 23; SACRAMENTO, CA; Owner: TELEFUTURA SACRAMENTO LLC)
- KTNC-TV (Channel 42; CONCORD, CA; Owner: KTNC LICENSE, LLC)
- KDTS-CA (Channel 52; STOCKTON, CA; Owner: WORD OF GOD FELLOWSHIP, INC.)
- National Bridge Inventory (NBI) Statistics
- 7Number of bridges
- 390ft / 119mTotal length
- 53,450Total average daily traffic
- 4,555Total average daily truck traffic
- 80,540Total future (year 2038) average daily traffic
FCC Registered Antenna Towers: 94 (See the full list of FCC Registered Antenna Towers)
FCC Registered Broadcast Land Mobile Towers: 17 (See the full list of FCC Registered Broadcast Land Mobile Towers in Rio Vista, CA)
FCC Registered Microwave Towers: 27 (See the full list of FCC Registered Microwave Towers in this town)
FCC Registered Maritime Coast & Aviation Ground Towers: 15 (See the full list of FCC Registered Maritime Coast & Aviation Ground Towers)
FCC Registered Amateur Radio Licenses: 100 (See the full list of FCC Registered Amateur Radio Licenses in Rio Vista)
FAA Registered Aircraft: 16 (See the full list of FAA Registered Aircraft in Rio Vista)
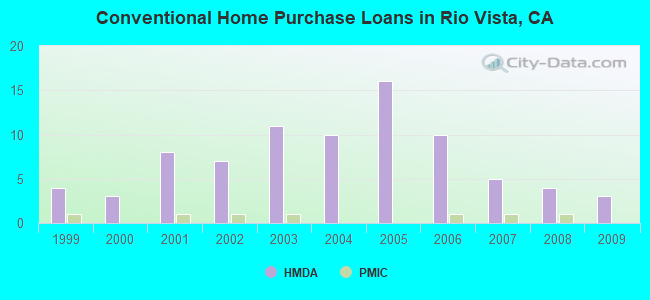
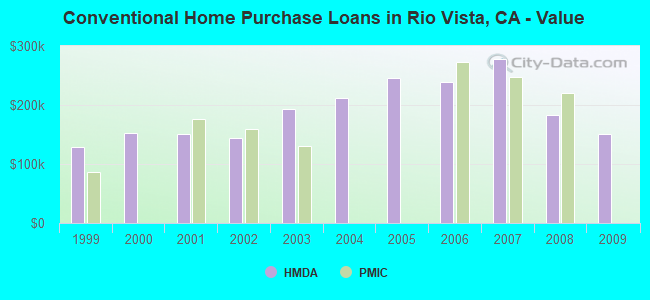
| Home Mortgage Disclosure Act Aggregated Statistics For Year 2009 (Based on 1 partial tract) | ||||||||
| A) FHA, FSA/RHS & VA Home Purchase Loans | B) Conventional Home Purchase Loans | C) Refinancings | F) Non-occupant Loans on < 5 Family Dwellings (A B C & D) | |||||
|---|---|---|---|---|---|---|---|---|
| Number | Average Value | Number | Average Value | Number | Average Value | Number | Average Value | |
| LOANS ORIGINATED | 2 | $185,090 | 3 | $150,207 | 5 | $180,928 | 1 | $189,060 |
| APPLICATIONS APPROVED, NOT ACCEPTED | 0 | $0 | 0 | $0 | 1 | $134,030 | 0 | $0 |
| APPLICATIONS DENIED | 0 | $0 | 0 | $0 | 3 | $228,527 | 1 | $111,660 |
| APPLICATIONS WITHDRAWN | 0 | $0 | 0 | $0 | 1 | $295,700 | 0 | $0 |
| FILES CLOSED FOR INCOMPLETENESS | 0 | $0 | 0 | $0 | 0 | $0 | 0 | $0 |
Detailed HMDA statistics for the following Tracts: 2535.00
| Private Mortgage Insurance Companies Aggregated Statistics For Year 2008 (Based on 1 partial tract) | ||
| A) Conventional Home Purchase Loans | ||
|---|---|---|
| Number | Average Value | |
| LOANS ORIGINATED | 1 | $219,700 |
| APPLICATIONS APPROVED, NOT ACCEPTED | 1 | $173,610 |
| APPLICATIONS DENIED | 0 | $0 |
| APPLICATIONS WITHDRAWN | 0 | $0 |
| FILES CLOSED FOR INCOMPLETENESS | 0 | $0 |
Detailed PMIC statistics for the following Tracts: 2535.00
2005 - 2018 National Fire Incident Reporting System (NFIRS) incidents
- Fire incident types reported to NFIRS in Rio Vista, CA
- 40266.0%Outside Fires
- 14223.3%Structure Fires
- 487.9%Mobile Property/Vehicle Fires
- 172.8%Other
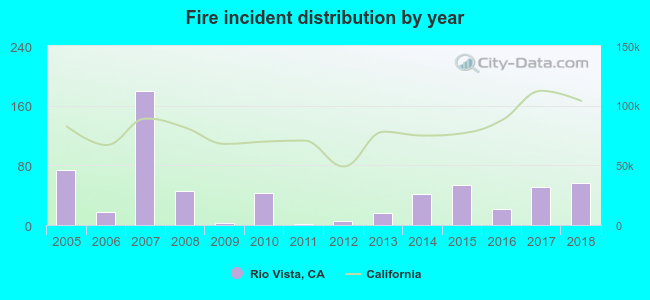 According to the data from the years 2005 - 2018 the average number of fire incidents per year is 44. The highest number of reported fires - 180 took place in 2007, and the least - 2 in 2011. The data has a declining trend.
 When looking into fire subcategories, the most reports belonged to: Outside Fires (66.0%), and Structure Fires (23.3%).
| Most common first names in Rio Vista, CA among deceased individuals | ||
| Name | Count | Lived (average) |
|---|---|---|
| John | 61 | 72.2 years |
| James | 38 | 72.7 years |
| Mary | 37 | 82.4 years |
| Robert | 37 | 70.1 years |
| William | 35 | 80.7 years |
| George | 35 | 75.0 years |
| Charles | 29 | 74.7 years |
| Joseph | 21 | 73.8 years |
| Frank | 20 | 77.6 years |
| Richard | 17 | 72.6 years |
| Most common last names in Rio Vista, CA among deceased individuals | ||
| Last name | Count | Lived (average) |
|---|---|---|
| Brown | 15 | 80.9 years |
| Williams | 14 | 77.5 years |
| Anderson | 12 | 76.7 years |
| Hansen | 11 | 75.7 years |
| Smith | 11 | 71.6 years |
| Miller | 11 | 77.3 years |
| Azevedo | 11 | 73.8 years |
| Hamilton | 11 | 79.9 years |
| Gomez | 9 | 82.0 years |
| Wilson | 9 | 75.6 years |
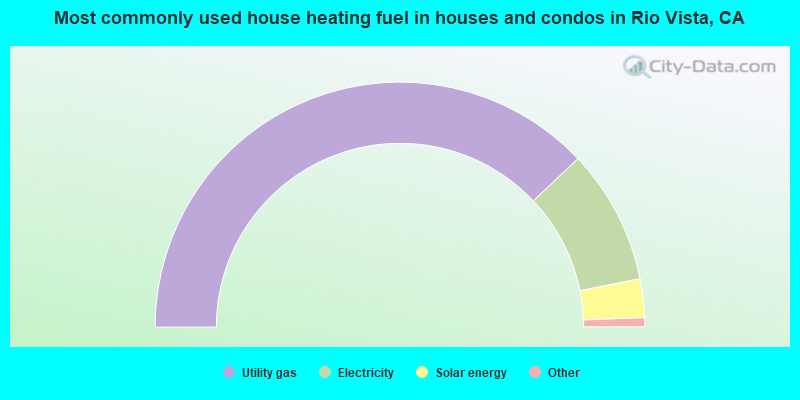
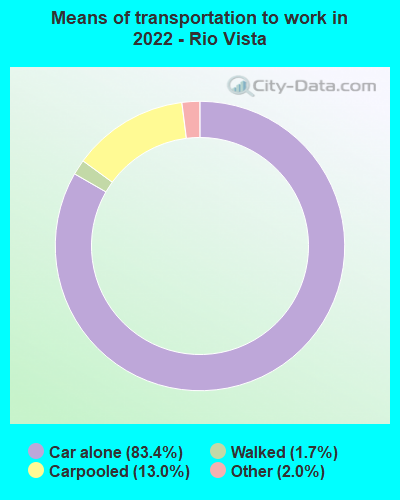
- 75.9%Utility gas
- 17.8%Electricity
- 5.1%Solar energy
- 0.7%No fuel used
- 0.6%Wood
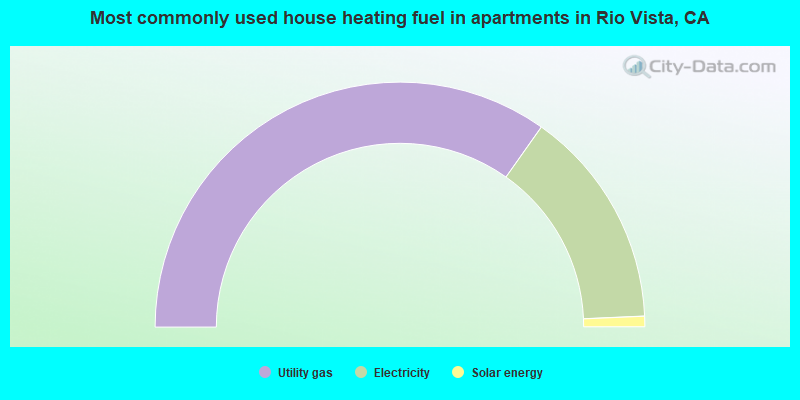
- 69.6%Utility gas
- 29.0%Electricity
- 1.4%Solar energy
Rio Vista compared to California state average:
- Unemployed percentage significantly below state average.
- Black race population percentage significantly above state average.
- Median age significantly above state average.
- Renting percentage below state average.
- House age below state average.
Rio Vista on our top lists:
- #14 on the list of "Top 101 cities with largest percentage of females in industries: utilities (population 5,000+)"
- #24 on the list of "Top 101 cities with largest percentage of females in occupations: management occupations (population 5,000+)"
- #63 on the list of "Top 100 cities with oldest residents (pop. 5,000+)"
- #86 (94571) on the list of "Top 101 zip codes with the smallest percentage of returns reporting salary or wage in 2012 (pop 5,000+)"
- #1 on the list of "Top 101 counties with the largest increase in the number of infant deaths per 1000 residents 2000-2006 to 2007-2013 (pop. 50,000+)"
- #21 on the list of "Top 101 counties with the highest Nitrogen Dioxide air pollution readings in 2012 (ppm)"
- #31 on the list of "Top 101 counties with the lowest Particulate Matter (PM10) Annual air pollution readings in 2012 (µg/m3)"
- #36 on the list of "Top 101 counties with the highest carbon monoxide air pollution readings in 2012 (ppm)"
- #78 on the list of "Top 101 counties with the highest percentage of residents relocating to foreign countries in 2011 (pop. 50,000+)"

|
|
Total of 32 patent applications in 2008-2024.