Estimated zip code population in 2022: 20,662 Zip code population in 2010: 20,384 Zip code population in 2000: 17,778
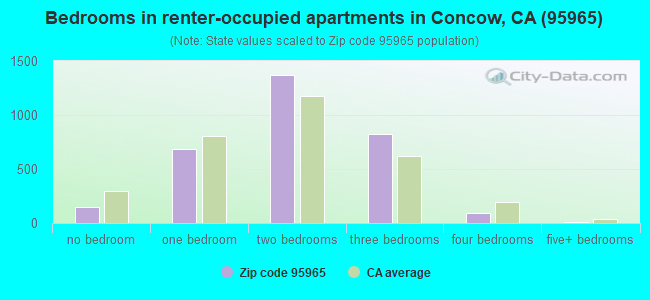
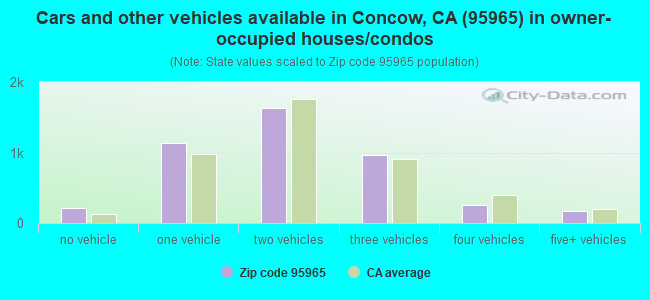
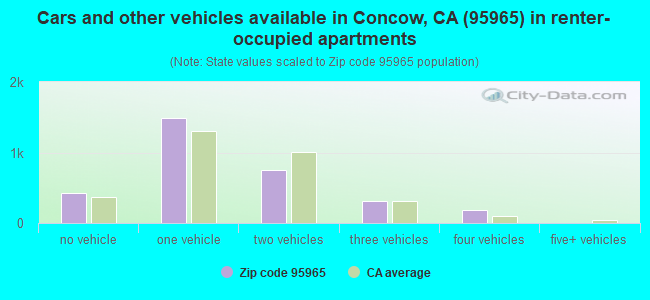
Houses and condos: 8,270 Renter-occupied apartments: 3,150
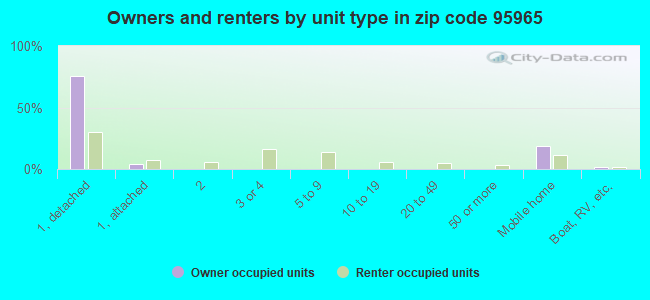
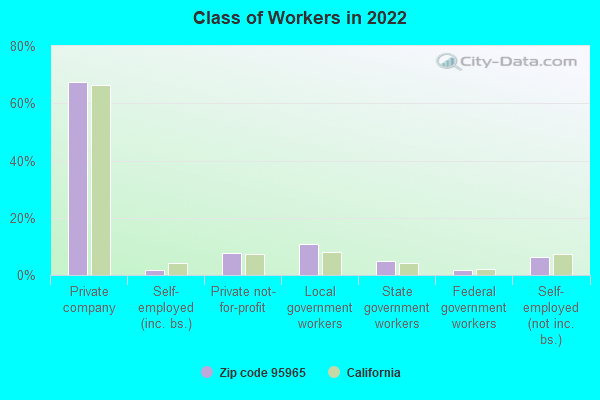
% of renters here:
42%
State:
44%
March 2022 cost of living index in zip code 95965: 95.6 (near average, U.S. average is 100)
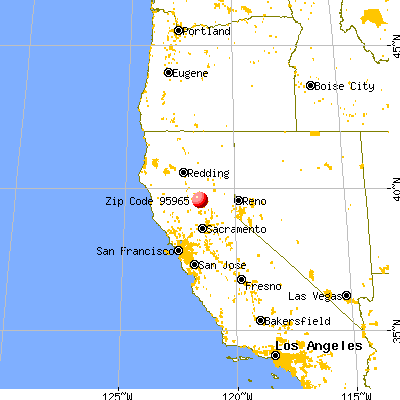
Land area: 320.2 sq. mi. Water area: 16.4 sq. mi.
Population density: 65 people per square mile
(very low).
OSM Map
General Map
Google Map
MSN Map
OSM Map
General Map
Google Map
MSN Map
OSM Map
General Map
Google Map
MSN Map
OSM Map
General Map
Google Map
MSN Map
Please wait while loading the map...
Real estate property taxes paid for housing units in 2022:
This zip code:
0.7% ($1,959)
California:
0.7% ($4,831)
Median real estate property taxes paid for housing units with mortgages in 2022: $2,051 (0.7%) Median real estate property taxes paid for housing units with no mortgage in 2022: $1,794 (0.7%)
Averages for the 2020 tax year for zip code 95965, filed in 2021:
Average Adjusted Gross Income (AGI) in 2020: $45,994 (Individual Income Tax Returns)
Here:
$45,994
State:
$95,910
Salary/wage: $40,092 (reported on 80.6% of returns)
Here:
$40,092
State:
$77,331
(% of AGI for various income ranges: 1149.7% for AGIs below $25k, 3572.2% for AGIs $25k-50k, 6403.8% for AGIs $50k-75k, 10280.3% for AGIs $75k-100k, 17527.1% for AGIs $100k-200k, 70043.3% for AGIs over 200k)
Taxable interest for individuals: $1,315 (reported on 25.3% of returns)
This zip code:
$1,315
California:
$2,294
(% of AGI for various income ranges: 9.7% for AGIs below $25k, 8.9% for AGIs $25k-50k, 27.2% for AGIs $50k-75k, 92.9% for AGIs $75k-100k, 229.4% for AGIs $100k-200k, 3430.0% for AGIs over 200k)
Ordinary dividends: $4,091 (reported on 8.4% of returns)
Here:
$4,091
State:
$10,949
(% of AGI for various income ranges: 13.7% for AGIs below $25k, 16.5% for AGIs $25k-50k, 41.3% for AGIs $50k-75k, 147.9% for AGIs $75k-100k, 223.8% for AGIs $100k-200k, 1926.7% for AGIs over 200k)
Net capital gain/loss in AGI: +$18,139 (reported on 9.1% of returns)
Here:
+$18,139
State:
+$49,306
(% of AGI for various income ranges: 5.2% for AGIs below $25k, 10.7% for AGIs $25k-50k, 57.9% for AGIs $50k-75k, 151.5% for AGIs $75k-100k, 500.0% for AGIs $100k-200k, 35313.3% for AGIs over 200k)
Profit/loss from business: +$13,668 (reported on 10.9% of returns)
Here:
+$13,668
State:
+$15,671
(% of AGI for various income ranges: 86.0% for AGIs below $25k, 96.6% for AGIs $25k-50k, 240.6% for AGIs $50k-75k, 296.5% for AGIs $75k-100k, 720.0% for AGIs $100k-200k, 9906.7% for AGIs over 200k)
Taxable individual retirement arrangement distribution: $17,566 (reported on 4.2% of returns)
95965:
$17,566
California:
$23,505
(% of AGI for various income ranges: 22.4% for AGIs below $25k, 30.7% for AGIs $25k-50k, 129.5% for AGIs $50k-75k, 239.7% for AGIs $75k-100k, 930.9% for AGIs $100k-200k)
Total itemized deductions: $33,449 (reported on 4.7% of returns)
Here:
$33,449
State:
$39,517
(% of AGI for various income ranges: 45.5% for AGIs below $25k, 57.6% for AGIs $25k-50k, 249.6% for AGIs $50k-75k, 572.4% for AGIs $75k-100k, 1200.9% for AGIs $100k-200k, 9400.0% for AGIs over 200k)
Charity contributions: $11,432 (reported on 3.0% of returns)
Here:
$11,432
State:
$12,598
(% of AGI for various income ranges: 8.6% for AGIs $25k-50k, 30.8% for AGIs $50k-75k, 102.6% for AGIs $75k-100k, 265.9% for AGIs $100k-200k, 3953.3% for AGIs over 200k)
Taxes paid: $7,426 (reported on 4.6% of returns)
95965:
$7,426
State:
$8,807
(% of AGI for various income ranges: 5.5% for AGIs below $25k, 10.5% for AGIs $25k-50k, 55.3% for AGIs $50k-75k, 135.9% for AGIs $75k-100k, 322.4% for AGIs $100k-200k, 1623.3% for AGIs over 200k)
Earned income credit: $2,245 (reported on 25.8% of returns)
Here:
$2,245
State:
$2,074
(% of AGI for various income ranges: 121.4% for AGIs below $25k, 94.4% for AGIs $25k-50k, 2.2% for AGIs $50k-75k)
Percentage of individuals using paid preparers for their 2020 taxes: 94.2%
Here:
94%
State:
92%
(% for various income ranges: 93.7% for AGIs below $25k, 95.1% for AGIs $25k-50k, 93.7% for AGIs $50k-75k, 92.7% for AGIs $75k-100k, 93.7% for AGIs $100k-200k, 100.0% for AGIs over 200k)
Averages for the 2012 tax year for zip code 95965, filed in 2013:
Average Adjusted Gross Income (AGI) in 2012: $37,034 (Individual Income Tax Returns)
Here:
$37,034
State:
$72,726
Salary/wage: $31,625 (reported on 80.4% of returns)
Here:
$31,625
State:
$59,079
(% of AGI for various income ranges: 72.4% for AGIs below $25k, 73.1% for AGIs $25k-50k, 68.4% for AGIs $50k-75k, 70.4% for AGIs $75k-100k, 68.7% for AGIs $100k-200k, 48.2% for AGIs over 200k)
Taxable interest for individuals: $1,374 (reported on 26.9% of returns)
This zip code:
$1,374
California:
$2,146
(% of AGI for various income ranges: 0.8% for AGIs below $25k, 0.6% for AGIs $25k-50k, 1.0% for AGIs $50k-75k, 1.3% for AGIs $75k-100k, 0.8% for AGIs $100k-200k, 2.1% for AGIs over 200k)
Ordinary dividends: $4,545 (reported on 9.7% of returns)
Here:
$4,545
State:
$9,308
(% of AGI for various income ranges: 0.6% for AGIs below $25k, 0.5% for AGIs $25k-50k, 1.0% for AGIs $50k-75k, 0.7% for AGIs $75k-100k, 1.1% for AGIs $100k-200k, 5.2% for AGIs over 200k)
Net capital gain/loss in AGI: +$9,343 (reported on 8.6% of returns)
Here:
+$9,343
State:
+$30,460
(% of AGI for various income ranges: 0.2% for AGIs $25k-50k, 0.3% for AGIs $50k-75k, 1.4% for AGIs $75k-100k, 0.9% for AGIs $100k-200k, 18.5% for AGIs over 200k)
Profit/loss from business: +$12,386 (reported on 12.6% of returns)
Here:
+$12,386
State:
+$17,064
(% of AGI for various income ranges: 5.9% for AGIs below $25k, 4.0% for AGIs $25k-50k, 3.4% for AGIs $50k-75k, 1.7% for AGIs $75k-100k, 8.2% for AGIs $100k-200k)
Taxable individual retirement arrangement distribution: $11,710 (reported on 7.3% of returns)
95965:
$11,710
California:
$19,557
(% of AGI for various income ranges: 1.7% for AGIs below $25k, 1.9% for AGIs $25k-50k, 2.6% for AGIs $50k-75k, 2.7% for AGIs $75k-100k, 4.2% for AGIs $100k-200k)
Self-employment retirement plans: $17,900 (reported on 0.3% of returns)
95965:
$17,900
California:
$24,530
Total itemized deductions: $21,151 (26% of AGI, reported on 21.4% of returns)
Here:
$21,151
State:
$34,004
Here:
26.4% of AGI
State:
22.7% of AGI
(% of AGI for various income ranges: 7.6% for AGIs below $25k, 8.6% for AGIs $25k-50k, 12.9% for AGIs $50k-75k, 14.6% for AGIs $75k-100k, 16.7% for AGIs $100k-200k, 17.6% for AGIs over 200k)
Charity contributions: $3,156 (reported on 14.6% of returns)
Here:
$3,156
State:
$4,659
(% of AGI for various income ranges: 0.4% for AGIs below $25k, 0.7% for AGIs $25k-50k, 1.3% for AGIs $50k-75k, 1.4% for AGIs $75k-100k, 1.6% for AGIs $100k-200k, 3.1% for AGIs over 200k)
Taxes paid: $6,381 (reported on 21.4% of returns)
95965:
$6,381
State:
$14,448
(% of AGI for various income ranges: 1.1% for AGIs below $25k, 1.7% for AGIs $25k-50k, 3.0% for AGIs $50k-75k, 4.3% for AGIs $75k-100k, 6.4% for AGIs $100k-200k, 9.1% for AGIs over 200k)
Earned income credit: $2,366 (reported on 32.9% of returns)
Here:
$2,366
State:
$2,286
(% of AGI for various income ranges: 9.4% for AGIs below $25k, 1.8% for AGIs $25k-50k)
Percentage of individuals using paid preparers for their 2012 taxes: 59.7%
Here:
60%
State:
64%
(% for various income ranges: 54.6% for AGIs below $25k, 61.8% for AGIs $25k-50k, 63.9% for AGIs $50k-75k, 72.5% for AGIs $75k-100k, 72.7% for AGIs $100k-200k, 85.7% for AGIs over 200k)
Averages for the 2004 tax year for zip code 95965, filed in 2005:
Average Adjusted Gross Income (AGI) in 2004: $31,690 (Individual Income Tax Returns)
Here:
$31,690
State:
$58,600
Salary/wage: $27,712 (reported on 81.3% of returns)
Here:
$27,712
State:
$49,455
(% of AGI for various income ranges: 166.6% for AGIs below $10k, 75.6% for AGIs $10k-25k, 75.4% for AGIs $25k-50k, 75.2% for AGIs $50k-75k, 69.8% for AGIs $75k-100k, 45.8% for AGIs over 100k)
Taxable interest for individuals: $1,471 (reported on 34.1% of returns)
This zip code:
$1,471
California:
$2,365
(% of AGI for various income ranges: 6.3% for AGIs below $10k, 1.8% for AGIs $10k-25k, 1.1% for AGIs $25k-50k, 1.1% for AGIs $50k-75k, 1.6% for AGIs $75k-100k, 2.2% for AGIs over 100k)
Taxable dividends: $1,966 (reported on 13.8% of returns)
Here:
$1,966
State:
$4,746
(% of AGI for various income ranges: 5.1% for AGIs below $10k, 0.9% for AGIs $10k-25k, 0.7% for AGIs $25k-50k, 0.5% for AGIs $50k-75k, 0.7% for AGIs $75k-100k, 1.3% for AGIs over 100k)
Net capital gain/loss: +$12,229 (reported on 12.8% of returns)
Here:
+$12,229
State:
+$23,418
(% of AGI for various income ranges: 9.5% for AGIs below $10k, 0.2% for AGIs $10k-25k, 1.2% for AGIs $25k-50k, 1.6% for AGIs $50k-75k, 4.6% for AGIs $75k-100k, 19.6% for AGIs over 100k)
Profit/loss from business: +$12,363 (reported on 15.1% of returns)
Here:
+$12,363
State:
+$16,826
(% of AGI for various income ranges: 10.3% for AGIs below $10k, 5.3% for AGIs $10k-25k, 3.8% for AGIs $25k-50k, 4.3% for AGIs $50k-75k, 4.7% for AGIs $75k-100k, 12.2% for AGIs over 100k)
IRA payment deduction: $3,099 (reported on 1.8% of returns)
95965:
$3,099
California:
$3,192
(% of AGI for various income ranges: 0.2% for AGIs $10k-25k, 0.3% for AGIs $25k-50k, 0.1% for AGIs $50k-75k, 0.3% for AGIs $75k-100k)
Self-employed pension: $16,481 (reported on 0.4% of returns)
Here:
$16,481
California:
$17,688
Total itemized deductions: $17,379 (27% of AGI, reported on 22.5% of returns)
Here:
$17,379
State:
$28,113
Here:
27.0% of AGI
State:
25.3% of AGI
(% of AGI for various income ranges: 19.7% for AGIs below $10k, 7.1% for AGIs $10k-25k, 10.7% for AGIs $25k-50k, 14.6% for AGIs $50k-75k, 16.2% for AGIs $75k-100k, 14.0% for AGIs over 100k)
Charity contributions deductions: $2,356 (3% of AGI, reported on 17.3% of returns)
Here:
$2,356
State:
$3,923
Here:
3.4% of AGI
State:
3.3% of AGI
(% of AGI for various income ranges: 0.6% for AGIs below $10k, 0.4% for AGIs $10k-25k, 1.1% for AGIs $25k-50k, 1.8% for AGIs $50k-75k, 1.8% for AGIs $75k-100k, 1.5% for AGIs over 100k)
Total tax: $4,315 (reported on 65.7% of returns)
95965:
$4,315
State:
$10,761
(% of AGI for various income ranges: 4.6% for AGIs below $10k, 3.6% for AGIs $10k-25k, 6.3% for AGIs $25k-50k, 8.5% for AGIs $50k-75k, 10.5% for AGIs $75k-100k, 18.4% for AGIs over 100k)
Earned income credit: $1,750 (reported on 26.8% of returns)
Here:
$1,750
State:
$1,763
Percentage of individuals using paid preparers for their 2004 taxes: 64.7%
Here:
65%
State:
66%
(% for various income ranges: 56.6% for AGIs below $10k, 64.5% for AGIs $10k-25k, 66.1% for AGIs $25k-50k, 72.3% for AGIs $50k-75k, 69.9% for AGIs $75k-100k, 81.9% for AGIs over 100k)
Likely homosexual households (counted as self-reported same-sex unmarried-partner households)
Lesbian couples: 0.3% of all households
Gay men: 0.6% of all households
Household received Food Stamps/SNAP in the past 12 months: 2,250 Household did not receive Food Stamps/SNAP in the past 12 months: 5,532
Women who had a birth in the past 12 months: 176 (123 now married, 53 unmarried) Women who did not have a birth in the past 12 months: 4,249 (1,148 now married, 3,122 unmarried)
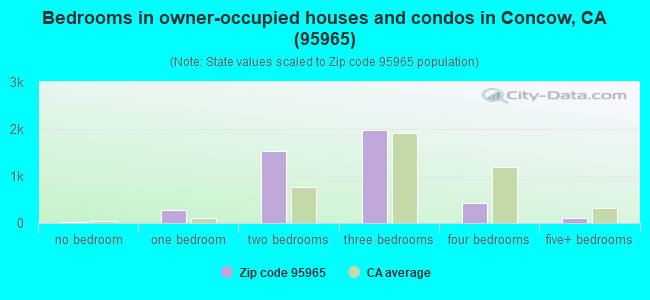
Housing units in zip code 95965 with a mortgage: 2,206 (138 second mortgage, 8 home equity loan, 75 both second mortgage and home equity loan) Houses without a mortgage: 34
Median monthly owner costs for units with a mortgage: $1,531 Median monthly owner costs for units without a mortgage: $594
Residents with income below the poverty level in 2022:
This zip code:
24.4%
Whole state:
12.2%
Residents with income below 50% of the poverty level in 2022:
This zip code:
14.4%
Whole state:
6.2%
Median number of rooms in houses and condos:
Here:
5.2
State:
6.0
Median number of rooms in apartments:
Here:
4.2
State:
3.9
Notable locations in this zip code not listed on our city pages
Notable locations in zip code 95965: Butte County Center (A), Shady Rest Area (B), Mill Creek Cal-Transit (C), The Pines (D), Cresta Powerhouse (E), Feather River Fish Hatchery (F), Thermalito Forebay South Boat Ramp (G), Saddle Creek Ranch (H), Crain Mill (I), Goat Ranch Campground (J), Pine Cluster Ranch (K), Mill Creek Cal-Transit Station (L), Camp Creek Powerhouse (M), Shady Rest Receration Area (N), Parish Camp (O), Table Mountain Municipal Golf Course (P), Spillway Boat Ramp (Q), Poe Powerhouse (R), Veterans Memorial Building (S), Oroville City Hall (T). Display/hide their locations on the map
Churches in zip code 95965 include: Church of Christ (A), Evangelical Free Church (B), First Congregational Church (C), First Methodist Church (D), Oroville Chinese Temple (E), Pentecostal Assembly of God Tabernacle (F), Saint Pauls Episcopal Church (G), Saint Thomas the Apostle Catholic Church (H), Seventh Day Adventist Church (I). Display/hide their locations on the map
Reservoirs: Thermalito Forebay (A), Thermalito Afterbay (B), Spring Valley Reservoir (C), Wilson Reservoir (D), Concow Reservoir (E), Tom Jones Reservoir (F), Lake Oroville (G), Morgan Reservoir (H). Display/hide their locations on the map
Streams, rivers, and creeks: Campbell Creek (A), Clear Creek (B), Cottonwood Creek (C), Dry Creek (D), Durham Slough (E), Fallager Creek (F), Gold Run (G), Nolton Creek (H), Stony Creek (I). Display/hide their locations on the map
Parks in zip code 95965 include: Bedrock Park (1), Nelson Park (2), Clay Pit State Vehicular Recreation Area (3), Rotary Park (4), Oroville Wildlife Area (5), Thermalito Forebay North Picnic Area (6), Lime Saddle Memorial Park (7), Crain Memorial Park (8), Bloomer Primitive Recreation Area (9). Display/hide their locations on the map
2,337 married couples with children.
1,713 single-parent households (431 men, 1,282 women).
76.5% of residents of 95965 zip code speak English at home.
9.8% of residents speak Spanish at home (67% very well, 24% well, 7% not well, 2% not at all).
2.2% of residents speak other Indo-European language at home (63% very well, 21% well, 5% not well, 11% not at all).
10.2% of residents speak Asian or Pacific Island language at home (55% very well, 23% well, 14% not well, 7% not at all).
0.7% of residents speak other language at home (100% very well).
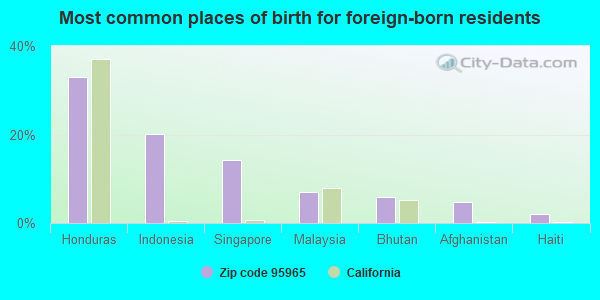
Foreign born population: 2,133 (10.3%) (64.6% of them are naturalized citizens)
This zip code:
10.3%
Whole state:
26.7%
33%Honduras
20%Indonesia
14%Singapore
7%Malaysia
6%Bhutan
5%Afghanistan
2%Haiti
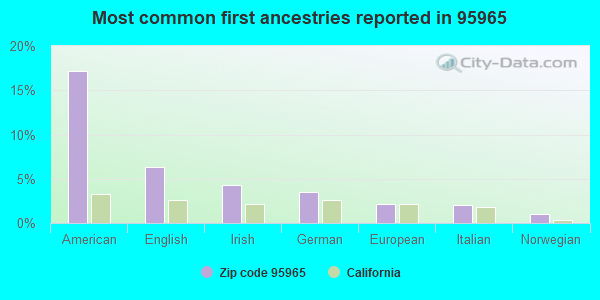
17%American
6%English
4%Irish
3%German
2%European
2%Italian
1%Norwegian
Year of entry for the foreign-born population
2952010 or later
4392000 to 2009
7211990 to 1999
772Before 1990
Major facilities with environmental interests located in this zip code:
KOPPERS INDUSTRIES INCORPORATED (5666 BAGGET MARYSVILLE ROAD in OROVILLE, CA)
SUPERFUND NPL (Superfund database) (Integrated Compliance Information System) - ICIS-09-1988-0020, FORMAL ENFORCEMENT ACTION COMPLIANCE ACTIVITY (Tracking inspections of insecticide, fungicide, and rodenticide, and toxic substances) CRITERIA AND HAZARDOUS AIR POLLUTANT INVENTORY (Inventory of air pollution sources) HAZARDOUS WASTE BIENNIAL REPORTER (Resource Conservation and Recovery Act (tracking hazardous waste)) Large Quantity Generators, more that 1000 kg of hazardous waste/month (Resource Conservation and Recovery Act (tracking hazardous waste)) - notification TSD (Resource Conservation and Recovery Act (tracking hazardous waste)) - notification TRI REPORTER (Tracking of toxic chemicals releasing facilities) Business SIC classification: WOOD PRESERVING; LUMBER AND OTHER BUILDING MATERIALS DEALERS Business NAICS classification: WOOD PRESERVATION. Organizations: BEAZER EAST INC (CONTACT/OPERATOR)
, KOPPERS INDUSTRIES, INC. (CONTACT/OWNER)
Alternative names: KOPPERS COMPANY, INC., KOPPERS CO., INC. (OROVILLE PLANT), KOPPERS IND INC FEATHER RIVER
NORTH STATE RENDERING CO. INC (15 SHIPPEE ROAD in OROVILLE, CA)
CRITERIA AND HAZARDOUS AIR POLLUTANT INVENTORY (Inventory of air pollution sources) National Pollutant Discharge Elimination System NON-MAJOR (Tracking pollutant discharge elimination systems) - permit STATE MASTER (California - Used Oil Recycling System ) - USED OIL RECYCLING Business SIC classification: GASOLINE SERVICE STATIONS
B AND S AUTOMOTIVE (2765 FEATHER RIVER BLVD in OROVILLE, CA)
STATE MASTER (California - Hazardous Waste Tracking) - HAZARDOU WASTE PROGRAM Small Quantity Generators, between 100 kg and 1000 kg of hazardous waste/month (Resource Conservation and Recovery Act (tracking hazardous waste)) - notification Business NAICS classification: GENERAL AUTOMOTIVE REPAIR. Organizations: STEVE GINTER (CONTACT/OWNER)
LOUISIANA-PACIFIC CORP OROVILLE SAWMILL (HWY 70 GEORGIA PACIFIC WAY in OROVILLE, CA)
SUPERFUND NPL (Superfund database) (Integrated Compliance Information System) - ICIS-09-1991-0036, FORMAL ENFORCEMENT ACTION, ICIS-09-1991-0037, Small Quantity Generators, between 100 kg and 1000 kg of hazardous waste/month (Resource Conservation and Recovery Act (tracking hazardous waste)) Business NAICS classification: SAWMILLS. Alternative names: GEORGIA PACIFIC, LOUISIANA-PACIFIC CORP.
5TH AVE BODY SHOP (2535 5TH AVE in OROVILLE, CA)
STATE MASTER (California - Hazardous Waste Tracking) - HAZARDOU WASTE PROGRAM Small Quantity Generators, between 100 kg and 1000 kg of hazardous waste/month (Resource Conservation and Recovery Act (tracking hazardous waste)) Business NAICS classification: AUTOMOTIVE BODY, PAINT, AND INTERIOR REPAIR AND MAINTENANCE. Alternative names: 5TH AVE BOSY SHOP
NELSON AVENUE MIDDLE (2255 6TH ST. in OROVILLE, CA)
(National Center for Education Statistics) - STATE ID-6003354 Organizations: THERMALITO UNION ELEMENTARY (SCHOOL DISTRICT)
GOLDEN FEATHER COMMUNITY DAY (2771 PENTZ RD. in OROVILLE, CA)
(National Center for Education Statistics) - STATE ID-6118244 Organizations: GOLDEN FEATHER UNION ELEMENTARY (SCHOOL DISTRICT)
HERITAGE COMMUNITY DAY SCHOOL (400 GRAND AVENUE in OROVILLE, CA)
(National Center for Education Statistics) - STATE ID-6121016 Organizations: THERMALITO UNION ELEMENTARY (SCHOOL DISTRICT)
JUVENILE HALL/COMMUNITY (2120B ROBINSON ST. in OROVILLE, CA)
(National Center for Education Statistics) - STATE ID-0430066 Organizations: BUTTE CO. OFFICE OF EDUCATION (SCHOOL DISTRICT)
LEARNING COMMUNITY CHARTER (1859 BIRD ST. in OROVILLE, CA)
(National Center for Education Statistics) - STATE ID-0430090 Organizations: BUTTE CO. OFFICE OF EDUCATION (SCHOOL DISTRICT)
CALIFORNIA WATER SERVICE COMPANY-SERVICE (1905 HIGH STREET in OROVILLE, CA)
(Integrated Compliance Information System) - ICIS-09-2004-0102, FORMAL ENFORCEMENT ACTION
MR. WIZZARD`S PC SHOP (2547 S. 7TH AVE. in OROVILLE, CA)
HAZARDOUS WASTE BIENNIAL REPORTER (Resource Conservation and Recovery Act (tracking hazardous waste)) Large Quantity Generators, more that 1000 kg of hazardous waste/month (Resource Conservation and Recovery Act (tracking hazardous waste)) Business NAICS classification: ELECTROPLATING, PLATING, POLISHING, ANODIZING, AND COLORING. Organizations: MARVIN ROSE (CONTACT/OWNER)
Alternative names: MR WIZZARD'S PRINTED CIRCUITS
CA DFG FEATHER RIVER HATCHERY (5 TABLE MOUNTAIN BLVD in OROVILLE, CA)
National Pollutant Discharge Elimination System NON-MAJOR (Tracking pollutant discharge elimination systems) - permit Business SIC classification: FISH HATCHERIES AND PRESERVES Organizations: CA DEPT OF FISH & GAME (CONTACT/OWNER)
Alternative names: CA DEPT OF FISH & GAME, FEATHER RIVER HATCHERY UST
Housing units lacking complete plumbing facilities: 1.6% Housing units lacking complete kitchen facilities: 1.6%
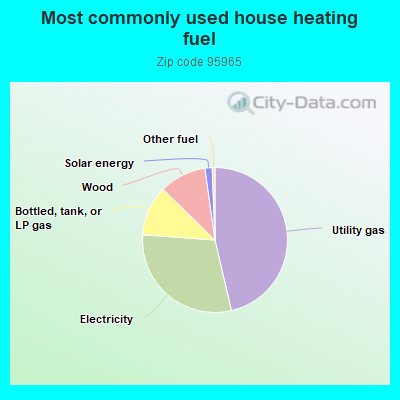
46.1%Utility gas
29.6%Electricity
11.1%Bottled, tank, or LP gas
10.4%Wood
1.6%Solar energy
0.6%Other fuel
Population in 1990: 16,712. Population change in the 1990s: +1,066 (+6.4%).
Place of birth for U.S.-born residents:
This state: 15,043
Northeast: 622
Midwest: 685
South: 791
West: 1,220
46% of the 95965 zip code residents lived in the same house 5 years ago. Out of people who lived in different houses, 63% lived in this county. Out of people who lived in different counties, 50% lived in California.
85% of the 95965 zip code residents lived in the same house 1 year ago. Out of people who lived in different houses, 70% moved from this county. Out of people who lived in different houses, 20% moved from different county within same state. Out of people who lived in different houses, 5% moved from different state. Out of people who lived in different houses, 1% moved from abroad.
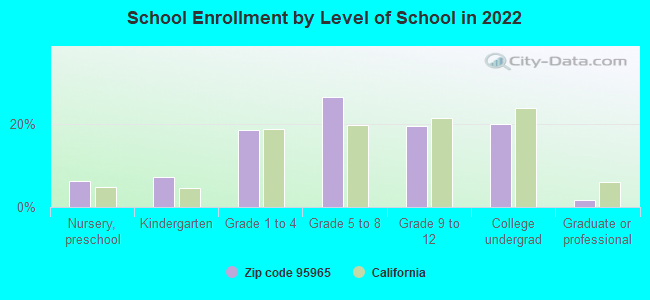
Private vs. public school enrollment:
Students in private schools in grades 1 to 8 (elementary and middle school): 225
Here:
11.2%
California:
10.5%
Students in private schools in grades 9 to 12 (high school): 21
Here:
2.5%
California:
8.5%
Students in private undergraduate colleges: 45
Here:
5.1%
California:
15.9%
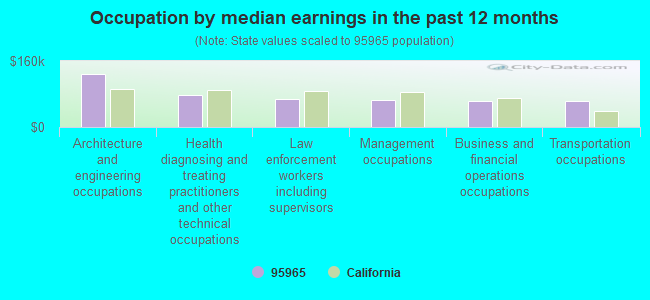
Occupation by median earnings in the past 12 months ($)
128,068Architecture and engineering occupations
77,154Health diagnosing and treating practitioners and other technical occupations
67,526Law enforcement workers including supervisors
65,640Management occupations
63,771Business and financial operations occupations
62,438Transportation occupations
Top industries in this zip code by the number of employees in 2005:
2003 - 2018 National Fire Incident Reporting System (NFIRS) incidents
Based on the data from the years 2003 - 2018 the average number of fires per year is 154. The highest number of reported fires - 327 took place in 2008, and the least - 2 in 2004. The data has a dropping trend.
When looking into fire subcategories, the most incidents belonged to: Outside Fires (53.2%), and Structure Fires (26.4%).
Fire incident types reported to NFIRS in Zip Code 95965


 Nearest zip codes: 95969, 95968, 95966, 95938, 95916, 95917.


 Based on the data from the years 2003 - 2018 the average number of fires per year is 154. The highest number of reported fires - 327 took place in 2008, and the least - 2 in 2004. The data has a dropping trend.
 When looking into fire subcategories, the most incidents belonged to: Outside Fires (53.2%), and Structure Fires (26.4%).