Estimated zip code population in 2022: 10,099 Zip code population in 2010: 9,297 Zip code population in 2000: 8,278
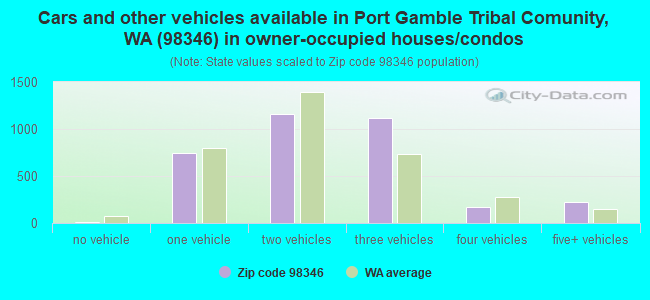
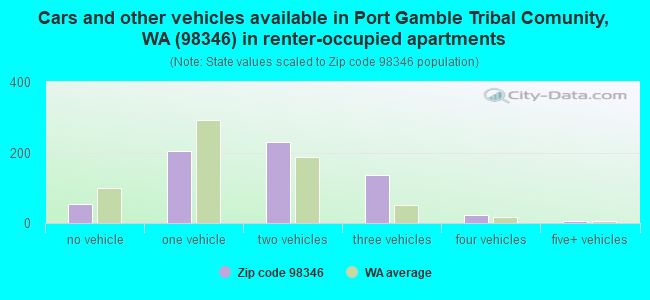
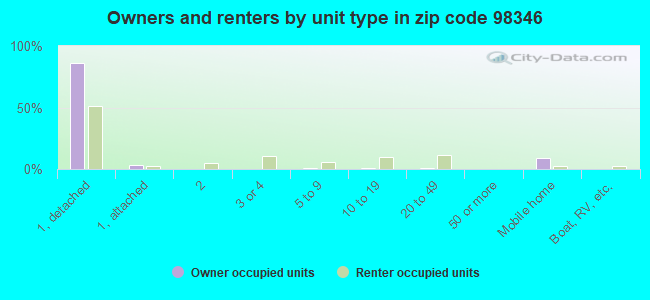
Houses and condos: 4,530 Renter-occupied apartments: 664
% of renters here:
16%
State:
36%
March 2022 cost of living index in zip code 98346: 107.7 (more than average, U.S. average is 100)
Land area: 27.6 sq. mi. Water area: 5.0 sq. mi.
Population density: 366 people per square mile
(very low).
OSM Map
General Map
Google Map
MSN Map
OSM Map
General Map
Google Map
MSN Map
OSM Map
General Map
Google Map
MSN Map
OSM Map
General Map
Google Map
MSN Map
Please wait while loading the map...
Real estate property taxes paid for housing units in 2022:
This zip code:
0.7% ($4,107)
Washington:
0.8% ($4,283)
Median real estate property taxes paid for housing units with mortgages in 2022: $3,667 (0.6%) Median real estate property taxes paid for housing units with no mortgage in 2022: $5,114 (0.8%)
Business Search- 14 Million verified businesses
Males: 4,790
(47.4%)
Females: 5,307
(52.6%)
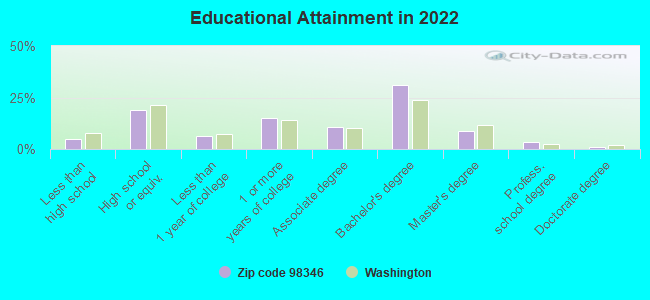
For population 25 years and over in 98346:
High school or higher: 95.0%
Bachelor's degree or higher: 44.2%
Graduate or professional degree: 13.3%
Unemployed: 3.3%
Mean travel time to work (commute): 33.4 minutes
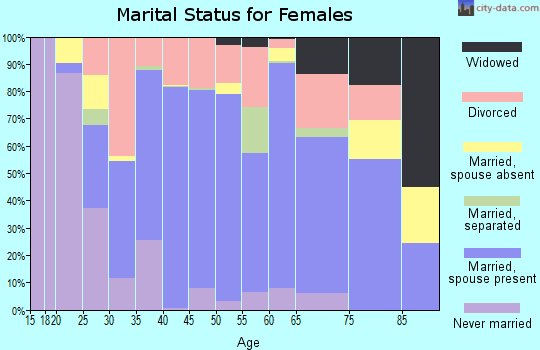
For population 15 years and over in 98346:
Never married: 20.0%
Now married: 61.1%
Separated: 1.1%
Widowed: 6.2%
Divorced: 11.7%
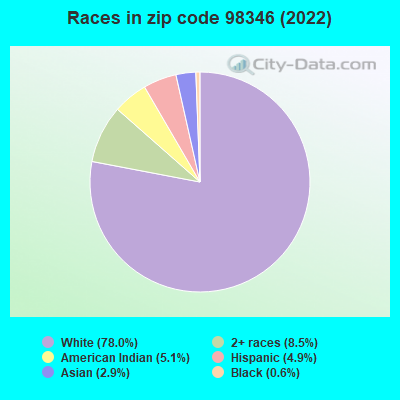
Zip code 98346 compared to state average:
Black race population percentage significantly below state average.
Hispanic race population percentage below state average.
Median age significantly above state average.
Foreign-born population percentage significantly below state average.
Renting percentage below state average.
Length of stay since moving in significantly above state average.
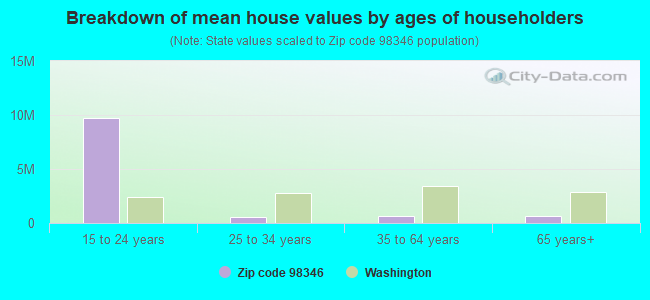
Estimated median house/condo value in 2022: $625,079
98346:
$625,079
Washington:
$569,500
According to our research of Washington and other state lists, there were 9 registered sex offenders living in 98346 zip code as of April 28, 2024. The ratio of all residents to sex offenders in zip code 98346 is 1,129 to 1. The ratio of registered sex offenders to all residents in this zip code is near the state average.
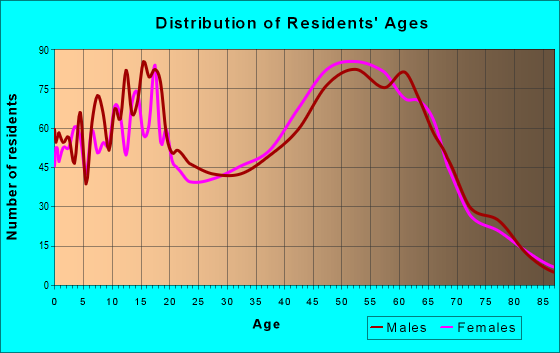
Median resident age:
This zip code:
50.6 years
Washington median age:
38.4 years
Average household size:
This zip code:
2.5 people
Washington:
2.5 people
Averages for the 2020 tax year for zip code 98346, filed in 2021:
Average Adjusted Gross Income (AGI) in 2020: $90,276 (Individual Income Tax Returns)
Here:
$90,276
State:
$99,264
Salary/wage: $73,938 (reported on 74.3% of returns)
Here:
$73,938
State:
$80,347
(% of AGI for various income ranges: 1067.6% for AGIs below $25k, 3151.1% for AGIs $25k-50k, 5811.3% for AGIs $50k-75k, 8219.0% for AGIs $75k-100k, 16949.5% for AGIs $100k-200k, 65600.0% for AGIs over 200k)
Taxable interest for individuals: $1,591 (reported on 41.1% of returns)
This zip code:
$1,591
Washington:
$2,077
(% of AGI for various income ranges: 21.6% for AGIs below $25k, 37.5% for AGIs $25k-50k, 47.2% for AGIs $50k-75k, 148.8% for AGIs $75k-100k, 184.7% for AGIs $100k-200k, 737.1% for AGIs over 200k)
Ordinary dividends: $7,345 (reported on 27.6% of returns)
Here:
$7,345
State:
$10,013
(% of AGI for various income ranges: 49.9% for AGIs below $25k, 86.4% for AGIs $25k-50k, 142.4% for AGIs $50k-75k, 215.5% for AGIs $75k-100k, 567.2% for AGIs $100k-200k, 3307.9% for AGIs over 200k)
Net capital gain/loss in AGI: +$25,573 (reported on 26.7% of returns)
Here:
+$25,573
State:
+$40,092
(% of AGI for various income ranges: 22.7% for AGIs below $25k, 39.8% for AGIs $25k-50k, 143.0% for AGIs $50k-75k, 339.2% for AGIs $75k-100k, 929.1% for AGIs $100k-200k, 19891.4% for AGIs over 200k)
Profit/loss from business: +$19,498 (reported on 16.2% of returns)
Here:
+$19,498
State:
+$18,312
(% of AGI for various income ranges: 109.7% for AGIs below $25k, 233.2% for AGIs $25k-50k, 411.3% for AGIs $50k-75k, 510.5% for AGIs $75k-100k, 638.8% for AGIs $100k-200k, 4119.3% for AGIs over 200k)
Taxable individual retirement arrangement distribution: $28,511 (reported on 12.0% of returns)
98346:
$28,511
Washington:
$24,221
(% of AGI for various income ranges: 74.2% for AGIs below $25k, 127.7% for AGIs $25k-50k, 295.9% for AGIs $50k-75k, 490.0% for AGIs $75k-100k, 1061.6% for AGIs $100k-200k, 4744.3% for AGIs over 200k)
Self-employed (Keogh) retirement plans: $16,620 (reported on 1.0% of returns)
98346:
$16,620
Washington:
$24,166
(% of AGI for various income ranges: 51.5% for AGIs $75k-100k, 446.4% for AGIs over 200k)
Total itemized deductions: $33,306 (reported on 12.8% of returns)
Here:
$33,306
State:
$39,068
(% of AGI for various income ranges: 68.5% for AGIs below $25k, 155.1% for AGIs $25k-50k, 510.0% for AGIs $50k-75k, 687.5% for AGIs $75k-100k, 1235.4% for AGIs $100k-200k, 5626.4% for AGIs over 200k)
Charity contributions: $7,018 (reported on 9.7% of returns)
Here:
$7,018
State:
$15,331
(% of AGI for various income ranges: 15.1% for AGIs $25k-50k, 55.4% for AGIs $50k-75k, 76.5% for AGIs $75k-100k, 173.3% for AGIs $100k-200k, 1327.9% for AGIs over 200k)
Taxes paid: $7,383 (reported on 12.6% of returns)
98346:
$7,383
State:
$7,774
(% of AGI for various income ranges: 20.3% for AGIs below $25k, 31.9% for AGIs $25k-50k, 101.3% for AGIs $50k-75k, 161.2% for AGIs $75k-100k, 297.9% for AGIs $100k-200k, 1100.0% for AGIs over 200k)
Earned income credit: $1,798 (reported on 9.0% of returns)
Here:
$1,798
State:
$2,020
(% of AGI for various income ranges: 51.7% for AGIs below $25k, 47.6% for AGIs $25k-50k)
Percentage of individuals using paid preparers for their 2020 taxes: 92.0%
Here:
92%
State:
93%
(% for various income ranges: 90.4% for AGIs below $25k, 91.7% for AGIs $25k-50k, 92.3% for AGIs $50k-75k, 93.4% for AGIs $75k-100k, 92.6% for AGIs $100k-200k, 93.2% for AGIs over 200k)
Averages for the 2012 tax year for zip code 98346, filed in 2013:
Average Adjusted Gross Income (AGI) in 2012: $68,213 (Individual Income Tax Returns)
Here:
$68,213
State:
$69,533
Salary/wage: $53,447 (reported on 78.8% of returns)
Here:
$53,447
State:
$57,267
(% of AGI for various income ranges: 70.7% for AGIs below $25k, 71.7% for AGIs $25k-50k, 69.1% for AGIs $50k-75k, 67.0% for AGIs $75k-100k, 70.0% for AGIs $100k-200k, 35.7% for AGIs over 200k)
Taxable interest for individuals: $1,624 (reported on 40.0% of returns)
This zip code:
$1,624
Washington:
$1,816
(% of AGI for various income ranges: 1.3% for AGIs below $25k, 0.7% for AGIs $25k-50k, 1.0% for AGIs $50k-75k, 0.9% for AGIs $75k-100k, 1.0% for AGIs $100k-200k, 0.9% for AGIs over 200k)
Ordinary dividends: $6,678 (reported on 24.6% of returns)
Here:
$6,678
State:
$8,163
(% of AGI for various income ranges: 2.7% for AGIs below $25k, 1.5% for AGIs $25k-50k, 2.2% for AGIs $50k-75k, 1.4% for AGIs $75k-100k, 2.0% for AGIs $100k-200k, 4.1% for AGIs over 200k)
Net capital gain/loss in AGI: +$11,903 (reported on 21.2% of returns)
Here:
+$11,903
State:
+$21,568
(% of AGI for various income ranges: 0.2% for AGIs $25k-50k, 0.8% for AGIs $50k-75k, 0.8% for AGIs $75k-100k, 1.6% for AGIs $100k-200k, 12.8% for AGIs over 200k)
Profit/loss from business: +$16,009 (reported on 17.0% of returns)
Here:
+$16,009
State:
+$16,521
(% of AGI for various income ranges: 9.8% for AGIs below $25k, 5.3% for AGIs $25k-50k, 3.5% for AGIs $50k-75k, 3.3% for AGIs $75k-100k, 4.6% for AGIs $100k-200k, 1.9% for AGIs over 200k)
Taxable individual retirement arrangement distribution: $20,648 (reported on 12.8% of returns)
98346:
$20,648
Washington:
$18,648
(% of AGI for various income ranges: 2.8% for AGIs below $25k, 2.4% for AGIs $25k-50k, 3.7% for AGIs $50k-75k, 4.2% for AGIs $75k-100k, 4.1% for AGIs $100k-200k, 4.6% for AGIs over 200k)
Self-employment retirement plans: $14,800 (reported on 0.7% of returns)
98346:
$14,800
Washington:
$20,087
Total itemized deductions: $22,246 (20% of AGI, reported on 40.7% of returns)
Here:
$22,246
State:
$23,872
Here:
19.8% of AGI
State:
18.2% of AGI
(% of AGI for various income ranges: 15.5% for AGIs below $25k, 14.0% for AGIs $25k-50k, 16.1% for AGIs $50k-75k, 14.4% for AGIs $75k-100k, 14.4% for AGIs $100k-200k, 8.6% for AGIs over 200k)
Charity contributions: $2,871 (reported on 32.5% of returns)
Here:
$2,871
State:
$4,465
(% of AGI for various income ranges: 0.6% for AGIs below $25k, 1.1% for AGIs $25k-50k, 1.5% for AGIs $50k-75k, 1.4% for AGIs $75k-100k, 1.6% for AGIs $100k-200k, 1.4% for AGIs over 200k)
Taxes paid: $6,219 (reported on 40.5% of returns)
98346:
$6,219
State:
$6,400
(% of AGI for various income ranges: 3.2% for AGIs below $25k, 3.3% for AGIs $25k-50k, 4.2% for AGIs $50k-75k, 3.8% for AGIs $75k-100k, 4.1% for AGIs $100k-200k, 3.1% for AGIs over 200k)
Earned income credit: $1,975 (reported on 13.9% of returns)
Here:
$1,975
State:
$2,073
(% of AGI for various income ranges: 5.2% for AGIs below $25k, 0.9% for AGIs $25k-50k)
Percentage of individuals using paid preparers for their 2012 taxes: 38.5%
Here:
38%
State:
43%
(% for various income ranges: 29.2% for AGIs below $25k, 36.4% for AGIs $25k-50k, 44.8% for AGIs $50k-75k, 42.6% for AGIs $75k-100k, 44.4% for AGIs $100k-200k, 68.8% for AGIs over 200k)
Averages for the 2004 tax year for zip code 98346, filed in 2005:
Average Adjusted Gross Income (AGI) in 2004: $54,245 (Individual Income Tax Returns)
Here:
$54,245
State:
$54,331
Salary/wage: $44,835 (reported on 80.8% of returns)
Here:
$44,835
State:
$45,761
(% of AGI for various income ranges: 128.9% for AGIs below $10k, 69.3% for AGIs $10k-25k, 76.9% for AGIs $25k-50k, 76.4% for AGIs $50k-75k, 75.5% for AGIs $75k-100k, 52.7% for AGIs over 100k)
Taxable interest for individuals: $2,161 (reported on 48.5% of returns)
This zip code:
$2,161
Washington:
$2,110
(% of AGI for various income ranges: 6.1% for AGIs below $10k, 2.4% for AGIs $10k-25k, 1.7% for AGIs $25k-50k, 1.3% for AGIs $50k-75k, 0.9% for AGIs $75k-100k, 2.6% for AGIs over 100k)
Taxable dividends: $4,502 (reported on 29.2% of returns)
Here:
$4,502
State:
$5,879
(% of AGI for various income ranges: 7.9% for AGIs below $10k, 3.1% for AGIs $10k-25k, 1.4% for AGIs $25k-50k, 2.0% for AGIs $50k-75k, 1.7% for AGIs $75k-100k, 3.1% for AGIs over 100k)
Net capital gain/loss: +$17,043 (reported on 24.0% of returns)
Here:
+$17,043
State:
+$15,835
(% of AGI for various income ranges: -2.1% for AGIs below $10k, 0.8% for AGIs $10k-25k, 0.3% for AGIs $25k-50k, 1.5% for AGIs $50k-75k, 1.9% for AGIs $75k-100k, 16.9% for AGIs over 100k)
Profit/loss from business: +$15,096 (reported on 18.5% of returns)
Here:
+$15,096
State:
+$13,994
(% of AGI for various income ranges: 2.7% for AGIs below $10k, 7.5% for AGIs $10k-25k, 4.5% for AGIs $25k-50k, 4.3% for AGIs $50k-75k, 4.6% for AGIs $75k-100k, 5.8% for AGIs over 100k)
IRA payment deduction: $3,016 (reported on 3.0% of returns)
98346:
$3,016
Washington:
$3,001
(% of AGI for various income ranges: 0.9% for AGIs below $10k, 0.3% for AGIs $25k-50k, 0.2% for AGIs $50k-75k, 0.2% for AGIs $75k-100k, 0.1% for AGIs over 100k)
Self-employed pension: $14,186 (reported on 1.4% of returns)
Here:
$14,186
Washington:
$14,244
(% of AGI for various income ranges: 0.3% for AGIs $50k-75k, 0.3% for AGIs $75k-100k, 0.6% for AGIs over 100k)
Total itemized deductions: $19,123 (22% of AGI, reported on 45.9% of returns)
Here:
$19,123
State:
$19,669
Here:
22.4% of AGI
State:
20.7% of AGI
(% of AGI for various income ranges: 28.3% for AGIs below $10k, 16.7% for AGIs $10k-25k, 16.9% for AGIs $25k-50k, 18.9% for AGIs $50k-75k, 18.0% for AGIs $75k-100k, 13.5% for AGIs over 100k)
Charity contributions deductions: $2,694 (3% of AGI, reported on 38.7% of returns)
Here:
$2,694
State:
$3,569
Here:
3.0% of AGI
State:
3.5% of AGI
(% of AGI for various income ranges: 1.5% for AGIs below $10k, 1.1% for AGIs $10k-25k, 1.2% for AGIs $25k-50k, 1.8% for AGIs $50k-75k, 2.0% for AGIs $75k-100k, 2.3% for AGIs over 100k)
Total tax: $8,125 (reported on 79.1% of returns)
98346:
$8,125
State:
$9,065
(% of AGI for various income ranges: 4.0% for AGIs below $10k, 4.6% for AGIs $10k-25k, 6.9% for AGIs $25k-50k, 8.4% for AGIs $50k-75k, 10.6% for AGIs $75k-100k, 17.4% for AGIs over 100k)
Earned income credit: $1,576 (reported on 11.1% of returns)
Here:
$1,576
State:
$1,607
Percentage of individuals using paid preparers for their 2004 taxes: 47.5%
Here:
47%
State:
49%
(% for various income ranges: 35.4% for AGIs below $10k, 47.5% for AGIs $10k-25k, 47.7% for AGIs $25k-50k, 51.6% for AGIs $50k-75k, 46.9% for AGIs $75k-100k, 58.9% for AGIs over 100k)
Household received Food Stamps/SNAP in the past 12 months: 280 Household did not receive Food Stamps/SNAP in the past 12 months: 3,816
Women who had a birth in the past 12 months: 89 (67 now married, 21 unmarried) Women who did not have a birth in the past 12 months: 2,016 (882 now married, 1,134 unmarried)
Housing units in zip code 98346 with a mortgage: 1,984 (141 second mortgage, 38 home equity loan, 97 both second mortgage and home equity loan) Houses without a mortgage: 123
Median monthly owner costs for units with a mortgage: $2,174 Median monthly owner costs for units without a mortgage: $711
Residents with income below the poverty level in 2022:
This zip code:
7.9%
Whole state:
10.0%
Residents with income below 50% of the poverty level in 2022:
This zip code:
2.8%
Whole state:
4.6%
Median number of rooms in houses and condos:
Here:
6.2
State:
6.5
Median number of rooms in apartments:
Here:
4.4
State:
3.9
Notable locations in this zip code not listed on our city pages
Notable locations in zip code 98346: Apple Cove Point Light (A), Kingston Grange (B), Hansville Landfill (C), Kingston Ferry Landing (D), George's Corners Park and Ride (E), White Horse Golf Club (F), Port of Kingston Marina (G), Kitsap County Kingston Wastewater Treatment Plant (H), Maple Tree Corner (I), Georges Corner (J), North Kitsap Fire and Rescue Station 85 South Kingston (K), Port Gamble S'Klallam Tribe Senior Center (L), Kingston Senior Community Center (M), North Kitsap Fire and Rescue Station (N), North Kitsap County Fire and Rescue Station 87 (O), Little Boston Library (P), Kingston Library (Q). Display/hide their locations on the map
Churches in zip code 98346 include: Kingston Christian Church (A), Bayside Community Church (B), Eglon Community Church (C), Faith Evangelical Lutheran Church (D), Kingston Missionary Church (E), Redeemer United Methodist Church (F), S'Klallam Worship Center (G), Unity Church (H). Display/hide their locations on the map
Creeks: Carpenter Creek (A), Crabapple Creek (B), Kingfisher Creek (C), Kingston Creek (D), Whisper Creek (E), Fukuzawa Creek (F), Newellhurst Creek (G), Osier Creek (H), Silver Creek (I). Display/hide their locations on the map
1,095 married couples with children.
257 single-parent households (35 men, 222 women).
94.8% of residents of 98346 zip code speak English at home.
1.6% of residents speak Spanish at home (66% very well, 14% well, 12% not well, 8% not at all).
2.3% of residents speak other Indo-European language at home (50% very well, 50% well).
1.1% of residents speak Asian or Pacific Island language at home (88% very well, 5% well, 6% not well).
0.2% of residents speak other language at home (74% very well, 26% well).
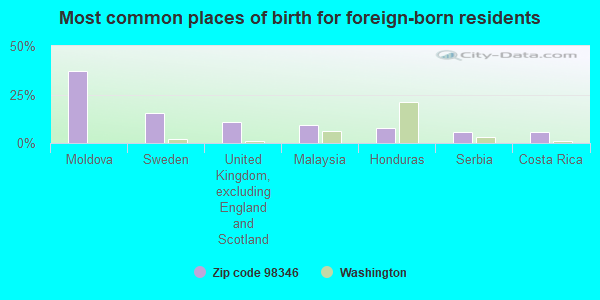
Foreign born population: 653 (6.5%) (48.4% of them are naturalized citizens)
This zip code:
6.5%
Whole state:
15.3%
37%Moldova
15%Sweden
11%United Kingdom, excluding England and Scotland
9%Malaysia
8%Honduras
6%Serbia
6%Costa Rica
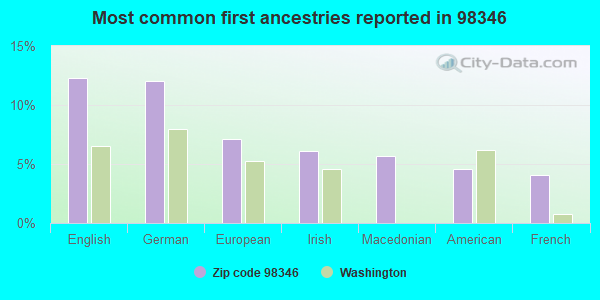
12%English
12%German
7%European
6%Irish
6%Macedonian
5%American
4%French
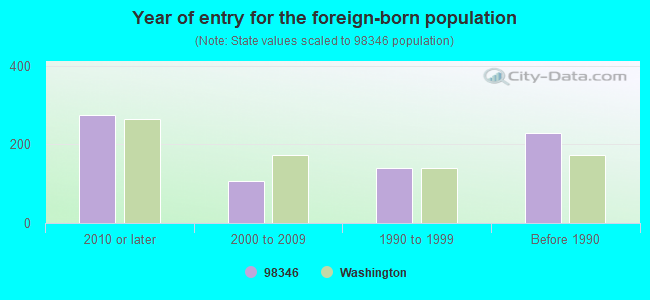
Year of entry for the foreign-born population
2752010 or later
1072000 to 2009
1411990 to 1999
228Before 1990
Facilities with environmental interests located in this zip code:
ALBERTSONS 0486 (8196 SR 104 in KINGSTON, WA)
Conditionally Exempt Small Quantity Generators, less than 100 kg/month of hazardous waste (Resource Conservation and Recovery Act (tracking hazardous waste)) STATE MASTER (Washington State Department of Ecology's Facility/Site identification system) - HAZWASTE-WAH000021862, SQG, TOXICS-516565, UNDERGROUND STORAGE TANK PROGRAM Business NAICS classification: SUPERMARKETS AND OTHER GROCERY (EXCEPT CONVENIENCE) STORES. Organizations: ALBERTSONS INC (CONTACT/OPERATOR)
Alternative names: ALBERTSONS 486, ALBERTSONS FOOD CENTER 486
Housing units lacking complete plumbing facilities: 0.9% Housing units lacking complete kitchen facilities: 1.0%
70.7%Electricity
16.1%Bottled, tank, or LP gas
9.5%Wood
2.4%Utility gas
0.8%Other fuel
Population in 1990: 5,507. Population change in the 1990s: +2,771 (+50.3%).
Place of birth for U.S.-born residents:
This state: 4,718
Northeast: 797
Midwest: 891
South: 816
West: 2,097
56% of the 98346 zip code residents lived in the same house 5 years ago. Out of people who lived in different houses, 50% lived in this county. Out of people who lived in different counties, 50% lived in Washington.
91% of the 98346 zip code residents lived in the same house 1 year ago. Out of people who lived in different houses, 43% moved from this county. Out of people who lived in different houses, 41% moved from different county within same state. Out of people who lived in different houses, 20% moved from different state.
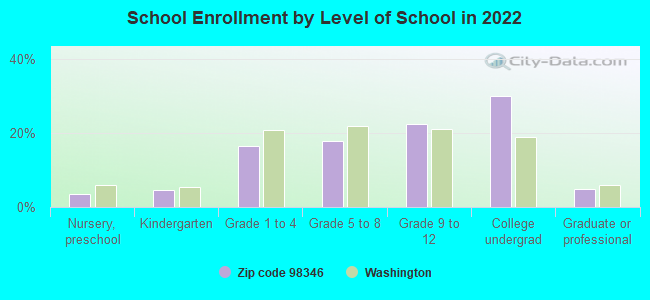
Private vs. public school enrollment:
Students in private schools in grades 1 to 8 (elementary and middle school): 28
Here:
4.2%
Washington:
12.4%
Students in private schools in grades 9 to 12 (high school): 105
Here:
23.6%
Washington:
9.2%
Students in private undergraduate colleges: 140
Here:
24.2%
Washington:
16.5%
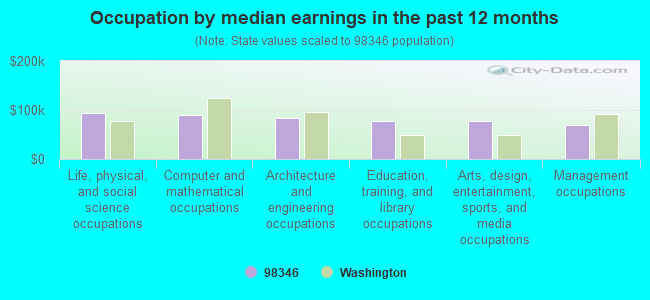
Occupation by median earnings in the past 12 months ($)
93,600Life, physical, and social science occupations
89,106Computer and mathematical occupations
83,389Architecture and engineering occupations
78,142Education, training, and library occupations
77,056Arts, design, entertainment, sports, and media occupations
68,876Management occupations
Companies with federal contracts located in this zip code:
EVENT TRANSPORTATION ASSOCIATE (26076 IOWA AVE in KINGSTON, WA; small business) : $3,051,300 in 2 contractsin 2001
$2,643,300 with Air Force for Maintenance, Repair and Rebuilding of Equipment -- Miscellaneous. Taking place in UT. Signed on 2001-12-07. Completion date: 2002-03-19.
$408,000, same as above.Signed on 2001-12-07. Completion date: 2002-03-04.
DIEHL ENGINEERING COMPANY INC (26076 IOWA ST STE A in KINGSTON, WA; small business) : $383,818 in 32 contractsfrom 2001 to 2006
Contracts for Non-nuclear Ship Repair (West) Ship repair (including overhauls and conversions) performed on. non-nuclear propelled and nonpropelled ships west of the 108th meridian, Engineering and Technical Services, Ship and Boat Propulsion Components by Navy, National Oceanic and Atmospheric Administration/Under Secretary for Oceans and Atmosphere, U.S. Coast Guard Signed by year:2000: $0; 2001: $41,147; 2002: $28,000; 2003: $3,772; 2004: $130,937; 2005: $153,008; 2006: $26,954.
Biggest contracts:
$34,251 with Navy for Non-nuclear Ship Repair (West) Ship repair (including overhauls and conversions) performed on. non-nuclear propelled and nonpropelled ships west of the 108th meridian. Signed on 2005-08-01. Completion date: 2005-07-26.
$32,347 with Navy for Engineering and Technical Services. Signed on 2001-08-16. Completion date: 2001-09-30.
$28,000 with Navy for Non-nuclear Ship Repair (West) Ship repair (including overhauls and conversions) performed on. non-nuclear propelled and nonpropelled ships west of the 108th meridian. Taking place in CA. Signed on 2002-11-22. Completion date: 2002-12-05.
$25,969 with Navy for Non-nuclear Ship Repair (West) Ship repair (including overhauls and conversions) performed on. non-nuclear propelled and nonpropelled ships west of the 108th meridian. Signed on 2004-06-14. Completion date: 2004-06-28.
PERFORMANCE SIGN PRODUCTS INC (26125 CALVARY LN NE SUITE in KINGSTON, WA; small business) : $16,887 in 3 contractsin 2005
$7,742 with Navy for Floor Coverings. Signed on 2005-06-07. Completion date: 2005-06-17.
$5,955 with Army for Office Supplies. Signed on 2005-09-07. Completion date: 2005-09-16.
$3,190 with Navy for Plastics Fabricated Materials. Signed on 2005-09-12. Completion date: 2005-09-26.
Top industries in this zip code by the number of employees in 2005:
Arts, Entertainment, and Recreation: Other Gambling Industries (100-249 employees: 1 establishment)
2003 - 2018 National Fire Incident Reporting System (NFIRS) incidents
According to the data from the years 2003 - 2018 the average number of fires per year is 31. The highest number of fire incidents - 65 took place in 2006, and the least - 2 in 2003. The data has a growing trend.
When looking into fire subcategories, the most incidents belonged to: Structure Fires (46.7%), and Outside Fires (34.8%).
Fire incident types reported to NFIRS in Zip Code 98346


 Nearest zip codes: 98342, 98364, 98392, 98340, 98370, 98020.


 According to the data from the years 2003 - 2018 the average number of fires per year is 31. The highest number of fire incidents - 65 took place in 2006, and the least - 2 in 2003. The data has a growing trend.
 When looking into fire subcategories, the most incidents belonged to: Structure Fires (46.7%), and Outside Fires (34.8%).