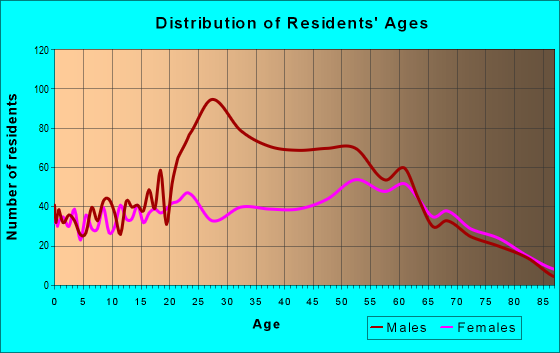
Estimated zip code population in 2022: 7,140 Zip code population in 2010: 7,508 Zip code population in 2000: 6,278
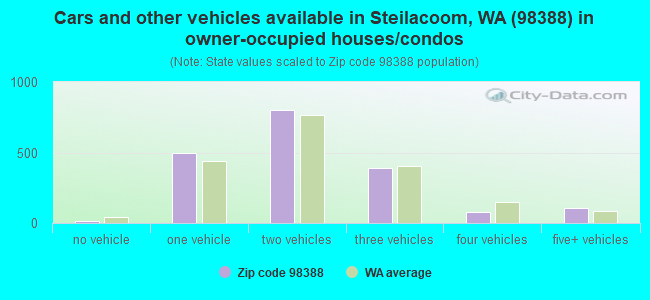
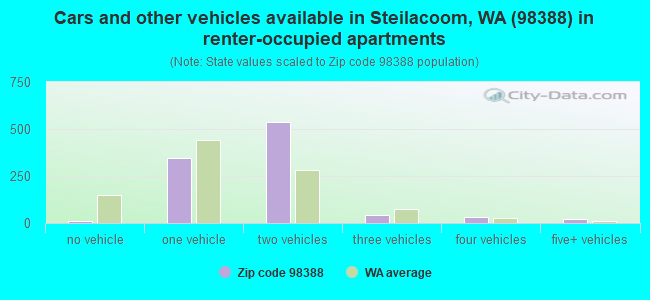
Houses and condos: 2,973 Renter-occupied apartments: 988
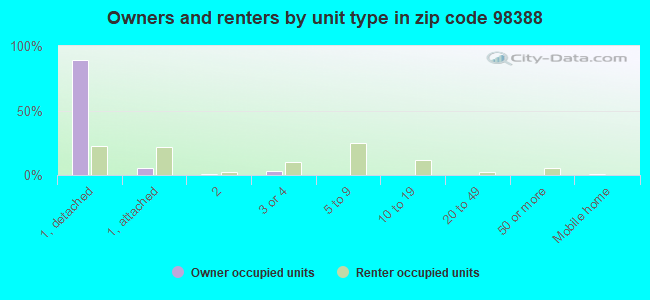
% of renters here:
34%
State:
36%
March 2022 cost of living index in zip code 98388: 110.8 (more than average, U.S. average is 100)
Land area: 8.9 sq. mi. Water area: 11.8 sq. mi.
Population density: 799 people per square mile
(low).
OSM Map
General Map
Google Map
MSN Map
OSM Map
General Map
Google Map
MSN Map
OSM Map
General Map
Google Map
MSN Map
OSM Map
General Map
Google Map
MSN Map
Please wait while loading the map...
Real estate property taxes paid for housing units in 2022:
This zip code:
0.7% ($4,711)
Washington:
0.8% ($4,283)
Median real estate property taxes paid for housing units with mortgages in 2022: $4,582 (0.7%) Median real estate property taxes paid for housing units with no mortgage in 2022: $4,986 (0.8%)
Averages for the 2020 tax year for zip code 98388, filed in 2021:
Average Adjusted Gross Income (AGI) in 2020: $90,123 (Individual Income Tax Returns)
Here:
$90,123
State:
$99,264
Salary/wage: $70,548 (reported on 76.4% of returns)
Here:
$70,548
State:
$80,347
(% of AGI for various income ranges: 1123.9% for AGIs below $25k, 3235.5% for AGIs $25k-50k, 5997.1% for AGIs $50k-75k, 8627.0% for AGIs $75k-100k, 15709.7% for AGIs $100k-200k, 56529.0% for AGIs over 200k)
Taxable interest for individuals: $1,867 (reported on 39.7% of returns)
This zip code:
$1,867
Washington:
$2,077
(% of AGI for various income ranges: 24.6% for AGIs below $25k, 22.5% for AGIs $25k-50k, 71.5% for AGIs $50k-75k, 58.7% for AGIs $75k-100k, 182.9% for AGIs $100k-200k, 1171.0% for AGIs over 200k)
Ordinary dividends: $8,453 (reported on 29.0% of returns)
Here:
$8,453
State:
$10,013
(% of AGI for various income ranges: 54.5% for AGIs below $25k, 58.0% for AGIs $25k-50k, 108.5% for AGIs $50k-75k, 269.6% for AGIs $75k-100k, 706.6% for AGIs $100k-200k, 4112.0% for AGIs over 200k)
Net capital gain/loss in AGI: +$19,203 (reported on 27.3% of returns)
Here:
+$19,203
State:
+$40,092
(% of AGI for various income ranges: 17.7% for AGIs below $25k, 37.2% for AGIs $25k-50k, 138.5% for AGIs $50k-75k, 189.1% for AGIs $75k-100k, 955.0% for AGIs $100k-200k, 13274.0% for AGIs over 200k)
Profit/loss from business: +$22,367 (reported on 12.4% of returns)
Here:
+$22,367
State:
+$18,312
(% of AGI for various income ranges: 65.2% for AGIs below $25k, 114.5% for AGIs $25k-50k, 14.1% for AGIs $50k-75k, 153.0% for AGIs $75k-100k, 674.5% for AGIs $100k-200k, 5547.0% for AGIs over 200k)
Taxable individual retirement arrangement distribution: $26,898 (reported on 11.5% of returns)
98388:
$26,898
Washington:
$24,221
(% of AGI for various income ranges: 52.9% for AGIs below $25k, 69.7% for AGIs $25k-50k, 182.4% for AGIs $50k-75k, 408.3% for AGIs $75k-100k, 998.2% for AGIs $100k-200k, 4537.0% for AGIs over 200k)
Self-employed (Keogh) retirement plans: $22,750 (reported on 0.6% of returns)
98388:
$22,750
Washington:
$24,166
(% of AGI for various income ranges: 119.7% for AGIs $100k-200k)
Total itemized deductions: $34,766 (reported on 14.4% of returns)
Here:
$34,766
State:
$39,068
(% of AGI for various income ranges: 106.1% for AGIs below $25k, 127.3% for AGIs $25k-50k, 293.2% for AGIs $50k-75k, 549.6% for AGIs $75k-100k, 1737.9% for AGIs $100k-200k, 6904.0% for AGIs over 200k)
Charity contributions: $11,465 (reported on 11.5% of returns)
Here:
$11,465
State:
$15,331
(% of AGI for various income ranges: 19.7% for AGIs $25k-50k, 34.9% for AGIs $50k-75k, 79.6% for AGIs $75k-100k, 434.2% for AGIs $100k-200k, 2484.0% for AGIs over 200k)
Taxes paid: $8,228 (reported on 14.4% of returns)
98388:
$8,228
State:
$7,774
(% of AGI for various income ranges: 21.8% for AGIs below $25k, 32.2% for AGIs $25k-50k, 82.9% for AGIs $50k-75k, 172.2% for AGIs $75k-100k, 423.2% for AGIs $100k-200k, 1442.0% for AGIs over 200k)
Earned income credit: $2,107 (reported on 8.6% of returns)
Here:
$2,107
State:
$2,020
(% of AGI for various income ranges: 65.0% for AGIs below $25k, 41.9% for AGIs $25k-50k)
Percentage of individuals using paid preparers for their 2020 taxes: 91.7%
Here:
92%
State:
93%
(% for various income ranges: 89.5% for AGIs below $25k, 92.3% for AGIs $25k-50k, 92.9% for AGIs $50k-75k, 91.4% for AGIs $75k-100k, 91.5% for AGIs $100k-200k, 93.8% for AGIs over 200k)
Averages for the 2012 tax year for zip code 98388, filed in 2013:
Average Adjusted Gross Income (AGI) in 2012: $69,553 (Individual Income Tax Returns)
Here:
$69,553
State:
$69,533
Salary/wage: $54,262 (reported on 78.7% of returns)
Here:
$54,262
State:
$57,267
(% of AGI for various income ranges: 74.8% for AGIs below $25k, 73.5% for AGIs $25k-50k, 68.7% for AGIs $50k-75k, 62.1% for AGIs $75k-100k, 60.2% for AGIs $100k-200k, 50.0% for AGIs over 200k)
Taxable interest for individuals: $1,421 (reported on 43.3% of returns)
This zip code:
$1,421
Washington:
$1,816
(% of AGI for various income ranges: 1.5% for AGIs below $25k, 0.8% for AGIs $25k-50k, 0.6% for AGIs $50k-75k, 0.9% for AGIs $75k-100k, 0.7% for AGIs $100k-200k, 1.2% for AGIs over 200k)
Ordinary dividends: $5,204 (reported on 28.3% of returns)
Here:
$5,204
State:
$8,163
(% of AGI for various income ranges: 1.6% for AGIs below $25k, 1.5% for AGIs $25k-50k, 1.3% for AGIs $50k-75k, 1.8% for AGIs $75k-100k, 2.8% for AGIs $100k-200k, 2.2% for AGIs over 200k)
Net capital gain/loss in AGI: +$8,578 (reported on 20.1% of returns)
Here:
+$8,578
State:
+$21,568
(% of AGI for various income ranges: 2.2% for AGIs $25k-50k, 0.7% for AGIs $75k-100k, 1.7% for AGIs $100k-200k, 7.4% for AGIs over 200k)
Profit/loss from business: +$15,095 (reported on 12.4% of returns)
Here:
+$15,095
State:
+$16,521
(% of AGI for various income ranges: 3.6% for AGIs below $25k, 1.2% for AGIs $25k-50k, 2.6% for AGIs $50k-75k, 2.2% for AGIs $75k-100k, 2.5% for AGIs $100k-200k, 3.7% for AGIs over 200k)
Taxable individual retirement arrangement distribution: $18,321 (reported on 13.4% of returns)
98388:
$18,321
Washington:
$18,648
(% of AGI for various income ranges: 2.1% for AGIs below $25k, 2.8% for AGIs $25k-50k, 1.9% for AGIs $50k-75k, 3.2% for AGIs $75k-100k, 4.7% for AGIs $100k-200k, 3.7% for AGIs over 200k)
Self-employment retirement plans: $20,050 (reported on 0.6% of returns)
98388:
$20,050
Washington:
$20,087
(% of AGI for various income ranges: 0.6% for AGIs $100k-200k)
Total itemized deductions: $23,559 (20% of AGI, reported on 37.9% of returns)
Here:
$23,559
State:
$23,872
Here:
19.6% of AGI
State:
18.2% of AGI
(% of AGI for various income ranges: 14.6% for AGIs below $25k, 11.0% for AGIs $25k-50k, 13.7% for AGIs $50k-75k, 14.2% for AGIs $75k-100k, 14.4% for AGIs $100k-200k, 10.2% for AGIs over 200k)
Charity contributions: $4,581 (reported on 32.2% of returns)
Here:
$4,581
State:
$4,465
(% of AGI for various income ranges: 0.9% for AGIs below $25k, 1.2% for AGIs $25k-50k, 1.7% for AGIs $50k-75k, 1.8% for AGIs $75k-100k, 2.6% for AGIs $100k-200k, 2.6% for AGIs over 200k)
Taxes paid: $6,834 (reported on 37.9% of returns)
98388:
$6,834
State:
$6,400
(% of AGI for various income ranges: 3.1% for AGIs below $25k, 2.7% for AGIs $25k-50k, 3.6% for AGIs $50k-75k, 4.1% for AGIs $75k-100k, 4.5% for AGIs $100k-200k, 3.2% for AGIs over 200k)
Earned income credit: $2,009 (reported on 13.7% of returns)
Here:
$2,009
State:
$2,073
(% of AGI for various income ranges: 5.1% for AGIs below $25k, 0.9% for AGIs $25k-50k)
Percentage of individuals using paid preparers for their 2012 taxes: 43.9%
Here:
44%
State:
43%
(% for various income ranges: 35.7% for AGIs below $25k, 40.8% for AGIs $25k-50k, 45.8% for AGIs $50k-75k, 50.0% for AGIs $75k-100k, 52.9% for AGIs $100k-200k, 62.5% for AGIs over 200k)
Averages for the 2004 tax year for zip code 98388, filed in 2005:
Average Adjusted Gross Income (AGI) in 2004: $57,112 (Individual Income Tax Returns)
Here:
$57,112
State:
$54,331
Salary/wage: $47,261 (reported on 81.6% of returns)
Here:
$47,261
State:
$45,761
(% of AGI for various income ranges: 118.0% for AGIs below $10k, 72.7% for AGIs $10k-25k, 76.8% for AGIs $25k-50k, 69.8% for AGIs $50k-75k, 68.5% for AGIs $75k-100k, 61.2% for AGIs over 100k)
Taxable interest for individuals: $1,701 (reported on 50.4% of returns)
This zip code:
$1,701
Washington:
$2,110
(% of AGI for various income ranges: 4.1% for AGIs below $10k, 2.0% for AGIs $10k-25k, 1.4% for AGIs $25k-50k, 1.5% for AGIs $50k-75k, 1.4% for AGIs $75k-100k, 1.4% for AGIs over 100k)
Taxable dividends: $4,039 (reported on 32.0% of returns)
Here:
$4,039
State:
$5,879
(% of AGI for various income ranges: 3.3% for AGIs below $10k, 1.8% for AGIs $10k-25k, 1.2% for AGIs $25k-50k, 1.8% for AGIs $50k-75k, 2.1% for AGIs $75k-100k, 2.9% for AGIs over 100k)
Net capital gain/loss: +$7,598 (reported on 27.1% of returns)
Here:
+$7,598
State:
+$15,835
(% of AGI for various income ranges: -1.1% for AGIs below $10k, 0.4% for AGIs $10k-25k, 0.1% for AGIs $25k-50k, 0.6% for AGIs $50k-75k, 0.6% for AGIs $75k-100k, 7.4% for AGIs over 100k)
Profit/loss from business: +$19,017 (reported on 12.0% of returns)
Here:
+$19,017
State:
+$13,994
(% of AGI for various income ranges: 4.8% for AGIs below $10k, 3.3% for AGIs $10k-25k, 1.2% for AGIs $25k-50k, 2.6% for AGIs $50k-75k, 1.6% for AGIs $75k-100k, 6.3% for AGIs over 100k)
IRA payment deduction: $2,810 (reported on 2.8% of returns)
98388:
$2,810
Washington:
$3,001
(% of AGI for various income ranges: 0.3% for AGIs $10k-25k, 0.2% for AGIs $25k-50k, 0.3% for AGIs $50k-75k, 0.1% for AGIs over 100k)
Self-employed pension: $16,385 (reported on 1.3% of returns)
Here:
$16,385
Washington:
$14,244
Total itemized deductions: $19,511 (20% of AGI, reported on 38.9% of returns)
Here:
$19,511
State:
$19,669
Here:
19.9% of AGI
State:
20.7% of AGI
(% of AGI for various income ranges: 15.4% for AGIs below $10k, 8.3% for AGIs $10k-25k, 12.6% for AGIs $25k-50k, 16.5% for AGIs $50k-75k, 15.3% for AGIs $75k-100k, 12.4% for AGIs over 100k)
Charity contributions deductions: $3,932 (4% of AGI, reported on 34.9% of returns)
Here:
$3,932
State:
$3,569
Here:
3.8% of AGI
State:
3.5% of AGI
(% of AGI for various income ranges: 1.1% for AGIs below $10k, 0.7% for AGIs $10k-25k, 1.5% for AGIs $25k-50k, 2.2% for AGIs $50k-75k, 2.4% for AGIs $75k-100k, 3.1% for AGIs over 100k)
Total tax: $9,339 (reported on 79.9% of returns)
98388:
$9,339
State:
$9,065
(% of AGI for various income ranges: 1.9% for AGIs below $10k, 4.2% for AGIs $10k-25k, 7.0% for AGIs $25k-50k, 8.9% for AGIs $50k-75k, 11.3% for AGIs $75k-100k, 18.7% for AGIs over 100k)
Earned income credit: $1,482 (reported on 10.3% of returns)
Here:
$1,482
State:
$1,607
Percentage of individuals using paid preparers for their 2004 taxes: 50.6%
Here:
51%
State:
49%
(% for various income ranges: 45.7% for AGIs below $10k, 48.1% for AGIs $10k-25k, 51.3% for AGIs $25k-50k, 52.5% for AGIs $50k-75k, 51.3% for AGIs $75k-100k, 56.2% for AGIs over 100k)
Likely homosexual households (counted as self-reported same-sex unmarried-partner households)
Lesbian couples: 0.7% of all households
Gay men: 0.0% of all households
Household received Food Stamps/SNAP in the past 12 months: 304 Household did not receive Food Stamps/SNAP in the past 12 months: 2,566
Women who had a birth in the past 12 months: 169 (153 now married, 18 unmarried) Women who did not have a birth in the past 12 months: 1,283 (702 now married, 577 unmarried)
Housing units in zip code 98388 with a mortgage: 1,193 (71 second mortgage, 10 home equity loan, 50 both second mortgage and home equity loan) Houses without a mortgage: 13
Median monthly owner costs for units with a mortgage: $2,379 Median monthly owner costs for units without a mortgage: $795
Residents with income below the poverty level in 2022:
This zip code:
13.3%
Whole state:
10.0%
Residents with income below 50% of the poverty level in 2022:
This zip code:
2.9%
Whole state:
4.6%
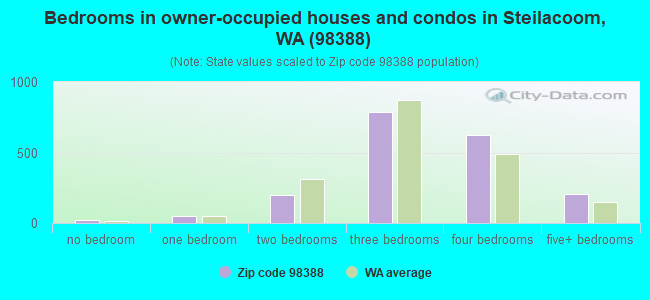
Median number of rooms in houses and condos:
Here:
7.2
State:
6.5
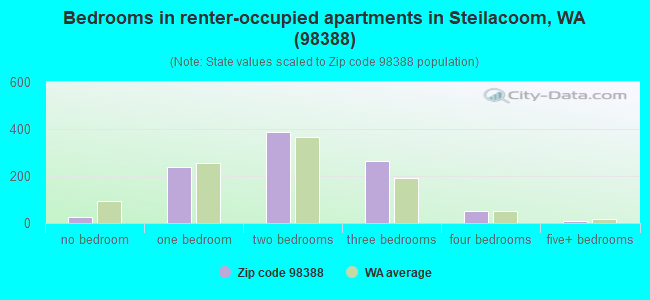
Median number of rooms in apartments:
Here:
4.5
State:
3.9
Notable locations in this zip code not listed on our city pages
Reservoirs: Butterworth Reservoir (A), Luhr Creek Reservoir (B), Prison Farm Sewage Lagoon (C), Anderson Pond (D), Eden Creek Reservoir (E), Floyd Cove Reservoir (F). Display/hide their locations on the map
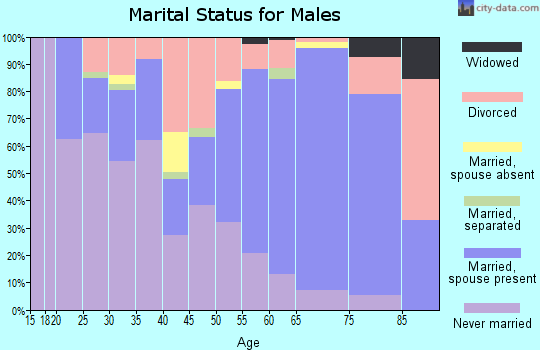
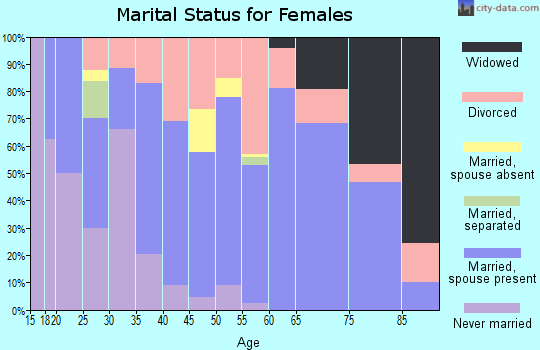
892 married couples with children.
310 single-parent households (89 men, 221 women).
87.0% of residents of 98388 zip code speak English at home.
3.7% of residents speak Spanish at home (78% very well, 22% well).
3.1% of residents speak other Indo-European language at home (98% very well, 2% well).
4.9% of residents speak Asian or Pacific Island language at home (66% very well, 14% well, 13% not well, 8% not at all).
1.2% of residents speak other language at home (45% very well, 36% well, 19% not well).
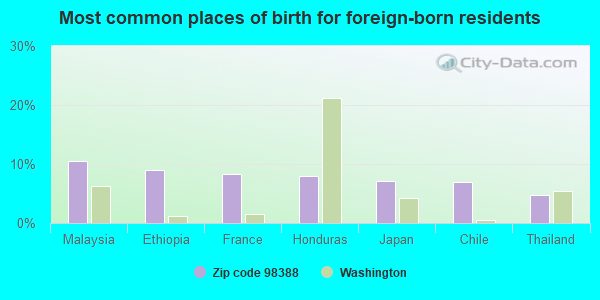
Foreign born population: 738 (10.3%) (63.1% of them are naturalized citizens)
This zip code:
10.3%
Whole state:
15.3%
10%Malaysia
9%Ethiopia
8%France
8%Honduras
7%Japan
7%Chile
5%Thailand
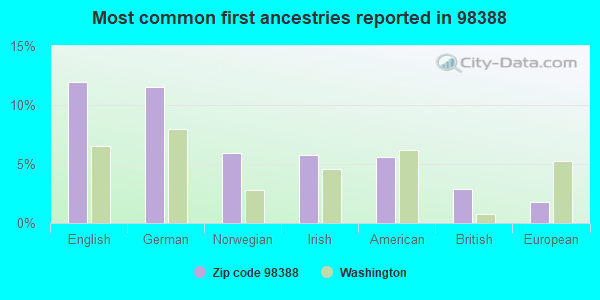
12%English
11%German
6%Norwegian
6%Irish
6%American
3%British
2%European
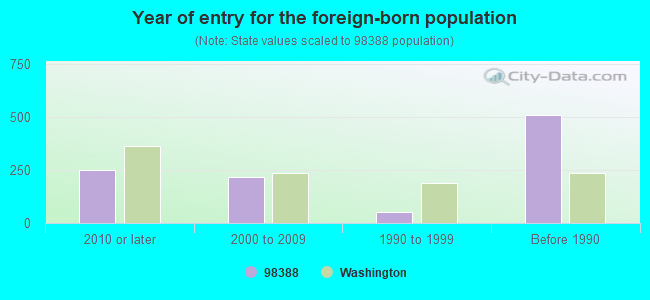
Year of entry for the foreign-born population
2502010 or later
2152000 to 2009
531990 to 1999
510Before 1990
Facilities with environmental interests located in this zip code:
ABITIBI CONSOLIDATED SALES CORP (4302 CHAMBERS CREEK RD. in STEILACOOM, WA)
AIR SYNTHETIC MINOR (AIRS/AFS) (Integrated Compliance Information System) - ICIS-10-1977-0003, FORMAL ENFORCEMENT ACTION CRITERIA AND HAZARDOUS AIR POLLUTANT INVENTORY (Inventory of air pollution sources) National Pollutant Discharge Elimination System MAJOR (Tracking pollutant discharge elimination systems) - permit (Resource Conservation and Recovery Act (tracking hazardous waste)) TRI REPORTER (Tracking of toxic chemicals releasing facilities) STATE MASTER (Washington State Department of Ecology's Facility/Site identification system) - HAZWASTE-WAD076634633, HAZARDOUS WASTE PROGRAM, AIRQUAL-, AIR MAJOR, SWFAP-, INDUSTRIAL SITES, HAZWASTE-WAD076634633, EPCRA, TRI REPORTER, HAZARDOUS WASTE PROGRAM, SQG, TOXICS-, FORMAL ENFORCEMENT ACTION, GROUND WATER PROGRAM Business SIC classification: PAPER MILLS; PETROLEUM BULK STATIONS AND TERMINALS; NONCLASSIFIABLE ESTABLISHMENTS Business NAICS classification: NEWSPRINT MILLS.; NEWSPRINT MILLS.; NEWSPRINT MILLS. Organizations: BOISE CASCADE CORPORATION (CONTACT/OWNER)
, BOISE CASCADE CORP. (CONTACT/OWNER)
Alternative names: ABITIBI CONSOLIDATED SALES CRP, ABITIBI CONSOLIDATED W TACOMA DIV
ARCO 5642 (3025 STEILACOOM BLVD in STEILACOOM, WA)
(Resource Conservation and Recovery Act (tracking hazardous waste)) STATE MASTER (Washington State Department of Ecology's Facility/Site identification system) - TOXICS-100219, UNDERGROUND STORAGE TANK PROGRAM, HAZWASTE-WAD988515128, EPCRA, CESQG Business SIC classification: GASOLINE SERVICE STATIONS Alternative names: ARCO 05642
ANDERSON ISLAND ELEMENTARY (510 CHAMBERS in ANDERSON ISLAN, WA)
(National Center for Education Statistics) - STATE ID-2040 Organizations: STEILACOOM HISTORICAL SCH DIST (SCHOOL DISTRICT)
CHERRYDALE ELEMENTARY (1201 GALLOWAY in STEILACOOM, WA)
(National Center for Education Statistics) - STATE ID-3446 Organizations: STEILACOOM HISTORICAL SCH DIST (SCHOOL DISTRICT)
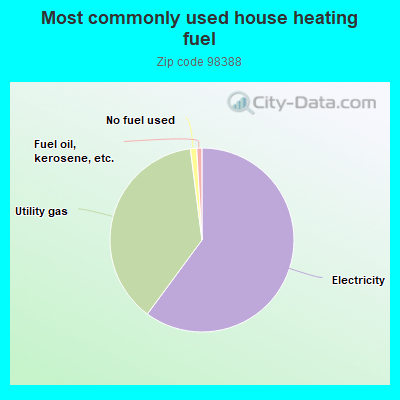
59.7%Electricity
37.6%Utility gas
1.1%No fuel used
0.9%Fuel oil, kerosene, etc.
Population in 1990: 6,099. Population change in the 1990s: +179 (+2.9%).
Place of birth for U.S.-born residents:
This state: 2,833
Northeast: 482
Midwest: 796
South: 678
West: 1,286
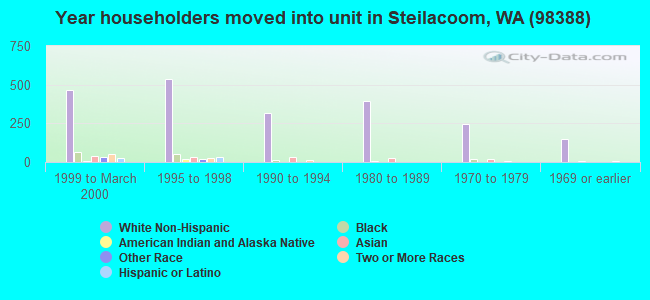
48% of the 98388 zip code residents lived in the same house 5 years ago. Out of people who lived in different houses, 53% lived in this county. Out of people who lived in different counties, 50% lived in Washington.
84% of the 98388 zip code residents lived in the same house 1 year ago. Out of people who lived in different houses, 46% moved from this county. Out of people who lived in different houses, 28% moved from different county within same state. Out of people who lived in different houses, 22% moved from different state. Out of people who lived in different houses, 3% moved from abroad.
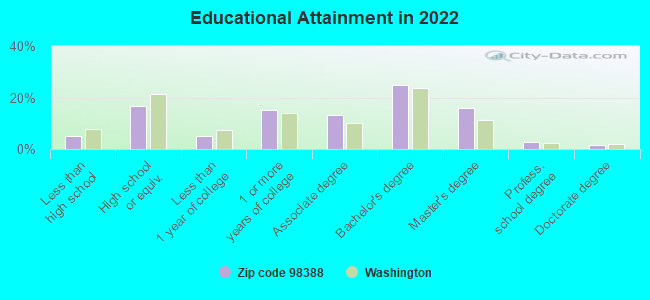
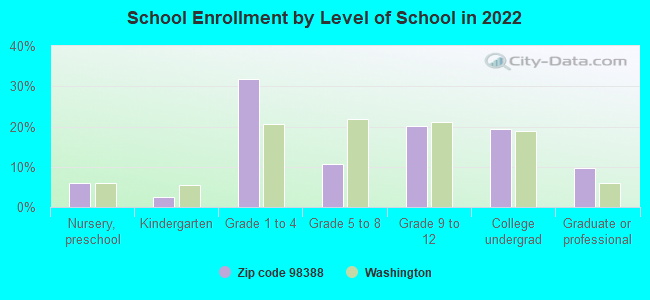
Private vs. public school enrollment:
Students in private schools in grades 1 to 8 (elementary and middle school): 108
Here:
20.5%
Washington:
12.4%
Students in private schools in grades 9 to 12 (high school): 8
Here:
3.5%
Washington:
9.2%
Students in private undergraduate colleges: 70
Here:
29.5%
Washington:
16.5%
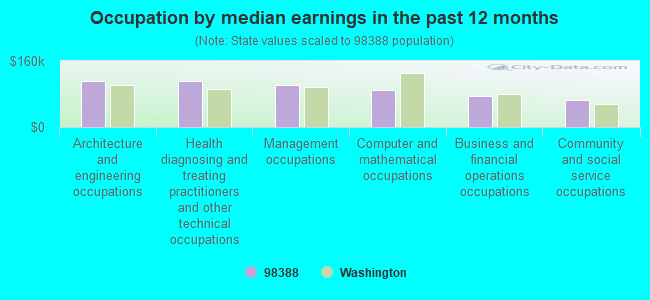
Occupation by median earnings in the past 12 months ($)
111,745Architecture and engineering occupations
111,032Health diagnosing and treating practitioners and other technical occupations
102,131Management occupations
89,379Computer and mathematical occupations
75,701Business and financial operations occupations
66,350Community and social service occupations
Companies with federal contracts located in this zip code (STEILACOOM, WA):
ICASIANO, MELODIE M , MD (1602 NISQUALLY ST; small business) : $586,585 in 4 contractsfrom 2004 to 2005
$244,360 with Army for Nursing Services. Signed on 2005-10-19. Completion date: 2006-09-30.
$234,000, same as above.Signed on 2004-10-05. Completion date: 2005-09-30.
$121,875, same as above.Signed on 2004-03-11. Completion date: 2004-09-30.
-$13,650, same as above.Signed on 2005-11-07. Completion date: 2006-09-30.
BUSKA,VICTORIA (40 SILVER BEACH DRIVE; small business)
$258,300 with Army for Nursing Services. Signed on 2004-10-07. Completion date: 2005-09-30.
LUCAS, JANETE (207 BALCH ST; small business) : $18,345 in 16 contractsfrom 2002 to 2005
Contracts for Chaplain Services by Army Signed by year:2000: $0; 2001: $0; 2002: $900; 2003: $3,780; 2004: $4,305; 2005: $9,360; 2006: $0.
Biggest contracts:
$9,360 with Army for Chaplain Services. Signed on 2005-02-01. Completion date: 2009-01-31.
$1,305, same as above.Signed on 2004-08-31. Completion date: 2005-08-24.
$1,155, same as above.Signed on 2004-03-31. Completion date: 2005-08-24.
$910, same as above.Signed on 2003-02-01. Completion date: 2005-08-24.
WHITNEY, DR ROBERT A JR DVM (314 2ND; small business)
$12,000 with Army for Other Professional Services. Signed on 2002-08-30. Completion date: 2003-09-02.
Top industries in this zip code by the number of employees in 2005:
Construction: Commercial and Institutional Building Construction (50-99 employees: 1 establishment)
Accommodation and Food Services: Full-Service Restaurants (20-49: 1, 1-4: 1)
Accommodation and Food Services: Limited-Service Restaurants (10-19: 1, 5-9: 1)
Accommodation and Food Services: Food Service Contractors (10-19: 1, 1-4: 1)
Real Estate and Rental and Leasing: Lessors of Residential Buildings and Dwellings (5-9: 1, 1-4: 4)
Health Care and Social Assistance: Child Day Care Services (5-9: 1, 1-4: 2)
Construction: New Single-Family Housing Construction (except Operative Builders) (1-4: 5)
Other Services (except Public Administration): Other Personal Care Services (5-9: 1)
Finance and Insurance: Commercial Banking (5-9: 1)
People in group quarters in 2010:
1,427 people in state prisons
7 people in group homes intended for adults
Home Mortgage Disclosure Act Aggregated Statistics For Year 2009 (Based on 2 full and 8 partial tracts)
A) FHA, FSA/RHS & VA Home Purchase Loans
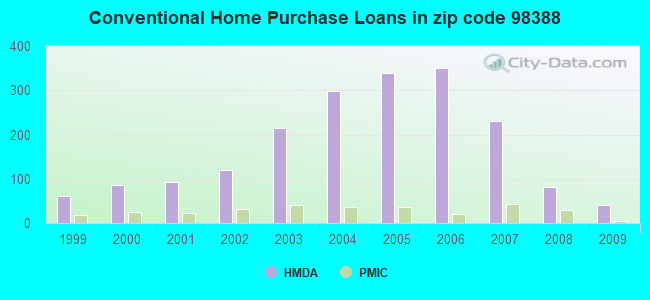
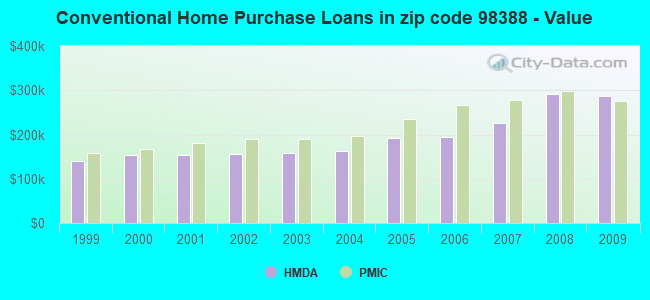
B) Conventional Home Purchase Loans
C) Refinancings
D) Home Improvement Loans
F) Non-occupant Loans on < 5 Family Dwellings (A B C & D)
Number
Average Value
Number
Average Value
Number
Average Value
Number
Average Value
Number
Average Value
LOANS ORIGINATED
129
$308,826
41
$287,427
453
$250,602
14
$137,027
36
$208,571
APPLICATIONS APPROVED, NOT ACCEPTED
11
$269,649
10
$325,423
50
$222,960
0
$0
9
$196,346
APPLICATIONS DENIED
5
$232,280
10
$210,955
88
$270,533
6
$106,393
9
$218,517
APPLICATIONS WITHDRAWN
12
$304,930
10
$297,524
126
$252,464
5
$147,414
15
$178,449
FILES CLOSED FOR INCOMPLETENESS
0
$0
0
$0
25
$246,763
0
$0
2
$389,325
Aggregated Statistics For Year 2008 (Based on 2 full and 8 partial tracts)
A) FHA, FSA/RHS & VA Home Purchase Loans
B) Conventional Home Purchase Loans
C) Refinancings
D) Home Improvement Loans
F) Non-occupant Loans on < 5 Family Dwellings (A B C & D)
Number
Average Value
Number
Average Value
Number
Average Value
Number
Average Value
Number
Average Value
LOANS ORIGINATED
97
$306,569
82
$292,600
217
$224,571
34
$100,829
30
$198,837
APPLICATIONS APPROVED, NOT ACCEPTED
9
$365,903
14
$317,004
40
$232,050
3
$128,820
6
$230,767
APPLICATIONS DENIED
19
$275,913
15
$302,095
112
$254,828
23
$85,334
12
$209,362
APPLICATIONS WITHDRAWN
4
$345,828
10
$265,702
70
$222,561
5
$91,570
7
$185,461
FILES CLOSED FOR INCOMPLETENESS
1
$464,150
2
$254,190
7
$225,667
5
$160,840
0
$0
Aggregated Statistics For Year 2007 (Based on 2 full and 8 partial tracts)
A) FHA, FSA/RHS & VA Home Purchase Loans
B) Conventional Home Purchase Loans
C) Refinancings
D) Home Improvement Loans
E) Loans on Dwellings For 5+ Families
F) Non-occupant Loans on < 5 Family Dwellings (A B C & D)
Number
Average Value
Number
Average Value
Number
Average Value
Number
Average Value
Number
Average Value
Number
Average Value
LOANS ORIGINATED
74
$294,554
231
$226,636
240
$222,002
34
$103,288
3
$7,711,703
55
$185,631
APPLICATIONS APPROVED, NOT ACCEPTED
4
$255,068
32
$237,418
52
$218,325
13
$120,072
0
$0
17
$205,328
APPLICATIONS DENIED
4
$347,635
28
$235,503
132
$212,534
12
$81,108
0
$0
23
$222,698
APPLICATIONS WITHDRAWN
7
$281,997
9
$251,183
75
$219,792
7
$92,254
0
$0
5
$264,044
FILES CLOSED FOR INCOMPLETENESS
0
$0
6
$165,757
23
$237,026
4
$42,390
0
$0
3
$69,620
Aggregated Statistics For Year 2006 (Based on 2 full and 8 partial tracts)
A) FHA, FSA/RHS & VA Home Purchase Loans
B) Conventional Home Purchase Loans
C) Refinancings
D) Home Improvement Loans
E) Loans on Dwellings For 5+ Families
F) Non-occupant Loans on < 5 Family Dwellings (A B C & D)
G) Loans On Manufactured Home Dwelling (A B C & D)
Number
Average Value
Number
Average Value
Number
Average Value
Number
Average Value
Number
Average Value
Number
Average Value
Number
Average Value
LOANS ORIGINATED
51
$272,642
350
$194,192
304
$213,293
32
$95,793
1
$1,401,840
86
$168,814
2
$179,830
APPLICATIONS APPROVED, NOT ACCEPTED
7
$221,161
34
$208,029
43
$248,491
6
$104,853
0
$0
9
$216,637
0
$0
APPLICATIONS DENIED
11
$277,542
56
$205,332
128
$191,672
27
$80,615
0
$0
32
$161,136
2
$35,245
APPLICATIONS WITHDRAWN
2
$236,385
26
$177,290
107
$202,798
10
$148,025
0
$0
9
$201,918
0
$0
FILES CLOSED FOR INCOMPLETENESS
0
$0
8
$236,439
22
$222,561
1
$35,920
0
$0
1
$261,090
0
$0
Aggregated Statistics For Year 2005 (Based on 2 full and 8 partial tracts)
A) FHA, FSA/RHS & VA Home Purchase Loans
B) Conventional Home Purchase Loans
C) Refinancings
D) Home Improvement Loans
E) Loans on Dwellings For 5+ Families
F) Non-occupant Loans on < 5 Family Dwellings (A B C & D)
G) Loans On Manufactured Home Dwelling (A B C & D)
Number
Average Value
Number
Average Value
Number
Average Value
Number
Average Value
Number
Average Value
Number
Average Value
Number
Average Value
LOANS ORIGINATED
47
$235,205
339
$192,112
370
$180,323
37
$79,571
2
$2,552,300
75
$188,682
0
$0
APPLICATIONS APPROVED, NOT ACCEPTED
7
$195,251
41
$246,460
29
$181,216
4
$118,468
0
$0
7
$172,167
0
$0
APPLICATIONS DENIED
2
$215,070
34
$211,900
135
$192,395
23
$82,404
0
$0
13
$150,768
0
$0
APPLICATIONS WITHDRAWN
2
$188,965
43
$199,374
141
$168,008
4
$47,225
0
$0
17
$181,279
3
$128,970
FILES CLOSED FOR INCOMPLETENESS
0
$0
7
$143,561
32
$190,671
3
$33,820
0
$0
1
$114,480
0
$0
Aggregated Statistics For Year 2004 (Based on 2 full and 8 partial tracts)
A) FHA, FSA/RHS & VA Home Purchase Loans
B) Conventional Home Purchase Loans
C) Refinancings
D) Home Improvement Loans
F) Non-occupant Loans on < 5 Family Dwellings (A B C & D)
G) Loans On Manufactured Home Dwelling (A B C & D)
Number
Average Value
Number
Average Value
Number
Average Value
Number
Average Value
Number
Average Value
Number
Average Value
LOANS ORIGINATED
59
$203,741
298
$163,503
313
$163,792
27
$55,747
64
$132,314
1
$37,950
APPLICATIONS APPROVED, NOT ACCEPTED
5
$191,438
28
$176,789
48
$153,187
2
$153,705
6
$144,173
0
$0
APPLICATIONS DENIED
7
$192,241
33
$123,805
122
$143,986
19
$67,651
13
$105,005
0
$0
APPLICATIONS WITHDRAWN
4
$148,770
21
$179,139
120
$164,047
7
$27,967
4
$126,418
0
$0
FILES CLOSED FOR INCOMPLETENESS
0
$0
5
$171,460
20
$180,100
2
$119,840
3
$93,497
0
$0
Aggregated Statistics For Year 2003 (Based on 2 full and 8 partial tracts)
A) FHA, FSA/RHS & VA Home Purchase Loans
B) Conventional Home Purchase Loans
C) Refinancings
D) Home Improvement Loans
E) Loans on Dwellings For 5+ Families
F) Non-occupant Loans on < 5 Family Dwellings (A B C & D)
Number
Average Value
Number
Average Value
Number
Average Value
Number
Average Value
Number
Average Value
Number
Average Value
LOANS ORIGINATED
69
$191,527
214
$158,911
778
$150,832
16
$53,121
6
$1,869,115
109
$138,029
APPLICATIONS APPROVED, NOT ACCEPTED
8
$172,886
31
$154,087
78
$148,780
3
$56,367
0
$0
7
$119,277
APPLICATIONS DENIED
3
$157,093
21
$127,321
110
$143,189
12
$21,377
0
$0
8
$136,789
APPLICATIONS WITHDRAWN
3
$250,427
19
$173,318
120
$144,721
6
$37,872
0
$0
5
$124,998
FILES CLOSED FOR INCOMPLETENESS
0
$0
2
$266,215
13
$153,120
0
$0
0
$0
3
$85,953
Aggregated Statistics For Year 2002 (Based on 6 partial tracts)
A) FHA, FSA/RHS & VA Home Purchase Loans
B) Conventional Home Purchase Loans
C) Refinancings
D) Home Improvement Loans
E) Loans on Dwellings For 5+ Families
F) Non-occupant Loans on < 5 Family Dwellings (A B C & D)
Number
Average Value
Number
Average Value
Number
Average Value
Number
Average Value
Number
Average Value
Number
Average Value
LOANS ORIGINATED
52
$186,550
119
$156,230
225
$162,892
7
$20,027
1
$1,084,660
30
$127,075
APPLICATIONS APPROVED, NOT ACCEPTED
3
$210,760
17
$207,721
25
$166,414
1
$15,860
0
$0
3
$114,080
APPLICATIONS DENIED
2
$215,640
13
$116,912
31
$153,580
6
$20,785
1
$991,200
7
$124,949
APPLICATIONS WITHDRAWN
4
$203,568
11
$150,175
36
$153,204
2
$21,450
0
$0
4
$127,698
FILES CLOSED FOR INCOMPLETENESS
0
$0
2
$193,805
11
$141,041
0
$0
0
$0
1
$163,120
Aggregated Statistics For Year 2001 (Based on 6 partial tracts)
A) FHA, FSA/RHS & VA Home Purchase Loans
B) Conventional Home Purchase Loans
C) Refinancings
D) Home Improvement Loans
E) Loans on Dwellings For 5+ Families
F) Non-occupant Loans on < 5 Family Dwellings (A B C & D)
Number
Average Value
Number
Average Value
Number
Average Value
Number
Average Value
Number
Average Value
Number
Average Value
LOANS ORIGINATED
38
$164,072
92
$154,388
149
$160,241
5
$48,358
1
$2,407,200
11
$123,601
APPLICATIONS APPROVED, NOT ACCEPTED
3
$161,207
11
$148,306
17
$151,489
1
$36,820
0
$0
2
$195,665
APPLICATIONS DENIED
2
$192,115
10
$124,517
39
$112,770
4
$27,270
0
$0
2
$40,655
APPLICATIONS WITHDRAWN
3
$185,717
11
$171,046
24
$140,687
3
$76,217
0
$0
2
$157,680
FILES CLOSED FOR INCOMPLETENESS
0
$0
2
$113,040
5
$163,630
0
$0
0
$0
0
$0
Aggregated Statistics For Year 2000 (Based on 6 partial tracts)
A) FHA, FSA/RHS & VA Home Purchase Loans
B) Conventional Home Purchase Loans
C) Refinancings
D) Home Improvement Loans
F) Non-occupant Loans on < 5 Family Dwellings (A B C & D)
Number
Average Value
Number
Average Value
Number
Average Value
Number
Average Value
Number
Average Value
LOANS ORIGINATED
38
$138,016
85
$153,079
28
$128,897
12
$26,298
10
$98,497
APPLICATIONS APPROVED, NOT ACCEPTED
4
$118,718
11
$177,088
4
$134,595
1
$19,820
1
$147,260
APPLICATIONS DENIED
3
$105,030
11
$133,054
17
$84,927
6
$23,307
3
$115,267
APPLICATIONS WITHDRAWN
4
$134,818
7
$162,047
3
$151,720
2
$37,485
1
$198,240
FILES CLOSED FOR INCOMPLETENESS
0
$0
3
$62,333
2
$141,365
0
$0
0
$0
Aggregated Statistics For Year 1999 (Based on 4 partial tracts)
A) FHA, FSA/RHS & VA Home Purchase Loans
B) Conventional Home Purchase Loans
C) Refinancings
D) Home Improvement Loans
E) Loans on Dwellings For 5+ Families
F) Non-occupant Loans on < 5 Family Dwellings (A B C & D)
2002 - 2018 National Fire Incident Reporting System (NFIRS) incidents
According to the data from the years 2002 - 2018 the average number of fires per year is 19. The highest number of reported fire incidents - 52 took place in 2004, and the least - 2 in 2016. The data has a declining trend.
When looking into fire subcategories, the most incidents belonged to: Structure Fires (41.6%), and Outside Fires (31.3%).
Fire incident types reported to NFIRS in Zip Code 98388


 Nearest zip codes: 98303, 98333, 98351, 98349, 98335, 98327.
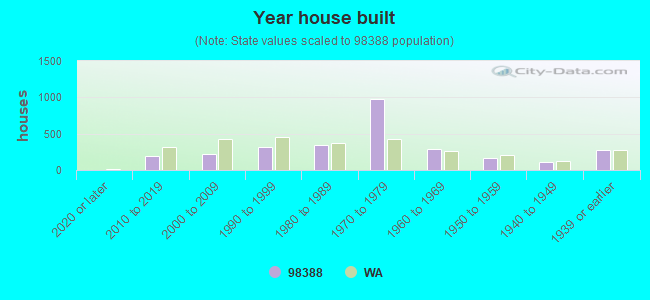


 According to the data from the years 2002 - 2018 the average number of fires per year is 19. The highest number of reported fire incidents - 52 took place in 2004, and the least - 2 in 2016. The data has a declining trend.
 When looking into fire subcategories, the most incidents belonged to: Structure Fires (41.6%), and Outside Fires (31.3%).