Estimated zip code population in 2022: 10,080 Zip code population in 2010: 8,267 Zip code population in 2000: 2,173
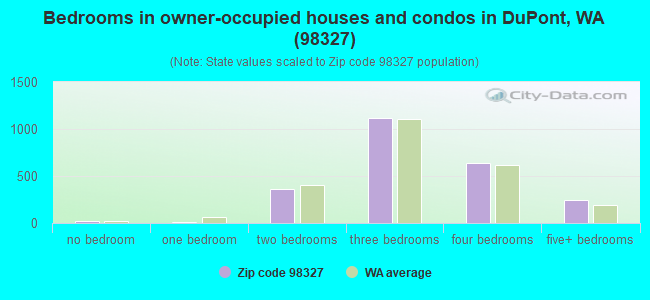
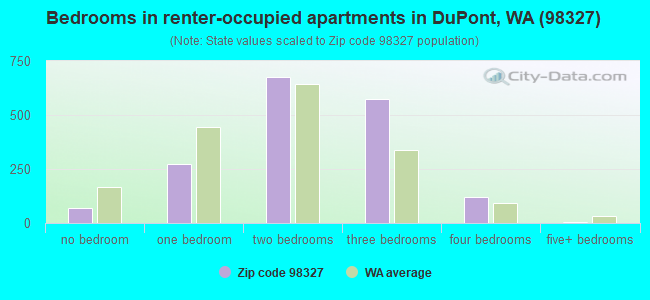
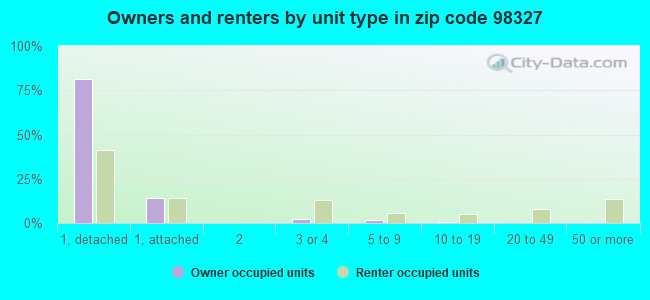
Houses and condos: 4,275 Renter-occupied apartments: 1,748
% of renters here:
42%
State:
36%
March 2022 cost of living index in zip code 98327: 110.4 (more than average, U.S. average is 100)
Land area: 6.9 sq. mi. Water area: 2.2 sq. mi.
Population density: 1,468 people per square mile
(low).
OSM Map
General Map
Google Map
MSN Map
OSM Map
General Map
Google Map
MSN Map
OSM Map
General Map
Google Map
MSN Map
OSM Map
General Map
Google Map
MSN Map
Please wait while loading the map...
Real estate property taxes paid for housing units in 2022:
This zip code:
0.7% ($3,887)
Washington:
0.8% ($4,283)
Median real estate property taxes paid for housing units with mortgages in 2022: $3,986 (0.7%) Median real estate property taxes paid for housing units with no mortgage in 2022: $3,736 (0.7%)
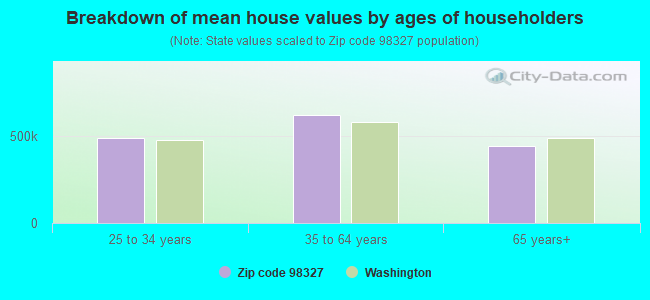
Estimated median house/condo value in 2022: $566,132
98327:
$566,132
Washington:
$569,500
According to our research of Washington and other state lists, there was 1 registered sex offender living in 98327 zip code as of April 27, 2024. The ratio of all residents to sex offenders in zip code 98327 is 9,418 to 1. The ratio of registered sex offenders to all residents in this zip code is much lower than the state average.
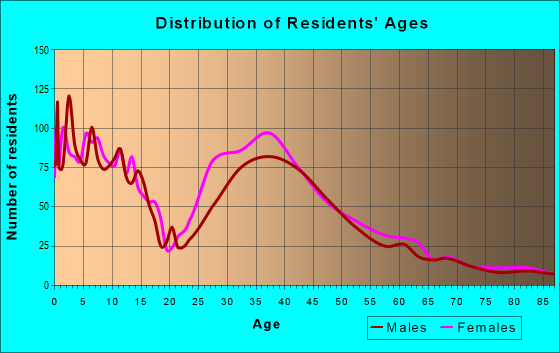
Median resident age:
This zip code:
34.6 years
Washington median age:
38.4 years
Average household size:
This zip code:
2.4 people
Washington:
2.5 people
Averages for the 2020 tax year for zip code 98327, filed in 2021:
Average Adjusted Gross Income (AGI) in 2020: $79,661 (Individual Income Tax Returns)
Here:
$79,661
State:
$99,264
Salary/wage: $71,330 (reported on 87.4% of returns)
Here:
$71,330
State:
$80,347
(% of AGI for various income ranges: 1274.7% for AGIs below $25k, 3685.7% for AGIs $25k-50k, 6209.6% for AGIs $50k-75k, 8814.4% for AGIs $75k-100k, 18978.7% for AGIs $100k-200k, 58581.4% for AGIs over 200k)
Taxable interest for individuals: $977 (reported on 34.4% of returns)
This zip code:
$977
Washington:
$2,077
(% of AGI for various income ranges: 11.8% for AGIs below $25k, 17.5% for AGIs $25k-50k, 30.0% for AGIs $50k-75k, 39.1% for AGIs $75k-100k, 75.2% for AGIs $100k-200k, 622.9% for AGIs over 200k)
Ordinary dividends: $3,406 (reported on 22.9% of returns)
Here:
$3,406
State:
$10,013
(% of AGI for various income ranges: 22.4% for AGIs below $25k, 33.5% for AGIs $25k-50k, 37.6% for AGIs $50k-75k, 106.0% for AGIs $75k-100k, 232.3% for AGIs $100k-200k, 1274.3% for AGIs over 200k)
Net capital gain/loss in AGI: +$8,221 (reported on 22.0% of returns)
Here:
+$8,221
State:
+$40,092
(% of AGI for various income ranges: 3.2% for AGIs below $25k, 21.6% for AGIs $25k-50k, 73.4% for AGIs $50k-75k, 114.0% for AGIs $75k-100k, 396.3% for AGIs $100k-200k, 6290.0% for AGIs over 200k)
Profit/loss from business: +$12,438 (reported on 10.6% of returns)
Here:
+$12,438
State:
+$18,312
(% of AGI for various income ranges: 5.0% for AGIs below $25k, 27.7% for AGIs $25k-50k, 106.7% for AGIs $50k-75k, 235.8% for AGIs $75k-100k, 292.1% for AGIs $100k-200k, 2867.1% for AGIs over 200k)
Taxable individual retirement arrangement distribution: $13,788 (reported on 5.8% of returns)
98327:
$13,788
Washington:
$24,221
(% of AGI for various income ranges: 29.2% for AGIs below $25k, 38.4% for AGIs $25k-50k, 70.9% for AGIs $50k-75k, 138.0% for AGIs $75k-100k, 197.7% for AGIs $100k-200k, 1095.7% for AGIs over 200k)
Total itemized deductions: $29,750 (reported on 9.9% of returns)
Here:
$29,750
State:
$39,068
(% of AGI for various income ranges: 107.6% for AGIs $25k-50k, 320.0% for AGIs $50k-75k, 479.8% for AGIs $75k-100k, 823.7% for AGIs $100k-200k, 4042.9% for AGIs over 200k)
Charity contributions: $10,039 (reported on 7.4% of returns)
Here:
$10,039
State:
$15,331
(% of AGI for various income ranges: 8.8% for AGIs below $25k, 56.4% for AGIs $50k-75k, 113.6% for AGIs $75k-100k, 190.8% for AGIs $100k-200k, 1690.0% for AGIs over 200k)
Taxes paid: $6,536 (reported on 9.9% of returns)
98327:
$6,536
State:
$7,774
(% of AGI for various income ranges: 25.8% for AGIs $25k-50k, 67.8% for AGIs $50k-75k, 107.6% for AGIs $75k-100k, 190.2% for AGIs $100k-200k, 792.9% for AGIs over 200k)
Earned income credit: $2,124 (reported on 7.6% of returns)
Here:
$2,124
State:
$2,020
(% of AGI for various income ranges: 46.4% for AGIs below $25k, 52.7% for AGIs $25k-50k)
Percentage of individuals using paid preparers for their 2020 taxes: 94.6%
Here:
95%
State:
93%
(% for various income ranges: 92.8% for AGIs below $25k, 95.7% for AGIs $25k-50k, 96.3% for AGIs $50k-75k, 94.9% for AGIs $75k-100k, 93.5% for AGIs $100k-200k, 95.2% for AGIs over 200k)
Averages for the 2012 tax year for zip code 98327, filed in 2013:
Average Adjusted Gross Income (AGI) in 2012: $64,684 (Individual Income Tax Returns)
Here:
$64,684
State:
$69,533
Salary/wage: $59,612 (reported on 89.3% of returns)
Here:
$59,612
State:
$57,267
(% of AGI for various income ranges: 84.2% for AGIs below $25k, 86.5% for AGIs $25k-50k, 87.0% for AGIs $50k-75k, 83.3% for AGIs $75k-100k, 81.2% for AGIs $100k-200k, 66.0% for AGIs over 200k)
Taxable interest for individuals: $809 (reported on 41.7% of returns)
This zip code:
$809
Washington:
$1,816
(% of AGI for various income ranges: 1.1% for AGIs below $25k, 0.5% for AGIs $25k-50k, 0.5% for AGIs $50k-75k, 0.3% for AGIs $75k-100k, 0.6% for AGIs $100k-200k, 0.8% for AGIs over 200k)
Ordinary dividends: $2,539 (reported on 25.7% of returns)
Here:
$2,539
State:
$8,163
(% of AGI for various income ranges: 2.0% for AGIs below $25k, 1.1% for AGIs $25k-50k, 0.8% for AGIs $50k-75k, 0.7% for AGIs $75k-100k, 0.9% for AGIs $100k-200k, 2.0% for AGIs over 200k)
Net capital gain/loss in AGI: +$2,944 (reported on 18.7% of returns)
Here:
+$2,944
State:
+$21,568
(% of AGI for various income ranges: 0.2% for AGIs $25k-50k, 0.2% for AGIs $50k-75k, 0.4% for AGIs $75k-100k, 1.0% for AGIs $100k-200k, 4.5% for AGIs over 200k)
Profit/loss from business: +$11,321 (reported on 9.1% of returns)
Here:
+$11,321
State:
+$16,521
(% of AGI for various income ranges: 2.9% for AGIs below $25k, 1.4% for AGIs $25k-50k, 1.1% for AGIs $50k-75k, 1.4% for AGIs $75k-100k, 2.2% for AGIs $100k-200k)
Taxable individual retirement arrangement distribution: $12,852 (reported on 6.7% of returns)
98327:
$12,852
Washington:
$18,648
(% of AGI for various income ranges: 1.5% for AGIs below $25k, 1.2% for AGIs $25k-50k, 1.6% for AGIs $50k-75k, 1.3% for AGIs $75k-100k, 1.5% for AGIs $100k-200k)
Total itemized deductions: $20,646 (22% of AGI, reported on 41.7% of returns)
Here:
$20,646
State:
$23,872
Here:
22.1% of AGI
State:
18.2% of AGI
(% of AGI for various income ranges: 14.0% for AGIs below $25k, 11.8% for AGIs $25k-50k, 12.3% for AGIs $50k-75k, 14.7% for AGIs $75k-100k, 14.5% for AGIs $100k-200k, 9.3% for AGIs over 200k)
Charity contributions: $3,460 (reported on 33.2% of returns)
Here:
$3,460
State:
$4,465
(% of AGI for various income ranges: 1.3% for AGIs below $25k, 1.1% for AGIs $25k-50k, 1.5% for AGIs $50k-75k, 1.9% for AGIs $75k-100k, 2.1% for AGIs $100k-200k, 2.0% for AGIs over 200k)
Taxes paid: $4,990 (reported on 40.9% of returns)
98327:
$4,990
State:
$6,400
(% of AGI for various income ranges: 2.8% for AGIs below $25k, 2.7% for AGIs $25k-50k, 2.8% for AGIs $50k-75k, 3.5% for AGIs $75k-100k, 3.6% for AGIs $100k-200k, 2.4% for AGIs over 200k)
Earned income credit: $2,117 (reported on 12.8% of returns)
Here:
$2,117
State:
$2,073
(% of AGI for various income ranges: 5.7% for AGIs below $25k, 1.2% for AGIs $25k-50k)
Percentage of individuals using paid preparers for their 2012 taxes: 36.6%
Here:
37%
State:
43%
(% for various income ranges: 31.0% for AGIs below $25k, 34.9% for AGIs $25k-50k, 36.0% for AGIs $50k-75k, 39.6% for AGIs $75k-100k, 42.4% for AGIs $100k-200k, 57.1% for AGIs over 200k)
Averages for the 2004 tax year for zip code 98327, filed in 2005:
Average Adjusted Gross Income (AGI) in 2004: $55,307 (Individual Income Tax Returns)
Here:
$55,307
State:
$54,331
Salary/wage: $51,981 (reported on 90.7% of returns)
Here:
$51,981
State:
$45,761
(% of AGI for various income ranges: 141.2% for AGIs below $10k, 85.5% for AGIs $10k-25k, 88.6% for AGIs $25k-50k, 89.6% for AGIs $50k-75k, 86.3% for AGIs $75k-100k, 77.2% for AGIs over 100k)
Taxable interest for individuals: $745 (reported on 56.7% of returns)
This zip code:
$745
Washington:
$2,110
(% of AGI for various income ranges: 4.0% for AGIs below $10k, 1.1% for AGIs $10k-25k, 0.9% for AGIs $25k-50k, 0.5% for AGIs $50k-75k, 1.0% for AGIs $75k-100k, 0.6% for AGIs over 100k)
Taxable dividends: $1,484 (reported on 33.4% of returns)
Here:
$1,484
State:
$5,879
(% of AGI for various income ranges: 4.9% for AGIs below $10k, 1.6% for AGIs $10k-25k, 0.6% for AGIs $25k-50k, 0.5% for AGIs $50k-75k, 0.6% for AGIs $75k-100k, 1.5% for AGIs over 100k)
Net capital gain/loss: +$5,814 (reported on 24.6% of returns)
Here:
+$5,814
State:
+$15,835
(% of AGI for various income ranges: -3.3% for AGIs below $10k, -0.4% for AGIs $10k-25k, -0.3% for AGIs $25k-50k, 0.7% for AGIs $50k-75k, 0.3% for AGIs $75k-100k, 8.3% for AGIs over 100k)
Profit/loss from business: +$4,789 (reported on 9.9% of returns)
Here:
+$4,789
State:
+$13,994
(% of AGI for various income ranges: -6.9% for AGIs below $10k, -4.2% for AGIs $10k-25k, 0.2% for AGIs $25k-50k, 0.0% for AGIs $50k-75k, 2.2% for AGIs $75k-100k, 2.0% for AGIs over 100k)
IRA payment deduction: $2,736 (reported on 3.2% of returns)
98327:
$2,736
Washington:
$3,001
Self-employed pension: $13,500 (reported on 0.5% of returns)
Here:
$13,500
Washington:
$14,244
Total itemized deductions: $16,830 (23% of AGI, reported on 50.6% of returns)
Here:
$16,830
State:
$19,669
Here:
23.1% of AGI
State:
20.7% of AGI
(% of AGI for various income ranges: 30.1% for AGIs below $10k, 18.1% for AGIs $10k-25k, 16.9% for AGIs $25k-50k, 15.9% for AGIs $50k-75k, 16.7% for AGIs $75k-100k, 12.3% for AGIs over 100k)
Charity contributions deductions: $2,662 (4% of AGI, reported on 44.0% of returns)
Here:
$2,662
State:
$3,569
Here:
3.6% of AGI
State:
3.5% of AGI
(% of AGI for various income ranges: 1.4% for AGIs below $10k, 1.3% for AGIs $10k-25k, 2.3% for AGIs $25k-50k, 1.8% for AGIs $50k-75k, 2.5% for AGIs $75k-100k, 2.1% for AGIs over 100k)
Total tax: $7,094 (reported on 80.8% of returns)
98327:
$7,094
State:
$9,065
(% of AGI for various income ranges: 3.5% for AGIs below $10k, 3.5% for AGIs $10k-25k, 6.1% for AGIs $25k-50k, 8.4% for AGIs $50k-75k, 10.0% for AGIs $75k-100k, 16.2% for AGIs over 100k)
Earned income credit: $1,500 (reported on 8.7% of returns)
Here:
$1,500
State:
$1,607
Percentage of individuals using paid preparers for their 2004 taxes: 45.6%
Here:
46%
State:
49%
(% for various income ranges: 42.6% for AGIs below $10k, 46.3% for AGIs $10k-25k, 46.1% for AGIs $25k-50k, 44.1% for AGIs $50k-75k, 44.6% for AGIs $75k-100k, 50.6% for AGIs over 100k)
Likely homosexual households (counted as self-reported same-sex unmarried-partner households)
Lesbian couples: 0.8% of all households
Gay men: 0.0% of all households
Household received Food Stamps/SNAP in the past 12 months: 99 Household did not receive Food Stamps/SNAP in the past 12 months: 4,034
Women who had a birth in the past 12 months: 169 (174 now married, 0 unmarried) Women who did not have a birth in the past 12 months: 2,457 (1,450 now married, 995 unmarried)
Housing units in zip code 98327 with a mortgage: 1,808 (49 second mortgage, 51 both second mortgage and home equity loan) Houses without a mortgage: 23
Median monthly owner costs for units with a mortgage: $2,270 Median monthly owner costs for units without a mortgage: $591
Residents with income below the poverty level in 2022:
This zip code:
4.4%
Whole state:
10.0%
Residents with income below 50% of the poverty level in 2022:
This zip code:
1.2%
Whole state:
4.6%
Median number of rooms in houses and condos:
Here:
6.5
State:
6.5
Median number of rooms in apartments:
Here:
4.7
State:
3.9
Notable locations in this zip code not listed on our city pages
Lakes and swamps: Old Fort Lake (A), Pond Lake (B), Sellers Lake (C), Strickland Lake (D), Grant Lake (E), Edmond Marsh (F). Display/hide their locations on the map
Size of family households: 1,173 2-persons, 743 3-persons, 516 4-persons, 283 5-persons, 51 6-persons
Size of nonfamily households: 1,082 1-person, 176 2-persons, 94 3-persons
2,037 married couples with children.
362 single-parent households (113 men, 249 women).
81.0% of residents of 98327 zip code speak English at home.
6.5% of residents speak Spanish at home (95% very well, 5% well).
2.7% of residents speak other Indo-European language at home (67% very well, 6% well, 27% not well).
9.4% of residents speak Asian or Pacific Island language at home (54% very well, 24% well, 20% not well, 2% not at all).
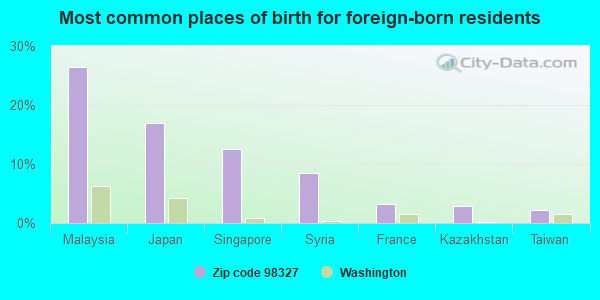
Foreign born population: 1,141 (11.3%) (64.3% of them are naturalized citizens)
This zip code:
11.3%
Whole state:
15.3%
26%Malaysia
17%Japan
13%Singapore
9%Syria
3%France
3%Kazakhstan
2%Taiwan
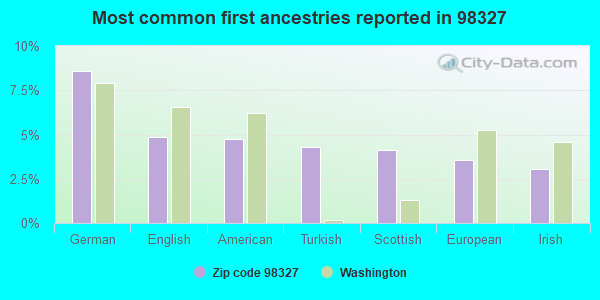
9%German
5%English
5%American
4%Turkish
4%Scottish
4%European
3%Irish
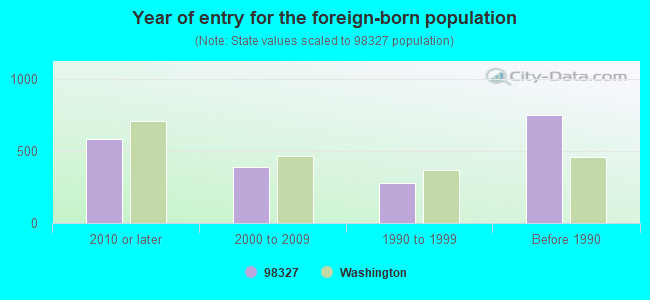
Year of entry for the foreign-born population
5832010 or later
3892000 to 2009
2811990 to 1999
750Before 1990
Facilities with environmental interests located in this zip code:
CHLOE CLARK ELEMENTARY (1700 PALISADE BOULEVARD in DUPONT, WA)
(National Center for Education Statistics) - STATE ID-4562 Organizations: STEILACOOM HISTORICAL SCH DIST (SCHOOL DISTRICT)
BN RAILROAD OVERPASS 4181 A (MP 0.76 OLD PACIFIC HWY in DUPONT, WA)
(Resource Conservation and Recovery Act (tracking hazardous waste))
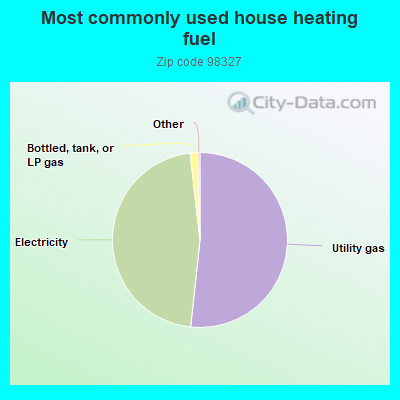
51.7%Utility gas
46.5%Electricity
1.4%Bottled, tank, or LP gas
Place of birth for U.S.-born residents:
This state: 2,255
Northeast: 590
Midwest: 1,209
South: 1,873
West: 2,102
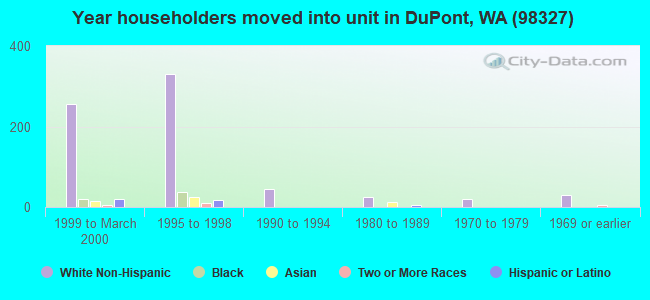
20% of the 98327 zip code residents lived in the same house 5 years ago. Out of people who lived in different houses, 38% lived in this county. Out of people who lived in different counties, 50% lived in Washington.
82% of the 98327 zip code residents lived in the same house 1 year ago. Out of people who lived in different houses, 19% moved from this county. Out of people who lived in different houses, 22% moved from different county within same state. Out of people who lived in different houses, 46% moved from different state. Out of people who lived in different houses, 19% moved from abroad.
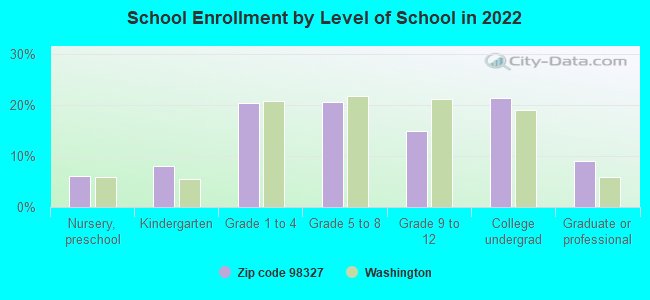
Private vs. public school enrollment:
Students in private schools in grades 1 to 8 (elementary and middle school): 310
Here:
24.8%
Washington:
12.4%
Students in private schools in grades 9 to 12 (high school): 15
Here:
3.4%
Washington:
9.2%
Students in private undergraduate colleges: 57
Here:
8.9%
Washington:
16.5%
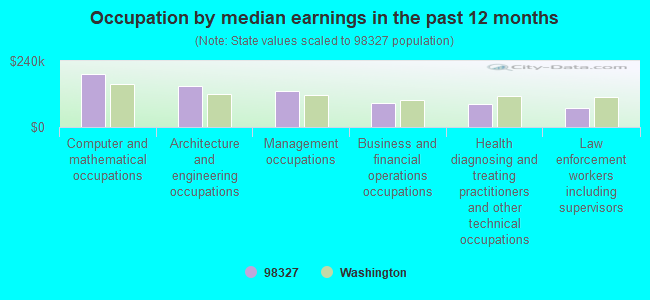
Occupation by median earnings in the past 12 months ($)
193,395Computer and mathematical occupations
147,560Architecture and engineering occupations
131,797Management occupations
88,298Business and financial operations occupations
82,767Health diagnosing and treating practitioners and other technical occupations
70,714Law enforcement workers including supervisors
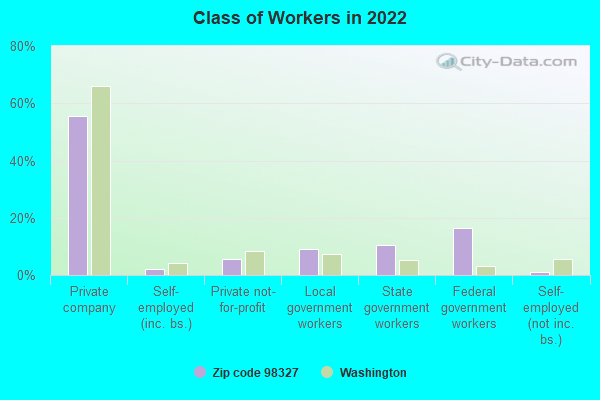
Companies with federal contracts located in this zip code:
NEW DEFINITIONS INC (1000 STATION DR STE 110 in DUPONT, WA; small business) : $2,012,729 in 26 contractsfrom 2003 to 2006
Contracts for Reserve Training (Military), Other Professional Services, Other Management Support Services by Army, ENERGY, Department of Signed by year:2000: $0; 2001: $0; 2002: $0; 2003: $22,146; 2004: $116,819; 2005: $1,741,780; 2006: $131,984.
Biggest contracts:
$626,269 with Army for Reserve Training (Military). Signed on 2005-06-10. Completion date: 2005-09-30.
$623,780, same as above.Signed on 2005-09-30. Completion date: 2006-10-03.
$120,000 with ENERGY, Department of for Other Professional Services. Signed on 2005-03-02. Completion date: 2006-03-01.
$116,819 with Army for Reserve Training (Military). Signed on 2004-12-03. Completion date: 2005-01-22.
DAVID B MITCHELL MD (2192 MCDONALD AVE in DUPONT, WA; small business) : $1,736,248 in 9 contractsfrom 2001 to 2005
Contracts for Radiology Services by Army Signed by year:2000: $0; 2001: $84,563; 2002: $575,179; 2003: $344,788; 2004: $367,932; 2005: $363,786; 2006: $0.
Biggest contracts:
$365,786 with Army for Radiology Services. Signed on 2005-10-28. Completion date: 2002-09-30.
$355,132, same as above.Signed on 2004-10-19. Completion date: 2002-09-30.
$344,788, same as above.Signed on 2003-10-24. Completion date: 2002-09-30.
$334,746, same as above.Signed on 2002-10-21. Completion date: 2002-09-30.
SMITH, DONALD V (2160 ANDERSON AVE in DUPONT, WA; small business) : $1,418,223 in 5 contractsfrom 2003 to 2006
Contracts for Radiology Services by Army Signed by year:2000: $0; 2001: $0; 2002: $0; 2003: $338,038; 2004: $348,179; 2005: $362,624; 2006: $369,382.
Biggest contracts:
$369,382 with Army for Radiology Services. Signed on 2006-05-16. Completion date: 2004-06-08.
$358,624, same as above.Signed on 2005-06-03. Completion date: 2004-06-08.
$348,179, same as above.Signed on 2004-05-13. Completion date: 2004-06-08.
$338,038, same as above.Signed on 2003-05-06. Completion date: 2004-06-08.
GUEST DUPONT LLC (1609 MCNEIL ST in DUPONT, WA; small business) : $975,506 in 8 contractsfrom 2001 to 2005
Contracts for Lodging - Hotel/Motel by Army Signed by year:2000: $0; 2001: $261,450; 2002: $173,340; 2003: $179,093; 2004: $147,798; 2005: $213,825; 2006: $0.
Biggest contracts:
$225,925 with Army for Lodging - Hotel/Motel. Signed on 2002-04-22. Completion date: 2002-08-31.
$213,825, same as above.Signed on 2005-04-26. Completion date: 2005-08-31.
$212,625, same as above.Signed on 2001-12-12. Completion date: 2002-04-30.
$179,093, same as above.Signed on 2003-02-28. Completion date: 2003-08-20.
LONCZAK, JOHN W , CRNA (1430 HEATH COURT in DUPONT, WA; small business) : $625,256 in 11 contractsfrom 2004 to 2006
Contracts for Anesthesiology Services by Army Signed by year:2000: $0; 2001: $0; 2002: $0; 2003: $0; 2004: $263,684; 2005: $234,382; 2006: $127,190.
Biggest contracts:
$120,354 with Army for Anesthesiology Services. Signed on 2006-01-30. Completion date: 2005-08-03.
$116,288, same as above.Signed on 2005-10-18. Completion date: 2005-08-03.
$116,288, same as above.Signed on 2005-03-17. Completion date: 2005-03-18.
$112,350, same as above.Signed on 2004-10-12. Completion date: 2004-09-30.
JOHNSON, CHRISTINE (1407 HEATH CT in DUPONT, WA; small business) : $107,999 in 2 contractsfrom 2003 to 2004
$55,000 with Air Force for Other Medical Services. Signed on 2004-10-01. Completion date: 2005-09-30.
$52,999 with Air Force for Other Professional Services. Signed on 2003-10-01. Completion date: 2008-09-30.
dr. alansteinman (1135 Harrington Place in Dupont, WA)
$31,567 with Offices, Boards and Divisions (includes Attorney General, Deputy Attorney General, etc.) for Expert Witness. Signed on 2004-08-30. Completion date: 2006-09-30.
KATHRYN FRESH (2129 MCDONALD AVE in DUPONT, WA; small business) : $31,510 in 9 contractsfrom 2003 to 2005
Contracts for Chaplain Services by Army Signed by year:2000: $0; 2001: $0; 2002: $0; 2003: $2,175; 2004: $19,975; 2005: $9,360; 2006: $0.
Biggest contracts:
$18,100 with Army for Chaplain Services. Signed on 2004-11-01. Completion date: 2005-09-30.
$9,360, same as above.Signed on 2005-02-01. Completion date: 2009-01-31.
$1,425, same as above.Signed on 2004-03-31. Completion date: 2006-01-24.
$825, same as above.Signed on 2003-07-31. Completion date: 2006-01-24.
Top industries in this zip code by the number of employees in 2005:
Professional, Scientific, and Technical Services: Research and Development in the Social Sciences and Humanities (500-999 employees: 1 establishment)
Real Estate and Rental and Leasing: Lessors of Residential Buildings and Dwellings (100-249: 1, 1-4: 1)
Administrative and Support and Waste Management and Remediation Services: Temporary Help Services (50-99: 1, 20-49: 1, 1-4: 1)
Health Care and Social Assistance: Child Day Care Services (50-99: 1, 1-4: 1)
Accommodation and Food Services: Full-Service Restaurants (20-49: 1, 5-9: 1)
Professional, Scientific, and Technical Services: Administrative Management and General Management Consulting Services (20-49: 1)
Wholesale Trade: Other Electronic Parts and Equipment Merchant Wholesalers (10-19: 2, 1-4: 1)
Accommodation and Food Services: Snack and Nonalcoholic Beverage Bars (10-19: 2, 1-4: 1)
People in group quarters in 2000:
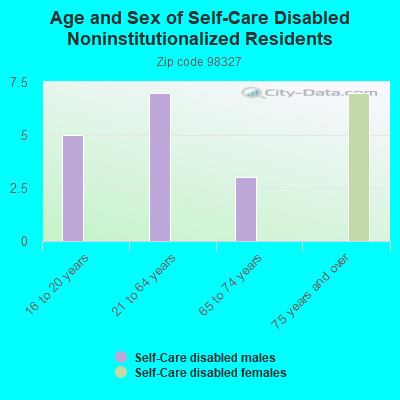
6 people in homes for the physically handicapped
Home Mortgage Disclosure Act Aggregated Statistics For Year 2009 (Based on 2 partial tracts)
A) FHA, FSA/RHS & VA Home Purchase Loans
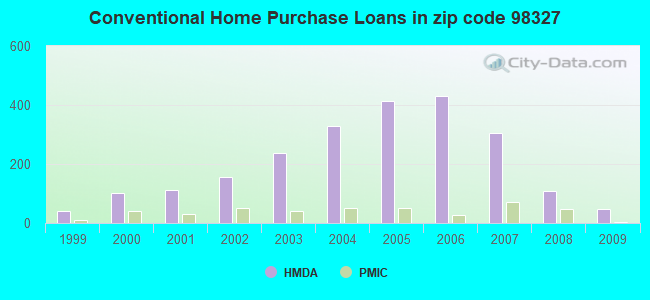
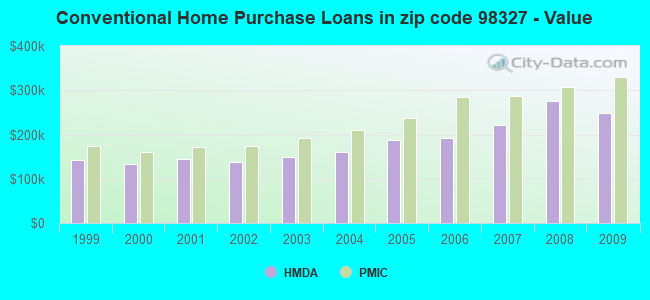
B) Conventional Home Purchase Loans
C) Refinancings
D) Home Improvement Loans
F) Non-occupant Loans on < 5 Family Dwellings (A B C & D)
G) Loans On Manufactured Home Dwelling (A B C & D)
Number
Average Value
Number
Average Value
Number
Average Value
Number
Average Value
Number
Average Value
Number
Average Value
LOANS ORIGINATED
170
$316,047
48
$248,885
469
$261,301
5
$159,942
42
$236,707
0
$0
APPLICATIONS APPROVED, NOT ACCEPTED
18
$287,084
9
$280,283
49
$236,946
1
$15,050
9
$199,788
0
$0
APPLICATIONS DENIED
6
$291,320
3
$239,813
95
$261,148
6
$47,495
12
$180,612
1
$70,240
APPLICATIONS WITHDRAWN
23
$320,216
9
$314,064
130
$266,055
4
$183,120
14
$209,137
0
$0
FILES CLOSED FOR INCOMPLETENESS
1
$413,400
0
$0
21
$263,416
1
$317,070
1
$154,520
0
$0
Aggregated Statistics For Year 2008 (Based on 2 partial tracts)
A) FHA, FSA/RHS & VA Home Purchase Loans
B) Conventional Home Purchase Loans
C) Refinancings
D) Home Improvement Loans
F) Non-occupant Loans on < 5 Family Dwellings (A B C & D)
Number
Average Value
Number
Average Value
Number
Average Value
Number
Average Value
Number
Average Value
LOANS ORIGINATED
161
$320,434
108
$275,666
172
$240,734
6
$156,363
25
$184,626
APPLICATIONS APPROVED, NOT ACCEPTED
19
$363,073
25
$298,973
36
$240,955
0
$0
7
$231,069
APPLICATIONS DENIED
23
$314,544
6
$314,900
86
$252,857
10
$138,770
6
$144,657
APPLICATIONS WITHDRAWN
5
$307,844
11
$311,236
66
$262,024
2
$233,290
4
$239,310
FILES CLOSED FOR INCOMPLETENESS
3
$324,097
2
$307,040
10
$223,658
2
$193,155
0
$0
Aggregated Statistics For Year 2007 (Based on 2 partial tracts)
A) FHA, FSA/RHS & VA Home Purchase Loans
B) Conventional Home Purchase Loans
C) Refinancings
D) Home Improvement Loans
F) Non-occupant Loans on < 5 Family Dwellings (A B C & D)
G) Loans On Manufactured Home Dwelling (A B C & D)
Number
Average Value
Number
Average Value
Number
Average Value
Number
Average Value
Number
Average Value
Number
Average Value
LOANS ORIGINATED
129
$293,358
306
$220,689
177
$205,124
25
$114,950
49
$182,250
0
$0
APPLICATIONS APPROVED, NOT ACCEPTED
8
$267,155
53
$218,533
31
$213,951
5
$100,942
9
$145,159
1
$296,000
APPLICATIONS DENIED
9
$323,652
25
$259,680
67
$212,227
12
$113,050
13
$186,169
0
$0
APPLICATIONS WITHDRAWN
11
$286,425
12
$201,182
55
$228,666
6
$85,288
4
$221,250
0
$0
FILES CLOSED FOR INCOMPLETENESS
0
$0
5
$236,200
15
$241,151
3
$31,773
2
$124,420
0
$0
Aggregated Statistics For Year 2006 (Based on 2 partial tracts)
A) FHA, FSA/RHS & VA Home Purchase Loans
B) Conventional Home Purchase Loans
C) Refinancings
D) Home Improvement Loans
F) Non-occupant Loans on < 5 Family Dwellings (A B C & D)
G) Loans On Manufactured Home Dwelling (A B C & D)
Number
Average Value
Number
Average Value
Number
Average Value
Number
Average Value
Number
Average Value
Number
Average Value
LOANS ORIGINATED
98
$272,925
429
$192,781
214
$210,770
29
$100,617
77
$176,155
1
$105,360
APPLICATIONS APPROVED, NOT ACCEPTED
15
$216,199
49
$181,718
41
$208,879
4
$46,408
12
$175,010
0
$0
APPLICATIONS DENIED
13
$262,351
54
$196,666
95
$200,015
13
$51,636
20
$184,475
0
$0
APPLICATIONS WITHDRAWN
4
$247,590
37
$200,111
68
$229,129
6
$87,295
12
$207,620
0
$0
FILES CLOSED FOR INCOMPLETENESS
0
$0
6
$143,988
13
$242,128
2
$37,630
1
$240,820
0
$0
Aggregated Statistics For Year 2005 (Based on 2 partial tracts)
A) FHA, FSA/RHS & VA Home Purchase Loans
B) Conventional Home Purchase Loans
C) Refinancings
D) Home Improvement Loans
E) Loans on Dwellings For 5+ Families
F) Non-occupant Loans on < 5 Family Dwellings (A B C & D)
G) Loans On Manufactured Home Dwelling (A B C & D)
Number
Average Value
Number
Average Value
Number
Average Value
Number
Average Value
Number
Average Value
Number
Average Value
Number
Average Value
LOANS ORIGINATED
84
$232,860
412
$186,540
247
$187,892
22
$106,497
1
$8,691,450
64
$181,349
0
$0
APPLICATIONS APPROVED, NOT ACCEPTED
10
$228,474
43
$187,379
22
$185,036
1
$15,050
0
$0
8
$164,558
0
$0
APPLICATIONS DENIED
4
$225,262
37
$161,656
75
$184,907
18
$46,435
0
$0
16
$173,714
0
$0
APPLICATIONS WITHDRAWN
4
$197,920
47
$201,406
72
$209,474
8
$47,536
1
$250,850
19
$186,263
0
$0
FILES CLOSED FOR INCOMPLETENESS
0
$0
8
$148,378
24
$173,045
0
$0
0
$0
2
$119,905
1
$351,190
Aggregated Statistics For Year 2004 (Based on 2 partial tracts)
A) FHA, FSA/RHS & VA Home Purchase Loans
B) Conventional Home Purchase Loans
C) Refinancings
D) Home Improvement Loans
E) Loans on Dwellings For 5+ Families
F) Non-occupant Loans on < 5 Family Dwellings (A B C & D)
Number
Average Value
Number
Average Value
Number
Average Value
Number
Average Value
Number
Average Value
Number
Average Value
LOANS ORIGINATED
96
$211,738
328
$161,554
215
$171,721
9
$96,772
1
$15,206,530
60
$142,366
APPLICATIONS APPROVED, NOT ACCEPTED
9
$209,822
35
$163,898
27
$166,639
0
$0
0
$0
7
$158,680
APPLICATIONS DENIED
10
$191,248
26
$142,753
61
$174,246
13
$66,996
0
$0
9
$144,712
APPLICATIONS WITHDRAWN
4
$190,645
27
$176,710
66
$205,408
2
$50,170
0
$0
4
$163,302
FILES CLOSED FOR INCOMPLETENESS
1
$184,630
7
$171,294
22
$201,638
4
$81,025
0
$0
2
$103,350
Aggregated Statistics For Year 2003 (Based on 2 partial tracts)
A) FHA, FSA/RHS & VA Home Purchase Loans
B) Conventional Home Purchase Loans
C) Refinancings
D) Home Improvement Loans
E) Loans on Dwellings For 5+ Families
F) Non-occupant Loans on < 5 Family Dwellings (A B C & D)
Number
Average Value
Number
Average Value
Number
Average Value
Number
Average Value
Number
Average Value
Number
Average Value
LOANS ORIGINATED
85
$204,635
237
$149,312
476
$155,219
9
$37,126
1
$8,629,240
59
$127,245
APPLICATIONS APPROVED, NOT ACCEPTED
6
$198,673
39
$135,356
48
$145,828
2
$119,905
0
$0
2
$159,040
APPLICATIONS DENIED
3
$181,950
11
$169,118
63
$150,191
8
$36,875
0
$0
9
$131,891
APPLICATIONS WITHDRAWN
6
$210,882
18
$161,269
78
$166,925
1
$45,150
0
$0
3
$124,757
FILES CLOSED FOR INCOMPLETENESS
0
$0
4
$152,768
8
$153,896
0
$0
0
$0
0
$0
Aggregated Statistics For Year 2002 (Based on 2 partial tracts)
A) FHA, FSA/RHS & VA Home Purchase Loans
B) Conventional Home Purchase Loans
C) Refinancings
D) Home Improvement Loans
F) Non-occupant Loans on < 5 Family Dwellings (A B C & D)
Number
Average Value
Number
Average Value
Number
Average Value
Number
Average Value
Number
Average Value
LOANS ORIGINATED
104
$188,591
157
$137,600
218
$146,124
2
$34,115
36
$117,286
APPLICATIONS APPROVED, NOT ACCEPTED
7
$189,213
21
$164,558
21
$139,568
0
$0
5
$128,436
APPLICATIONS DENIED
3
$233,123
10
$103,150
28
$142,196
5
$19,266
4
$92,312
APPLICATIONS WITHDRAWN
6
$191,148
13
$140,785
42
$146,066
2
$30,100
4
$141,730
FILES CLOSED FOR INCOMPLETENESS
0
$0
2
$128,935
14
$134,169
0
$0
0
$0
Aggregated Statistics For Year 2001 (Based on 2 partial tracts)
A) FHA, FSA/RHS & VA Home Purchase Loans
B) Conventional Home Purchase Loans
C) Refinancings
D) Home Improvement Loans
F) Non-occupant Loans on < 5 Family Dwellings (A B C & D)
Number
Average Value
Number
Average Value
Number
Average Value
Number
Average Value
Number
Average Value
LOANS ORIGINATED
68
$167,568
113
$144,259
165
$149,373
4
$58,700
14
$111,736
APPLICATIONS APPROVED, NOT ACCEPTED
5
$162,752
13
$139,935
15
$137,065
0
$0
2
$185,630
APPLICATIONS DENIED
3
$176,933
11
$119,769
43
$96,350
4
$15,302
2
$63,215
APPLICATIONS WITHDRAWN
3
$189,307
14
$151,944
28
$124,637
1
$15,050
1
$144,490
FILES CLOSED FOR INCOMPLETENESS
1
$125,430
1
$174,590
6
$193,488
1
$10,030
0
$0
Aggregated Statistics For Year 2000 (Based on 2 partial tracts)
A) FHA, FSA/RHS & VA Home Purchase Loans
B) Conventional Home Purchase Loans
C) Refinancings
D) Home Improvement Loans
F) Non-occupant Loans on < 5 Family Dwellings (A B C & D)
Number
Average Value
Number
Average Value
Number
Average Value
Number
Average Value
Number
Average Value
LOANS ORIGINATED
72
$136,867
102
$133,196
22
$95,460
4
$30,602
8
$106,486
APPLICATIONS APPROVED, NOT ACCEPTED
7
$112,954
13
$131,445
3
$68,230
0
$0
0
$0
APPLICATIONS DENIED
5
$104,956
4
$115,390
17
$48,576
5
$17,058
2
$102,345
APPLICATIONS WITHDRAWN
4
$154,272
12
$137,800
3
$61,543
1
$30,100
0
$0
FILES CLOSED FOR INCOMPLETENESS
1
$121,410
2
$80,775
4
$118,400
0
$0
0
$0
Aggregated Statistics For Year 1999 (Based on 1 partial tract)
A) FHA, FSA/RHS & VA Home Purchase Loans
B) Conventional Home Purchase Loans
C) Refinancings
D) Home Improvement Loans
F) Non-occupant Loans on < 5 Family Dwellings (A B C & D)
Detailed PMIC statistics for the following Tracts:0728.00
2002 - 2018 National Fire Incident Reporting System (NFIRS) incidents
Based on the data from the years 2002 - 2018 the average number of fires per year is 12. The highest number of reported fires - 33 took place in 2003, and the least - 0 in 2007. The data has a dropping trend.
When looking into fire subcategories, the most incidents belonged to: Outside Fires (49.5%), and Structure Fires (31.1%).
Fire incident types reported to NFIRS in Zip Code 98327
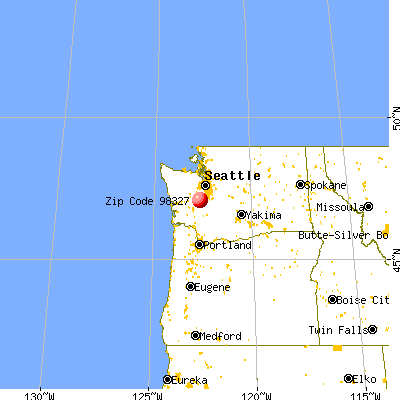


 Nearest zip codes: 98303, 98433, 98430, 98388, 98498, 98516.
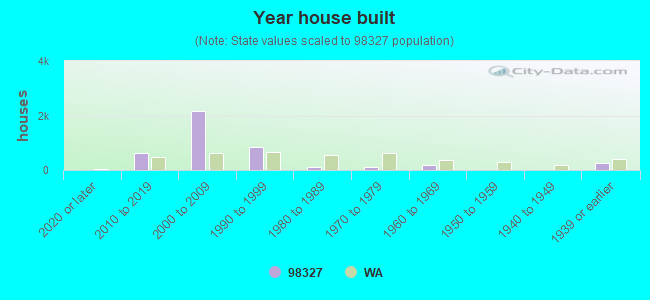


 Based on the data from the years 2002 - 2018 the average number of fires per year is 12. The highest number of reported fires - 33 took place in 2003, and the least - 0 in 2007. The data has a dropping trend.
 When looking into fire subcategories, the most incidents belonged to: Outside Fires (49.5%), and Structure Fires (31.1%).