Averages for the 2020 tax year for zip code 98433, filed in 2021:
Average Adjusted Gross Income (AGI) in 2020: $41,546 (Individual Income Tax Returns)
Here:
$41,546
State:
$99,264
Salary/wage: $40,548 (reported on 99.5% of returns)
Here:
$40,548
State:
$80,347
(% of AGI for various income ranges: 1847.6% for AGIs below $25k, 3533.1% for AGIs $25k-50k, 6283.9% for AGIs $50k-75k, 8794.8% for AGIs $75k-100k, 14862.1% for AGIs $100k-200k)
Taxable interest for individuals: $308 (reported on 8.3% of returns)
This zip code:
$308
Washington:
$2,077
(% of AGI for various income ranges: 0.2% for AGIs below $25k, 1.2% for AGIs $25k-50k, 6.0% for AGIs $50k-75k, 7.2% for AGIs $75k-100k, 22.6% for AGIs $100k-200k)
Ordinary dividends: $884 (reported on 6.2% of returns)
Here:
$884
State:
$10,013
(% of AGI for various income ranges: 1.0% for AGIs below $25k, 1.0% for AGIs $25k-50k, 3.4% for AGIs $50k-75k, 11.4% for AGIs $75k-100k, 117.9% for AGIs $100k-200k)
Net capital gain/loss in AGI: +$2,986 (reported on 9.5% of returns)
Here:
+$2,986
State:
+$40,092
(% of AGI for various income ranges: 4.9% for AGIs $25k-50k, 19.6% for AGIs $50k-75k, 41.4% for AGIs $75k-100k, 660.0% for AGIs $100k-200k)
Profit/loss from business: +$1,012 (reported on 5.4% of returns)
Here:
+$1,012
State:
+$18,312
(% of AGI for various income ranges: 5.2% for AGIs $50k-75k, 86.6% for AGIs $75k-100k, 70.5% for AGIs $100k-200k)
Taxable individual retirement arrangement distribution: $2,367 (reported on 0.5% of returns)
98433:
$2,367
Washington:
$24,221
(% of AGI for various income ranges: 2.4% for AGIs $25k-50k)
Total itemized deductions: $27,050 (reported on 0.7% of returns)
Here:
$27,050
State:
$39,068
(% of AGI for various income ranges: 32.6% for AGIs below $25k, 343.2% for AGIs $100k-200k)
Charity contributions: $6,100 (reported on 0.3% of returns)
Here:
$6,100
State:
$15,331
(% of AGI for various income ranges: 4.1% for AGIs $25k-50k)
Taxes paid: $5,625 (reported on 0.7% of returns)
98433:
$5,625
State:
$7,774
(% of AGI for various income ranges: 118.4% for AGIs $100k-200k)
Earned income credit: $2,872 (reported on 26.5% of returns)
Here:
$2,872
State:
$2,020
(% of AGI for various income ranges: 72.6% for AGIs below $25k, 116.8% for AGIs $25k-50k, 5.9% for AGIs $50k-75k)
Percentage of individuals using paid preparers for their 2020 taxes: 98.3%
Here:
98%
State:
93%
(% for various income ranges: 97.8% for AGIs below $25k, 98.4% for AGIs $25k-50k, 98.8% for AGIs $50k-75k, 100.0% for AGIs $75k-100k, 95.8% for AGIs $100k-200k, 100.0% for AGIs over 200k)
Averages for the 2012 tax year for zip code 98433, filed in 2013:
Average Adjusted Gross Income (AGI) in 2012: $27,758 (Individual Income Tax Returns)
Here:
$27,758
State:
$69,533
Salary/wage: $27,405 (reported on 99.4% of returns)
Here:
$27,405
State:
$57,267
(% of AGI for various income ranges: 100.1% for AGIs below $25k, 99.1% for AGIs $25k-50k, 96.6% for AGIs $50k-75k, 95.8% for AGIs $75k-100k, 90.9% for AGIs $100k-200k)
Taxable interest for individuals: $219 (reported on 10.3% of returns)
This zip code:
$219
Washington:
$1,816
(% of AGI for various income ranges: 0.1% for AGIs $75k-100k, 0.2% for AGIs $100k-200k)
Ordinary dividends: $1,538 (reported on 4.8% of returns)
Here:
$1,538
State:
$8,163
(% of AGI for various income ranges: 0.1% for AGIs $25k-50k, 0.1% for AGIs $50k-75k, 0.3% for AGIs $75k-100k, 1.9% for AGIs $100k-200k)
Net capital gain/loss in AGI: +$1,026 (reported on 3.4% of returns)
Here:
+$1,026
State:
+$21,568
(% of AGI for various income ranges: 0.1% for AGIs $25k-50k, 0.1% for AGIs $50k-75k, 0.7% for AGIs $100k-200k)
Profit/loss from business: +$1,259 (reported on 2.5% of returns)
Here:
+$1,259
State:
+$16,521
(% of AGI for various income ranges: 0.1% for AGIs below $25k, 1.2% for AGIs $25k-50k, 0.4% for AGIs $50k-75k)
Taxable individual retirement arrangement distribution: $4,020 (reported on 0.7% of returns)
98433:
$4,020
Washington:
$18,648
Total itemized deductions: $16,726 (27% of AGI, reported on 4.0% of returns)
Here:
$16,726
State:
$23,872
Here:
26.9% of AGI
State:
18.2% of AGI
(% of AGI for various income ranges: 1.0% for AGIs below $25k, 1.7% for AGIs $25k-50k, 3.5% for AGIs $50k-75k, 4.1% for AGIs $75k-100k, 7.4% for AGIs $100k-200k)
Charity contributions: $3,889 (reported on 2.7% of returns)
Here:
$3,889
State:
$4,465
(% of AGI for various income ranges: 0.2% for AGIs $25k-50k, 1.1% for AGIs $50k-75k, 1.2% for AGIs $100k-200k)
Taxes paid: $4,668 (reported on 3.7% of returns)
98433:
$4,668
State:
$6,400
(% of AGI for various income ranges: 0.2% for AGIs below $25k, 0.5% for AGIs $25k-50k, 0.8% for AGIs $50k-75k, 0.9% for AGIs $75k-100k, 2.2% for AGIs $100k-200k)
Earned income credit: $2,986 (reported on 40.7% of returns)
Here:
$2,986
State:
$2,073
(% of AGI for various income ranges: 9.4% for AGIs below $25k, 4.1% for AGIs $25k-50k)
Percentage of individuals using paid preparers for their 2012 taxes: 30.3%
Here:
30%
State:
43%
(% for various income ranges: 28.6% for AGIs below $25k, 33.2% for AGIs $25k-50k, 29.4% for AGIs $50k-75k, 33.3% for AGIs $75k-100k, 36.4% for AGIs $100k-200k)
Averages for the 2004 tax year for zip code 98433, filed in 2005:
Average Adjusted Gross Income (AGI) in 2004: $20,403 (Individual Income Tax Returns)
Here:
$20,403
State:
$54,331
Salary/wage: $20,520 (reported on 97.9% of returns)
Here:
$20,520
State:
$45,761
(% of AGI for various income ranges: 101.9% for AGIs below $10k, 99.4% for AGIs $10k-25k, 99.0% for AGIs $25k-50k, 97.6% for AGIs $50k-75k, 97.6% for AGIs $75k-100k, 86.4% for AGIs over 100k)
Taxable interest for individuals: $277 (reported on 12.3% of returns)
This zip code:
$277
Washington:
$2,110
(% of AGI for various income ranges: 0.3% for AGIs below $10k, 0.1% for AGIs $10k-25k, 0.1% for AGIs $25k-50k, 0.2% for AGIs $50k-75k, 0.4% for AGIs $75k-100k, 0.6% for AGIs over 100k)
Taxable dividends: $726 (reported on 5.7% of returns)
Here:
$726
State:
$5,879
(% of AGI for various income ranges: 0.1% for AGIs below $10k, 0.1% for AGIs $10k-25k, 0.1% for AGIs $25k-50k, 0.2% for AGIs $50k-75k, 0.5% for AGIs $75k-100k, 1.7% for AGIs over 100k)
Net capital gain/loss: +$1,344 (reported on 3.7% of returns)
Here:
+$1,344
State:
+$15,835
(% of AGI for various income ranges: -0.1% for AGIs below $10k, 0.0% for AGIs $10k-25k, 0.0% for AGIs $25k-50k, 0.0% for AGIs $50k-75k, 0.5% for AGIs $75k-100k, 3.9% for AGIs over 100k)
Profit/loss from business: +$800 (reported on 2.7% of returns)
Here:
+$800
State:
+$13,994
(% of AGI for various income ranges: 0.3% for AGIs below $10k, 0.1% for AGIs $10k-25k, 0.2% for AGIs $25k-50k, -0.0% for AGIs $50k-75k)
IRA payment deduction: $1,840 (reported on 1.1% of returns)
98433:
$1,840
Washington:
$3,001
Total itemized deductions: $14,142 (26% of AGI, reported on 2.9% of returns)
Here:
$14,142
State:
$19,669
Here:
26.3% of AGI
State:
20.7% of AGI
(% of AGI for various income ranges: 0.8% for AGIs $10k-25k, 2.2% for AGIs $25k-50k, 3.4% for AGIs $50k-75k, 4.3% for AGIs $75k-100k, 5.6% for AGIs over 100k)
Charity contributions deductions: $3,200 (5% of AGI, reported on 2.3% of returns)
Here:
$3,200
State:
$3,569
Here:
5.5% of AGI
State:
3.5% of AGI
(% of AGI for various income ranges: 0.0% for AGIs $10k-25k, 0.4% for AGIs $25k-50k, 0.8% for AGIs $50k-75k, 0.7% for AGIs $75k-100k, 1.4% for AGIs over 100k)
Total tax: $1,765 (reported on 48.1% of returns)
98433:
$1,765
State:
$9,065
(% of AGI for various income ranges: 0.5% for AGIs below $10k, 3.1% for AGIs $10k-25k, 2.7% for AGIs $25k-50k, 6.0% for AGIs $50k-75k, 9.0% for AGIs $75k-100k, 15.2% for AGIs over 100k)
Earned income credit: $1,977 (reported on 34.6% of returns)
Here:
$1,977
State:
$1,607
Percentage of individuals using paid preparers for their 2004 taxes: 67.3%
Here:
67%
State:
49%
(% for various income ranges: 73.2% for AGIs below $10k, 66.9% for AGIs $10k-25k, 64.0% for AGIs $25k-50k, 55.4% for AGIs $50k-75k, 46.2% for AGIs $75k-100k, 40.0% for AGIs over 100k)
Household received Food Stamps/SNAP in the past 12 months: 135 Household did not receive Food Stamps/SNAP in the past 12 months: 4,343
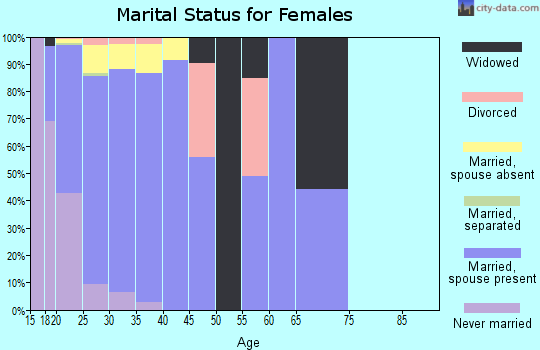
Women who had a birth in the past 12 months: 710 (710 now married, 19 unmarried) Women who did not have a birth in the past 12 months: 4,637 (3,200 now married, 1,403 unmarried)
Housing units in zip code 98433 with a mortgage: 14 Residents with income below the poverty level in 2022:
This zip code:
16.1%
Whole state:
10.0%
Residents with income below 50% of the poverty level in 2022:
This zip code:
6.6%
Whole state:
4.6%
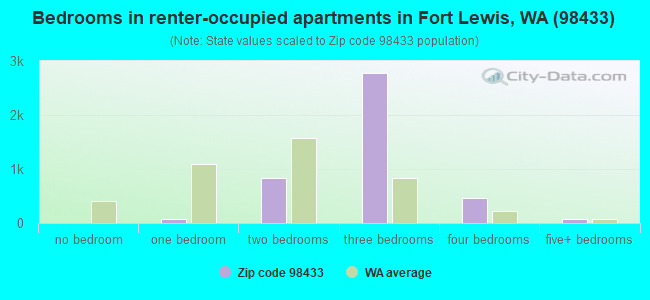
Median number of rooms in apartments:
Here:
5.5
State:
3.9
Notable locations in this zip code not listed on our city pages
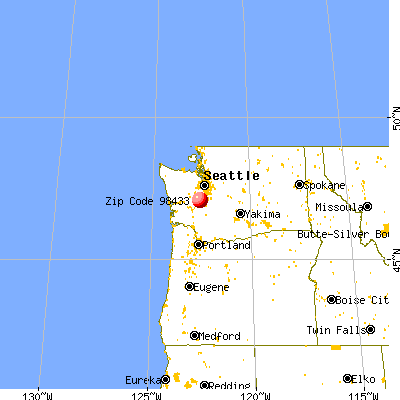
Notable locations in zip code 98433: American Lake Veterans Golf Course (A), Fort Lewis Solo Point Wastewater Treatment Plant (B), US Army Fire Department Fort Lewis (C), Fort Lewis - McChord Fire and Emergency Services Station 104 (D), Madigan Ambulance Service at Madigan Army Medical Center (E), Fort Lewis - McChord Fire and Emergency Services Station 102 (F), Fort Lewis - McChord Fire and Emergency Services Station 101 Headquarters (G), Veterans Administration Puget Sound Health Care System Emergency Medical Services (H). Display/hide their locations on the map
Lakes and swamps: Hanna Lake (A), Simpson Lake (B), Sears Lake (C), Sequalitchew Lake (D), Elliot Marsh (E), Farrell Marsh (F), Hanner Marsh (G), Kennedy Marsh (H). Display/hide their locations on the map
In group quarters: 6,226 (-1 institutionalized population)
Size of family households: 1,077 2-persons, 1,103 3-persons, 1,239 4-persons, 419 5-persons, 271 6-persons, 16 7-or-more-persons
Size of nonfamily households: 215 1-person, 35 2-persons
5,025 married couples with children.
557 single-parent households (67 men, 490 women).
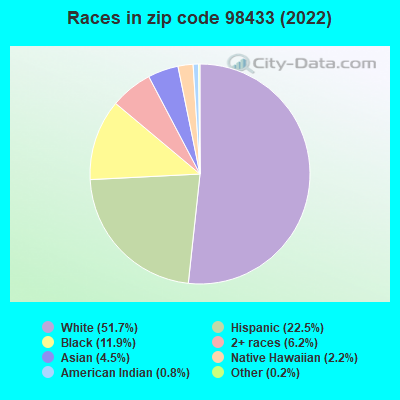
77.0% of residents of 98433 zip code speak English at home.
12.8% of residents speak Spanish at home (72% very well, 27% well, 1% not well).
2.4% of residents speak other Indo-European language at home (76% very well, 23% well, 1% not well).
6.0% of residents speak Asian or Pacific Island language at home (84% very well, 14% well, 2% not well).
0.7% of residents speak other language at home (94% very well, 2% well, 4% not well).
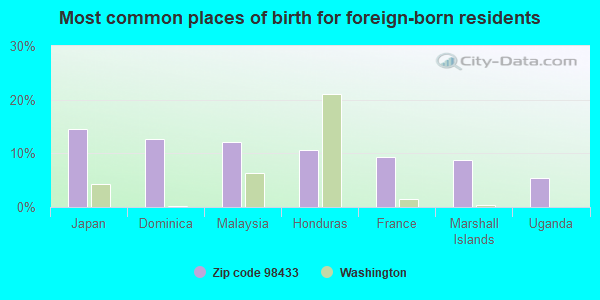
Foreign born population: 1,488 (7.2%) (69.3% of them are naturalized citizens)
This zip code:
7.2%
Whole state:
15.3%
15%Japan
13%Dominica
12%Malaysia
11%Honduras
9%France
9%Marshall Islands
5%Uganda
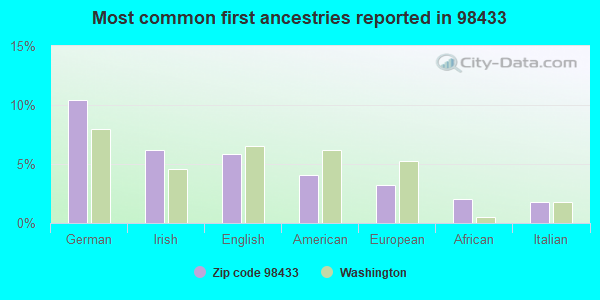
10%German
6%Irish
6%English
4%American
3%European
2%African
2%Italian
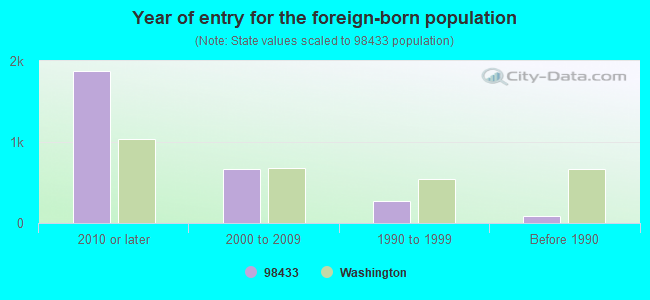
Year of entry for the foreign-born population
1,8802010 or later
6672000 to 2009
2731990 to 1999
92Before 1990
Public elementary/middle schools in in zip code 98433 not listed on the city page:
Facilities with environmental interests located in this zip code:
CLARKMOOR ELEMENTARY SCHOOL (SOUTH DIVISION & LIGGETT in FT LEWIS, WA)
(National Center for Education Statistics) - STATE ID-3178 Organizations: CLOVER PARK SCHOOL DIST 400 (SCHOOL DISTRICT)
ABDUL AZIM KHAN SITE (FT LEWIS BLDGS 1206 & 1210 in FT LEWIS, WA)
(Resource Conservation and Recovery Act (tracking hazardous waste)) Organizations: US EPA (CONTACT/OWNER)
BLOUNT INC CONST DIV MADIGAN (SE COR JACK ST BLDGS 9040AB in FT LEWIS, WA)
(Resource Conservation and Recovery Act (tracking hazardous waste))
Housing units lacking complete kitchen facilities: 0.4%
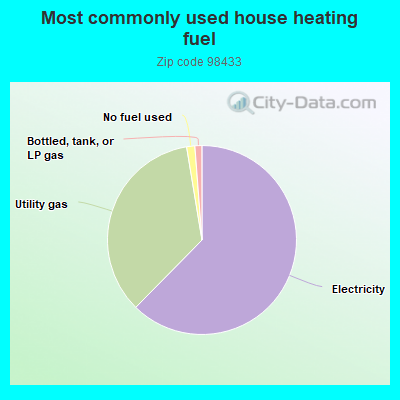
62.3%Electricity
35.0%Utility gas
1.4%No fuel used
1.2%Bottled, tank, or LP gas
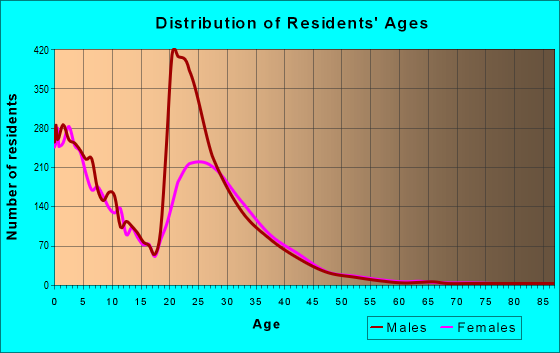
Population in 1990: 27,463.
Place of birth for U.S.-born residents:
This state: 2,314
Northeast: 1,442
Midwest: 2,836
South: 5,971
West: 5,161
9% of the 98433 zip code residents lived in the same house 5 years ago. Out of people who lived in different houses, 9% lived in this county. Out of people who lived in different counties, 50% lived in Washington.
64% of the 98433 zip code residents lived in the same house 1 year ago. Out of people who lived in different houses, 26% moved from this county. Out of people who lived in different houses, 4% moved from different county within same state. Out of people who lived in different houses, 57% moved from different state. Out of people who lived in different houses, 16% moved from abroad.
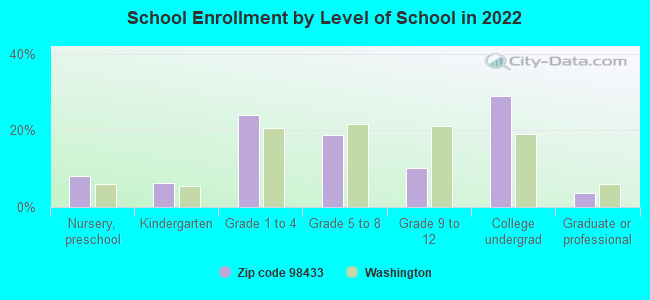
Private vs. public school enrollment:
Students in private schools in grades 1 to 8 (elementary and middle school): 664
Here:
36.9%
Washington:
12.4%
Students in private schools in grades 9 to 12 (high school): 136
Here:
30.9%
Washington:
9.2%
Students in private undergraduate colleges: 220
Here:
18.3%
Washington:
16.5%
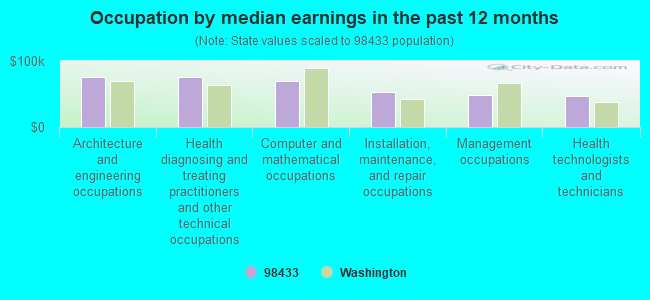
Occupation by median earnings in the past 12 months ($)
76,509Architecture and engineering occupations
76,314Health diagnosing and treating practitioners and other technical occupations
68,981Computer and mathematical occupations
53,194Installation, maintenance, and repair occupations
48,389Management occupations
46,237Health technologists and technicians
Companies with federal contracts located in this zip code (FORT LEWIS, WA):
FORT LEWIS BILLETING FUND (BLDG 2110 UTAH AVE; small business) : $10,169,741 in 168 contractsfrom 2000 to 2006
Contracts for Lodging - Hotel/Motel, Miscellaneous Items, Food Services by Army Signed by year:2000: $671,947; 2001: $951,976; 2002: $1,540,651; 2003: $1,830,964; 2004: $2,560,986; 2005: $1,362,955; 2006: $1,250,262.
Biggest contracts:
$694,512 with Army for Lodging - Hotel/Motel. Signed on 2004-02-10. Completion date: 2004-09-05.
$565,386, same as above.Signed on 2003-07-01. Completion date: 2003-09-30.
$562,180, same as above.Signed on 2001-04-10. Completion date: 2001-09-29.
$561,256, same as above.Signed on 2000-03-10. Completion date: 2000-09-30.
DOL IMD CLASS 9 BRANCH (BLDG 9580) : $654,674 in 3 contractsfrom 2003 to 2005
$345,568 with Defense Logistics Agency for Guns, through 30 mm. Signed on 2003-12-24. Completion date: 2005-02-09.
$211,246, same as above.Signed on 2004-12-01. Completion date: 2005-11-28.
$97,860, same as above.Signed on 2005-04-12. Completion date: 2006-04-05.
LAURA S MARTIN (2335 SO 3RD STREET; small business) : $122,478 in 3 contractsfrom 1999 to 2000
$61,239 with Army for General Health Care Services. Signed on 2000-10-11. Completion date: 2004-09-30.
$61,239 with Army for Nursing Services. Signed on 1999-10-28. Completion date: 2004-09-30.
$0, same as above.Signed on 1999-10-28. Completion date: 2004-09-30.
UNITED STATES DEPARTMENT OF TH (BLDG 2013 B; small business) : $47,306 in 12 contractsfrom 2002 to 2005
Contracts for Food Services, Sets, Kits, Outfits, and Modules, Food Preparation and Serving, Maintenance, Repair or Alteration of Real Property -- Office Buildings, Textile Fabrics, and moreby Army Signed by year:2000: $0; 2001: $0; 2002: $7,061; 2003: $12,895; 2004: $20,950; 2005: $6,400; 2006: $0.
Biggest contracts:
$9,936 with Army for Food Services. Signed on 2003-01-31. Completion date: 2003-01-31.
$9,600 with Army for Sets, Kits, Outfits, and Modules, Food Preparation and Serving. Signed on 2004-07-01. Completion date: 2004-06-30.
$7,061 with Army for Maintenance, Repair or Alteration of Real Property -- Office Buildings. Signed on 2002-10-17. Completion date: 2002-11-17.
$6,400 with Army for Textile Fabrics. Signed on 2005-08-18. Completion date: 2005-08-26.
FORT LEWIS LODGE (BLDG 2111 UTAH AVENUE)
$19,667 with Army for Lodging - Hotel/Motel. Signed on 2006-07-10. Completion date: 2006-07-24.
PEDONE, PAULA (2352 STRYKER AVE; small business) : $18,100 in 4 contractsfrom 2004 to 2005
$18,100 with Army for Chaplain Services. Signed on 2004-11-04. Completion date: 2005-09-30.
$15,200 with Army for Other Professional Services. Signed on 2005-11-09. Completion date: 2006-09-30.
$100, same as above.Signed on 2005-10-20. Completion date: 2006-09-30.
-$15,300, same as above.Signed on 2005-12-12. Completion date: 2006-09-30.
NANCY HAM (8683 BOSTON ST; small business) : $14,590 in 11 contractsfrom 2002 to 2005
Contracts for Chaplain Services by Army Signed by year:2000: $0; 2001: $0; 2002: $600; 2003: $3,265; 2004: $1,365; 2005: $9,360; 2006: $0.
Biggest contracts:
$9,360 with Army for Chaplain Services. Signed on 2005-02-01. Completion date: 2009-01-31.
$855, same as above.Signed on 2003-02-01. Completion date: 2005-08-25.
$750, same as above.Signed on 2004-07-31. Completion date: 2005-08-24.
$655, same as above.Signed on 2003-05-30. Completion date: 2005-08-25.
GOETZ, CHRISTINA M (8686 BALTIMORE STREET; small business)
$9,360 with Army for Chaplain Services. Signed on 2005-02-01. Completion date: 2009-01-31.
THOMAS CONSULTING (2331 S 3RD ST; small business)
$2,525 with Army for Other Professional Services. Signed on 2005-08-18. Completion date: 2005-09-30.
DONALD E DICKSON (5559 N 5TH; small business) : $2,500 in 4 contractsfrom 2002 to 2003
$1,000 with Army for Chaplain Services. Signed on 2002-12-24. Completion date: 2003-01-24.
$600, same as above.Signed on 2003-02-01. Completion date: 2004-11-30.
$500, same as above.Signed on 2003-03-26. Completion date: 2004-11-30.
$400 with Army for Chaplain Services. Taking place in VA. Signed on 2003-04-10. Completion date: 2004-11-30.
Top industries in this zip code by the number of employees in 2005:
Accommodation and Food Services: Food Service Contractors (250-499 employees: 1 establishment)
Health Care and Social Assistance: Vocational Rehabilitation Services (250-499: 1)
Other Services (except Public Administration): General Automotive Repair (100-249: 1, 1-4: 1)
Administrative and Support and Waste Management and Remediation Services: Janitorial Services (100-249: 1)
Finance and Insurance: Credit Unions (50-99: 1, 5-9: 1)
Accommodation and Food Services: Limited-Service Restaurants (50-99: 1)
Finance and Insurance: Commercial Banking (20-49: 2, 1-4: 1)


 Nearest zip codes: 98430, 98498, 98327, 98439, 98467, 98438.


 (Location: 5190 NORTH DIVISON ST, Grades: PK-5)