Athens, Alabama Submit your own pictures of this city and show them to the world
OSM Map
General Map
Google Map
MSN Map
OSM Map
General Map
Google Map
MSN Map
OSM Map
General Map
Google Map
MSN Map
OSM Map
General Map
Google Map
MSN Map
Please wait while loading the map...
Population in 2022: 28,661 (87% urban, 13% rural). Population change since 2000: +51.1%Males: 14,273 Females: 14,388
March 2022 cost of living index in Athens: 83.4 (less than average, U.S. average is 100) Percentage of residents living in poverty in 2022: 13.5%for White Non-Hispanic residents , 18.5% for Black residents , 28.1% for Hispanic or Latino residents , 19.6% for American Indian residents , 100.0% for Native Hawaiian and other Pacific Islander residents , 16.7% for other race residents , 31.8% for two or more races residents )
Profiles of local businesses
Business Search - 14 Million verified businesses
Data:
Median household income ($)
Median household income (% change since 2000)
Household income diversity
Ratio of average income to average house value (%)
Ratio of average income to average rent
Median household income ($) - White
Median household income ($) - Black or African American
Median household income ($) - Asian
Median household income ($) - Hispanic or Latino
Median household income ($) - American Indian and Alaska Native
Median household income ($) - Multirace
Median household income ($) - Other Race
Median household income for houses/condos with a mortgage ($)
Median household income for apartments without a mortgage ($)
Races - White alone (%)
Races - White alone (% change since 2000)
Races - Black alone (%)
Races - Black alone (% change since 2000)
Races - American Indian alone (%)
Races - American Indian alone (% change since 2000)
Races - Asian alone (%)
Races - Asian alone (% change since 2000)
Races - Hispanic (%)
Races - Hispanic (% change since 2000)
Races - Native Hawaiian and Other Pacific Islander alone (%)
Races - Native Hawaiian and Other Pacific Islander alone (% change since 2000)
Races - Two or more races (%)
Races - Two or more races (% change since 2000)
Races - Other race alone (%)
Races - Other race alone (% change since 2000)
Racial diversity
Unemployment (%)
Unemployment (% change since 2000)
Unemployment (%) - White
Unemployment (%) - Black or African American
Unemployment (%) - Asian
Unemployment (%) - Hispanic or Latino
Unemployment (%) - American Indian and Alaska Native
Unemployment (%) - Multirace
Unemployment (%) - Other Race
Population density (people per square mile)
Population - Males (%)
Population - Females (%)
Population - Males (%) - White
Population - Males (%) - Black or African American
Population - Males (%) - Asian
Population - Males (%) - Hispanic or Latino
Population - Males (%) - American Indian and Alaska Native
Population - Males (%) - Multirace
Population - Males (%) - Other Race
Population - Females (%) - White
Population - Females (%) - Black or African American
Population - Females (%) - Asian
Population - Females (%) - Hispanic or Latino
Population - Females (%) - American Indian and Alaska Native
Population - Females (%) - Multirace
Population - Females (%) - Other Race
Coronavirus confirmed cases (Apr 26, 2024)
Deaths caused by coronavirus (Apr 26, 2024)
Coronavirus confirmed cases (per 100k population) (Apr 26, 2024)
Deaths caused by coronavirus (per 100k population) (Apr 26, 2024)
Daily increase in number of cases (Apr 26, 2024)
Weekly increase in number of cases (Apr 26, 2024)
Cases doubled (in days) (Apr 26, 2024)
Hospitalized patients (Apr 18, 2022)
Negative test results (Apr 18, 2022)
Total test results (Apr 18, 2022)
COVID Vaccine doses distributed (per 100k population) (Sep 19, 2023)
COVID Vaccine doses administered (per 100k population) (Sep 19, 2023)
COVID Vaccine doses distributed (Sep 19, 2023)
COVID Vaccine doses administered (Sep 19, 2023)
Likely homosexual households (%)
Likely homosexual households (% change since 2000)
Likely homosexual households - Lesbian couples (%)
Likely homosexual households - Lesbian couples (% change since 2000)
Likely homosexual households - Gay men (%)
Likely homosexual households - Gay men (% change since 2000)
Cost of living index
Median gross rent ($)
Median contract rent ($)
Median monthly housing costs ($)
Median house or condo value ($)
Median house or condo value ($ change since 2000)
Mean house or condo value by units in structure - 1, detached ($)
Mean house or condo value by units in structure - 1, attached ($)
Mean house or condo value by units in structure - 2 ($)
Mean house or condo value by units in structure by units in structure - 3 or 4 ($)
Mean house or condo value by units in structure - 5 or more ($)
Mean house or condo value by units in structure - Boat, RV, van, etc. ($)
Mean house or condo value by units in structure - Mobile home ($)
Median house or condo value ($) - White
Median house or condo value ($) - Black or African American
Median house or condo value ($) - Asian
Median house or condo value ($) - Hispanic or Latino
Median house or condo value ($) - American Indian and Alaska Native
Median house or condo value ($) - Multirace
Median house or condo value ($) - Other Race
Median resident age
Resident age diversity
Median resident age - Males
Median resident age - Females
Median resident age - White
Median resident age - Black or African American
Median resident age - Asian
Median resident age - Hispanic or Latino
Median resident age - American Indian and Alaska Native
Median resident age - Multirace
Median resident age - Other Race
Median resident age - Males - White
Median resident age - Males - Black or African American
Median resident age - Males - Asian
Median resident age - Males - Hispanic or Latino
Median resident age - Males - American Indian and Alaska Native
Median resident age - Males - Multirace
Median resident age - Males - Other Race
Median resident age - Females - White
Median resident age - Females - Black or African American
Median resident age - Females - Asian
Median resident age - Females - Hispanic or Latino
Median resident age - Females - American Indian and Alaska Native
Median resident age - Females - Multirace
Median resident age - Females - Other Race
Commute - mean travel time to work (minutes)
Travel time to work - Less than 5 minutes (%)
Travel time to work - Less than 5 minutes (% change since 2000)
Travel time to work - 5 to 9 minutes (%)
Travel time to work - 5 to 9 minutes (% change since 2000)
Travel time to work - 10 to 19 minutes (%)
Travel time to work - 10 to 19 minutes (% change since 2000)
Travel time to work - 20 to 29 minutes (%)
Travel time to work - 20 to 29 minutes (% change since 2000)
Travel time to work - 30 to 39 minutes (%)
Travel time to work - 30 to 39 minutes (% change since 2000)
Travel time to work - 40 to 59 minutes (%)
Travel time to work - 40 to 59 minutes (% change since 2000)
Travel time to work - 60 to 89 minutes (%)
Travel time to work - 60 to 89 minutes (% change since 2000)
Travel time to work - 90 or more minutes (%)
Travel time to work - 90 or more minutes (% change since 2000)
Marital status - Never married (%)
Marital status - Now married (%)
Marital status - Separated (%)
Marital status - Widowed (%)
Marital status - Divorced (%)
Median family income ($)
Median family income (% change since 2000)
Median non-family income ($)
Median non-family income (% change since 2000)
Median per capita income ($)
Median per capita income (% change since 2000)
Median family income ($) - White
Median family income ($) - Black or African American
Median family income ($) - Asian
Median family income ($) - Hispanic or Latino
Median family income ($) - American Indian and Alaska Native
Median family income ($) - Multirace
Median family income ($) - Other Race
Median year house/condo built
Median year apartment built
Year house built - Built 2005 or later (%)
Year house built - Built 2000 to 2004 (%)
Year house built - Built 1990 to 1999 (%)
Year house built - Built 1980 to 1989 (%)
Year house built - Built 1970 to 1979 (%)
Year house built - Built 1960 to 1969 (%)
Year house built - Built 1950 to 1959 (%)
Year house built - Built 1940 to 1949 (%)
Year house built - Built 1939 or earlier (%)
Average household size
Household density (households per square mile)
Average household size - White
Average household size - Black or African American
Average household size - Asian
Average household size - Hispanic or Latino
Average household size - American Indian and Alaska Native
Average household size - Multirace
Average household size - Other Race
Occupied housing units (%)
Vacant housing units (%)
Owner occupied housing units (%)
Renter occupied housing units (%)
Vacancy status - For rent (%)
Vacancy status - For sale only (%)
Vacancy status - Rented or sold, not occupied (%)
Vacancy status - For seasonal, recreational, or occasional use (%)
Vacancy status - For migrant workers (%)
Vacancy status - Other vacant (%)
Residents with income below the poverty level (%)
Residents with income below 50% of the poverty level (%)
Children below poverty level (%)
Poor families by family type - Married-couple family (%)
Poor families by family type - Male, no wife present (%)
Poor families by family type - Female, no husband present (%)
Poverty status for native-born residents (%)
Poverty status for foreign-born residents (%)
Poverty among high school graduates not in families (%)
Poverty among people who did not graduate high school not in families (%)
Residents with income below the poverty level (%) - White
Residents with income below the poverty level (%) - Black or African American
Residents with income below the poverty level (%) - Asian
Residents with income below the poverty level (%) - Hispanic or Latino
Residents with income below the poverty level (%) - American Indian and Alaska Native
Residents with income below the poverty level (%) - Multirace
Residents with income below the poverty level (%) - Other Race
Air pollution - Air Quality Index (AQI)
Air pollution - CO
Air pollution - NO2
Air pollution - SO2
Air pollution - Ozone
Air pollution - PM10
Air pollution - PM25
Air pollution - Pb
Crime - Murders per 100,000 population
Crime - Rapes per 100,000 population
Crime - Robberies per 100,000 population
Crime - Assaults per 100,000 population
Crime - Burglaries per 100,000 population
Crime - Thefts per 100,000 population
Crime - Auto thefts per 100,000 population
Crime - Arson per 100,000 population
Crime - City-data.com crime index
Crime - Violent crime index
Crime - Property crime index
Crime - Murders per 100,000 population (5 year average)
Crime - Rapes per 100,000 population (5 year average)
Crime - Robberies per 100,000 population (5 year average)
Crime - Assaults per 100,000 population (5 year average)
Crime - Burglaries per 100,000 population (5 year average)
Crime - Thefts per 100,000 population (5 year average)
Crime - Auto thefts per 100,000 population (5 year average)
Crime - Arson per 100,000 population (5 year average)
Crime - City-data.com crime index (5 year average)
Crime - Violent crime index (5 year average)
Crime - Property crime index (5 year average)
1996 Presidential Elections Results (%) - Democratic Party (Clinton)
1996 Presidential Elections Results (%) - Republican Party (Dole)
1996 Presidential Elections Results (%) - Other
2000 Presidential Elections Results (%) - Democratic Party (Gore)
2000 Presidential Elections Results (%) - Republican Party (Bush)
2000 Presidential Elections Results (%) - Other
2004 Presidential Elections Results (%) - Democratic Party (Kerry)
2004 Presidential Elections Results (%) - Republican Party (Bush)
2004 Presidential Elections Results (%) - Other
2008 Presidential Elections Results (%) - Democratic Party (Obama)
2008 Presidential Elections Results (%) - Republican Party (McCain)
2008 Presidential Elections Results (%) - Other
2012 Presidential Elections Results (%) - Democratic Party (Obama)
2012 Presidential Elections Results (%) - Republican Party (Romney)
2012 Presidential Elections Results (%) - Other
2016 Presidential Elections Results (%) - Democratic Party (Clinton)
2016 Presidential Elections Results (%) - Republican Party (Trump)
2016 Presidential Elections Results (%) - Other
2020 Presidential Elections Results (%) - Democratic Party (Biden)
2020 Presidential Elections Results (%) - Republican Party (Trump)
2020 Presidential Elections Results (%) - Other
Ancestries Reported - Arab (%)
Ancestries Reported - Czech (%)
Ancestries Reported - Danish (%)
Ancestries Reported - Dutch (%)
Ancestries Reported - English (%)
Ancestries Reported - French (%)
Ancestries Reported - French Canadian (%)
Ancestries Reported - German (%)
Ancestries Reported - Greek (%)
Ancestries Reported - Hungarian (%)
Ancestries Reported - Irish (%)
Ancestries Reported - Italian (%)
Ancestries Reported - Lithuanian (%)
Ancestries Reported - Norwegian (%)
Ancestries Reported - Polish (%)
Ancestries Reported - Portuguese (%)
Ancestries Reported - Russian (%)
Ancestries Reported - Scotch-Irish (%)
Ancestries Reported - Scottish (%)
Ancestries Reported - Slovak (%)
Ancestries Reported - Subsaharan African (%)
Ancestries Reported - Swedish (%)
Ancestries Reported - Swiss (%)
Ancestries Reported - Ukrainian (%)
Ancestries Reported - United States (%)
Ancestries Reported - Welsh (%)
Ancestries Reported - West Indian (%)
Ancestries Reported - Other (%)
Educational Attainment - No schooling completed (%)
Educational Attainment - Less than high school (%)
Educational Attainment - High school or equivalent (%)
Educational Attainment - Less than 1 year of college (%)
Educational Attainment - 1 or more years of college (%)
Educational Attainment - Associate degree (%)
Educational Attainment - Bachelor's degree (%)
Educational Attainment - Master's degree (%)
Educational Attainment - Professional school degree (%)
Educational Attainment - Doctorate degree (%)
School Enrollment - Nursery, preschool (%)
School Enrollment - Kindergarten (%)
School Enrollment - Grade 1 to 4 (%)
School Enrollment - Grade 5 to 8 (%)
School Enrollment - Grade 9 to 12 (%)
School Enrollment - College undergrad (%)
School Enrollment - Graduate or professional (%)
School Enrollment - Not enrolled in school (%)
School enrollment - Public schools (%)
School enrollment - Private schools (%)
School enrollment - Not enrolled (%)
Median number of rooms in houses and condos
Median number of rooms in apartments
Housing units lacking complete plumbing facilities (%)
Housing units lacking complete kitchen facilities (%)
Density of houses
Urban houses (%)
Rural houses (%)
Households with people 60 years and over (%)
Households with people 65 years and over (%)
Households with people 75 years and over (%)
Households with one or more nonrelatives (%)
Households with no nonrelatives (%)
Population in households (%)
Family households (%)
Nonfamily households (%)
Population in families (%)
Family households with own children (%)
Median number of bedrooms in owner occupied houses
Mean number of bedrooms in owner occupied houses
Median number of bedrooms in renter occupied houses
Mean number of bedrooms in renter occupied houses
Median number of vehichles in owner occupied houses
Mean number of vehichles in owner occupied houses
Median number of vehichles in renter occupied houses
Mean number of vehichles in renter occupied houses
Mortgage status - with mortgage (%)
Mortgage status - with second mortgage (%)
Mortgage status - with home equity loan (%)
Mortgage status - with both second mortgage and home equity loan (%)
Mortgage status - without a mortgage (%)
Average family size
Average family size - White
Average family size - Black or African American
Average family size - Asian
Average family size - Hispanic or Latino
Average family size - American Indian and Alaska Native
Average family size - Multirace
Average family size - Other Race
Geographical mobility - Same house 1 year ago (%)
Geographical mobility - Moved within same county (%)
Geographical mobility - Moved from different county within same state (%)
Geographical mobility - Moved from different state (%)
Geographical mobility - Moved from abroad (%)
Place of birth - Born in state of residence (%)
Place of birth - Born in other state (%)
Place of birth - Native, outside of US (%)
Place of birth - Foreign born (%)
Housing units in structures - 1, detached (%)
Housing units in structures - 1, attached (%)
Housing units in structures - 2 (%)
Housing units in structures - 3 or 4 (%)
Housing units in structures - 5 to 9 (%)
Housing units in structures - 10 to 19 (%)
Housing units in structures - 20 to 49 (%)
Housing units in structures - 50 or more (%)
Housing units in structures - Mobile home (%)
Housing units in structures - Boat, RV, van, etc. (%)
House/condo owner moved in on average (years ago)
Renter moved in on average (years ago)
Year householder moved into unit - Moved in 1999 to March 2000 (%)
Year householder moved into unit - Moved in 1995 to 1998 (%)
Year householder moved into unit - Moved in 1990 to 1994 (%)
Year householder moved into unit - Moved in 1980 to 1989 (%)
Year householder moved into unit - Moved in 1970 to 1979 (%)
Year householder moved into unit - Moved in 1969 or earlier (%)
Means of transportation to work - Drove car alone (%)
Means of transportation to work - Carpooled (%)
Means of transportation to work - Public transportation (%)
Means of transportation to work - Bus or trolley bus (%)
Means of transportation to work - Streetcar or trolley car (%)
Means of transportation to work - Subway or elevated (%)
Means of transportation to work - Railroad (%)
Means of transportation to work - Ferryboat (%)
Means of transportation to work - Taxicab (%)
Means of transportation to work - Motorcycle (%)
Means of transportation to work - Bicycle (%)
Means of transportation to work - Walked (%)
Means of transportation to work - Other means (%)
Working at home (%)
Industry diversity
Most Common Industries - Agriculture, forestry, fishing and hunting, and mining (%)
Most Common Industries - Agriculture, forestry, fishing and hunting (%)
Most Common Industries - Mining, quarrying, and oil and gas extraction (%)
Most Common Industries - Construction (%)
Most Common Industries - Manufacturing (%)
Most Common Industries - Wholesale trade (%)
Most Common Industries - Retail trade (%)
Most Common Industries - Transportation and warehousing, and utilities (%)
Most Common Industries - Transportation and warehousing (%)
Most Common Industries - Utilities (%)
Most Common Industries - Information (%)
Most Common Industries - Finance and insurance, and real estate and rental and leasing (%)
Most Common Industries - Finance and insurance (%)
Most Common Industries - Real estate and rental and leasing (%)
Most Common Industries - Professional, scientific, and management, and administrative and waste management services (%)
Most Common Industries - Professional, scientific, and technical services (%)
Most Common Industries - Management of companies and enterprises (%)
Most Common Industries - Administrative and support and waste management services (%)
Most Common Industries - Educational services, and health care and social assistance (%)
Most Common Industries - Educational services (%)
Most Common Industries - Health care and social assistance (%)
Most Common Industries - Arts, entertainment, and recreation, and accommodation and food services (%)
Most Common Industries - Arts, entertainment, and recreation (%)
Most Common Industries - Accommodation and food services (%)
Most Common Industries - Other services, except public administration (%)
Most Common Industries - Public administration (%)
Occupation diversity
Most Common Occupations - Management, business, science, and arts occupations (%)
Most Common Occupations - Management, business, and financial occupations (%)
Most Common Occupations - Management occupations (%)
Most Common Occupations - Business and financial operations occupations (%)
Most Common Occupations - Computer, engineering, and science occupations (%)
Most Common Occupations - Computer and mathematical occupations (%)
Most Common Occupations - Architecture and engineering occupations (%)
Most Common Occupations - Life, physical, and social science occupations (%)
Most Common Occupations - Education, legal, community service, arts, and media occupations (%)
Most Common Occupations - Community and social service occupations (%)
Most Common Occupations - Legal occupations (%)
Most Common Occupations - Education, training, and library occupations (%)
Most Common Occupations - Arts, design, entertainment, sports, and media occupations (%)
Most Common Occupations - Healthcare practitioners and technical occupations (%)
Most Common Occupations - Health diagnosing and treating practitioners and other technical occupations (%)
Most Common Occupations - Health technologists and technicians (%)
Most Common Occupations - Service occupations (%)
Most Common Occupations - Healthcare support occupations (%)
Most Common Occupations - Protective service occupations (%)
Most Common Occupations - Fire fighting and prevention, and other protective service workers including supervisors (%)
Most Common Occupations - Law enforcement workers including supervisors (%)
Most Common Occupations - Food preparation and serving related occupations (%)
Most Common Occupations - Building and grounds cleaning and maintenance occupations (%)
Most Common Occupations - Personal care and service occupations (%)
Most Common Occupations - Sales and office occupations (%)
Most Common Occupations - Sales and related occupations (%)
Most Common Occupations - Office and administrative support occupations (%)
Most Common Occupations - Natural resources, construction, and maintenance occupations (%)
Most Common Occupations - Farming, fishing, and forestry occupations (%)
Most Common Occupations - Construction and extraction occupations (%)
Most Common Occupations - Installation, maintenance, and repair occupations (%)
Most Common Occupations - Production, transportation, and material moving occupations (%)
Most Common Occupations - Production occupations (%)
Most Common Occupations - Transportation occupations (%)
Most Common Occupations - Material moving occupations (%)
People in Group quarters - Institutionalized population (%)
People in Group quarters - Correctional institutions (%)
People in Group quarters - Federal prisons and detention centers (%)
People in Group quarters - Halfway houses (%)
People in Group quarters - Local jails and other confinement facilities (including police lockups) (%)
People in Group quarters - Military disciplinary barracks (%)
People in Group quarters - State prisons (%)
People in Group quarters - Other types of correctional institutions (%)
People in Group quarters - Nursing homes (%)
People in Group quarters - Hospitals/wards, hospices, and schools for the handicapped (%)
People in Group quarters - Hospitals/wards and hospices for chronically ill (%)
People in Group quarters - Hospices or homes for chronically ill (%)
People in Group quarters - Military hospitals or wards for chronically ill (%)
People in Group quarters - Other hospitals or wards for chronically ill (%)
People in Group quarters - Hospitals or wards for drug/alcohol abuse (%)
People in Group quarters - Mental (Psychiatric) hospitals or wards (%)
People in Group quarters - Schools, hospitals, or wards for the mentally retarded (%)
People in Group quarters - Schools, hospitals, or wards for the physically handicapped (%)
People in Group quarters - Institutions for the deaf (%)
People in Group quarters - Institutions for the blind (%)
People in Group quarters - Orthopedic wards and institutions for the physically handicapped (%)
People in Group quarters - Wards in general hospitals for patients who have no usual home elsewhere (%)
People in Group quarters - Wards in military hospitals for patients who have no usual home elsewhere (%)
People in Group quarters - Juvenile institutions (%)
People in Group quarters - Long-term care (%)
People in Group quarters - Homes for abused, dependent, and neglected children (%)
People in Group quarters - Residential treatment centers for emotionally disturbed children (%)
People in Group quarters - Training schools for juvenile delinquents (%)
People in Group quarters - Short-term care, detention or diagnostic centers for delinquent children (%)
People in Group quarters - Type of juvenile institution unknown (%)
People in Group quarters - Noninstitutionalized population (%)
People in Group quarters - College dormitories (includes college quarters off campus) (%)
People in Group quarters - Military quarters (%)
People in Group quarters - On base (%)
People in Group quarters - Barracks, unaccompanied personnel housing (UPH), (Enlisted/Officer), ;and similar group living quarters for military personnel (%)
People in Group quarters - Transient quarters for temporary residents (%)
People in Group quarters - Military ships (%)
People in Group quarters - Group homes (%)
People in Group quarters - Homes or halfway houses for drug/alcohol abuse (%)
People in Group quarters - Homes for the mentally ill (%)
People in Group quarters - Homes for the mentally retarded (%)
People in Group quarters - Homes for the physically handicapped (%)
People in Group quarters - Other group homes (%)
People in Group quarters - Religious group quarters (%)
People in Group quarters - Dormitories (%)
People in Group quarters - Agriculture workers' dormitories on farms (%)
People in Group quarters - Job Corps and vocational training facilities (%)
People in Group quarters - Other workers' dormitories (%)
People in Group quarters - Crews of maritime vessels (%)
People in Group quarters - Other nonhousehold living situations (%)
People in Group quarters - Other noninstitutional group quarters (%)
Residents speaking English at home (%)
Residents speaking English at home - Born in the United States (%)
Residents speaking English at home - Native, born elsewhere (%)
Residents speaking English at home - Foreign born (%)
Residents speaking Spanish at home (%)
Residents speaking Spanish at home - Born in the United States (%)
Residents speaking Spanish at home - Native, born elsewhere (%)
Residents speaking Spanish at home - Foreign born (%)
Residents speaking other language at home (%)
Residents speaking other language at home - Born in the United States (%)
Residents speaking other language at home - Native, born elsewhere (%)
Residents speaking other language at home - Foreign born (%)
Class of Workers - Employee of private company (%)
Class of Workers - Self-employed in own incorporated business (%)
Class of Workers - Private not-for-profit wage and salary workers (%)
Class of Workers - Local government workers (%)
Class of Workers - State government workers (%)
Class of Workers - Federal government workers (%)
Class of Workers - Self-employed workers in own not incorporated business and Unpaid family workers (%)
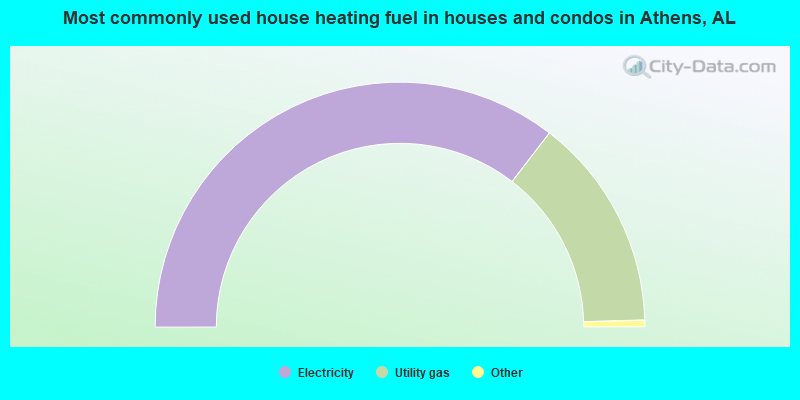
House heating fuel used in houses and condos - Utility gas (%)
House heating fuel used in houses and condos - Bottled, tank, or LP gas (%)
House heating fuel used in houses and condos - Electricity (%)
House heating fuel used in houses and condos - Fuel oil, kerosene, etc. (%)
House heating fuel used in houses and condos - Coal or coke (%)
House heating fuel used in houses and condos - Wood (%)
House heating fuel used in houses and condos - Solar energy (%)
House heating fuel used in houses and condos - Other fuel (%)
House heating fuel used in houses and condos - No fuel used (%)
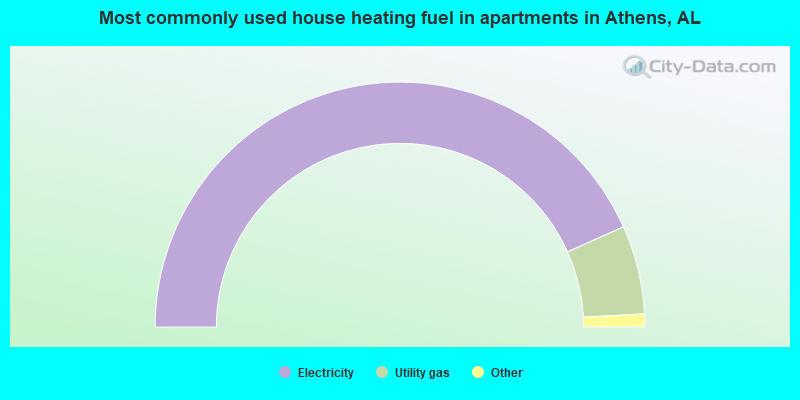
House heating fuel used in apartments - Utility gas (%)
House heating fuel used in apartments - Bottled, tank, or LP gas (%)
House heating fuel used in apartments - Electricity (%)
House heating fuel used in apartments - Fuel oil, kerosene, etc. (%)
House heating fuel used in apartments - Coal or coke (%)
House heating fuel used in apartments - Wood (%)
House heating fuel used in apartments - Solar energy (%)
House heating fuel used in apartments - Other fuel (%)
House heating fuel used in apartments - No fuel used (%)
Armed forces status - In Armed Forces (%)
Armed forces status - Civilian (%)
Armed forces status - Civilian - Veteran (%)
Armed forces status - Civilian - Nonveteran (%)
Fatal accidents locations in years 2005-2021
Fatal accidents locations in 2005
Fatal accidents locations in 2006
Fatal accidents locations in 2007
Fatal accidents locations in 2008
Fatal accidents locations in 2009
Fatal accidents locations in 2010
Fatal accidents locations in 2011
Fatal accidents locations in 2012
Fatal accidents locations in 2013
Fatal accidents locations in 2014
Fatal accidents locations in 2015
Fatal accidents locations in 2016
Fatal accidents locations in 2017
Fatal accidents locations in 2018
Fatal accidents locations in 2019
Fatal accidents locations in 2020
Fatal accidents locations in 2021
Alcohol use - People drinking some alcohol every month (%)
Alcohol use - People not drinking at all (%)
Alcohol use - Average days/month drinking alcohol
Alcohol use - Average drinks/week
Alcohol use - Average days/year people drink much
Audiometry - Average condition of hearing (%)
Audiometry - People that can hear a whisper from across a quiet room (%)
Audiometry - People that can hear normal voice from across a quiet room (%)
Audiometry - Ears ringing, roaring, buzzing (%)
Audiometry - Had a job exposure to loud noise (%)
Audiometry - Had off-work exposure to loud noise (%)
Blood Pressure & Cholesterol - Has high blood pressure (%)
Blood Pressure & Cholesterol - Checking blood pressure at home (%)
Blood Pressure & Cholesterol - Frequently checking blood cholesterol (%)
Blood Pressure & Cholesterol - Has high cholesterol level (%)
Consumer Behavior - Money monthly spent on food at supermarket/grocery store
Consumer Behavior - Money monthly spent on food at other stores
Consumer Behavior - Money monthly spent on eating out
Consumer Behavior - Money monthly spent on carryout/delivered foods
Consumer Behavior - Income spent on food at supermarket/grocery store (%)
Consumer Behavior - Income spent on food at other stores (%)
Consumer Behavior - Income spent on eating out (%)
Consumer Behavior - Income spent on carryout/delivered foods (%)
Current Health Status - General health condition (%)
Current Health Status - Blood donors (%)
Current Health Status - Has blood ever tested for HIV virus (%)
Current Health Status - Left-handed people (%)
Dermatology - People using sunscreen (%)
Diabetes - Diabetics (%)
Diabetes - Had a blood test for high blood sugar (%)
Diabetes - People taking insulin (%)
Diet Behavior & Nutrition - Diet health (%)
Diet Behavior & Nutrition - Milk product consumption (# of products/month)
Diet Behavior & Nutrition - Meals not home prepared (#/week)
Diet Behavior & Nutrition - Meals from fast food or pizza place (#/week)
Diet Behavior & Nutrition - Ready-to-eat foods (#/month)
Diet Behavior & Nutrition - Frozen meals/pizza (#/month)
Drug Use - People that ever used marijuana or hashish (%)
Drug Use - Ever used hard drugs (%)
Drug Use - Ever used any form of cocaine (%)
Drug Use - Ever used heroin (%)
Drug Use - Ever used methamphetamine (%)
Health Insurance - People covered by health insurance (%)
Kidney Conditions-Urology - Avg. # of times urinating at night
Medical Conditions - People with asthma (%)
Medical Conditions - People with anemia (%)
Medical Conditions - People with psoriasis (%)
Medical Conditions - People with overweight (%)
Medical Conditions - Elderly people having difficulties in thinking or remembering (%)
Medical Conditions - People who ever received blood transfusion (%)
Medical Conditions - People having trouble seeing even with glass/contacts (%)
Medical Conditions - People with arthritis (%)
Medical Conditions - People with gout (%)
Medical Conditions - People with congestive heart failure (%)
Medical Conditions - People with coronary heart disease (%)
Medical Conditions - People with angina pectoris (%)
Medical Conditions - People who ever had heart attack (%)
Medical Conditions - People who ever had stroke (%)
Medical Conditions - People with emphysema (%)
Medical Conditions - People with thyroid problem (%)
Medical Conditions - People with chronic bronchitis (%)
Medical Conditions - People with any liver condition (%)
Medical Conditions - People who ever had cancer or malignancy (%)
Mental Health - People who have little interest in doing things (%)
Mental Health - People feeling down, depressed, or hopeless (%)
Mental Health - People who have trouble sleeping or sleeping too much (%)
Mental Health - People feeling tired or having little energy (%)
Mental Health - People with poor appetite or overeating (%)
Mental Health - People feeling bad about themself (%)
Mental Health - People who have trouble concentrating on things (%)
Mental Health - People moving or speaking slowly or too fast (%)
Mental Health - People having thoughts they would be better off dead (%)
Oral Health - Average years since last visit a dentist
Oral Health - People embarrassed because of mouth (%)
Oral Health - People with gum disease (%)
Oral Health - General health of teeth and gums (%)
Oral Health - Average days a week using dental floss/device
Oral Health - Average days a week using mouthwash for dental problem
Oral Health - Average number of teeth
Pesticide Use - Households using pesticides to control insects (%)
Pesticide Use - Households using pesticides to kill weeds (%)
Physical Activity - People doing vigorous-intensity work activities (%)
Physical Activity - People doing moderate-intensity work activities (%)
Physical Activity - People walking or bicycling (%)
Physical Activity - People doing vigorous-intensity recreational activities (%)
Physical Activity - People doing moderate-intensity recreational activities (%)
Physical Activity - Average hours a day doing sedentary activities
Physical Activity - Average hours a day watching TV or videos
Physical Activity - Average hours a day using computer
Physical Functioning - People having limitations keeping them from working (%)
Physical Functioning - People limited in amount of work they can do (%)
Physical Functioning - People that need special equipment to walk (%)
Physical Functioning - People experiencing confusion/memory problems (%)
Physical Functioning - People requiring special healthcare equipment (%)
Prescription Medications - Average number of prescription medicines taking
Preventive Aspirin Use - Adults 40+ taking low-dose aspirin (%)
Reproductive Health - Vaginal deliveries (%)
Reproductive Health - Cesarean deliveries (%)
Reproductive Health - Deliveries resulted in a live birth (%)
Reproductive Health - Pregnancies resulted in a delivery (%)
Reproductive Health - Women breastfeeding newborns (%)
Reproductive Health - Women that had a hysterectomy (%)
Reproductive Health - Women that had both ovaries removed (%)
Reproductive Health - Women that have ever taken birth control pills (%)
Reproductive Health - Women taking birth control pills (%)
Reproductive Health - Women that have ever used Depo-Provera or injectables (%)
Reproductive Health - Women that have ever used female hormones (%)
Sexual Behavior - People 18+ that ever had sex (vaginal, anal, or oral) (%)
Sexual Behavior - Males 18+ that ever had vaginal sex with a woman (%)
Sexual Behavior - Males 18+ that ever performed oral sex on a woman (%)
Sexual Behavior - Males 18+ that ever had anal sex with a woman (%)
Sexual Behavior - Males 18+ that ever had any sex with a man (%)
Sexual Behavior - Females 18+ that ever had vaginal sex with a man (%)
Sexual Behavior - Females 18+ that ever performed oral sex on a man (%)
Sexual Behavior - Females 18+ that ever had anal sex with a man (%)
Sexual Behavior - Females 18+ that ever had any kind of sex with a woman (%)
Sexual Behavior - Average age people first had sex
Sexual Behavior - Average number of female sex partners in lifetime (males 18+)
Sexual Behavior - Average number of female vaginal sex partners in lifetime (males 18+)
Sexual Behavior - Average age people first performed oral sex on a woman (18+)
Sexual Behavior - Average number of woman performed oral sex on in lifetime (18+)
Sexual Behavior - Average number of male sex partners in lifetime (males 18+)
Sexual Behavior - Average number of male anal sex partners in lifetime (males 18+)
Sexual Behavior - Average age people first performed oral sex on a man (18+)
Sexual Behavior - Average number of male oral sex partners in lifetime (18+)
Sexual Behavior - People using protection when performing oral sex (%)
Sexual Behavior - Average number of times people have vaginal or anal sex a year
Sexual Behavior - People having sex without condom (%)
Sexual Behavior - Average number of male sex partners in lifetime (females 18+)
Sexual Behavior - Average number of male vaginal sex partners in lifetime (females 18+)
Sexual Behavior - Average number of female sex partners in lifetime (females 18+)
Sexual Behavior - Circumcised males 18+ (%)
Sleep Disorders - Average hours sleeping at night
Sleep Disorders - People that has trouble sleeping (%)
Smoking-Cigarette Use - People smoking cigarettes (%)
Taste & Smell - People 40+ having problems with smell (%)
Taste & Smell - People 40+ having problems with taste (%)
Taste & Smell - People 40+ that ever had wisdom teeth removed (%)
Taste & Smell - People 40+ that ever had tonsils teeth removed (%)
Taste & Smell - People 40+ that ever had a loss of consciousness because of a head injury (%)
Taste & Smell - People 40+ that ever had a broken nose or other serious injury to face or skull (%)
Taste & Smell - People 40+ that ever had two or more sinus infections (%)
Weight - Average height (inches)
Weight - Average weight (pounds)
Weight - Average BMI
Weight - People that are obese (%)
Weight - People that ever were obese (%)
Weight - People trying to lose weight (%)
18,906 67.9% White alone 5,095 18.3% Black alone 2,801 10.1% Hispanic 936 3.4% Two or more races 225 0.8% Asian alone 66 0.2% American Indian alone 16 0.06% Native Hawaiian and Other
Officers per 1,000 residents here:
1.63Alabama average:
2.40
Latest news from Athens, AL collected exclusively by city-data.com from local newspapers, TV, and radio stations
Ancestries: American (22.2%), English (11.6%), Irish (6.4%), German (5.0%), Italian (2.0%), Scotch-Irish (1.6%).
Current Local Time:
Land area: 39.3 square miles.
Population density: 729 people per square mile (low).
1,206 residents are foreign born (3.4% Latin America , 0.6% Asia ).
This city:
4.3%Alabama:
3.5%
Median real estate property taxes paid for housing units with mortgages in 2022: $776 (0.3%)Median real estate property taxes paid for housing units with no mortgage in 2022: $891 (0.3%)
Nearest city with pop. 50,000+: Decatur, AL
Nearest city with pop. 200,000+: Birmingham, AL
Nearest city with pop. 1,000,000+: Chicago, IL
Nearest cities:
Mooresville, AL (3.5 miles),
Latitude: 34.79 N, Longitude: 86.97 W
Daytime population change due to commuting: +2,263 (+8.1%)Workers who live and work in this city: 5,774 (44.6%)
Single-family new house construction building permits:
2022: 473 buildings , average cost: $268,3002021: 466 buildings , average cost: $275,6002020: 370 buildings , average cost: $229,4002019: 276 buildings , average cost: $214,3002018: 155 buildings , average cost: $198,6002017: 159 buildings , average cost: $181,7002016: 111 buildings , average cost: $197,1002015: 104 buildings , average cost: $198,7002014: 80 buildings , average cost: $197,1002013: 83 buildings , average cost: $211,9002012: 82 buildings , average cost: $186,8002011: 93 buildings , average cost: $187,4002010: 130 buildings , average cost: $187,4002009: 81 buildings , average cost: $220,2002008: 106 buildings , average cost: $205,4002007: 136 buildings , average cost: $194,1002006: 219 buildings , average cost: $172,3002005: 281 buildings , average cost: $126,2002004: 152 buildings , average cost: $136,4002003: 97 buildings , average cost: $138,7002002: 90 buildings , average cost: $138,3002001: 103 buildings , average cost: $144,0002000: 102 buildings , average cost: $152,4001999: 161 buildings , average cost: $98,4001998: 132 buildings , average cost: $126,1001997: 120 buildings , average cost: $109,000Unemployment in December 2023:
Population change in the 1990s: +1,658 (+9.6%).
Most common occupations in Athens, AL (%)
Both Males Females
Other production occupations, including supervisors (6.9%)
Other management occupations, except farmers and farm managers (5.0%)
Preschool, kindergarten, elementary, and middle school teachers (3.9%)
Metal workers and plastic workers (3.8%)
Laborers and material movers, hand (3.6%)
Building and grounds cleaning and maintenance occupations (3.5%)
Other sales and related occupations, including supervisors (3.4%)
Other production occupations, including supervisors (8.0%)
Other management occupations, except farmers and farm managers (6.5%)
Metal workers and plastic workers (5.9%)
Laborers and material movers, hand (4.4%)
Electrical equipment mechanics and other installation, maintenance, and repair workers, including supervisors (4.4%)
Engineers (4.2%)
Computer specialists (3.4%)
Preschool, kindergarten, elementary, and middle school teachers (7.1%)
Other production occupations, including supervisors (5.6%)
Cashiers (5.1%)
Secretaries and administrative assistants (4.7%)
Other office and administrative support workers, including supervisors (4.2%)
Building and grounds cleaning and maintenance occupations (4.2%)
Retail sales workers, except cashiers (3.8%)
Tornado activity:
Athens-area historical tornado activity is slightly above Alabama state average. It is 141% greater than the overall U.S. average.
On 4/3/1974, a category F5 (max. wind speeds 261-318 mph) tornado 7.7 miles away from the Athens city center killed 16 people and injured 190 people .
On 4/3/1974, a category F5 tornado 15.6 miles away from the city center killed 28 people and injured 267 people .
Earthquake activity:
Athens-area historical earthquake activity is significantly above Alabama state average. It is 182% greater than the overall U.S. average. On 4/29/2003 at 08:59:39, a magnitude 4.9 (4.4 MB, 4.6 MW, 4.9 LG, Class: Light, Intensity: IV - V) earthquake occurred 79.0 miles away from the city center On 1/18/1999 at 07:00:53, a magnitude 4.8 (4.8 MB, 4.0 LG, Depth: 0.6 mi) earthquake occurred 97.2 miles away from Athens center On 4/29/2003 at 08:59:39, a magnitude 4.6 (4.6 MW, Depth: 12.3 mi) earthquake occurred 78.9 miles away from the city center On 4/18/2008 at 09:36:59, a magnitude 5.4 (5.1 MB, 4.8 MS, 5.4 MW, 5.2 MW, Class: Moderate, Intensity: VI - VII) earthquake occurred 258.4 miles away from the city center On 6/24/1975 at 11:11:36, a magnitude 4.5 (4.5 MB) earthquake occurred 89.2 miles away from Athens center On 3/25/1976 at 00:41:20, a magnitude 5.0 (4.9 MB, 5.0 LG) earthquake occurred 198.6 miles away from the city center Magnitude types: regional Lg-wave magnitude (LG), body-wave magnitude (MB), surface-wave magnitude (MS), moment magnitude (MW) Natural disasters: The number of natural disasters in Limestone County (18) is near the US average (15).Major Disasters (Presidential) Declared: 11Emergencies Declared: 5Floods: 8, Storms: 8, Tornadoes: 7, Hurricanes: 3, Winds: 3, Freezes: 2, Winter Storms: 2, Drought: 1, Ice Storm: 1, Snowfall: 1, Other: 1 (Note: some incidents may be assigned to more than one category). Hospitals and medical centers in Athens: ATHENS-LIMESTONE HOSPITAL (Government - Hospital District or Authority, provides emergency services, 700 WEST MARKET STREET) HOSPICE OF LIMESTONE COUNTY (405 SOUTH MARION P O BOX 626) ATHENS REHABILITATION CENTER AND SENIOR CARE (611 WEST MARKET STREET)
LIMESTONE HEALTH FACILITY (1600 WEST HOBBS STREET)
ATHENS DIALYSIS (15953 ATHENS LIMESTONE DRIVE)
LIMESTONE COUNTY DIALYSIS (16236 LUCAS FERRY ROAD)
ATHENS-LIMESTONE HOMECARE (1428 FREEMAN AVENUE)
LIMESTONE COUNTY HOME CARE (20371 CLYDE MABRY DRIVE)
Heliports located in Athens: Operable nuclear power plants near Athens:
15 miles: Browns Ferry 1 and 2 in Decatur, AL.15 miles: Browns Ferry 3 in Decatur, AL.
College/University in Athens: Athens State University Full-time enrollment: 2,771; Location: 300 N Beaty St; Public; Website: www.athens.edu)
Other colleges/universities with over 2000 students near Athens:
John C Calhoun State Community College (about 10 miles; Tanner, AL ; Full-time enrollment: 7,911)
University of Alabama in Huntsville (about 20 miles; Huntsville, AL ; FT enrollment: 6,006)
Alabama A & M University (about 23 miles; Normal, AL ; FT enrollment: 4,524)
Northwest-Shoals Community College (about 41 miles; Muscle Shoals, AL ; FT enrollment: 2,702)
University of North Alabama (about 41 miles; Florence, AL ; FT enrollment: 5,886)
George C Wallace State Community College-Hanceville (about 51 miles; Hanceville, AL ; FT enrollment: 4,486)
Motlow State Community College (about 56 miles; Tullahoma, TN ; FT enrollment: 2,915)
Public high schools in Athens: ATHENS HIGH SCH Students: 834, Location: 100 HIGHWAY 31 N, Grades: 9-12)CLEMENTS HIGH SCH Students: 1, Location: 7730 HIGHWAY 72 W, Grades: 6-12)EAST LIMESTONE HIGH SCH Students: 1, Location: 15641 E LIMESTONE RD, Grades: 6-12)LIMESTONE CO AREA VOC TECH Location: 505 E SANDERFER RD, Grades: 10-12)
Private high schools in Athens: ATHENS BIBLE SCHOOL Students: 330, Location: 507 HOFFMAN ST, Grades: KG-12)
LINDSAY LANE CHRISTIAN ACADEMY Students: 316, Location: 1300 LINDSAY LN S, Grades: PK-12)
TEMPLE CHRISTIAN ACADEMY Students: 7, Location: 25820 NICK DAVIS RD, Grades: 4-12)
Biggest public elementary/middle schools in Athens: OWENS ELEM SCH Students: 522, Location: 21465 AL HIGHWAY 99, Grades: KG-5)ATHENS INTERMEDIATE SCH Students: 435, Location: 1916 US HWY 72 W., Grades: 5-6)ATHENS MIDDLE SCH Students: 429, Location: 601 S CLINTON ST, Grades: 7-8)JULIAN NEWMAN ELEM SCH Students: 333, Location: 517 JULIAN NEWMAN DR, Grades: KG-4)ATHENS ELEM SCH Students: 290, Location: 515 N MADISON ST, Grades: KG-4)JAMES L COWART ELEM SCH Students: 290, Location: 1701 W HOBBS ST, Grades: KG-4)JOHNSON ELEM SCH Students: 264, Location: 21360 HWY 251, Grades: KG-5)BROOKHILL ELEM SCH Students: 262, Location: 320 BROOKHILL DR, Grades: KG-4)PINEY CHAPEL ELEM SCH Students: 235, Location: 20835 ELKTON RD, Grades: KG-5)BLUE SPRINGS ELEM SCH Students: 1, Location: 16787 HARDY ROAD, Grades: KG-5)See full list of schools located in Athens Library in Athens: ATHENS-LIMESTONE PUBLIC LIBRARY Operating income: $461,191; Location: 405 EAST SOUTH STREET; 60,596 books ; 34,812 e-books ; 3,523 audio materials ; 1,821 video materials ; 81 state licensed databases ; 50 print serial subscriptions )
User-submitted facts and corrections:
Faith Christian Academy is now K-4 through 12th grade with approximately 230 students enrolled for the 2005-2006 school year
Notable locations in Athens: (A) , Athens Industrial Park (B) , Breeding Industrial Park (C) , Elm Industrial Park (D) , Woodland Golf Club (E) , Houston Memorial Library (F) , Athens Public Library (G) , Limestone County Courthouse (H) , Strain and Sons Nursery (I) , Alabama Veterans Museum and Archives (J) , Athens Fire and Rescue Station 3 (K) , Athens Fire and Rescue Station 1 (L) , Athens Fire and Rescue Station 2 (M) . Display/hide their locations on the map
Shopping Centers: (1) , Athens Shopping Center (2) , Crutcher Shopping Center (3) , Roses Shopping Center (4) . Display/hide their locations on the map
Churches in Athens include: (A) , Pleasant Grove Church (B) , Little Zion Missionary Baptist Church (C) , Cambridge Methodist Church (D) , First Union Baptist Church (E) , West Highland Baptist Church (F) , Market Street Church of Christ (G) , Lucas Street Church of Christ (H) , James Chapel Baptist Church (I) . Display/hide their locations on the map
Cemeteries: (1) , Morris Cemetery (2) , Roselawn Cemetery (3) , West Cemetery (4) , Wiggins Cemetery (5) , Cambridge Church Cemetery (6) , Burrell Cemetery (7) . Display/hide their locations on the map
Lakes and reservoirs: (A) , Braly Lake (B) , Thomas Pond (C) , Montgomery Lake (D) , Lake Ida (E) , Hatfield Lake (F) . Display/hide their locations on the map
Streams, rivers, and creeks: (A) , Muddy Creek (B) , French Mill Creek (C) , Collier Branch (D) , Town Creek (E) . Display/hide their locations on the map
Parks in Athens include: (1) , George S Houston Historic District (2) , Robert Beaty Historic District (3) , Fairview Park (4) , Athens-Limestone Park (5) , Athens Recreational Center (6) , Athens Stadium (7) , Big Spring Park (8) , Christopher Park (9) . Display/hide their locations on the map
Tourist attractions: (1) , Donnell House (Cultural Attractions- Events- & Facilities; 601 North Clinton Street) (2) , Wayne's Amusement CO (Amusement & Theme Parks; 707 Hatfield Lake Road) (3) , Cook Travel Of Athens- LLC (Tours & Charters; 1100 South Jefferson Street) (4) . Display/hide their approximate locations on the map
Hotels: (1) , Best Western Inn (Highway 72) (2) , Travelodge Athens (1325 Us Highway 72 East) (3) , Super 8 Motel (1325 US Highway 72 East) (4) , Budget Inn (606 US Highway 31 South) (5) , Country Hearth Inn (1500 Us Highway 72 E) (6) , Athens Travelodge (1325 Hwy 72 East) (7) , Mark Motel (202 US Highway 31 South) (8) , Days Inn (1322 US Highway 72 East) (9) . Display/hide their approximate locations on the map
Court: (1) . Display/hide its approximate location on the map
Birthplace of: P. O. Davis - Educator, Woody Abernathy (outfielder) - Baseball player, Rolando McClain - College football player, Edmund Pettus - Confederate Army general, Michael Boley - 2005 NFL player (Atlanta Falcons, born : Aug 24, 1982), Patti J. Malone - Musician, Roger Murrah - Country songwriter, Wally Bullington - Football player and coach, Andy Nelson (American football) - Football player, Keith Askins - Basketball player-coach.
Limestone County has a predicted average indoor radon screening level greater than 4 pCi/L (pico curies per liter) - Highest Potential Drinking water stations with addresses in Athens and their reported violations in the past:
LIMESTONE COUNTY WATER SYSTEM (Population served: 58,500, Surface water):
Past health violations:
MCL, Average - Between APR-2014 and JUN-2014, Contaminant: Total Haloacetic Acids (HAA5)
Past monitoring violations:
Monitoring and Reporting (DBP) - Between APR-2011 and JUN-2011, Contaminant: CARBON, TOTAL. Follow-up actions: St Intentional no-action (JUL-20-2011), St Compliance achieved (MAY-10-2012)
Population served: 27,534, Surface water):
Past health violations:
MCL, Monthly (TCR) - In JAN-2008, Contaminant: Coliform. Follow-up actions: St Public Notif requested (FEB-22-2008), St Violation/Reminder Notice (FEB-22-2008), St Public Notif received (APR-02-2008), St Compliance achieved (AUG-10-2008)
Past monitoring violations:
One minor monitoring violation
Average household size: This city:
2.4 peopleAlabama:
2.5 people
Percentage of family households: This city:
65.1%Whole state:
67.8%
Percentage of households with unmarried partners: This city:
4.1%Whole state:
4.7%
Likely homosexual households (counted as self-reported same-sex unmarried-partner households)
Lesbian couples: 0.2% of all households Gay men: 0.2% of all households
People in group quarters in Athens in 2010:
283 people in nursing facilities/skilled-nursing facilities
234 people in local jails and other municipal confinement facilities
10 people in group homes intended for adults
People in group quarters in Athens in 2000:
336 people in nursing homes
185 people in local jails and other confinement facilities (including police lockups)
47 people in college dormitories (includes college quarters off campus)
23 people in homes for the mentally ill
Banks with most branches in Athens (2011 data):
Regions Bank: West Green Street Branch, East Athens Branch, Hobbs Street Rdt Branch. Info updated 2011/02/24: Bank assets: $123,368.2 mil, Deposits: $98,301.3 mil, headquarters in Birmingham, AL, positive income , Commercial Lending Specialization, 1778 total offices , Holding Company: Regions Financial Corporation
RELIANCE BANK: Drive-Up Branch, Reliance Bank, Hwy 72 E Branch. Info updated 2011/02/24: Bank assets: $144.7 mil, Deposits: $110.8 mil, local headquarters , positive income , Commercial Lending Specialization, 5 total offices , Holding Company: Rb Bancorporation
Compass Bank: Athens Main Branch at 105 West Green Street, branch established on 1892/01/01; Athens East Branch at 1003 Highway 72 East, branch established on 1997/03/10. Info updated 2011/02/24: Bank assets: $63,107.0 mil, Deposits: $46,232.4 mil, headquarters in Birmingham, AL, negative income in the last year , Commercial Lending Specialization, 720 total offices , Holding Company: Banco Bilbao Vizcaya Argentaria, S.A.
Bank Independent: Athens Branch at 101 South Clinton Street, branch established on 1983/03/01; Athens East Branch at 22015 Highway 72 East, branch established on 2008/05/12. Info updated 2011/02/24: Bank assets: $1,041.1 mil, Deposits: $871.4 mil, headquarters in Sheffield, AL, positive income , Commercial Lending Specialization, 28 total offices , Holding Company: Bancindependent Incorporated
PNC Bank, National Association: Athens Branch at 1044 Highway 72 East, branch established on 1990/12/28; Athens Downtown Branch at 309 West Washington Street, branch established on 1994/01/10. Info updated 2012/03/20: Bank assets: $263,309.6 mil, Deposits: $197,343.0 mil, headquarters in Wilmington, DE, positive income , Commercial Lending Specialization, 3085 total offices , Holding Company: Pnc Financial Services Group, Inc., The
Cadence Bank, N.A.: Athens Branch at 1319 Us Highway 72 East, branch established on 2006/10/31. Info updated 2011/12/14: Bank assets: $3,909.7 mil, Deposits: $3,124.0 mil, headquarters in Birmingham, AL, positive income , Commercial Lending Specialization, 112 total offices , Holding Company: Cadence Bancorp Llc
Citizens Bank & Trust: Athens Branch at 1260 Us Highway 72 E, Ste H, branch established on 2008/10/27. Info updated 2011/02/24: Bank assets: $286.8 mil, Deposits: $241.1 mil, headquarters in Guntersville, AL, positive income , Commercial Lending Specialization, 8 total offices , Holding Company: Citizens B & T Holdings, Inc.
Woodforest National Bank: Al Athens Branch at 1011 U.S. Hwy 72 East, branch established on 2009/11/07. Info updated 2011/05/10: Bank assets: $3,488.9 mil, Deposits: $3,097.6 mil, headquarters in Houston, TX, positive income , Commercial Lending Specialization, 766 total offices , Holding Company: Woodforest Financial Group Employee Stock Ownership Plan (With 401(K) Provisions)
First National Bank of Pulaski: Athens Branch at 1880 Hwy 72 East, branch established on 2008/04/21. Info updated 2006/11/03: Bank assets: $634.9 mil, Deposits: $559.7 mil, headquarters in Pulaski, TN, positive income , Commercial Lending Specialization, 12 total offices , Holding Company: First Pulaski National Corporation
For population 15 years and over in Athens:
Never married: 25.3%Now married: 52.8%Separated: 0.9%Widowed: 7.4%Divorced: 13.5% For population 25 years and over in Athens:
High school or higher: 88.3%Bachelor's degree or higher: 30.0%Graduate or professional degree: 9.8%Unemployed: 4.8%Mean travel time to work (commute): 23.0 minutes
Education Gini index (Inequality in education) Here:
14.2Alabama average:
11.5
Religion statistics for Athens, AL (based on Limestone County data)
Religion Adherents Congregations Evangelical Protestant 33,582 122 Mainline Protestant 4,899 25 Catholic 2,462 1 Other 1,209 4 Black Protestant 866 14 None 39,764 -
Source: Clifford Grammich, Kirk Hadaway, Richard Houseal, Dale E.Jones, Alexei Krindatch, Richie Stanley and Richard H.Taylor. 2012. 2010 U.S.Religion Census: Religious Congregations & Membership Study. Association of Statisticians of American Religious Bodies. Jones, Dale E., et al. 2002. Congregations and Membership in the United States 2000. Nashville, TN: Glenmary Research Center. Graphs represent county-level data
Food Environment Statistics: Number of grocery stores : 10Limestone County :
1.35 / 10,000 pop.Alabama :
1.89 / 10,000 pop.
Number of supercenters and club stores : 1This county :
0.14 / 10,000 pop.State :
0.20 / 10,000 pop.
Number of convenience stores (no gas) : 5Limestone County :
0.68 / 10,000 pop.Alabama :
0.65 / 10,000 pop.
Number of convenience stores (with gas) : 45Limestone County :
6.09 / 10,000 pop.State :
6.32 / 10,000 pop.
Number of full-service restaurants : 33Here :
4.47 / 10,000 pop.State :
5.75 / 10,000 pop.
Adult diabetes rate : This county :
9.8%Alabama :
11.8%
Adult obesity rate : Limestone County :
27.7%Alabama :
31.7%
Low-income preschool obesity rate : This county :
23.1%State :
13.5%
Health and Nutrition: Healthy diet rate : Athens:
48.3%Alabama:
49.0%
Average overall health of teeth and gums : People feeling badly about themselves : Athens:
21.1%Alabama:
20.7%
People not drinking alcohol at all : Athens:
11.0%Alabama:
11.0%
Average hours sleeping at night : Overweight people : This city:
34.2%Alabama:
34.4%
General health condition : This city:
54.2%Alabama:
55.2%
Average condition of hearing : Athens:
78.1%Alabama:
79.3%
More about Health and Nutrition of Athens, AL Residents
Local government employment and payroll (March 2022)
Function
Full-time employees
Monthly full-time payroll
Average yearly full-time wage
Part-time employees
Monthly part-time payroll
Electric Power
70 $388,566 $66,611 0 $0 Police Protection - Officers
47 $252,306 $64,419 1 $2,485 Other and Unallocable
40 $254,897 $76,469 0 $0 Firefighters
38 $187,013 $59,057 0 $0 Gas Supply
35 $157,489 $53,996 7 $19,400 Parks and Recreation
29 $110,404 $45,684 28 $32,456 Solid Waste Management
25 $91,350 $43,848 0 $0 Streets and Highways
24 $98,017 $49,009 2 $7,026 Water Supply
23 $121,722 $63,507 0 $0 Financial Administration
19 $106,739 $67,414 0 $0 Sewerage
17 $85,570 $60,402 0 $0 Police - Other
10 $38,399 $46,079 7 $10,450 Other Government Administration
10 $41,322 $49,586 0 $0 Fire - Other
4 $25,163 $75,489 0 $0
Totals for Government
391 $1,958,959 $60,122 45 $71,819
Athens government finances - Expenditure in 2021 (per resident):
Construction - Regular Highways: $8,546,000 ($298.18)
Electric Utilities: $8,227,000 ($287.05)Gas Utilities: $2,578,000 ($89.95)Water Utilities: $1,711,000 ($59.70)General - Other: $1,393,000 ($48.60)Current Operations - Electric Utilities: $103,875,000 ($3624.26)
Gas Utilities: $7,856,000 ($274.10)Water Utilities: $7,679,000 ($267.93)Police Protection: $5,027,000 ($175.40)Regular Highways: $4,262,000 ($148.70)Local Fire Protection: $3,776,000 ($131.75)Central Staff Services: $3,548,000 ($123.79)Solid Waste Management: $3,102,000 ($108.23)Parks and Recreation: $1,918,000 ($66.92)Financial Administration: $1,074,000 ($37.47)General - Other: $430,000 ($15.00)Libraries: $144,000 ($5.02)Judicial and Legal Services: $6,000 ($0.21)Electric Utilities - Interest on Debt: $861,000 ($30.04)
Gas Utilities - Interest on Debt: $130,000 ($4.54)
General - Interest on Debt: $3,599,000 ($125.57)
Intergovernmental to Local - Other - General - Other: $6,209,000 ($216.64)
Water Utilities - Interest on Debt: $1,099,000 ($38.34)
Athens government finances - Revenue in 2021 (per resident):
Charges - Other: $5,231,000 ($182.51)
Miscellaneous - General Revenue - Other: $1,335,000 ($46.58)
Interest Earnings: $513,000 ($17.90)Fines and Forfeits: $318,000 ($11.10)Sale of Property: $315,000 ($10.99)Rents: $40,000 ($1.40)Revenue - Electric Utilities: $117,650,000 ($4104.88)
Water Utilities: $13,940,000 ($486.38)Gas Utilities: $13,310,000 ($464.39)State Intergovernmental - Other: $2,581,000 ($90.05)
Highways: $256,000 ($8.93)Tax - General Sales and Gross Receipts: $17,625,000 ($614.95)
Property: $4,667,000 ($162.83)Other License: $2,568,000 ($89.60)Alcoholic Beverage Sales: $904,000 ($31.54)Motor Fuels Sales: $678,000 ($23.66)Tobacco Products Sales: $452,000 ($15.77)Alcoholic Beverage License: $42,000 ($1.47)
Athens government finances - Debt in 2021 (per resident):
Long Term Debt - Beginning Outstanding - Unspecified Public Purpose: $165,197,000 ($5763.83)
Outstanding Unspecified Public Purpose: $164,939,000 ($5754.82)Retired Unspecified Public Purpose: $26,350,000 ($919.37)Issue, Unspecified Public Purpose: $26,093,000 ($910.40)
Athens government finances - Cash and Securities in 2021 (per resident):
Bond Funds - Cash and Securities: $3,351,000 ($116.92)
Other Funds - Cash and Securities: $71,382,000 ($2490.56)
Sinking Funds - Cash and Securities: $3,483,000 ($121.52)
10.48% of this county's 2021 resident taxpayers lived in other counties in 2020 ($73,638 average adjusted gross income )
Here:
10.48%Alabama average:
6.87%
0.06% of residents moved from foreign countries ($538 average AGI )Limestone County:
0.06%Alabama average:
0.02%
Top counties from which taxpayers relocated into this county between 2020 and 2021:
Businesses in Athens, AL
Name Count Name Count
AT&T 1 McDonald's 2 Advance Auto Parts 2 Nike 1 Applebee's 1 Papa John's Pizza 1 Arby's 1 Penske 1 AutoZone 1 Pizza Hut 2 Best Western 1 Publix Super Markets 1 Blockbuster 1 Quality 1 Burger King 2 Quiznos 1 CVS 1 RadioShack 1 Chevrolet 1 Ruby Tuesday 1 Chick-Fil-A 1 Rue21 1 Cracker Barrel 1 SAS Shoes 1 DHL 1 SONIC Drive-In 1 Days Inn 1 Sears 1 Domino's Pizza 1 Sleep Inn 1 FedEx 3 Sprint Nextel 1 Ford 1 Staples 1 GameStop 1 Starbucks 1 Goodwill 5 Subway 3 H&R Block 1 Super 8 1 Hardee's 2 T-Mobile 3 Hilton 1 Taco Bell 1 Holiday Inn 1 U-Haul 4 KFC 1 UPS 4 Kmart 1 Waffle House 1 Lane Furniture 2 Walgreens 1 Little Caesars Pizza 1 Walmart 1 Lowe's 1 Wendy's 1 Maurices 1
Strongest AM radio stations in Athens:
WVNN (770 AM; 10 kW; ATHENS, AL; Owner: ATHENS BROADCASTING COMPANY, INC.)
WKAC (1080 AM; daytime; 5 kW; ATHENS, AL; Owner: LIMESTONE BROADCASTING COMPANY, INC.)
WLOR (1550 AM; 50 kW; HUNTSVILLE, AL; Owner: BCA RADIO, LLC)
WDJL (1000 AM; daytime; 10 kW; HUNTSVILLE, AL; Owner: JAMES K. SHARP DBA 5TH AVE BROADCASTING)
WBXR (1140 AM; daytime; 15 kW; HAZEL GREEN, AL; Owner: LOW COUNTRY CORPORATION, INC.)
WEUP (1600 AM; 10 kW; HUNTSVILLE, AL; Owner: HUNDLEY BATTS, SR. & VIRGINIA CAPLES)
WEUV (1700 AM; 10 kW; HUNTSVILLE, AL; Owner: HUNDLEY BATTS, SR & VIRGINIA CAPLES)
WYAM (890 AM; daytime; 2 kW; HARTSELLE, AL; Owner: DECATUR COMMUNICATIONS PROPERTIES, LLC)
WZNN (620 AM; 5 kW; LEXINGTON, AL; Owner: MANUEL HUERTA)
WSM (650 AM; 50 kW; NASHVILLE, TN; Owner: GAYLORD ENTERTAINMENT COMPANY)
WWAM (820 AM; daytime; 50 kW; JASPER, TN; Owner: SHELTON BROADCASTING SYSTEM)
WSLV (1110 AM; daytime; 2 kW; ARDMORE, TN; Owner: B & E BROADCASTING, INC.)
WDJC (850 AM; 50 kW; BIRMINGHAM, AL; Owner: KIMTRON, INC.)
Strongest FM radio stations in Athens:
W261CL (100.1 FM; ATHENS, AL; Owner: TENNESSEE VALLEY RADIO, INC.)
WZYP (104.3 FM; ATHENS, AL; Owner: ATHENS BROADCASTING COMPANY, INC.)
W278AA (103.5 FM; MADISON, AL; Owner: TENNESSEE VALLEY RADIO, INC.)
WAHR (99.1 FM; HUNTSVILLE, AL; Owner: BCA RADIO, LLC)
WDRM (102.1 FM; DECATUR, AL; Owner: CAPSTAR TX LIMITED PARTNERSHIP)
WWXQ (92.5 FM; TRINITY, AL; Owner: CAPSTAR TX LIMITED PARTNERSHIP)
W238AD (95.5 FM; TRINITY, AL; Owner: PRESS W. PARHAM)
WAYH (88.1 FM; HARVEST, AL; Owner: WAY-FM MEDIA GROUP, INC.)
W289AC (105.7 FM; HUNTSVILLE, AL; Owner: WILLIAM PAXTON ROGERS)
W222AK (92.3 FM; HUNTSVILLE, AL; Owner: PRESS W. PARHAM)
W251AC (98.1 FM; CHAPSHAW, AL; Owner: WILLIAM PAXTON ROGERS)
WYFD (91.7 FM; DECATUR, AL; Owner: BIBLE BROADCASTING NETWORK, INC.)
WXQW (94.1 FM; MERIDIANVILLE, AL; Owner: CAPSTAR TX LIMITED PARTNERSHIP)
W293AH (106.5 FM; NORMAL, AL; Owner: CAPSTAR TX LIMITED PARTNERSHIP)
WRTT-FM (95.1 FM; HUNTSVILLE, AL; Owner: BCA RADIO, LLC)
W249BB (97.7 FM; HUNTSVILLE, AL; Owner: WAY-FM MEDIA GROUP, INC.)
W275AA (102.9 FM; HUNTSVILLE, AL; Owner: ARCHIE C. BOBO, PERSONAL REP. OF DORSEY E. NEWMAN ESTATE)
W300AH (107.9 FM; HUNTSVILLE, AL; Owner: PORTER L. BATTS)
W202BV (88.3 FM; HUNTSVILLE, AL; Owner: WAY-FM MEDIA GROUP, INC.)
W295AE (106.9 FM; TRINITY, AL; Owner: BIG RIVER BROADCASTING CORPORATION)
TV broadcast stations around Athens:
WTZT-LP (Channel 11; ATHENS, AL; Owner: WTZT-LP TELEVISION STATION, L.L.C.)
WZDX (Channel 54; HUNTSVILLE, AL; Owner: HUNTSVILLE TELEVISION ACQUISITION CORP.)
WAAY-TV (Channel 31; HUNTSVILLE, AL; Owner: PIEDMONT TELEVISION OF HUNTSVILLE LICENSE LLC)
WHNT-TV (Channel 19; HUNTSVILLE, AL; Owner: NEW YORK TIMES MANAGEMENT SERVICES)
WHDF (Channel 15; FLORENCE, AL; Owner: VALLEY TELEVISION, LLC)
WYAM-LP (Channel 56; DECATUR, AL; Owner: DECATUR COMMUNICATION PROPERTIES, LLC)
W67CO (Channel 67; HUNTSVILLE, AL; Owner: TRINITY BROADCASTING NETWORK)
W38BQ (Channel 38; HUNTSVILLE, AL; Owner: THREE ANGELS BROADCASTING NETWORK)
W66DH (Channel 66; DECATUR, AL; Owner: TRINITY BROADCASTING NETWORK)
National Bridge Inventory (NBI) Statistics 134 Number of bridges1,283ft / 391m Total length $140,259,000 Total costs828,327 Total average daily traffic149,555 Total average daily truck traffic
New bridges - historical statistics
1 1910-1919 8 1920-1929 5 1930-1939 11 1940-1949 29 1950-1959 34 1960-1969 11 1970-1979 2 1980-1989 14 1990-1999 10 2000-2009 7 2010-2019 2 2020-2022
See full National Bridge Inventory statistics for Athens, AL
Home Mortgage Disclosure Act Aggregated Statistics For Year 2009(Based on 5 full and 2 partial tracts) A) FHA, FSA/RHS & VA B) Conventional C) Refinancings D) Home Improvement Loans F) Non-occupant Loans on G) Loans On Manufactured Number Average Value Number Average Value Number Average Value Number Average Value Number Average Value Number Average Value
LOANS ORIGINATED 70 $138,704 72 $114,101 249 $149,638 26 $22,962 48 $95,799 4 $21,792 APPLICATIONS APPROVED, NOT ACCEPTED 7 $161,221 1 $158,100 22 $153,707 5 $132,570 3 $149,000 0 $0 APPLICATIONS DENIED 9 $91,409 12 $89,396 90 $129,685 13 $32,834 5 $87,342 3 $21,700 APPLICATIONS WITHDRAWN 7 $151,313 13 $97,703 63 $142,730 1 $75,730 2 $91,410 0 $0 FILES CLOSED FOR INCOMPLETENESS 4 $148,248 5 $92,042 20 $138,594 2 $163,500 1 $73,530 0 $0
Aggregated Statistics For Year 2008(Based on 5 full and 2 partial tracts) A) FHA, FSA/RHS & VA B) Conventional C) Refinancings D) Home Improvement Loans E) Loans on Dwellings For 5+ Families F) Non-occupant Loans on G) Loans On Manufactured Number Average Value Number Average Value Number Average Value Number Average Value Number Average Value Number Average Value Number Average Value
LOANS ORIGINATED 63 $109,627 78 $130,884 142 $129,820 30 $39,014 2 $594,500 26 $83,256 1 $30,900 APPLICATIONS APPROVED, NOT ACCEPTED 1 $353,040 2 $91,065 19 $94,295 4 $20,992 0 $0 2 $180,940 1 $28,290 APPLICATIONS DENIED 5 $112,898 28 $109,358 101 $122,844 46 $36,592 0 $0 5 $96,592 6 $31,230 APPLICATIONS WITHDRAWN 6 $124,987 8 $101,595 52 $132,270 5 $91,118 0 $0 2 $162,260 0 $0 FILES CLOSED FOR INCOMPLETENESS 2 $100,480 3 $53,323 11 $153,283 4 $60,875 0 $0 0 $0 0 $0
Aggregated Statistics For Year 2007(Based on 5 full and 2 partial tracts) A) FHA, FSA/RHS & VA B) Conventional C) Refinancings D) Home Improvement Loans F) Non-occupant Loans on G) Loans On Manufactured Number Average Value Number Average Value Number Average Value Number Average Value Number Average Value Number Average Value
LOANS ORIGINATED 34 $111,802 185 $121,551 193 $113,916 40 $43,696 52 $89,739 2 $19,175 APPLICATIONS APPROVED, NOT ACCEPTED 2 $40,540 13 $96,703 30 $116,239 8 $55,879 3 $70,600 2 $46,330 APPLICATIONS DENIED 4 $101,790 24 $73,026 116 $106,384 45 $51,794 4 $53,422 4 $22,142 APPLICATIONS WITHDRAWN 2 $82,000 18 $113,726 47 $129,496 12 $85,922 3 $59,563 0 $0 FILES CLOSED FOR INCOMPLETENESS 3 $58,917 4 $105,088 25 $139,606 2 $78,500 2 $92,390 0 $0
Aggregated Statistics For Year 2006(Based on 5 full and 2 partial tracts) A) FHA, FSA/RHS & VA B) Conventional C) Refinancings D) Home Improvement Loans E) Loans on Dwellings For 5+ Families F) Non-occupant Loans on G) Loans On Manufactured Number Average Value Number Average Value Number Average Value Number Average Value Number Average Value Number Average Value Number Average Value
LOANS ORIGINATED 37 $101,933 216 $104,237 179 $91,966 43 $33,722 3 $1,398,333 79 $78,391 7 $45,914 APPLICATIONS APPROVED, NOT ACCEPTED 1 $92,340 15 $66,683 31 $77,422 6 $25,567 0 $0 2 $51,555 6 $54,808 APPLICATIONS DENIED 7 $81,723 26 $77,802 130 $99,712 42 $40,605 0 $0 7 $78,279 9 $44,692 APPLICATIONS WITHDRAWN 3 $139,043 28 $106,352 62 $95,582 4 $91,182 0 $0 8 $105,571 0 $0 FILES CLOSED FOR INCOMPLETENESS 1 $102,930 16 $94,328 29 $138,493 1 $82,000 0 $0 3 $101,550 0 $0
Aggregated Statistics For Year 2005(Based on 5 full and 2 partial tracts) A) FHA, FSA/RHS & VA B) Conventional C) Refinancings D) Home Improvement Loans F) Non-occupant Loans on G) Loans On Manufactured Number Average Value Number Average Value Number Average Value Number Average Value Number Average Value Number Average Value
LOANS ORIGINATED 43 $84,861 201 $95,830 204 $101,235 36 $46,980 55 $71,319 2 $31,800 APPLICATIONS APPROVED, NOT ACCEPTED 0 $0 13 $72,884 37 $91,093 7 $34,951 4 $67,925 2 $36,340 APPLICATIONS DENIED 3 $72,247 38 $59,331 148 $90,308 35 $42,067 7 $48,144 16 $48,278 APPLICATIONS WITHDRAWN 1 $149,950 37 $97,358 71 $124,034 13 $72,379 5 $120,580 1 $21,000 FILES CLOSED FOR INCOMPLETENESS 2 $122,500 10 $69,860 52 $103,404 0 $0 0 $0 0 $0
Aggregated Statistics For Year 2004(Based on 5 full and 2 partial tracts) A) FHA, FSA/RHS & VA B) Conventional C) Refinancings D) Home Improvement Loans E) Loans on Dwellings For 5+ Families F) Non-occupant Loans on G) Loans On Manufactured Number Average Value Number Average Value Number Average Value Number Average Value Number Average Value Number Average Value Number Average Value
LOANS ORIGINATED 67 $80,654 179 $103,010 189 $95,217 22 $41,014 2 $873,800 51 $75,569 5 $36,724 APPLICATIONS APPROVED, NOT ACCEPTED 3 $65,560 21 $76,807 42 $92,711 6 $48,630 0 $0 1 $41,010 9 $37,442 APPLICATIONS DENIED 4 $61,105 35 $74,365 175 $90,842 24 $35,967 0 $0 6 $54,933 15 $30,393 APPLICATIONS WITHDRAWN 11 $87,895 30 $108,864 63 $102,680 4 $49,240 0 $0 5 $58,560 0 $0 FILES CLOSED FOR INCOMPLETENESS 1 $59,970 7 $98,603 64 $95,009 1 $25,010 0 $0 2 $50,480 0 $0
Aggregated Statistics For Year 2003(Based on 5 full and 2 partial tracts) A) FHA, FSA/RHS & VA B) Conventional C) Refinancings D) Home Improvement Loans E) Loans on Dwellings For 5+ Families F) Non-occupant Loans on Number Average Value Number Average Value Number Average Value Number Average Value Number Average Value Number Average Value
LOANS ORIGINATED 53 $80,524 170 $99,564 446 $106,653 23 $23,053 3 $1,905,640 43 $71,761 APPLICATIONS APPROVED, NOT ACCEPTED 1 $63,750 16 $59,959 52 $90,011 2 $28,930 0 $0 6 $65,675 APPLICATIONS DENIED 4 $78,500 19 $77,442 147 $91,211 19 $21,919 0 $0 2 $62,520 APPLICATIONS WITHDRAWN 2 $73,480 13 $86,951 103 $98,431 7 $31,667 0 $0 7 $54,306 FILES CLOSED FOR INCOMPLETENESS 1 $68,000 6 $77,825 12 $168,795 2 $68,500 0 $0 1 $74,910
Aggregated Statistics For Year 2002(Based on 5 full and 1 partial tracts) A) FHA, FSA/RHS & VA B) Conventional C) Refinancings D) Home Improvement Loans E) Loans on Dwellings For 5+ Families F) Non-occupant Loans on Number Average Value Number Average Value Number Average Value Number Average Value Number Average Value Number Average Value
LOANS ORIGINATED 46 $79,276 107 $88,836 283 $98,930 22 $30,200 3 $893,693 39 $46,684 APPLICATIONS APPROVED, NOT ACCEPTED 0 $0 13 $78,647 36 $95,085 1 $9,050 0 $0 2 $76,430 APPLICATIONS DENIED 4 $88,048 26 $47,133 96 $72,087 9 $7,338 0 $0 3 $24,860 APPLICATIONS WITHDRAWN 1 $51,000 14 $94,224 48 $93,526 1 $73,550 0 $0 3 $46,980 FILES CLOSED FOR INCOMPLETENESS 3 $81,933 5 $43,026 30 $88,289 0 $0 0 $0 0 $0
Aggregated Statistics For Year 2001(Based on 5 full and 1 partial tracts) A) FHA, FSA/RHS & VA B) Conventional C) Refinancings D) Home Improvement Loans F) Non-occupant Loans on Number Average Value Number Average Value Number Average Value Number Average Value Number Average Value
LOANS ORIGINATED 47 $71,817 125 $89,491 241 $94,141 32 $18,918 31 $54,108 APPLICATIONS APPROVED, NOT ACCEPTED 1 $60,280 16 $56,696 16 $85,701 5 $51,662 3 $40,060 APPLICATIONS DENIED 2 $75,985 44 $45,931 87 $84,943 4 $8,810 2 $26,475 APPLICATIONS WITHDRAWN 7 $81,016 10 $73,503 45 $91,694 4 $15,108 1 $15,470 FILES CLOSED FOR INCOMPLETENESS 0 $0 2 $227,500 11 $78,328 0 $0 0 $0
Aggregated Statistics For Year 2000(Based on 5 full and 1 partial tracts) A) FHA, FSA/RHS & VA B) Conventional C) Refinancings D) Home Improvement Loans E) Loans on Dwellings For 5+ Families F) Non-occupant Loans on Number Average Value Number Average Value Number Average Value Number Average Value Number Average Value Number Average Value
LOANS ORIGINATED 55 $70,162 131 $77,138 78 $67,709 46 $17,112 1 $33,340 24 $53,178 APPLICATIONS APPROVED, NOT ACCEPTED 3 $43,897 16 $36,549 8 $45,652 10 $12,919 0 $0 3 $55,200 APPLICATIONS DENIED 7 $44,386 72 $43,564 54 $59,279 10 $16,634 0 $0 4 $54,170 APPLICATIONS WITHDRAWN 5 $86,568 22 $71,830 19 $66,242 1 $4,130 0 $0 2 $49,650 FILES CLOSED FOR INCOMPLETENESS 1 $65,710 3 $55,140 24 $57,508 0 $0 0 $0 0 $0
Aggregated Statistics For Year 1999(Based on 5 full and 1 partial tracts) A) FHA, FSA/RHS & VA B) Conventional C) Refinancings D) Home Improvement Loans E) Loans on Dwellings For 5+ Families F) Non-occupant Loans on Number Average Value Number Average Value Number Average Value Number Average Value Number Average Value Number Average Value
LOANS ORIGINATED 39 $71,636 165 $87,353 135 $74,719 38 $26,451 3 $266,333 33 $51,320 APPLICATIONS APPROVED, NOT ACCEPTED 0 $0 39 $40,512 13 $72,329 6 $15,185 0 $0 1 $44,480 APPLICATIONS DENIED 4 $76,002 142 $38,549 72 $62,323 21 $12,599 2 $69,935 6 $26,088 APPLICATIONS WITHDRAWN 2 $131,500 24 $71,454 35 $71,741 2 $30,505 0 $0 0 $0 FILES CLOSED FOR INCOMPLETENESS 1 $36,000 2 $94,000 30 $71,720 0 $0 0 $0 1 $15,000
Detailed HMDA statistics for the following Tracts:
0205.00
, 0206.00 , 0207.00 , 0208.02 , 0209.00 , 0210.00 , 0211.00
Private Mortgage Insurance Companies Aggregated Statistics For Year 2009(Based on 4 full and 2 partial tracts) A) Conventional B) Refinancings C) Non-occupant Loans on Number Average Value Number Average Value Number Average Value
LOANS ORIGINATED 9 $173,860 9 $206,910 0 $0 APPLICATIONS APPROVED, NOT ACCEPTED 6 $133,875 6 $208,138 3 $94,123 APPLICATIONS DENIED 0 $0 1 $126,930 0 $0 APPLICATIONS WITHDRAWN 0 $0 1 $192,110 0 $0 FILES CLOSED FOR INCOMPLETENESS 1 $117,380 0 $0 1 $117,380
Aggregated Statistics For Year 2008(Based on 5 full and 2 partial tracts) A) Conventional B) Refinancings C) Non-occupant Loans on Number Average Value Number Average Value Number Average Value
LOANS ORIGINATED 38 $130,535 19 $129,855 6 $70,295 APPLICATIONS APPROVED, NOT ACCEPTED 14 $124,824 9 $242,931 1 $60,270 APPLICATIONS DENIED 0 $0 0 $0 0 $0 APPLICATIONS WITHDRAWN 0 $0 0 $0 0 $0 FILES CLOSED FOR INCOMPLETENESS 0 $0 0 $0 0 $0
Aggregated Statistics For Year 2007(Based on 5 full and 2 partial tracts) A) Conventional B) Refinancings C) Non-occupant Loans on Number Average Value Number Average Value Number Average Value
LOANS ORIGINATED 87 $112,851 32 $140,399 10 $60,227 APPLICATIONS APPROVED, NOT ACCEPTED 4 $149,718 5 $120,838 0 $0 APPLICATIONS DENIED 1 $40,210 0 $0 0 $0 APPLICATIONS WITHDRAWN 2 $191,170 4 $179,460 0 $0 FILES CLOSED FOR INCOMPLETENESS 1 $80,000 1 $83,360 0 $0
Aggregated Statistics For Year 2006(Based on 5 full and 2 partial tracts) A) Conventional B) Refinancings C) Non-occupant Loans on Number Average Value Number Average Value Number Average Value
LOANS ORIGINATED 61 $105,753 22 $135,985 7 $50,904 APPLICATIONS APPROVED, NOT ACCEPTED 8 $146,555 6 $152,648 0 $0 APPLICATIONS DENIED 0 $0 0 $0 0 $0 APPLICATIONS WITHDRAWN 1 $146,030 2 $216,575 0 $0 FILES CLOSED FOR INCOMPLETENESS 0 $0 0 $0 0 $0
Aggregated Statistics For Year 2005(Based on 5 full and 2 partial tracts) A) Conventional B) Refinancings C) Non-occupant Loans on Number Average Value Number Average Value Number Average Value
LOANS ORIGINATED 58 $109,031 22 $126,888 14 $120,586 APPLICATIONS APPROVED, NOT ACCEPTED 9 $129,119 5 $156,122 1 $102,620 APPLICATIONS DENIED 0 $0 0 $0 0 $0 APPLICATIONS WITHDRAWN 4 $160,565 5 $197,192 1 $197,210 FILES CLOSED FOR INCOMPLETENESS 2 $136,000 2 $187,540 1 $97,000
Aggregated Statistics For Year 2004(Based on 5 full and 2 partial tracts) A) Conventional B) Refinancings C) Non-occupant Loans on Number Average Value Number Average Value Number Average Value
LOANS ORIGINATED 45 $93,978 36 $114,959 8 $100,644 APPLICATIONS APPROVED, NOT ACCEPTED 4 $106,128 12 $160,413 0 $0 APPLICATIONS DENIED 2 $95,085 0 $0 1 $97,000 APPLICATIONS WITHDRAWN 2 $58,375 3 $278,427 0 $0 FILES CLOSED FOR INCOMPLETENESS 2 $128,365 0 $0 0 $0
Aggregated Statistics For Year 2003(Based on 5 full and 2 partial tracts) A) Conventional B) Refinancings C) Non-occupant Loans on Number Average Value Number Average Value Number Average Value
LOANS ORIGINATED 51 $90,814 71 $108,579 6 $76,413 APPLICATIONS APPROVED, NOT ACCEPTED 10 $145,677 14 $108,833 0 $0 APPLICATIONS DENIED 1 $139,000 3 $75,053 0 $0 APPLICATIONS WITHDRAWN 4 $82,998 6 $152,512 0 $0 FILES CLOSED FOR INCOMPLETENESS 1 $62,000 2 $74,395 0 $0
Aggregated Statistics For Year 2002(Based on 5 full and 1 partial tracts) A) Conventional B) Refinancings C) Non-occupant Loans on Number Average Value Number Average Value Number Average Value
LOANS ORIGINATED 32 $94,787 42 $100,535 1 $18,000 APPLICATIONS APPROVED, NOT ACCEPTED 4 $100,008 9 $124,301 0 $0 APPLICATIONS DENIED 0 $0 2 $85,795 1 $88,260 APPLICATIONS WITHDRAWN 5 $129,446 2 $82,700 1 $68,000 FILES CLOSED FOR INCOMPLETENESS 1 $66,000 2 $92,630 0 $0
Aggregated Statistics For Year 2001(Based on 5 full and 1 partial tracts) A) Conventional B) Refinancings C) Non-occupant Loans on Number Average Value Number Average Value Number Average Value
LOANS ORIGINATED 40 $87,938 30 $111,930 2 $99,000 APPLICATIONS APPROVED, NOT ACCEPTED 9 $96,820 6 $123,585 1 $138,860 APPLICATIONS DENIED 1 $63,000 1 $79,190 1 $63,000 APPLICATIONS WITHDRAWN 3 $68,007 4 $103,212 0 $0 FILES CLOSED FOR INCOMPLETENESS 0 $0 0 $0 0 $0
Aggregated Statistics For Year 2000(Based on 5 full and 1 partial tracts) A) Conventional B) Refinancings C) Non-occupant Loans on Number Average Value Number Average Value Number Average Value
LOANS ORIGINATED 43 $82,980 7 $83,561 2 $80,645 APPLICATIONS APPROVED, NOT ACCEPTED 6 $105,913 1 $108,150 0 $0 APPLICATIONS DENIED 1 $77,930 0 $0 0 $0 APPLICATIONS WITHDRAWN 1 $97,000 0 $0 0 $0 FILES CLOSED FOR INCOMPLETENESS 0 $0 0 $0 0 $0
Aggregated Statistics For Year 1999(Based on 5 full and 1 partial tracts) A) Conventional B) Refinancings C) Non-occupant Loans on Number Average Value Number Average Value Number Average Value
LOANS ORIGINATED 47 $105,194 11 $120,712 2 $64,325 APPLICATIONS APPROVED, NOT ACCEPTED 2 $108,210 3 $97,333 0 $0 APPLICATIONS DENIED 0 $0 1 $94,550 0 $0 APPLICATIONS WITHDRAWN 2 $71,500 3 $120,667 0 $0 FILES CLOSED FOR INCOMPLETENESS 0 $0 0 $0 0 $0
Detailed PMIC statistics for the following Tracts:
0205.00
, 0206.00 , 0207.00 , 0208.02 , 0209.00 , 0210.00 , 0211.00 Fire-safe hotels and motels in Athens, Alabama:
Best Western Athens Inn, 1329 Hwy 72 E, Athens, Alabama 35611 Phone: (256) 233-4030, Fax: (256) 233-4554
Welcome Inn, Hwy 31 S US Hwy 72, Athens, Alabama 35611 Phone: (256) 232-6944
Days Inn Athens, 1322 Hwy 72 E, Athens, Alabama 35611 Phone: (256) 867-4320, Fax: (256) 233-7500
Super 8, 1325 Hwy 72 E, Athens, Alabama 35611 Phone: (256) 233-1446, Fax: (256) 233-1454
Quality Inn, 1488 Thrasher Blvd, Athens, Alabama 35611 Phone: (256) 232-0030, Fax: (256) 233-7006
Comfort Inn, 1218 Kelli Dr, Athens, Alabama 35613 Phone: (256) 232-2704, Fax: (256) 230-3783
Country Hearth Inn & Suites, 1500 Hwy 72 E & I-65, Athens, Alabama 35611 Phone: (256) 232-1520, Fax: (256) 233-8525
Sleep Inn-athens, 1115 Audubon Ln, Athens, Alabama 35611 Phone: (256) 232-4700
4 other hotels and motels
All 12 fire-safe hotels and motels in Athens, Alabama
Most common first names in Athens, AL among deceased individuals Name Count Lived (average)
James 356 73.2 years William 323 72.8 years John 259 73.5 years Mary 258 78.3 years Robert 192 72.3 years George 124 74.0 years Charles 122 69.0 years Thomas 110 74.3 years Willie 97 76.2 years Annie 78 81.1 years
Most common last names in Athens, AL among deceased individuals Last name Count Lived (average)
Smith 187 73.2 years Johnson 109 75.0 years Malone 99 74.1 years Davis 99 74.7 years Black 96 77.0 years Adams 80 74.2 years Moore 70 73.6 years Jones 68 74.4 years Carter 68 76.6 years Williams 67 72.7 years
Athens compared to Alabama state average:
Unemployed percentage significantly below state average. Hispanic race population percentage significantly above state average. Foreign-born population percentage above state average. Length of stay since moving in above state average. Percentage of population with a bachelor's degree or higher above state average.
#59 on the list of "Top 101 cities with the most people driving a car to work alone (population 5,000+)"
#4 on the list of "Top 101 counties with the largest number of people moving in compared to moving out (pop. 50,000+)"
#81 on the list of "Top 101 counties with highest percentage of residents voting for Romney (Republican) in the 2012 Presidential Election (pop. 50,000+)"
Top Patent Applicants
Eric Merkt (6)
Lonnie F. Bradburn, Jr. (5)
Kelly Loum (5)
Benjamin F. Harbin, Iii (3)
Kenneth R. Brown (3)
Kevin W. Pressnell (3)
Jon Thomas Gawlak (2)
Eric L. Merkt (2)
Steven F. Selby (2)
Mark Wells (2)
Total of 70 patent applications in 2008-2024.


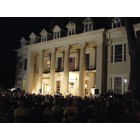


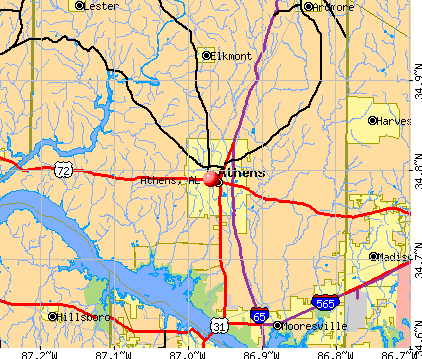


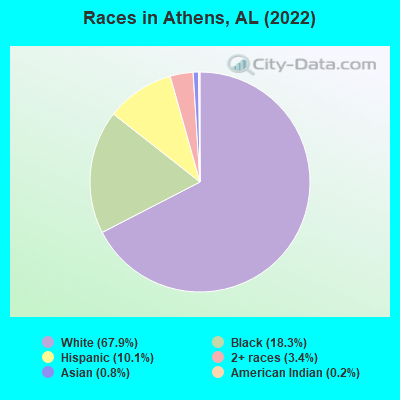
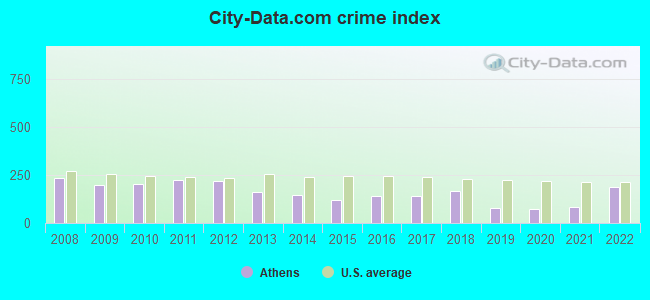
 Recent articles from our blog. Our writers, many of them Ph.D. graduates or candidates, create easy-to-read articles on a wide variety of topics.


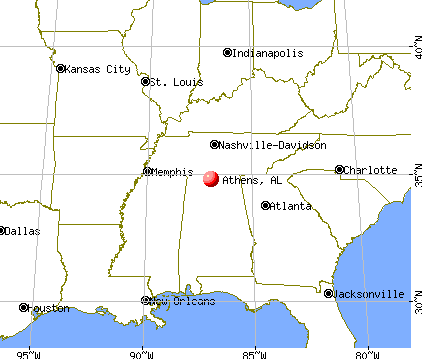
 (14.5 miles
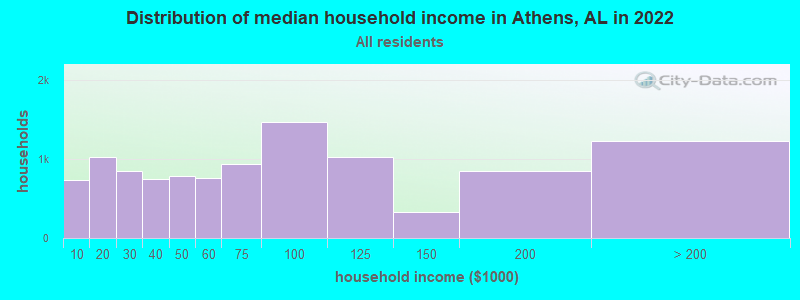
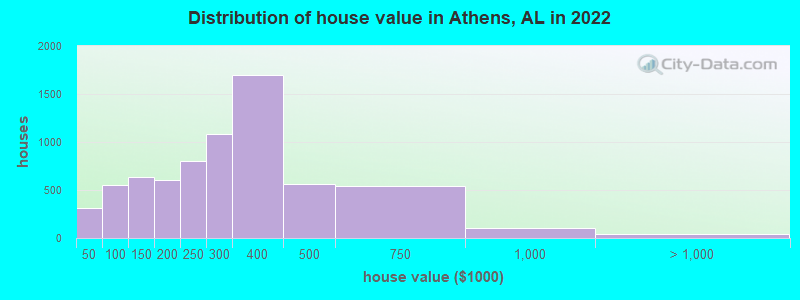
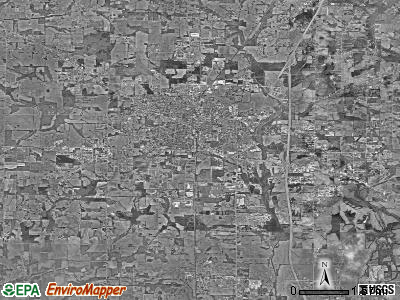
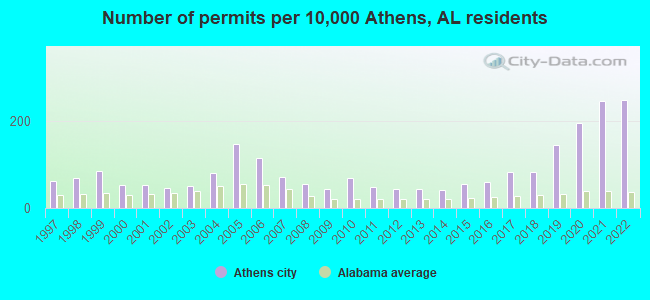
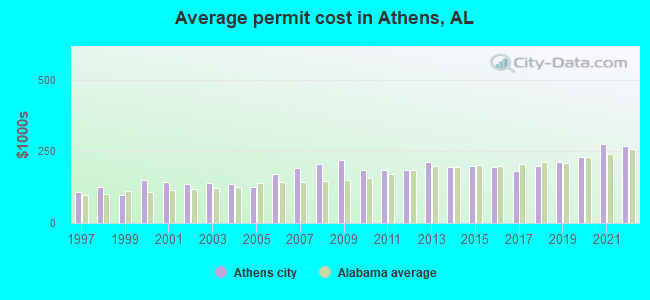
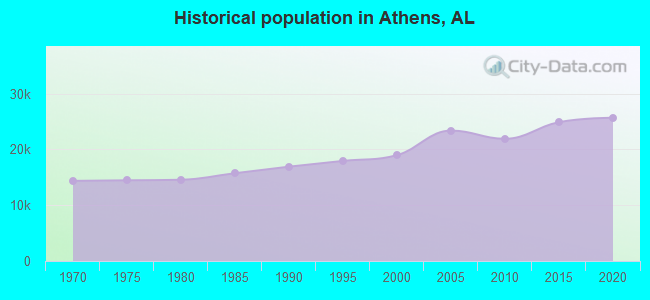
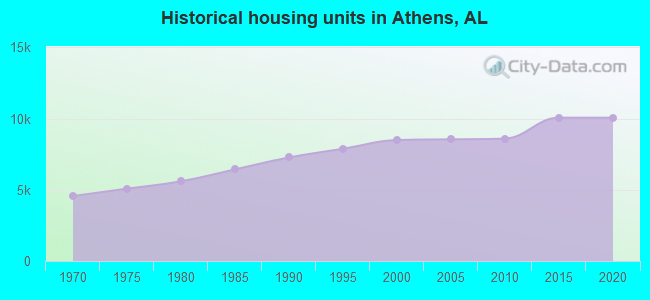
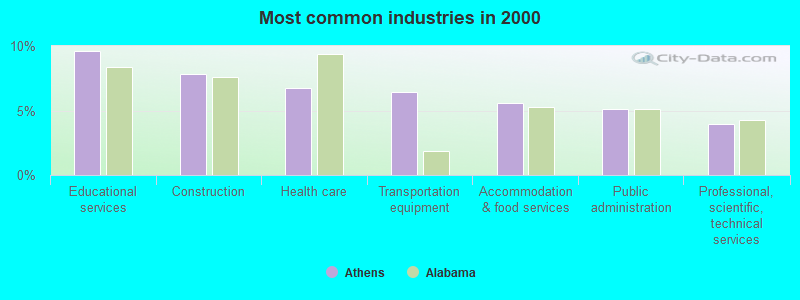
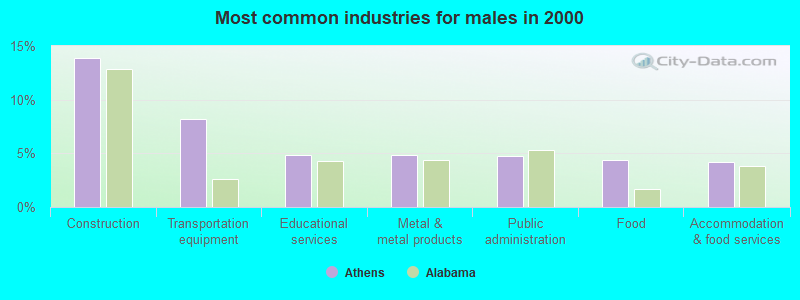
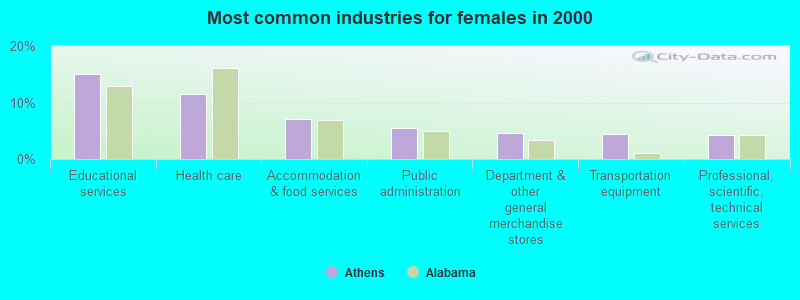
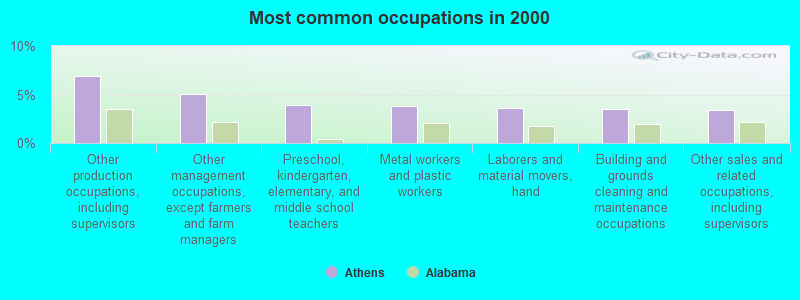
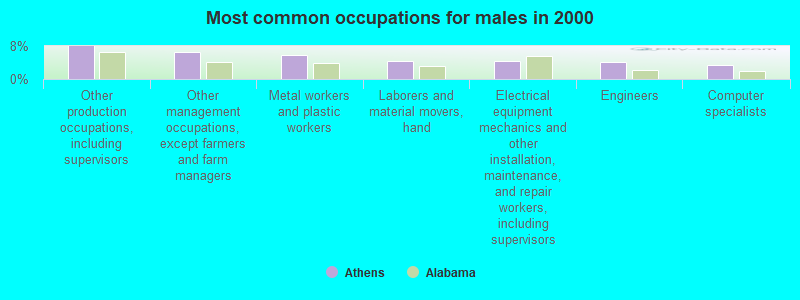
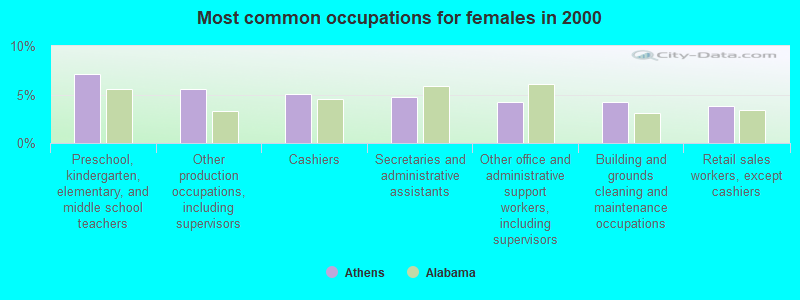
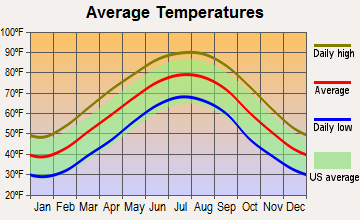
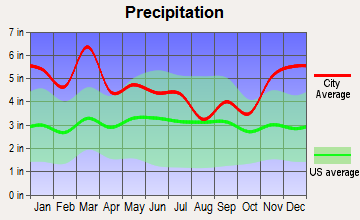
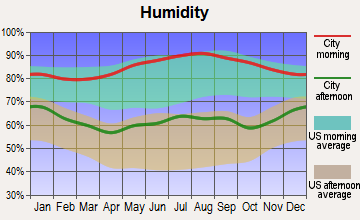
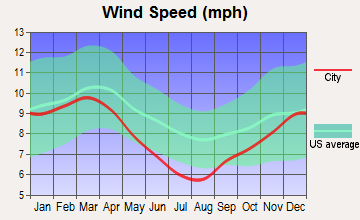
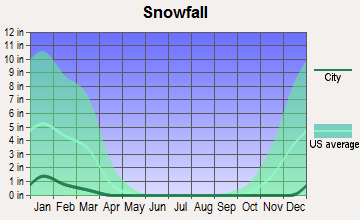

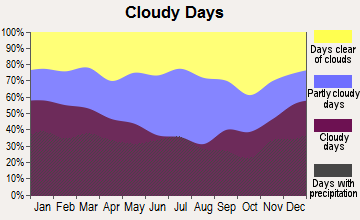
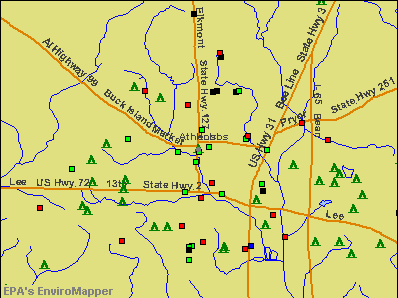

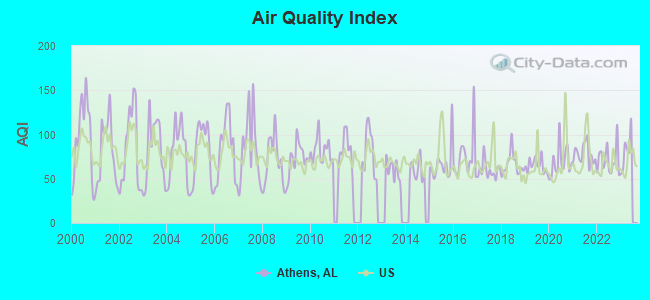
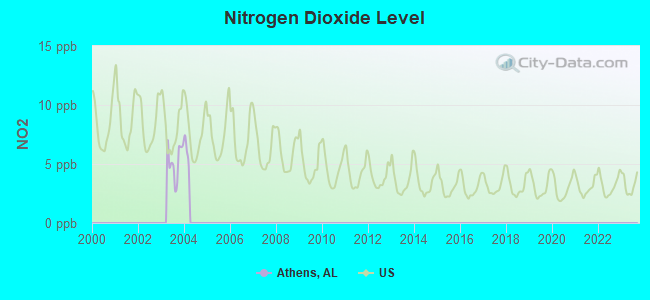
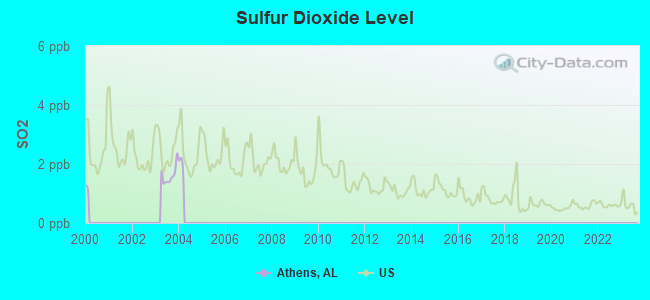
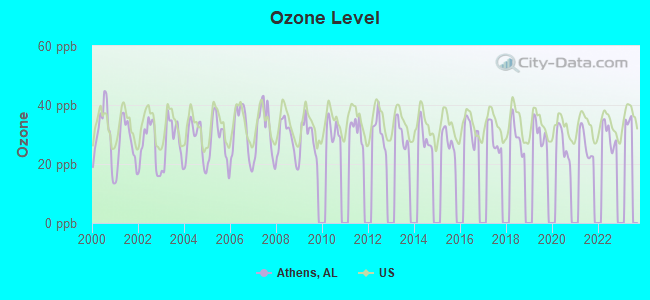
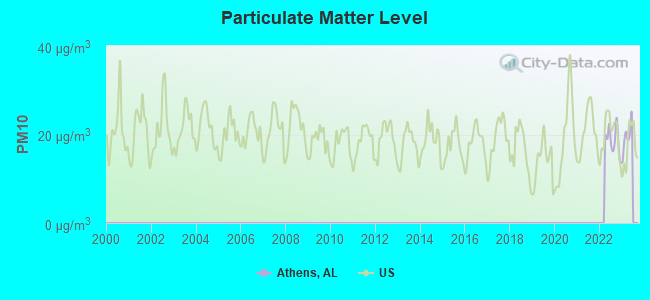
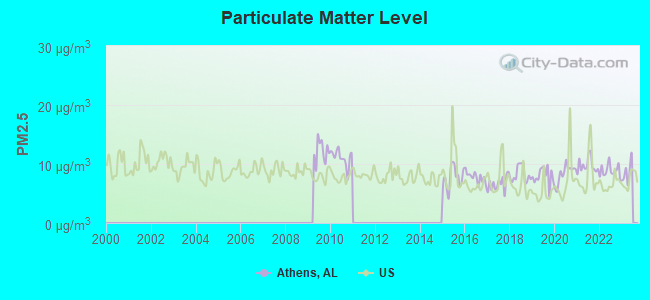

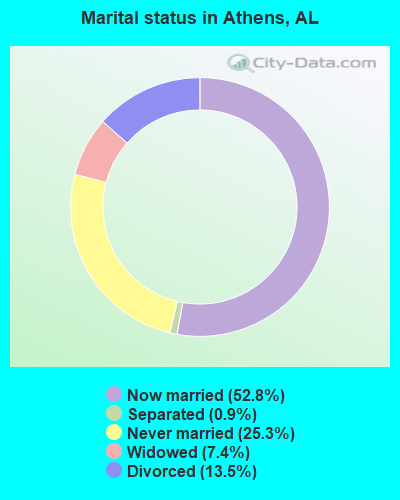
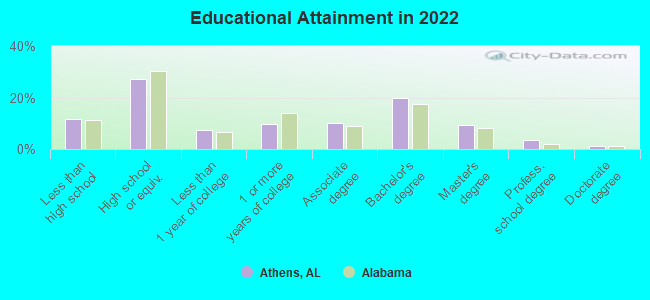
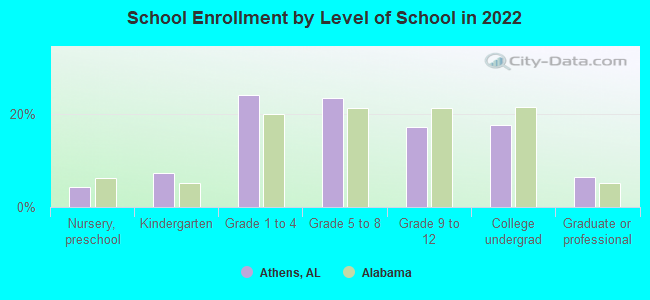
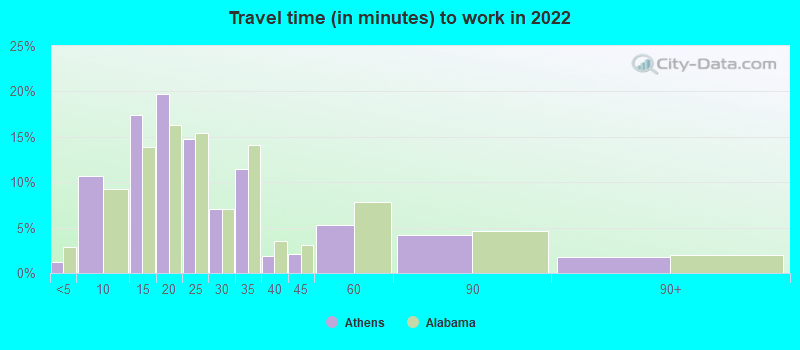
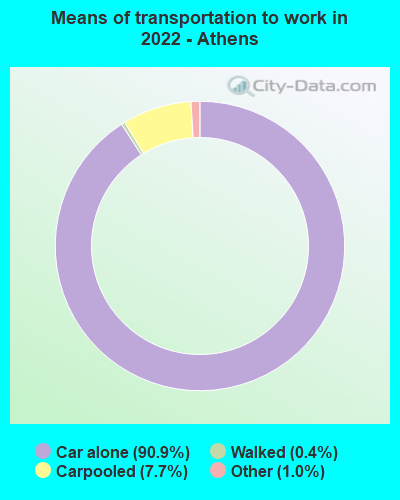
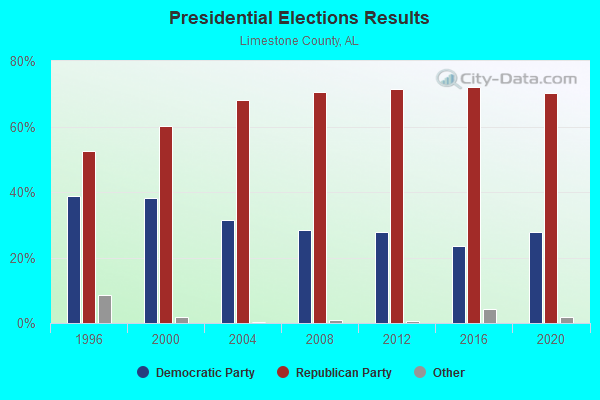
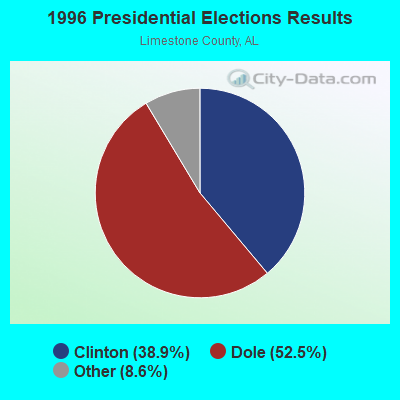
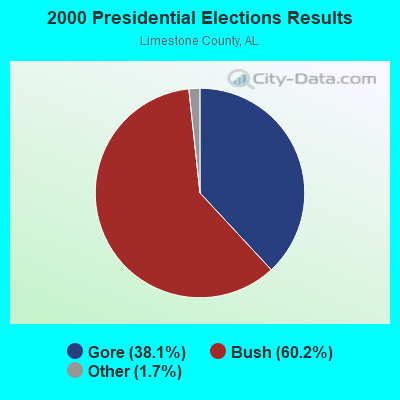
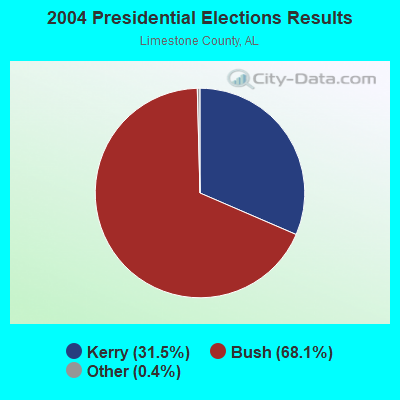


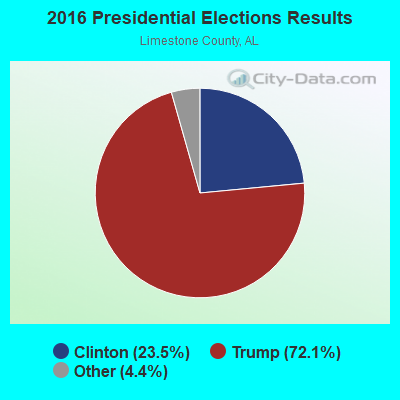
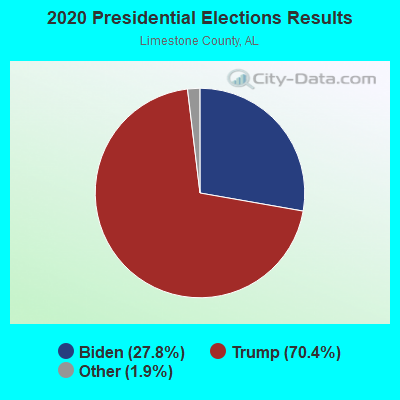
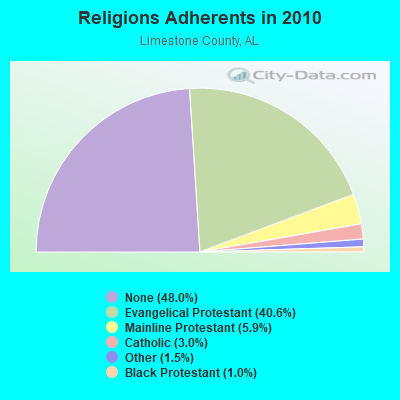
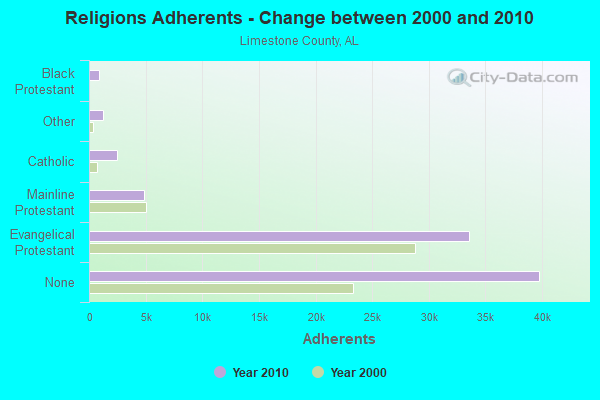
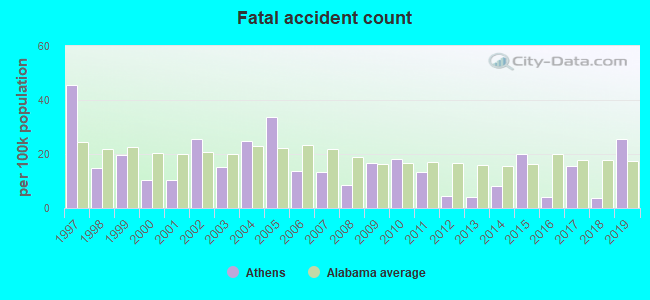
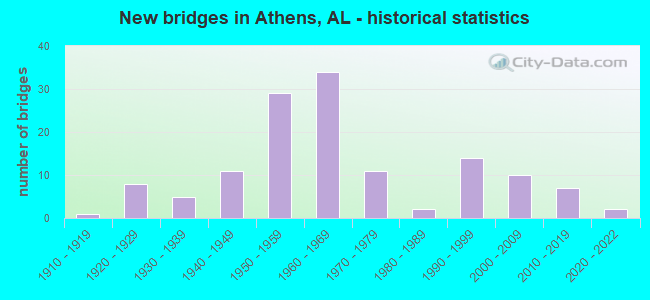
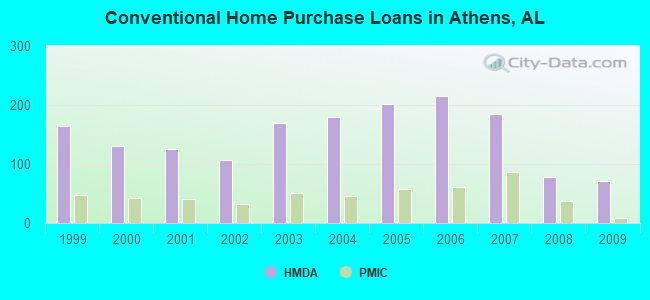
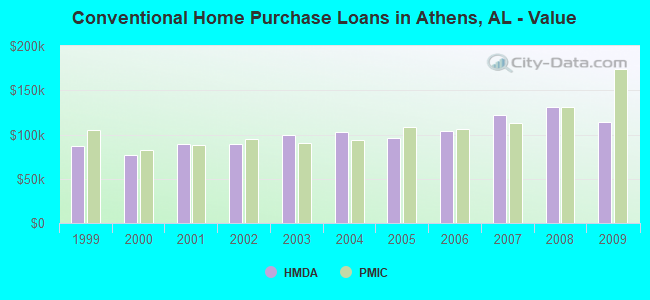
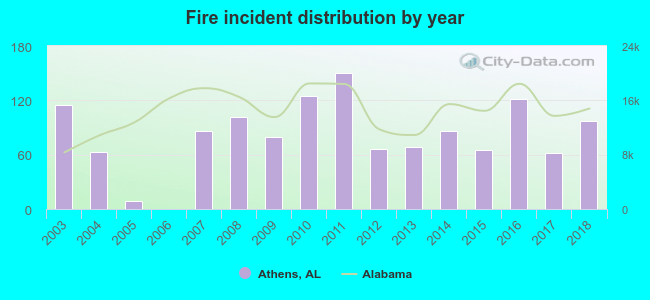 According to the data from the years 2003 - 2018 the average number of fires per year is 81. The highest number of reported fires - 150 took place in 2011, and the least - 0 in 2006. The data has a dropping trend.
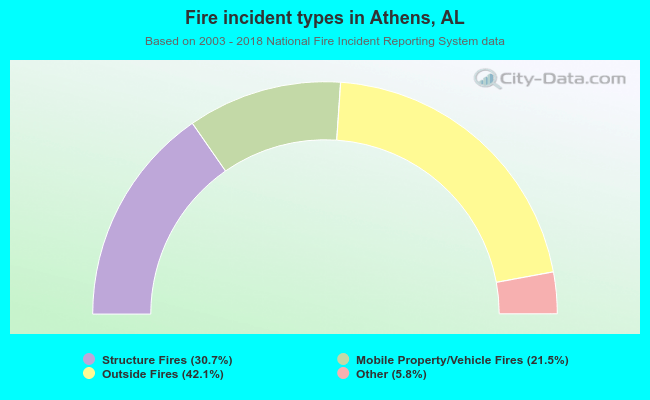 When looking into fire subcategories, the most incidents belonged to: Outside Fires (42.1%), and Structure Fires (30.7%).