Elk Grove, California Submit your own pictures of this place and show them to the world
OSM Map
General Map
Google Map
MSN Map
OSM Map
General Map
Google Map
MSN Map
OSM Map
General Map
Google Map
MSN Map
OSM Map
General Map
Google Map
MSN Map
Please wait while loading the map...
Population in 2022: 177,558 (98% urban, 2% rural). Population change since 2000: +196.0%Males: 86,619 Females: 90,939
March 2022 cost of living index in Elk Grove: 102.6 (near average, U.S. average is 100) Percentage of residents living in poverty in 2022: 8.4%for White Non-Hispanic residents , 14.5% for Black residents , 6.4% for Hispanic or Latino residents , 11.2% for American Indian residents , 13.2% for Native Hawaiian and other Pacific Islander residents , 7.2% for other race residents , 4.9% for two or more races residents )
Profiles of local businesses
Business Search - 14 Million verified businesses
Data:
Median household income ($)
Median household income (% change since 2000)
Household income diversity
Ratio of average income to average house value (%)
Ratio of average income to average rent
Median household income ($) - White
Median household income ($) - Black or African American
Median household income ($) - Asian
Median household income ($) - Hispanic or Latino
Median household income ($) - American Indian and Alaska Native
Median household income ($) - Multirace
Median household income ($) - Other Race
Median household income for houses/condos with a mortgage ($)
Median household income for apartments without a mortgage ($)
Races - White alone (%)
Races - White alone (% change since 2000)
Races - Black alone (%)
Races - Black alone (% change since 2000)
Races - American Indian alone (%)
Races - American Indian alone (% change since 2000)
Races - Asian alone (%)
Races - Asian alone (% change since 2000)
Races - Hispanic (%)
Races - Hispanic (% change since 2000)
Races - Native Hawaiian and Other Pacific Islander alone (%)
Races - Native Hawaiian and Other Pacific Islander alone (% change since 2000)
Races - Two or more races (%)
Races - Two or more races (% change since 2000)
Races - Other race alone (%)
Races - Other race alone (% change since 2000)
Racial diversity
Unemployment (%)
Unemployment (% change since 2000)
Unemployment (%) - White
Unemployment (%) - Black or African American
Unemployment (%) - Asian
Unemployment (%) - Hispanic or Latino
Unemployment (%) - American Indian and Alaska Native
Unemployment (%) - Multirace
Unemployment (%) - Other Race
Population density (people per square mile)
Population - Males (%)
Population - Females (%)
Population - Males (%) - White
Population - Males (%) - Black or African American
Population - Males (%) - Asian
Population - Males (%) - Hispanic or Latino
Population - Males (%) - American Indian and Alaska Native
Population - Males (%) - Multirace
Population - Males (%) - Other Race
Population - Females (%) - White
Population - Females (%) - Black or African American
Population - Females (%) - Asian
Population - Females (%) - Hispanic or Latino
Population - Females (%) - American Indian and Alaska Native
Population - Females (%) - Multirace
Population - Females (%) - Other Race
Coronavirus confirmed cases (Apr 26, 2024)
Deaths caused by coronavirus (Apr 26, 2024)
Coronavirus confirmed cases (per 100k population) (Apr 26, 2024)
Deaths caused by coronavirus (per 100k population) (Apr 26, 2024)
Daily increase in number of cases (Apr 26, 2024)
Weekly increase in number of cases (Apr 26, 2024)
Cases doubled (in days) (Apr 26, 2024)
Hospitalized patients (Apr 18, 2022)
Negative test results (Apr 18, 2022)
Total test results (Apr 18, 2022)
COVID Vaccine doses distributed (per 100k population) (Sep 19, 2023)
COVID Vaccine doses administered (per 100k population) (Sep 19, 2023)
COVID Vaccine doses distributed (Sep 19, 2023)
COVID Vaccine doses administered (Sep 19, 2023)
Likely homosexual households (%)
Likely homosexual households (% change since 2000)
Likely homosexual households - Lesbian couples (%)
Likely homosexual households - Lesbian couples (% change since 2000)
Likely homosexual households - Gay men (%)
Likely homosexual households - Gay men (% change since 2000)
Cost of living index
Median gross rent ($)
Median contract rent ($)
Median monthly housing costs ($)
Median house or condo value ($)
Median house or condo value ($ change since 2000)
Mean house or condo value by units in structure - 1, detached ($)
Mean house or condo value by units in structure - 1, attached ($)
Mean house or condo value by units in structure - 2 ($)
Mean house or condo value by units in structure by units in structure - 3 or 4 ($)
Mean house or condo value by units in structure - 5 or more ($)
Mean house or condo value by units in structure - Boat, RV, van, etc. ($)
Mean house or condo value by units in structure - Mobile home ($)
Median house or condo value ($) - White
Median house or condo value ($) - Black or African American
Median house or condo value ($) - Asian
Median house or condo value ($) - Hispanic or Latino
Median house or condo value ($) - American Indian and Alaska Native
Median house or condo value ($) - Multirace
Median house or condo value ($) - Other Race
Median resident age
Resident age diversity
Median resident age - Males
Median resident age - Females
Median resident age - White
Median resident age - Black or African American
Median resident age - Asian
Median resident age - Hispanic or Latino
Median resident age - American Indian and Alaska Native
Median resident age - Multirace
Median resident age - Other Race
Median resident age - Males - White
Median resident age - Males - Black or African American
Median resident age - Males - Asian
Median resident age - Males - Hispanic or Latino
Median resident age - Males - American Indian and Alaska Native
Median resident age - Males - Multirace
Median resident age - Males - Other Race
Median resident age - Females - White
Median resident age - Females - Black or African American
Median resident age - Females - Asian
Median resident age - Females - Hispanic or Latino
Median resident age - Females - American Indian and Alaska Native
Median resident age - Females - Multirace
Median resident age - Females - Other Race
Commute - mean travel time to work (minutes)
Travel time to work - Less than 5 minutes (%)
Travel time to work - Less than 5 minutes (% change since 2000)
Travel time to work - 5 to 9 minutes (%)
Travel time to work - 5 to 9 minutes (% change since 2000)
Travel time to work - 10 to 19 minutes (%)
Travel time to work - 10 to 19 minutes (% change since 2000)
Travel time to work - 20 to 29 minutes (%)
Travel time to work - 20 to 29 minutes (% change since 2000)
Travel time to work - 30 to 39 minutes (%)
Travel time to work - 30 to 39 minutes (% change since 2000)
Travel time to work - 40 to 59 minutes (%)
Travel time to work - 40 to 59 minutes (% change since 2000)
Travel time to work - 60 to 89 minutes (%)
Travel time to work - 60 to 89 minutes (% change since 2000)
Travel time to work - 90 or more minutes (%)
Travel time to work - 90 or more minutes (% change since 2000)
Marital status - Never married (%)
Marital status - Now married (%)
Marital status - Separated (%)
Marital status - Widowed (%)
Marital status - Divorced (%)
Median family income ($)
Median family income (% change since 2000)
Median non-family income ($)
Median non-family income (% change since 2000)
Median per capita income ($)
Median per capita income (% change since 2000)
Median family income ($) - White
Median family income ($) - Black or African American
Median family income ($) - Asian
Median family income ($) - Hispanic or Latino
Median family income ($) - American Indian and Alaska Native
Median family income ($) - Multirace
Median family income ($) - Other Race
Median year house/condo built
Median year apartment built
Year house built - Built 2005 or later (%)
Year house built - Built 2000 to 2004 (%)
Year house built - Built 1990 to 1999 (%)
Year house built - Built 1980 to 1989 (%)
Year house built - Built 1970 to 1979 (%)
Year house built - Built 1960 to 1969 (%)
Year house built - Built 1950 to 1959 (%)
Year house built - Built 1940 to 1949 (%)
Year house built - Built 1939 or earlier (%)
Average household size
Household density (households per square mile)
Average household size - White
Average household size - Black or African American
Average household size - Asian
Average household size - Hispanic or Latino
Average household size - American Indian and Alaska Native
Average household size - Multirace
Average household size - Other Race
Occupied housing units (%)
Vacant housing units (%)
Owner occupied housing units (%)
Renter occupied housing units (%)
Vacancy status - For rent (%)
Vacancy status - For sale only (%)
Vacancy status - Rented or sold, not occupied (%)
Vacancy status - For seasonal, recreational, or occasional use (%)
Vacancy status - For migrant workers (%)
Vacancy status - Other vacant (%)
Residents with income below the poverty level (%)
Residents with income below 50% of the poverty level (%)
Children below poverty level (%)
Poor families by family type - Married-couple family (%)
Poor families by family type - Male, no wife present (%)
Poor families by family type - Female, no husband present (%)
Poverty status for native-born residents (%)
Poverty status for foreign-born residents (%)
Poverty among high school graduates not in families (%)
Poverty among people who did not graduate high school not in families (%)
Residents with income below the poverty level (%) - White
Residents with income below the poverty level (%) - Black or African American
Residents with income below the poverty level (%) - Asian
Residents with income below the poverty level (%) - Hispanic or Latino
Residents with income below the poverty level (%) - American Indian and Alaska Native
Residents with income below the poverty level (%) - Multirace
Residents with income below the poverty level (%) - Other Race
Air pollution - Air Quality Index (AQI)
Air pollution - CO
Air pollution - NO2
Air pollution - SO2
Air pollution - Ozone
Air pollution - PM10
Air pollution - PM25
Air pollution - Pb
Crime - Murders per 100,000 population
Crime - Rapes per 100,000 population
Crime - Robberies per 100,000 population
Crime - Assaults per 100,000 population
Crime - Burglaries per 100,000 population
Crime - Thefts per 100,000 population
Crime - Auto thefts per 100,000 population
Crime - Arson per 100,000 population
Crime - City-data.com crime index
Crime - Violent crime index
Crime - Property crime index
Crime - Murders per 100,000 population (5 year average)
Crime - Rapes per 100,000 population (5 year average)
Crime - Robberies per 100,000 population (5 year average)
Crime - Assaults per 100,000 population (5 year average)
Crime - Burglaries per 100,000 population (5 year average)
Crime - Thefts per 100,000 population (5 year average)
Crime - Auto thefts per 100,000 population (5 year average)
Crime - Arson per 100,000 population (5 year average)
Crime - City-data.com crime index (5 year average)
Crime - Violent crime index (5 year average)
Crime - Property crime index (5 year average)
1996 Presidential Elections Results (%) - Democratic Party (Clinton)
1996 Presidential Elections Results (%) - Republican Party (Dole)
1996 Presidential Elections Results (%) - Other
2000 Presidential Elections Results (%) - Democratic Party (Gore)
2000 Presidential Elections Results (%) - Republican Party (Bush)
2000 Presidential Elections Results (%) - Other
2004 Presidential Elections Results (%) - Democratic Party (Kerry)
2004 Presidential Elections Results (%) - Republican Party (Bush)
2004 Presidential Elections Results (%) - Other
2008 Presidential Elections Results (%) - Democratic Party (Obama)
2008 Presidential Elections Results (%) - Republican Party (McCain)
2008 Presidential Elections Results (%) - Other
2012 Presidential Elections Results (%) - Democratic Party (Obama)
2012 Presidential Elections Results (%) - Republican Party (Romney)
2012 Presidential Elections Results (%) - Other
2016 Presidential Elections Results (%) - Democratic Party (Clinton)
2016 Presidential Elections Results (%) - Republican Party (Trump)
2016 Presidential Elections Results (%) - Other
2020 Presidential Elections Results (%) - Democratic Party (Biden)
2020 Presidential Elections Results (%) - Republican Party (Trump)
2020 Presidential Elections Results (%) - Other
Ancestries Reported - Arab (%)
Ancestries Reported - Czech (%)
Ancestries Reported - Danish (%)
Ancestries Reported - Dutch (%)
Ancestries Reported - English (%)
Ancestries Reported - French (%)
Ancestries Reported - French Canadian (%)
Ancestries Reported - German (%)
Ancestries Reported - Greek (%)
Ancestries Reported - Hungarian (%)
Ancestries Reported - Irish (%)
Ancestries Reported - Italian (%)
Ancestries Reported - Lithuanian (%)
Ancestries Reported - Norwegian (%)
Ancestries Reported - Polish (%)
Ancestries Reported - Portuguese (%)
Ancestries Reported - Russian (%)
Ancestries Reported - Scotch-Irish (%)
Ancestries Reported - Scottish (%)
Ancestries Reported - Slovak (%)
Ancestries Reported - Subsaharan African (%)
Ancestries Reported - Swedish (%)
Ancestries Reported - Swiss (%)
Ancestries Reported - Ukrainian (%)
Ancestries Reported - United States (%)
Ancestries Reported - Welsh (%)
Ancestries Reported - West Indian (%)
Ancestries Reported - Other (%)
Educational Attainment - No schooling completed (%)
Educational Attainment - Less than high school (%)
Educational Attainment - High school or equivalent (%)
Educational Attainment - Less than 1 year of college (%)
Educational Attainment - 1 or more years of college (%)
Educational Attainment - Associate degree (%)
Educational Attainment - Bachelor's degree (%)
Educational Attainment - Master's degree (%)
Educational Attainment - Professional school degree (%)
Educational Attainment - Doctorate degree (%)
School Enrollment - Nursery, preschool (%)
School Enrollment - Kindergarten (%)
School Enrollment - Grade 1 to 4 (%)
School Enrollment - Grade 5 to 8 (%)
School Enrollment - Grade 9 to 12 (%)
School Enrollment - College undergrad (%)
School Enrollment - Graduate or professional (%)
School Enrollment - Not enrolled in school (%)
School enrollment - Public schools (%)
School enrollment - Private schools (%)
School enrollment - Not enrolled (%)
Median number of rooms in houses and condos
Median number of rooms in apartments
Housing units lacking complete plumbing facilities (%)
Housing units lacking complete kitchen facilities (%)
Density of houses
Urban houses (%)
Rural houses (%)
Households with people 60 years and over (%)
Households with people 65 years and over (%)
Households with people 75 years and over (%)
Households with one or more nonrelatives (%)
Households with no nonrelatives (%)
Population in households (%)
Family households (%)
Nonfamily households (%)
Population in families (%)
Family households with own children (%)
Median number of bedrooms in owner occupied houses
Mean number of bedrooms in owner occupied houses
Median number of bedrooms in renter occupied houses
Mean number of bedrooms in renter occupied houses
Median number of vehichles in owner occupied houses
Mean number of vehichles in owner occupied houses
Median number of vehichles in renter occupied houses
Mean number of vehichles in renter occupied houses
Mortgage status - with mortgage (%)
Mortgage status - with second mortgage (%)
Mortgage status - with home equity loan (%)
Mortgage status - with both second mortgage and home equity loan (%)
Mortgage status - without a mortgage (%)
Average family size
Average family size - White
Average family size - Black or African American
Average family size - Asian
Average family size - Hispanic or Latino
Average family size - American Indian and Alaska Native
Average family size - Multirace
Average family size - Other Race
Geographical mobility - Same house 1 year ago (%)
Geographical mobility - Moved within same county (%)
Geographical mobility - Moved from different county within same state (%)
Geographical mobility - Moved from different state (%)
Geographical mobility - Moved from abroad (%)
Place of birth - Born in state of residence (%)
Place of birth - Born in other state (%)
Place of birth - Native, outside of US (%)
Place of birth - Foreign born (%)
Housing units in structures - 1, detached (%)
Housing units in structures - 1, attached (%)
Housing units in structures - 2 (%)
Housing units in structures - 3 or 4 (%)
Housing units in structures - 5 to 9 (%)
Housing units in structures - 10 to 19 (%)
Housing units in structures - 20 to 49 (%)
Housing units in structures - 50 or more (%)
Housing units in structures - Mobile home (%)
Housing units in structures - Boat, RV, van, etc. (%)
House/condo owner moved in on average (years ago)
Renter moved in on average (years ago)
Year householder moved into unit - Moved in 1999 to March 2000 (%)
Year householder moved into unit - Moved in 1995 to 1998 (%)
Year householder moved into unit - Moved in 1990 to 1994 (%)
Year householder moved into unit - Moved in 1980 to 1989 (%)
Year householder moved into unit - Moved in 1970 to 1979 (%)
Year householder moved into unit - Moved in 1969 or earlier (%)
Means of transportation to work - Drove car alone (%)
Means of transportation to work - Carpooled (%)
Means of transportation to work - Public transportation (%)
Means of transportation to work - Bus or trolley bus (%)
Means of transportation to work - Streetcar or trolley car (%)
Means of transportation to work - Subway or elevated (%)
Means of transportation to work - Railroad (%)
Means of transportation to work - Ferryboat (%)
Means of transportation to work - Taxicab (%)
Means of transportation to work - Motorcycle (%)
Means of transportation to work - Bicycle (%)
Means of transportation to work - Walked (%)
Means of transportation to work - Other means (%)
Working at home (%)
Industry diversity
Most Common Industries - Agriculture, forestry, fishing and hunting, and mining (%)
Most Common Industries - Agriculture, forestry, fishing and hunting (%)
Most Common Industries - Mining, quarrying, and oil and gas extraction (%)
Most Common Industries - Construction (%)
Most Common Industries - Manufacturing (%)
Most Common Industries - Wholesale trade (%)
Most Common Industries - Retail trade (%)
Most Common Industries - Transportation and warehousing, and utilities (%)
Most Common Industries - Transportation and warehousing (%)
Most Common Industries - Utilities (%)
Most Common Industries - Information (%)
Most Common Industries - Finance and insurance, and real estate and rental and leasing (%)
Most Common Industries - Finance and insurance (%)
Most Common Industries - Real estate and rental and leasing (%)
Most Common Industries - Professional, scientific, and management, and administrative and waste management services (%)
Most Common Industries - Professional, scientific, and technical services (%)
Most Common Industries - Management of companies and enterprises (%)
Most Common Industries - Administrative and support and waste management services (%)
Most Common Industries - Educational services, and health care and social assistance (%)
Most Common Industries - Educational services (%)
Most Common Industries - Health care and social assistance (%)
Most Common Industries - Arts, entertainment, and recreation, and accommodation and food services (%)
Most Common Industries - Arts, entertainment, and recreation (%)
Most Common Industries - Accommodation and food services (%)
Most Common Industries - Other services, except public administration (%)
Most Common Industries - Public administration (%)
Occupation diversity
Most Common Occupations - Management, business, science, and arts occupations (%)
Most Common Occupations - Management, business, and financial occupations (%)
Most Common Occupations - Management occupations (%)
Most Common Occupations - Business and financial operations occupations (%)
Most Common Occupations - Computer, engineering, and science occupations (%)
Most Common Occupations - Computer and mathematical occupations (%)
Most Common Occupations - Architecture and engineering occupations (%)
Most Common Occupations - Life, physical, and social science occupations (%)
Most Common Occupations - Education, legal, community service, arts, and media occupations (%)
Most Common Occupations - Community and social service occupations (%)
Most Common Occupations - Legal occupations (%)
Most Common Occupations - Education, training, and library occupations (%)
Most Common Occupations - Arts, design, entertainment, sports, and media occupations (%)
Most Common Occupations - Healthcare practitioners and technical occupations (%)
Most Common Occupations - Health diagnosing and treating practitioners and other technical occupations (%)
Most Common Occupations - Health technologists and technicians (%)
Most Common Occupations - Service occupations (%)
Most Common Occupations - Healthcare support occupations (%)
Most Common Occupations - Protective service occupations (%)
Most Common Occupations - Fire fighting and prevention, and other protective service workers including supervisors (%)
Most Common Occupations - Law enforcement workers including supervisors (%)
Most Common Occupations - Food preparation and serving related occupations (%)
Most Common Occupations - Building and grounds cleaning and maintenance occupations (%)
Most Common Occupations - Personal care and service occupations (%)
Most Common Occupations - Sales and office occupations (%)
Most Common Occupations - Sales and related occupations (%)
Most Common Occupations - Office and administrative support occupations (%)
Most Common Occupations - Natural resources, construction, and maintenance occupations (%)
Most Common Occupations - Farming, fishing, and forestry occupations (%)
Most Common Occupations - Construction and extraction occupations (%)
Most Common Occupations - Installation, maintenance, and repair occupations (%)
Most Common Occupations - Production, transportation, and material moving occupations (%)
Most Common Occupations - Production occupations (%)
Most Common Occupations - Transportation occupations (%)
Most Common Occupations - Material moving occupations (%)
People in Group quarters - Institutionalized population (%)
People in Group quarters - Correctional institutions (%)
People in Group quarters - Federal prisons and detention centers (%)
People in Group quarters - Halfway houses (%)
People in Group quarters - Local jails and other confinement facilities (including police lockups) (%)
People in Group quarters - Military disciplinary barracks (%)
People in Group quarters - State prisons (%)
People in Group quarters - Other types of correctional institutions (%)
People in Group quarters - Nursing homes (%)
People in Group quarters - Hospitals/wards, hospices, and schools for the handicapped (%)
People in Group quarters - Hospitals/wards and hospices for chronically ill (%)
People in Group quarters - Hospices or homes for chronically ill (%)
People in Group quarters - Military hospitals or wards for chronically ill (%)
People in Group quarters - Other hospitals or wards for chronically ill (%)
People in Group quarters - Hospitals or wards for drug/alcohol abuse (%)
People in Group quarters - Mental (Psychiatric) hospitals or wards (%)
People in Group quarters - Schools, hospitals, or wards for the mentally retarded (%)
People in Group quarters - Schools, hospitals, or wards for the physically handicapped (%)
People in Group quarters - Institutions for the deaf (%)
People in Group quarters - Institutions for the blind (%)
People in Group quarters - Orthopedic wards and institutions for the physically handicapped (%)
People in Group quarters - Wards in general hospitals for patients who have no usual home elsewhere (%)
People in Group quarters - Wards in military hospitals for patients who have no usual home elsewhere (%)
People in Group quarters - Juvenile institutions (%)
People in Group quarters - Long-term care (%)
People in Group quarters - Homes for abused, dependent, and neglected children (%)
People in Group quarters - Residential treatment centers for emotionally disturbed children (%)
People in Group quarters - Training schools for juvenile delinquents (%)
People in Group quarters - Short-term care, detention or diagnostic centers for delinquent children (%)
People in Group quarters - Type of juvenile institution unknown (%)
People in Group quarters - Noninstitutionalized population (%)
People in Group quarters - College dormitories (includes college quarters off campus) (%)
People in Group quarters - Military quarters (%)
People in Group quarters - On base (%)
People in Group quarters - Barracks, unaccompanied personnel housing (UPH), (Enlisted/Officer), ;and similar group living quarters for military personnel (%)
People in Group quarters - Transient quarters for temporary residents (%)
People in Group quarters - Military ships (%)
People in Group quarters - Group homes (%)
People in Group quarters - Homes or halfway houses for drug/alcohol abuse (%)
People in Group quarters - Homes for the mentally ill (%)
People in Group quarters - Homes for the mentally retarded (%)
People in Group quarters - Homes for the physically handicapped (%)
People in Group quarters - Other group homes (%)
People in Group quarters - Religious group quarters (%)
People in Group quarters - Dormitories (%)
People in Group quarters - Agriculture workers' dormitories on farms (%)
People in Group quarters - Job Corps and vocational training facilities (%)
People in Group quarters - Other workers' dormitories (%)
People in Group quarters - Crews of maritime vessels (%)
People in Group quarters - Other nonhousehold living situations (%)
People in Group quarters - Other noninstitutional group quarters (%)
Residents speaking English at home (%)
Residents speaking English at home - Born in the United States (%)
Residents speaking English at home - Native, born elsewhere (%)
Residents speaking English at home - Foreign born (%)
Residents speaking Spanish at home (%)
Residents speaking Spanish at home - Born in the United States (%)
Residents speaking Spanish at home - Native, born elsewhere (%)
Residents speaking Spanish at home - Foreign born (%)
Residents speaking other language at home (%)
Residents speaking other language at home - Born in the United States (%)
Residents speaking other language at home - Native, born elsewhere (%)
Residents speaking other language at home - Foreign born (%)
Class of Workers - Employee of private company (%)
Class of Workers - Self-employed in own incorporated business (%)
Class of Workers - Private not-for-profit wage and salary workers (%)
Class of Workers - Local government workers (%)
Class of Workers - State government workers (%)
Class of Workers - Federal government workers (%)
Class of Workers - Self-employed workers in own not incorporated business and Unpaid family workers (%)
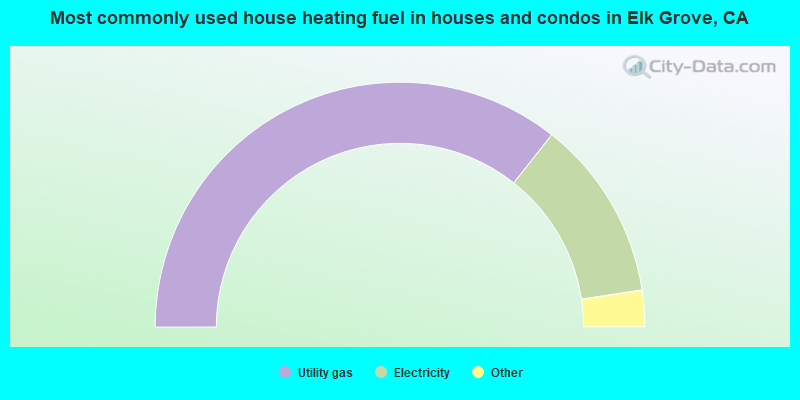
House heating fuel used in houses and condos - Utility gas (%)
House heating fuel used in houses and condos - Bottled, tank, or LP gas (%)
House heating fuel used in houses and condos - Electricity (%)
House heating fuel used in houses and condos - Fuel oil, kerosene, etc. (%)
House heating fuel used in houses and condos - Coal or coke (%)
House heating fuel used in houses and condos - Wood (%)
House heating fuel used in houses and condos - Solar energy (%)
House heating fuel used in houses and condos - Other fuel (%)
House heating fuel used in houses and condos - No fuel used (%)
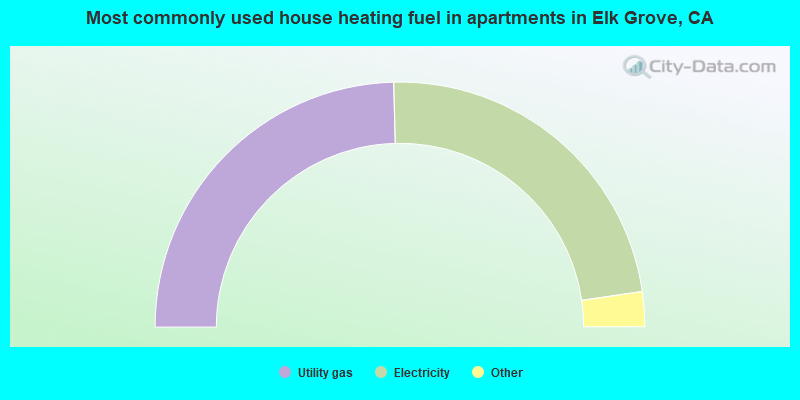
House heating fuel used in apartments - Utility gas (%)
House heating fuel used in apartments - Bottled, tank, or LP gas (%)
House heating fuel used in apartments - Electricity (%)
House heating fuel used in apartments - Fuel oil, kerosene, etc. (%)
House heating fuel used in apartments - Coal or coke (%)
House heating fuel used in apartments - Wood (%)
House heating fuel used in apartments - Solar energy (%)
House heating fuel used in apartments - Other fuel (%)
House heating fuel used in apartments - No fuel used (%)
Armed forces status - In Armed Forces (%)
Armed forces status - Civilian (%)
Armed forces status - Civilian - Veteran (%)
Armed forces status - Civilian - Nonveteran (%)
Fatal accidents locations in years 2005-2021
Fatal accidents locations in 2005
Fatal accidents locations in 2006
Fatal accidents locations in 2007
Fatal accidents locations in 2008
Fatal accidents locations in 2009
Fatal accidents locations in 2010
Fatal accidents locations in 2011
Fatal accidents locations in 2012
Fatal accidents locations in 2013
Fatal accidents locations in 2014
Fatal accidents locations in 2015
Fatal accidents locations in 2016
Fatal accidents locations in 2017
Fatal accidents locations in 2018
Fatal accidents locations in 2019
Fatal accidents locations in 2020
Fatal accidents locations in 2021
Alcohol use - People drinking some alcohol every month (%)
Alcohol use - People not drinking at all (%)
Alcohol use - Average days/month drinking alcohol
Alcohol use - Average drinks/week
Alcohol use - Average days/year people drink much
Audiometry - Average condition of hearing (%)
Audiometry - People that can hear a whisper from across a quiet room (%)
Audiometry - People that can hear normal voice from across a quiet room (%)
Audiometry - Ears ringing, roaring, buzzing (%)
Audiometry - Had a job exposure to loud noise (%)
Audiometry - Had off-work exposure to loud noise (%)
Blood Pressure & Cholesterol - Has high blood pressure (%)
Blood Pressure & Cholesterol - Checking blood pressure at home (%)
Blood Pressure & Cholesterol - Frequently checking blood cholesterol (%)
Blood Pressure & Cholesterol - Has high cholesterol level (%)
Consumer Behavior - Money monthly spent on food at supermarket/grocery store
Consumer Behavior - Money monthly spent on food at other stores
Consumer Behavior - Money monthly spent on eating out
Consumer Behavior - Money monthly spent on carryout/delivered foods
Consumer Behavior - Income spent on food at supermarket/grocery store (%)
Consumer Behavior - Income spent on food at other stores (%)
Consumer Behavior - Income spent on eating out (%)
Consumer Behavior - Income spent on carryout/delivered foods (%)
Current Health Status - General health condition (%)
Current Health Status - Blood donors (%)
Current Health Status - Has blood ever tested for HIV virus (%)
Current Health Status - Left-handed people (%)
Dermatology - People using sunscreen (%)
Diabetes - Diabetics (%)
Diabetes - Had a blood test for high blood sugar (%)
Diabetes - People taking insulin (%)
Diet Behavior & Nutrition - Diet health (%)
Diet Behavior & Nutrition - Milk product consumption (# of products/month)
Diet Behavior & Nutrition - Meals not home prepared (#/week)
Diet Behavior & Nutrition - Meals from fast food or pizza place (#/week)
Diet Behavior & Nutrition - Ready-to-eat foods (#/month)
Diet Behavior & Nutrition - Frozen meals/pizza (#/month)
Drug Use - People that ever used marijuana or hashish (%)
Drug Use - Ever used hard drugs (%)
Drug Use - Ever used any form of cocaine (%)
Drug Use - Ever used heroin (%)
Drug Use - Ever used methamphetamine (%)
Health Insurance - People covered by health insurance (%)
Kidney Conditions-Urology - Avg. # of times urinating at night
Medical Conditions - People with asthma (%)
Medical Conditions - People with anemia (%)
Medical Conditions - People with psoriasis (%)
Medical Conditions - People with overweight (%)
Medical Conditions - Elderly people having difficulties in thinking or remembering (%)
Medical Conditions - People who ever received blood transfusion (%)
Medical Conditions - People having trouble seeing even with glass/contacts (%)
Medical Conditions - People with arthritis (%)
Medical Conditions - People with gout (%)
Medical Conditions - People with congestive heart failure (%)
Medical Conditions - People with coronary heart disease (%)
Medical Conditions - People with angina pectoris (%)
Medical Conditions - People who ever had heart attack (%)
Medical Conditions - People who ever had stroke (%)
Medical Conditions - People with emphysema (%)
Medical Conditions - People with thyroid problem (%)
Medical Conditions - People with chronic bronchitis (%)
Medical Conditions - People with any liver condition (%)
Medical Conditions - People who ever had cancer or malignancy (%)
Mental Health - People who have little interest in doing things (%)
Mental Health - People feeling down, depressed, or hopeless (%)
Mental Health - People who have trouble sleeping or sleeping too much (%)
Mental Health - People feeling tired or having little energy (%)
Mental Health - People with poor appetite or overeating (%)
Mental Health - People feeling bad about themself (%)
Mental Health - People who have trouble concentrating on things (%)
Mental Health - People moving or speaking slowly or too fast (%)
Mental Health - People having thoughts they would be better off dead (%)
Oral Health - Average years since last visit a dentist
Oral Health - People embarrassed because of mouth (%)
Oral Health - People with gum disease (%)
Oral Health - General health of teeth and gums (%)
Oral Health - Average days a week using dental floss/device
Oral Health - Average days a week using mouthwash for dental problem
Oral Health - Average number of teeth
Pesticide Use - Households using pesticides to control insects (%)
Pesticide Use - Households using pesticides to kill weeds (%)
Physical Activity - People doing vigorous-intensity work activities (%)
Physical Activity - People doing moderate-intensity work activities (%)
Physical Activity - People walking or bicycling (%)
Physical Activity - People doing vigorous-intensity recreational activities (%)
Physical Activity - People doing moderate-intensity recreational activities (%)
Physical Activity - Average hours a day doing sedentary activities
Physical Activity - Average hours a day watching TV or videos
Physical Activity - Average hours a day using computer
Physical Functioning - People having limitations keeping them from working (%)
Physical Functioning - People limited in amount of work they can do (%)
Physical Functioning - People that need special equipment to walk (%)
Physical Functioning - People experiencing confusion/memory problems (%)
Physical Functioning - People requiring special healthcare equipment (%)
Prescription Medications - Average number of prescription medicines taking
Preventive Aspirin Use - Adults 40+ taking low-dose aspirin (%)
Reproductive Health - Vaginal deliveries (%)
Reproductive Health - Cesarean deliveries (%)
Reproductive Health - Deliveries resulted in a live birth (%)
Reproductive Health - Pregnancies resulted in a delivery (%)
Reproductive Health - Women breastfeeding newborns (%)
Reproductive Health - Women that had a hysterectomy (%)
Reproductive Health - Women that had both ovaries removed (%)
Reproductive Health - Women that have ever taken birth control pills (%)
Reproductive Health - Women taking birth control pills (%)
Reproductive Health - Women that have ever used Depo-Provera or injectables (%)
Reproductive Health - Women that have ever used female hormones (%)
Sexual Behavior - People 18+ that ever had sex (vaginal, anal, or oral) (%)
Sexual Behavior - Males 18+ that ever had vaginal sex with a woman (%)
Sexual Behavior - Males 18+ that ever performed oral sex on a woman (%)
Sexual Behavior - Males 18+ that ever had anal sex with a woman (%)
Sexual Behavior - Males 18+ that ever had any sex with a man (%)
Sexual Behavior - Females 18+ that ever had vaginal sex with a man (%)
Sexual Behavior - Females 18+ that ever performed oral sex on a man (%)
Sexual Behavior - Females 18+ that ever had anal sex with a man (%)
Sexual Behavior - Females 18+ that ever had any kind of sex with a woman (%)
Sexual Behavior - Average age people first had sex
Sexual Behavior - Average number of female sex partners in lifetime (males 18+)
Sexual Behavior - Average number of female vaginal sex partners in lifetime (males 18+)
Sexual Behavior - Average age people first performed oral sex on a woman (18+)
Sexual Behavior - Average number of woman performed oral sex on in lifetime (18+)
Sexual Behavior - Average number of male sex partners in lifetime (males 18+)
Sexual Behavior - Average number of male anal sex partners in lifetime (males 18+)
Sexual Behavior - Average age people first performed oral sex on a man (18+)
Sexual Behavior - Average number of male oral sex partners in lifetime (18+)
Sexual Behavior - People using protection when performing oral sex (%)
Sexual Behavior - Average number of times people have vaginal or anal sex a year
Sexual Behavior - People having sex without condom (%)
Sexual Behavior - Average number of male sex partners in lifetime (females 18+)
Sexual Behavior - Average number of male vaginal sex partners in lifetime (females 18+)
Sexual Behavior - Average number of female sex partners in lifetime (females 18+)
Sexual Behavior - Circumcised males 18+ (%)
Sleep Disorders - Average hours sleeping at night
Sleep Disorders - People that has trouble sleeping (%)
Smoking-Cigarette Use - People smoking cigarettes (%)
Taste & Smell - People 40+ having problems with smell (%)
Taste & Smell - People 40+ having problems with taste (%)
Taste & Smell - People 40+ that ever had wisdom teeth removed (%)
Taste & Smell - People 40+ that ever had tonsils teeth removed (%)
Taste & Smell - People 40+ that ever had a loss of consciousness because of a head injury (%)
Taste & Smell - People 40+ that ever had a broken nose or other serious injury to face or skull (%)
Taste & Smell - People 40+ that ever had two or more sinus infections (%)
Weight - Average height (inches)
Weight - Average weight (pounds)
Weight - Average BMI
Weight - People that are obese (%)
Weight - People that ever were obese (%)
Weight - People trying to lose weight (%)
62,287 35.1% Asian alone 42,693 24.0% White alone 34,073 19.2% Hispanic 20,854 11.7% Black alone 12,124 6.8% Two or more races 3,048 1.7% Native Hawaiian and Other 2,051 1.2% Other race alone 428 0.2% American Indian alone
According to our research of California and other state lists, there were 150 registered sex offenders living in Elk Grove, California as of April 26, 2024 . The ratio of all residents to sex offenders in Elk Grove is 1,132 to 1.The ratio of registered sex offenders to all residents in this city is lower than the state average.
The City-Data.com crime index weighs serious crimes and violent crimes more heavily. Higher means more crime, U.S. average is 246.1. It adjusts for the number of visitors and daily workers commuting into cities.
- means the value is smaller than the state average.
- means the value is about the same as the state average.
- means the value is bigger than the state average.
Crime rate in Elk Grove detailed stats: murders, rapes, robberies, assaults, burglaries, thefts, arson Officers per 1,000 residents here:
0.77California average:
2.30
Latest news from Elk Grove, CA collected exclusively by city-data.com from local newspapers, TV, and radio stations
Ancestries: English (2.5%), German (2.3%), American (2.2%), Italian (2.1%), Afghan (2.0%), European (1.7%).
Current Local Time:
Land area: 15.2 square miles.
Population density: 11,684 people per square mile (high).
44,489 residents are foreign born (18.0% Asia , 3.6% Latin America ).
This place:
25.2%California:
26.5%
Median real estate property taxes paid for housing units with mortgages in 2022: $5,002 (0.8%)Median real estate property taxes paid for housing units with no mortgage in 2022: $4,683 (0.8%)
Nearest city with pop. 200,000+: Sacramento, CA
Nearest city with pop. 1,000,000+: Los Angeles, CA
Nearest cities:
Freeport, CA (2.6 miles)
Latitude: 38.44 N, Longitude: 121.38 W
Daytime population change due to commuting: -25,133 (-14.2%)Workers who live and work in this place: 34,053 (42.5%)
Single-family new house construction building permits:
2022: 581 buildings , average cost: $218,7002021: 563 buildings , average cost: $227,9002020: 760 buildings , average cost: $206,7002019: 764 buildings , average cost: $207,6002018: 693 buildings , average cost: $210,6002017: 402 buildings , average cost: $187,2002016: 455 buildings , average cost: $192,0002015: 665 buildings , average cost: $204,3002014: 571 buildings , average cost: $220,7002013: 387 buildings , average cost: $340,3002012: 368 buildings , average cost: $187,9002011: 252 buildings , average cost: $236,7002010: 296 buildings , average cost: $203,9002009: 201 buildings , average cost: $216,0002008: 257 buildings , average cost: $226,4002007: 693 buildings , average cost: $194,9002006: 614 buildings , average cost: $243,8002005: 2603 buildings , average cost: $222,6002004: 4049 buildings , average cost: $247,6002003: 3716 buildings , average cost: $239,0002002: 804 buildings , average cost: $212,700Unemployment in December 2023:
Most common occupations in Elk Grove, CA (%)
Both Males Females
Other management occupations, except farmers and farm managers (5.0%)
Computer specialists (4.5%)
Cooks and food preparation workers (4.3%)
Other office and administrative support workers, including supervisors (3.3%)
Material recording, scheduling, dispatching, and distributing workers (2.9%)
Registered nurses (2.7%)
Supervisors and other personal care and service workers, except child care workers (2.7%)
Computer specialists (6.3%)
Cooks and food preparation workers (5.2%)
Other management occupations, except farmers and farm managers (5.1%)
Building and grounds cleaning and maintenance occupations (3.9%)
Driver/sales workers and truck drivers (3.7%)
Material recording, scheduling, dispatching, and distributing workers (3.4%)
Electrical equipment mechanics and other installation, maintenance, and repair workers, including supervisors (3.1%)
Other office and administrative support workers, including supervisors (5.6%)
Registered nurses (5.2%)
Other management occupations, except farmers and farm managers (5.0%)
Information and record clerks, except customer service representatives (3.5%)
Secretaries and administrative assistants (3.4%)
Cooks and food preparation workers (3.3%)
Counselors, social workers, and other community and social service specialists (3.1%)
Earthquake activity:
Elk Grove-area historical earthquake activity is significantly above California state average. It is 7770% greater than the overall U.S. average. On 4/18/1906 at 13:12:21, a magnitude 7.9 (7.9 UK, Class: Major, Intensity: VIII - XII) earthquake occurred 93.0 miles away from Elk Grove center, causing $524,000,000 total damage On 10/18/1989 at 00:04:15, a magnitude 7.1 (6.5 MB, 7.1 MS, 6.9 MW, 7.0 ML) earthquake occurred 94.3 miles away from the city center, causing 62 deaths ( 62 shaking deaths) and 3757 injuries, causing $1,305,032,704 total damage On 7/21/1952 at 11:52:14, a magnitude 7.7 (7.7 UK) earthquake occurred 272.0 miles away from Elk Grove center, causing $50,000,000 total damage On 10/3/1915 at 06:52:48, a magnitude 7.6 (7.6 UK) earthquake occurred 251.6 miles away from Elk Grove center On 11/4/1927 at 13:51:53, a magnitude 7.5 (7.5 UK) earthquake occurred 244.5 miles away from Elk Grove center On 12/21/1932 at 06:10:09, a magnitude 7.2 (7.2 UK) earthquake occurred 178.6 miles away from the city center Magnitude types: body-wave magnitude (MB), local magnitude (ML), surface-wave magnitude (MS), moment magnitude (MW) Natural disasters: The number of natural disasters in Sacramento County (18) is near the US average (15).Major Disasters (Presidential) Declared: 11Emergencies Declared: 3Floods: 13, Winter Storms: 6, Storms: 5, Mudslides: 4, Landslides: 3, Drought: 1, Earthquake: 1, Heavy Rain: 1, Hurricane: 1, Tornado: 1, Wind: 1, Other: 1 (Note: some incidents may be assigned to more than one category). Hospitals and medical centers in Elk Grove: WINDSOR ELK GROVE CARE AND REHABILITATION CENTER (9461 BATEY AVENUE)
ELK GROVE DIALYSIS (9281 OFFICE PARK CIRCLE #105)
RAI ELK GROVE BLVD. (8139 ELK GROVE BOULEVARD SUITE 200)
WEST ELK GROVE DIALYSIS CENTER (2208 KAUSEN DRIVE SUITE 100)
COUNTRY HOME CARE (9370 WEST STOCKTON BLVD #130)
Amtrak stations near Elk Grove: 12 miles: RANCHO CORDOVA (10369 FOLSOM BLVD.) - Bus Station Services: fully wheelchair accessible, free short-term parking, public transit connection.
12 miles: SACRAMENTO (401 I ST.) Services: ticket office, partially wheelchair accessible, enclosed waiting area, public restrooms, public payphones, vending machines, paid short-term parking, paid long-term parking, call for car rental service, call for taxi service, public transit connection.
College/University in Elk Grove: InterCoast Colleges-Elk Grove Full-time enrollment: 65; Location: 9355 E. Stockton; Private, for-profit; Website: www.intercoast.edu)
Colleges/universities with over 2000 students nearest to Elk Grove:
Cosumnes River College (about 3 miles; Sacramento, CA ; Full-time enrollment: 9,327)
California State University-Sacramento (about 9 miles; Sacramento, CA ; FT enrollment: 22,234)
Sacramento City College (about 10 miles; Sacramento, CA ; FT enrollment: 15,963)
University of Phoenix-Sacramento Valley Campus (about 15 miles; Sacramento, CA ; FT enrollment: 2,855)
American River College (about 15 miles; Sacramento, CA ; FT enrollment: 20,452)
Universal Technical Institute of Northern California Inc (about 17 miles; Sacramento, CA ; FT enrollment: 3,193)
Folsom Lake College (about 21 miles; Folsom, CA ; FT enrollment: 5,308)
Public high schools in Elk Grove: MONTEREY TRAIL HIGH Students: 1,581, Location: 8661 POWER INN RD., Grades: 9-12)PLEASANT GROVE HIGH Students: 1,561, Location: 9531 BOND RD., Grades: 9-12)ELK GROVE HIGH Students: 1,296, Location: 9800 ELK GROVE-FLORIN RD., Grades: 9-12)LAGUNA CREEK HIGH Students: 1,280, Location: 9050 VICINO DR., Grades: 9-12)COSUMNES OAKS HIGH Students: 597, Location: 8350 LOTZ PKWY., Grades: 9-12)ELK GROVE CHARTER Students: 108, Location: 10065 ATKINS DR., Grades: 7-12, Charter school )JESSIE BAKER Students: 91, Location: 8850 S.SIDE AVE., Grades: KG-12)TRANSITION HIGH (CONTINUATION) Students: 62, Location: 9800 ELK GROVE-FLORIN RD., Grades: 9-12)FRANKLIN HIGH Location: 6400 WHITELOCK PKWY., Grades: 9-12)
Private high schools in Elk Grove: LUTHERAN HIGH SCHOOL Students: 65, Location: 9270 BRUCEVILLE RD, Grades: 9-12)
CABRINI ACADEMY Students: 6, Location: 8829 LAND STAR WAY, Grades: 9-11)
Biggest public elementary/middle schools in Elk Grove: TOBY JOHNSON MIDDLE Students: 1,410, Location: 10099 FRANKLIN HIGH RD., Grades: 7-8)KATHERINE L. ALBIANI MIDDLE Students: 1,239, Location: 9140 BRADSHAW RD., Grades: 7-8)EDWARD HARRIS, JR. MIDDLE Students: 1,170, Location: 8691 POWER INN RD., Grades: 7-8)JOSEPH KERR MIDDLE Students: 905, Location: 8865 ELK GROVE BLVD., Grades: 7-8)JOSEPH SIMS ELEMENTARY Students: 822, Location: 3033 BUCKMINSTER DR., Grades: KG-6)HARRIET G. EDDY MIDDLE Students: 737, Location: 9329 SOARING OAKS DR., Grades: 7-8)FOULKS RANCH ELEMENTARY Students: 736, Location: 6211 LAGUNA PARK DR., Grades: KG-6)EDNA BATEY ELEMENTARY Students: 713, Location: 9421 STONEBROOK DR., Grades: KG-6)IRENE B. WEST ELEMENTARY Students: 709, Location: 8625 SERIO WAY, Grades: KG-6)ELITHA DONNER ELEMENTARY Students: 706, Location: 9461 SOARING OAKS DR., Grades: KG-6)Private elementary/middle schools in Elk Grove: ST ELIZABETH ANN SETON CATHOLIC SCHOOL Students: 419, Location: 9539 RACQUET CT, Grades: PK-8)
ST PETER'S LUTHERAN SCHOOL Students: 222, Location: 8701 ELK GROVE FLORIN RD, Grades: PK-8)
See full list of schools located in Elk Grove User-submitted facts and corrections:
Franklin High School in Elk Grove. Also, St. Elizabeth Ann Seaton School.
Notable locations in Elk Grove: (A) , Elk Grove Community Library (B) , Sacramento Metropolitan Fire District Station 51 (C) , Sacramento Metropolitan Fire District Station 50 (D) , Sacramento County Sheriff - South Division Stationhouse (E) , Cosumnes Community Services District Fire Department Station 76 (F) , Cosumnes Community Services District Fire Department Station 71 (G) . Display/hide their locations on the map
Shopping Centers: (1) , Elk Grove Village Shopping Center (2) . Display/hide their locations on the map
Churches in Elk Grove include: (A) , Church of Christ (B) , Elk Grove Church of the Nazarene (C) , Elk Grove United Methodist Church (D) , First Baptist Church of Elk Grove (E) , Full Gospel Community Church (F) , New Life Assembly of God Church (G) , Crossroads Community Church (H) , Sierra Vista Christian Church (I) . Display/hide their locations on the map
Cemeteries: (1) , South East Lawn Memorial Park (2) , Masonic Cemetery (3) . Display/hide their locations on the map
Parks in Elk Grove include: (1) , Camden Park (2) , Cottonwood Park (3) , Feickert Park (4) , Illa Collin Park (5) , Mix Park (6) , Vintage Park (7) , Countryside Community Park (8) , Countryside Park (9) . Display/hide their locations on the map
Tourist attraction: (1) . Display/hide its approximate location on the map
Birthplace of: Casey Weathers - Baseball player, Ryan Dinwiddie - Football player, Akiem Hicks - Football player, Allison Brennan - Novelist, DeMarcus Nelson - College basketball player (Duke Blue Devils), Isaiah Ross (American football) - Football player.
Sacramento County has a predicted average indoor radon screening level less than 2 pCi/L (pico curies per liter) - Low Potential Drinking water stations with addresses in Elk Grove and their reported violations in the past:
HAPPY GARDEN RESTAURANT (Population served: 250, Groundwater):
Past monitoring violations:
One regular monitoring violation
Population served: 100, Groundwater):
Past health violations:
MCL, Monthly (TCR) - Between JUL-2008 and SEP-2008, Contaminant: Coliform. Follow-up actions: St Formal NOV issued (AUG-26-2008), St Tech Assistance Visit (AUG-26-2008), St Compliance achieved (AUG-26-2008), St Public Notif issued (AUG-26-2008)
Population served: 100, Groundwater):
Past health violations:
MCL, Monthly (TCR) - In OCT-2010, Contaminant: Coliform
MCL, Monthly (TCR) - In AUG-2010, Contaminant: Coliform. Follow-up actions: St Formal NOV issued (OCT-04-2010)
MCL, Monthly (TCR) - In JAN-2010, Contaminant: Coliform. Follow-up actions: St Site Visit (enforcement) (JAN-08-2010), St Compliance achieved (2 times from FEB-03-2010 to FEB-03-2010), St Violation/Reminder Notice (FEB-24-2010)
MCL, Monthly (TCR) - In OCT-2007, Contaminant: Coliform. Follow-up actions: St Compliance achieved (OCT-18-2007), St Public Notif issued (NOV-05-2007)
MCL, Monthly (TCR) - In OCT-2007, Contaminant: Coliform. Follow-up actions: St Public Notif issued (NOV-05-2007)
Past monitoring violations:
Monitoring, Repeat Major (TCR) - In NOV-2007, Contaminant: Coliform (TCR). Follow-up actions: St Violation/Reminder Notice (DEC-19-2007)
Monitoring, Repeat Major (TCR) - In NOV-2007, Contaminant: Coliform (TCR). Follow-up actions: St Compliance achieved (DEC-18-2007), St Violation/Reminder Notice (DEC-19-2007)
4 routine major monitoring violations
2 minor monitoring violations
Population served: 50, Groundwater):
Past monitoring violations:
6 routine major monitoring violations
Drinking water stations with addresses in Elk Grove that have no violations reported:
WILTON CHEVRON (Population served: 300, Primary Water Source Type: Groundwater)
SILVA S SHELDON INN (Population served: 100, Primary Water Source Type: Groundwater)
VINCE S RESTAURANT (Population served: 100, Primary Water Source Type: Groundwater)
SHELDON TRADING POST (Population served: 60, Primary Water Source Type: Groundwater)
Average household size: This place:
3.2 peopleCalifornia:
2.9 people
Percentage of family households: This place:
80.5%Whole state:
68.7%
Percentage of households with unmarried partners: This place:
5.8%Whole state:
7.2%
Likely homosexual households (counted as self-reported same-sex unmarried-partner households)
Lesbian couples: 0.4% of all households Gay men: 0.3% of all households
People in group quarters in Elk Grove in 2010:
314 people in group homes intended for adults
133 people in nursing facilities/skilled-nursing facilities
107 people in workers' group living quarters and job corps centers
39 people in residential treatment centers for adults
37 people in group homes for juveniles (non-correctional)
27 people in in-patient hospice facilities
6 people in correctional residential facilities
6 people in residential treatment centers for juveniles (non-correctional)
People in group quarters in Elk Grove in 2000:
154 people in nursing homes
149 people in other noninstitutional group quarters
33 people in homes for the mentally retarded
29 people in other group homes
15 people in homes for the mentally ill
13 people in mental (psychiatric) hospitals or wards
4 people in other nonhousehold living situations
Banks with most branches in Elk Grove (2011 data):
JPMorgan Chase Bank, National Association: Elk Grove Florin Branch, Elk Grove Branch, 7427 Laguna Boulevard Branch, Elk Grove Branch. Info updated 2011/11/10: Bank assets: $1,811,678.0 mil, Deposits: $1,190,738.0 mil, headquarters in Columbus, OH, positive income , International Specialization, 5577 total offices , Holding Company: Jpmorgan Chase & Co.
Bank of America, National Association: Elk Grove Branch, Laguna Creek Branch, Laguna Crossroads Branch, Laguna Reserve Marketplace Branch. Info updated 2009/11/18: Bank assets: $1,451,969.3 mil, Deposits: $1,077,176.8 mil, headquarters in Charlotte, NC, positive income , 5782 total offices , Holding Company: Bank Of America Corporation
Wells Fargo Bank, National Association: Laguna Gateway Branch, Laguna Creek Branch, Bond Road Branch. Info updated 2011/04/05: Bank assets: $1,161,490.0 mil, Deposits: $905,653.0 mil, headquarters in Sioux Falls, SD, positive income , 6395 total offices , Holding Company: Wells Fargo & Company
U.S. Bank National Association: Laguna Boulevard Safeway Branch, Elk Grove Laguna Branch, East Elk Grove. Info updated 2012/01/30: Bank assets: $330,470.8 mil, Deposits: $236,091.5 mil, headquarters in Cincinnati, OH, positive income , 3121 total offices , Holding Company: U.S. Bancorp
River City Bank: Elk Grove at 7127 Elk Grove Blvd, Suite 103, branch established on 2004/04/05; Elk Grove Branch at 8923 Elk Grove Boulevard, branch established on 1973/12/14. Info updated 2006/11/03: Bank assets: $1,119.8 mil, Deposits: $900.1 mil, headquarters in Sacramento, CA, positive income , Commercial Lending Specialization, 15 total offices
El Dorado Savings Bank, F.S.B.: Sheldon Branch at 8973 Grantline Rd Ste 103, branch established on 2008/02/04; Elk Grove Branch at 9003 Elk Grove Blvd, branch established on 1956/01/01. Info updated 2011/07/21: Bank assets: $1,706.7 mil, Deposits: $1,536.5 mil, headquarters in Placerville, CA, positive income , Mortgage Lending Specialization, 35 total offices
Tri Counties Bank: Elk Grove Branch at 4900 Elk Grove Boulevard, branch established on 2006/08/09. Info updated 2011/09/26: Bank assets: $2,554.4 mil, Deposits: $2,191.2 mil, headquarters in Chico, CA, positive income , Commercial Lending Specialization, 71 total offices , Holding Company: Trico Bancshares
Compass Bank: Elk Grove Branch at 9150 Elk Grove Florin Road, branch established on 1997/06/27. Info updated 2011/02/24: Bank assets: $63,107.0 mil, Deposits: $46,232.4 mil, headquarters in Birmingham, AL, negative income in the last year , Commercial Lending Specialization, 720 total offices , Holding Company: Banco Bilbao Vizcaya Argentaria, S.A.
Citibank, National Association: Elk Grove Branch at 8225 Laguna Blvd, branch established on 2006/10/01. Info updated 2012/01/10: Bank assets: $1,288,658.0 mil, Deposits: $882,541.0 mil, headquarters in Sioux Falls, SD, positive income , International Specialization, 1048 total offices , Holding Company: Citigroup Inc.
8 other banks with 8 local branches
For population 15 years and over in Elk Grove:
Never married: 32.5%Now married: 51.9%Separated: 1.6%Widowed: 4.4%Divorced: 9.6% For population 25 years and over in Elk Grove:
High school or higher: 89.4%Bachelor's degree or higher: 37.8%Graduate or professional degree: 11.6%Unemployed: 5.0%Mean travel time to work (commute): 23.1 minutes
Education Gini index (Inequality in education) Here:
14.0California average:
15.5
Religion statistics for Elk Grove, CA (based on Sacramento County data)
Religion Adherents Congregations Catholic 229,725 45 Evangelical Protestant 157,621 493 Other 86,390 183 Mainline Protestant 33,989 105 Black Protestant 12,585 38 Orthodox 5,675 12 None 892,803 -
Source: Clifford Grammich, Kirk Hadaway, Richard Houseal, Dale E.Jones, Alexei Krindatch, Richie Stanley and Richard H.Taylor. 2012. 2010 U.S.Religion Census: Religious Congregations & Membership Study. Association of Statisticians of American Religious Bodies. Jones, Dale E., et al. 2002. Congregations and Membership in the United States 2000. Nashville, TN: Glenmary Research Center. Graphs represent county-level data
Food Environment Statistics: Number of grocery stores : 255Sacramento County :
1.85 / 10,000 pop.California :
2.14 / 10,000 pop.
Number of supercenters and club stores : 10Sacramento County :
0.07 / 10,000 pop.California :
0.04 / 10,000 pop.
Number of convenience stores (no gas) : 86This county :
0.62 / 10,000 pop.California :
0.62 / 10,000 pop.
Number of convenience stores (with gas) : 233Here :
1.69 / 10,000 pop.California :
1.49 / 10,000 pop.
Number of full-service restaurants : 922This county :
6.68 / 10,000 pop.California :
7.42 / 10,000 pop.
Adult obesity rate : Sacramento County :
25.0%California :
21.3%
Low-income preschool obesity rate : This county :
15.4%California :
17.9%
Health and Nutrition: Healthy diet rate : This city:
51.8%California:
49.4%
Average overall health of teeth and gums : Here:
50.4%California:
48.0%
People feeling badly about themselves : Elk Grove:
19.8%State:
20.2%
People not drinking alcohol at all : Elk Grove:
12.2%State:
11.2%
Average hours sleeping at night : Elk Grove:
6.8California:
6.8
Overweight people : This city:
32.1%California:
31.5%
General health condition : This city:
58.3%California:
56.4%
Average condition of hearing : More about Health and Nutrition of Elk Grove, CA Residents
Local government employment and payroll (March 2022)
Function
Full-time employees
Monthly full-time payroll
Average yearly full-time wage
Part-time employees
Monthly part-time payroll
Police Protection - Officers
142 $1,791,765 $151,417 13 $19,895 Police - Other
80 $605,713 $90,857 0 $0 Financial Administration
71 $820,619 $138,696 0 $0 Streets and Highways
26 $281,442 $129,896 0 $0 Other Government Administration
18 $97,093 $64,729 1 $133 Housing and Community Development (Local)
13 $145,782 $134,568 0 $0 Other and Unallocable
8 $57,630 $86,445 0 $0 Judicial and Legal
7 $86,610 $148,474 1 $1,547 Solid Waste Management
4 $48,785 $146,355 0 $0 Parks and Recreation
1 $5,922 $71,064 5 $7,591
Totals for Government
370 $3,941,360 $127,828 20 $29,166
Elk Grove government finances - Expenditure in 2021 (per resident):
Construction - Housing and Community Development: $6,033,000 ($33.98)
Police Protection: $520,000 ($2.93)General - Other: $41,000 ($0.23)Current Operations - Regular Highways: $52,928,000 ($298.09)
Police Protection: $48,379,000 ($272.47)Central Staff Services: $32,591,000 ($183.55)Transit Utilities: $11,583,000 ($65.24)Parks and Recreation: $10,406,000 ($58.61)Protective Inspection and Regulation - Other: $7,493,000 ($42.20)General - Other: $4,656,000 ($26.22)Housing and Community Development: $4,258,000 ($23.98)Solid Waste Management: $2,045,000 ($11.52)Natural Resources - Other: $1,217,000 ($6.85)Libraries: $296,000 ($1.67)Health - Other: $21,000 ($0.12)General - Interest on Debt: $11,869,000 ($66.85)
Elk Grove government finances - Revenue in 2021 (per resident):
Charges - Other: $41,017,000 ($231.01)
Solid Waste Management: $3,897,000 ($21.95)Federal Intergovernmental - Transit Utilities: $4,627,000 ($26.06)
Other: $3,367,000 ($18.96)Housing and Community Development: $922,000 ($5.19)Local Intergovernmental - Other: $638,000 ($3.59)
Transit Utilities: $59,000 ($0.33)Miscellaneous - Special Assessments: $30,140,000 ($169.75)
General Revenue - Other: $20,544,000 ($115.70)Donations From Private Sources: $2,472,000 ($13.92)Interest Earnings: $2,046,000 ($11.52)Fines and Forfeits: $962,000 ($5.42)Rents: $794,000 ($4.47)Revenue - Transit Utilities: $241,000 ($1.36)
State Intergovernmental - Other: $7,960,000 ($44.83)
Highways: $7,594,000 ($42.77)Transit Utilities: $6,620,000 ($37.28)General Local Government Support: $122,000 ($0.69)Tax - General Sales and Gross Receipts: $41,062,000 ($231.26)
Property: $29,390,000 ($165.52)Public Utilities Sales: $8,825,000 ($49.70)Other License: $7,512,000 ($42.31)Other Selective Sales: $1,434,000 ($8.08)Documentary and Stock Transfer: $1,047,000 ($5.90)Occupation and Business License - Other: $112,000 ($0.63)
Elk Grove government finances - Debt in 2021 (per resident):
Long Term Debt - Beginning Outstanding - Unspecified Public Purpose: $296,745,000 ($1671.26)
Outstanding Unspecified Public Purpose: $296,710,000 ($1671.06)Retired Unspecified Public Purpose: $11,530,000 ($64.94)Issue, Unspecified Public Purpose: $11,495,000 ($64.74)
Elk Grove government finances - Cash and Securities in 2021 (per resident):
Bond Funds - Cash and Securities: $124,669,000 ($702.13)
Other Funds - Cash and Securities: $214,250,000 ($1206.65)
Sinking Funds - Cash and Securities: $7,113,000 ($40.06)
5.68% of this county's 2021 resident taxpayers lived in other counties in 2020 ($67,729 average adjusted gross income )
Here:
5.68%California average:
5.19%
0.01% of residents moved from foreign countries ($150 average AGI )Sacramento County:
0.01%California average:
0.03%
Top counties from which taxpayers relocated into this county between 2020 and 2021:
6.10% of this county's 2020 resident taxpayers moved to other counties in 2021 ($74,281 average adjusted gross income )
Here:
6.10%California average:
6.14%
0.01% of residents moved to foreign countries ($109 average AGI )Sacramento County:
0.01%California average:
0.02%
Top counties to which taxpayers relocated from this county between 2020 and 2021:
Businesses in Elk Grove, CA
Name Count Name Count
24 Hour Fitness 1 Lane Bryant 1 AT&T 1 Little Caesars Pizza 2 Ace Hardware 2 Lowe's 1 Applebee's 1 Marriott 1 Audi 1 MasterBrand Cabinets 3 AutoZone 1 Mazda 1 BMW 1 McDonald's 6 Baskin-Robbins 3 Men's Wearhouse 2 Bath & Body Works 1 New Balance 4 Bed Bath & Beyond 1 Nike 1 Big O Tires 2 Nissan 1 Blockbuster 3 Old Navy 1 Burger King 3 On The Border 1 Burlington Coat Factory 1 Outback 1 CVS 4 Outback Steakhouse 1 Carl\s Jr. 5 Panda Express 4 Catherines 1 Panera Bread 1 Chevrolet 1 Papa John's Pizza 1 Chick-Fil-A 1 Payless 2 Chipotle 1 Penske 1 Circle K 4 PetSmart 1 Cold Stone Creamery 2 Pier 1 Imports 1 Curves 2 Quiznos 2 Decora Cabinetry 1 RadioShack 2 Dennys 1 Red Robin 1 Discount Tire 1 Rite Aid 2 DressBarn 1 Safeway 1 Dressbarn 1 Sprint Nextel 1 Extended Stay America 1 Staples 1 Famous Footwear 1 Starbucks 11 FedEx 9 Subaru 1 Firestone Complete Auto Care 1 Subway 7 Ford 1 T-Mobile 5 GNC 4 T.G.I. Driday's 1 GameStop 3 T.J.Maxx 1 Goodwill 2 Taco Bell 3 H&R Block 3 Target 1 Hilton 2 Toyota 1 Holiday Inn 2 Toys"R"Us 1 Home Depot 1 Trader Joe's 1 HomeTown Buffet 1 U-Haul 6 Honda 1 UPS 11 IHOP 1 Vans 1 Jamba Juice 4 Verizon Wireless 2 Jones New York 1 Volkswagen 1 Justice 1 Vons 1 KFC 2 Walgreens 4 Kincaid 1 Walmart 1 Kohl's 2 Wendy's 2 La-Z-Boy 1
Strongest AM radio stations in Elk Grove:
KSTE (650 AM; 25 kW; RANCHO CORDOVA, CA; Owner: AMFM RADIO LICENSES, L.L.C.)
KHTK (1140 AM; 50 kW; SACRAMENTO, CA; Owner: INFINITY RADIO SUBSIDIARY OPERATIONS INC.)
KSMH (1620 AM; 10 kW; WEST SACRAMENTO, CA; Owner: IHR EDUCATIONAL BROADCASTING)
KFIA (710 AM; 25 kW; CARMICHAEL, CA; Owner: VISTA BROADCASTING INC.)
KFBK (1530 AM; 50 kW; SACRAMENTO, CA; Owner: AMFM RADIO LICENSES, L.L.C.)
KIID (1470 AM; 5 kW; SACRAMENTO, CA; Owner: ABC, INC.)
KCBC (770 AM; 50 kW; RIVERBANK, CA; Owner: KIERTRON, INC.)
KEBR (1210 AM; 5 kW; ROCKLIN, CA; Owner: FAMILY STATIONS, INC.)
KTKZ (1380 AM; 5 kW; SACRAMENTO, CA; Owner: VISTA BROADCASTING, INC.)
KLIB (1110 AM; 10 kW; ROSEVILLE, CA; Owner: WAY BROADCASTING, INC.)
KCBS (740 AM; 50 kW; SAN FRANCISCO, CA; Owner: INFINITY BROADCASTING OPERATIONS, INC.)
KCTC (1320 AM; 5 kW; SACRAMENTO, CA; Owner: ENTERCOM SACRAMENTO LICENSE, LLC)
KTRB (860 AM; 50 kW; MODESTO, CA; Owner: PAPPAS RADIO OF CALIFORNIA, A CALIFORNIA LIMITED PARTNERSHIP)
Strongest FM radio stations in Elk Grove:
K258AC (99.5 FM; ELK GROVE, CA; Owner: YOUR CHRISTIAN COMPANION NETWORK, INC.)
KEDR (88.1 FM; SACRAMENTO, CA; Owner: FAMILY STATIONS, INC.)
KKSF-FM1 (103.7 FM; PLEASANTON, ETC., CA; Owner: AMFM RADIO LICENSES, L.L.C.)
KBLX-FM2 (102.9 FM; PLEASANTON, CA; Owner: ICBC BROADCAST HOLDINGS -CA, INC.)
KSOL-FM3 (98.9 FM; PLEASANTON, CA; Owner: TMS LICENSE CALIFORNIA, INC)
KFRC-FM3 (99.7 FM; WALNUT CREEK, CA; Owner: INFINITY KFRC-FM, INC.)
KZBR-FM1 (95.7 FM; WALNUT CREEK, CA; Owner: BONNEVILLE HOLDING COMPANY)
KXCL (103.9 FM; YUBA CITY, CA; Owner: HARLAN COMMUNICATIONS, INC.)
KISQ-FM3 (98.1 FM; CONCORD, CA; Owner: AMFM RADIO LICENSES, L.L.C.)
KMEL-FM1 (106.1 FM; CONCORD, CA; Owner: AMFM RADIO LICENSES, L.L.C.)
KXJZ (88.9 FM; SACRAMENTO, CA; Owner: CALIFORNIA STATE UNIV., SACRAMENTO)
KJOY (99.3 FM; STOCKTON, CA; Owner: CITADEL BROADCASTING COMPANY)
KUIC (95.3 FM; VACAVILLE, CA; Owner: KUIC, INC.)
KBMB (103.5 FM; SACRAMENTO, CA; Owner: DIAMOND RADIO, INC.)
KSEG (96.9 FM; SACRAMENTO, CA; Owner: ENTERCOM SACRAMENTO LICENSE, LLC)
KYMX (96.1 FM; SACRAMENTO, CA; Owner: INFINITY RADIO OPERATIONS INC.)
K238AC (95.5 FM; SALIDA, CA; Owner: FAMILY STATIONS, INC.)
KNDL (89.9 FM; ANGWIN, CA; Owner: HOWELL MOUNTAIN BROADCASTING COMPANY)
KLVR (91.9 FM; SANTA ROSA, CA; Owner: EDUCATIONAL MEDIA FOUNDATION)
KXTS (100.9 FM; CALISTOGA, CA; Owner: SINCLAIR TELECABLE, INC.)
TV broadcast stations around Elk Grove:
KTXL (Channel 40; SACRAMENTO, CA; Owner: CHANNEL 40, INC.)
KSPX (Channel 29; SACRAMENTO, CA; Owner: PAXSON SACRAMENTO LICENSE, INC.)
KQCA (Channel 58; STOCKTON, CA; Owner: KCRA HEARST-ARGYLE TELEVISION, INC.)
KVIE (Channel 6; SACRAMENTO, CA; Owner: KVIE, INC.)
KMAX-TV (Channel 31; SACRAMENTO, CA; Owner: UPN STATIONS GROUP INC.)
KCRA-TV (Channel 3; SACRAMENTO, CA; Owner: KCRA HEARST-ARGYLE TELEVISION, INC.)
KOVR (Channel 13; STOCKTON, CA; Owner: SCI - SACRAMENTO LICENSEE, LLC)
KXTV (Channel 10; SACRAMENTO, CA; Owner: KXTV, INC.)
KUVS (Channel 19; MODESTO, CA; Owner: KUVS LICENSE PARTNERSHIP, G.P.)
KMMK-LP (Channel 14; SACRAMENTO, CA; Owner: CABALLERO TELEVISION TEXAS, L.L.C.)
KEZT-CA (Channel 23; SACRAMENTO, CA; Owner: TELEFUTURA SACRAMENTO LLC)
KRJR-LP (Channel 47; SACRAMENTO, CA; Owner: WORD OF GOD FELLOWSHIP, INC.)
KCSO-LP (Channel 33; SACRAMENTO, CA; Owner: SAINTE 51, L.P.)
K69FB (Channel 69; SACRAMENTO, CA; Owner: TRINITY BROADCASTING NETWORK)
K17EH (Channel 17; EUREKA, CA; Owner: MS COMMUNICATIONS, LLC)
K22FR (Channel 22; SACRAMENTO, CA; Owner: NATIONAL MINORITY T.V., INC.)
K61DW (Channel 61; SACRAMENTO, CA; Owner: DR. W. R. PORTEE)
KSAO-LP (Channel 49; SACRAMENTO, CA; Owner: GARY M. COCOLA FAMILY TRUST, GARY M. COCOLA TRUSTEE)
KBTV-LP (Channel 8; SACRAMENTO, CA; Owner: INCISOR COMMUNICATIONS, L.L.C.)
KSTV-LP (Channel 60; SACRAMENTO, CA; Owner: GARY M. COCOLA FAMILY TRUST, GARY M. COCOLA TRUSTEE)
KMUM-CA (Channel 15; SACRAMENTO, CA; Owner: CABALLERO TELEVISION TEXAS, L.L.C.)
K27EU (Channel 27; SACRAMENTO, CA; Owner: ABUNDANT LIFE BROADCASTING, INC.)
National Bridge Inventory (NBI) Statistics 96 Number of bridges1,168ft / 356m Total length1,976,649 Total average daily traffic232,696 Total average daily truck traffic
New bridges - historical statistics
1 1920-1929 3 1930-1939 1 1940-1949 12 1950-1959 3 1960-1969 12 1970-1979 14 1980-1989 22 1990-1999 20 2000-2009 8 2010-2019
See full National Bridge Inventory statistics for Elk Grove, CA
Home Mortgage Disclosure Act Aggregated Statistics For Year 2009(Based on 13 full tracts) A) FHA, FSA/RHS & VA B) Conventional C) Refinancings D) Home Improvement Loans F) Non-occupant Loans on G) Loans On Manufactured Number Average Value Number Average Value Number Average Value Number Average Value Number Average Value Number Average Value
LOANS ORIGINATED 566 $192,602 541 $149,608 847 $191,538 44 $94,432 225 $126,867 2 $174,000 APPLICATIONS APPROVED, NOT ACCEPTED 43 $186,465 82 $154,732 93 $202,011 11 $59,182 33 $127,758 5 $40,200 APPLICATIONS DENIED 114 $193,368 152 $163,553 426 $208,110 41 $106,585 99 $147,202 3 $49,000 APPLICATIONS WITHDRAWN 77 $199,494 100 $160,600 288 $213,094 14 $90,286 48 $146,750 2 $98,000 FILES CLOSED FOR INCOMPLETENESS 13 $165,538 18 $150,944 48 $226,708 2 $40,500 12 $138,750 0 $0
Aggregated Statistics For Year 2008(Based on 13 full tracts) A) FHA, FSA/RHS & VA B) Conventional C) Refinancings D) Home Improvement Loans E) Loans on Dwellings For 5+ Families F) Non-occupant Loans on G) Loans On Manufactured Number Average Value Number Average Value Number Average Value Number Average Value Number Average Value Number Average Value Number Average Value
LOANS ORIGINATED 442 $227,867 817 $178,411 510 $199,594 113 $62,319 2 $2,661,000 289 $150,163 6 $44,167 APPLICATIONS APPROVED, NOT ACCEPTED 58 $218,897 165 $194,848 145 $194,200 29 $64,966 0 $0 56 $177,696 8 $59,750 APPLICATIONS DENIED 89 $223,831 288 $201,788 614 $252,695 128 $86,570 0 $0 113 $183,823 7 $50,429 APPLICATIONS WITHDRAWN 66 $222,621 157 $185,745 227 $240,824 19 $50,895 0 $0 54 $171,630 0 $0 FILES CLOSED FOR INCOMPLETENESS 14 $225,286 55 $198,000 63 $246,714 8 $121,500 0 $0 20 $207,950 0 $0
Aggregated Statistics For Year 2007(Based on 13 full tracts) A) FHA, FSA/RHS & VA B) Conventional C) Refinancings D) Home Improvement Loans E) Loans on Dwellings For 5+ Families F) Non-occupant Loans on G) Loans On Manufactured Number Average Value Number Average Value Number Average Value Number Average Value Number Average Value Number Average Value Number Average Value
LOANS ORIGINATED 19 $304,789 852 $244,843 1,691 $244,130 311 $113,482 1 $6,067,000 267 $240,007 10 $93,600 APPLICATIONS APPROVED, NOT ACCEPTED 0 $0 210 $227,633 521 $272,077 75 $125,187 0 $0 80 $267,612 3 $29,333 APPLICATIONS DENIED 3 $240,000 345 $238,545 1,645 $293,053 257 $137,642 1 $286,000 169 $272,929 14 $57,643 APPLICATIONS WITHDRAWN 0 $0 147 $235,966 614 $281,617 44 $188,500 0 $0 54 $269,815 0 $0 FILES CLOSED FOR INCOMPLETENESS 1 $358,000 57 $255,930 241 $290,108 8 $218,250 0 $0 19 $268,000 0 $0
Aggregated Statistics For Year 2006(Based on 13 full tracts) A) FHA, FSA/RHS & VA B) Conventional C) Refinancings D) Home Improvement Loans E) Loans on Dwellings For 5+ Families F) Non-occupant Loans on G) Loans On Manufactured Number Average Value Number Average Value Number Average Value Number Average Value Number Average Value Number Average Value Number Average Value
LOANS ORIGINATED 3 $321,333 1,695 $238,131 2,956 $258,127 619 $123,010 3 $2,332,000 418 $256,347 12 $93,250 APPLICATIONS APPROVED, NOT ACCEPTED 0 $0 391 $242,161 694 $276,935 116 $136,922 0 $0 104 $278,798 3 $70,667 APPLICATIONS DENIED 0 $0 748 $237,829 1,748 $285,178 401 $128,920 1 $63,000 219 $264,804 20 $138,650 APPLICATIONS WITHDRAWN 1 $315,000 305 $268,072 1,165 $286,265 88 $176,648 0 $0 93 $263,935 4 $75,250 FILES CLOSED FOR INCOMPLETENESS 0 $0 117 $241,863 276 $311,033 16 $277,625 0 $0 37 $276,135 1 $417,000
Aggregated Statistics For Year 2005(Based on 13 full tracts) A) FHA, FSA/RHS & VA B) Conventional C) Refinancings D) Home Improvement Loans E) Loans on Dwellings For 5+ Families F) Non-occupant Loans on G) Loans On Manufactured Number Average Value Number Average Value Number Average Value Number Average Value Number Average Value Number Average Value Number Average Value
LOANS ORIGINATED 11 $271,818 3,228 $249,972 4,409 $256,858 713 $145,857 2 $3,050,000 641 $242,977 17 $106,294 APPLICATIONS APPROVED, NOT ACCEPTED 0 $0 647 $237,459 726 $266,285 94 $97,043 0 $0 94 $247,745 14 $65,429 APPLICATIONS DENIED 4 $286,500 876 $246,397 1,768 $271,314 388 $135,258 0 $0 206 $260,078 27 $135,667 APPLICATIONS WITHDRAWN 1 $312,000 494 $247,644 1,373 $259,551 157 $170,879 0 $0 127 $228,354 9 $143,333 FILES CLOSED FOR INCOMPLETENESS 1 $318,000 140 $244,229 398 $270,550 28 $197,464 0 $0 30 $250,133 0 $0
Aggregated Statistics For Year 2004(Based on 13 full tracts) A) FHA, FSA/RHS & VA B) Conventional C) Refinancings D) Home Improvement Loans E) Loans on Dwellings For 5+ Families F) Non-occupant Loans on G) Loans On Manufactured Number Average Value Number Average Value Number Average Value Number Average Value Number Average Value Number Average Value Number Average Value
LOANS ORIGINATED 31 $261,710 3,231 $223,434 4,733 $216,968 632 $110,288 3 $2,691,333 718 $203,383 9 $66,222 APPLICATIONS APPROVED, NOT ACCEPTED 5 $222,000 624 $229,502 793 $224,037 113 $111,646 0 $0 91 $222,264 7 $47,571 APPLICATIONS DENIED 8 $223,500 816 $217,746 1,709 $226,516 354 $85,805 0 $0 201 $214,453 26 $101,077 APPLICATIONS WITHDRAWN 9 $241,333 497 $233,807 1,159 $216,286 129 $128,101 1 $3,500,000 105 $201,057 4 $164,000 FILES CLOSED FOR INCOMPLETENESS 2 $216,000 121 $239,702 464 $230,543 35 $83,914 0 $0 44 $208,091 0 $0
Aggregated Statistics For Year 2003(Based on 13 full tracts) A) FHA, FSA/RHS & VA B) Conventional C) Refinancings D) Home Improvement Loans E) Loans on Dwellings For 5+ Families F) Non-occupant Loans on Number Average Value Number Average Value Number Average Value Number Average Value Number Average Value Number Average Value
LOANS ORIGINATED 174 $202,977 2,559 $199,045 7,237 $172,114 435 $45,818 3 $323,000 627 $157,365 APPLICATIONS APPROVED, NOT ACCEPTED 12 $202,667 394 $200,457 1,013 $172,774 136 $42,838 0 $0 100 $168,890 APPLICATIONS DENIED 27 $216,556 521 $188,772 1,803 $179,668 239 $44,360 0 $0 136 $165,265 APPLICATIONS WITHDRAWN 42 $182,929 501 $200,341 1,432 $177,659 43 $50,419 0 $0 90 $176,644 FILES CLOSED FOR INCOMPLETENESS 6 $218,833 82 $206,098 308 $174,938 22 $64,727 0 $0 23 $133,783
Aggregated Statistics For Year 2002(Based on 4 full tracts) A) FHA, FSA/RHS & VA B) Conventional C) Refinancings D) Home Improvement Loans E) Loans on Dwellings For 5+ Families F) Non-occupant Loans on Number Average Value Number Average Value Number Average Value Number Average Value Number Average Value Number Average Value
LOANS ORIGINATED 103 $185,505 799 $185,283 1,680 $158,162 131 $45,710 1 $360,000 159 $134,887 APPLICATIONS APPROVED, NOT ACCEPTED 6 $161,833 98 $169,122 199 $148,327 19 $26,895 0 $0 22 $153,818 APPLICATIONS DENIED 6 $153,333 81 $173,173 292 $137,613 70 $41,957 0 $0 16 $156,062 APPLICATIONS WITHDRAWN 7 $202,571 74 $181,878 260 $156,335 17 $47,824 0 $0 21 $157,190 FILES CLOSED FOR INCOMPLETENESS 1 $181,000 28 $170,321 107 $163,196 0 $0 0 $0 6 $138,667
Aggregated Statistics For Year 2001(Based on 4 full tracts) A) FHA, FSA/RHS & VA B) Conventional C) Refinancings D) Home Improvement Loans E) Loans on Dwellings For 5+ Families F) Non-occupant Loans on Number Average Value Number Average Value Number Average Value Number Average Value Number Average Value Number Average Value
LOANS ORIGINATED 93 $162,871 710 $162,977 1,334 $145,567 66 $39,818 3 $1,107,667 99 $124,818 APPLICATIONS APPROVED, NOT ACCEPTED 3 $196,667 88 $161,239 128 $132,297 16 $28,625 0 $0 12 $133,917 APPLICATIONS DENIED 13 $157,077 93 $154,860 325 $125,517 52 $30,731 0 $0 16 $98,500 APPLICATIONS WITHDRAWN 6 $205,500 81 $163,580 255 $138,733 18 $26,222 0 $0 17 $98,706 FILES CLOSED FOR INCOMPLETENESS 2 $101,500 35 $171,000 69 $138,652 0 $0 3 $1,795,000 2 $198,000
Aggregated Statistics For Year 2000(Based on 4 full tracts) A) FHA, FSA/RHS & VA B) Conventional C) Refinancings D) Home Improvement Loans E) Loans on Dwellings For 5+ Families F) Non-occupant Loans on Number Average Value Number Average Value Number Average Value Number Average Value Number Average Value Number Average Value
LOANS ORIGINATED 168 $137,821 546 $138,921 243 $90,156 67 $28,716 2 $3,158,500 45 $106,711 APPLICATIONS APPROVED, NOT ACCEPTED 12 $120,333 62 $149,516 58 $99,069 43 $36,233 0 $0 5 $85,600 APPLICATIONS DENIED 16 $125,188 87 $135,471 174 $90,810 52 $23,288 1 $110,000 11 $93,091 APPLICATIONS WITHDRAWN 12 $123,833 57 $136,912 76 $81,868 11 $42,182 0 $0 3 $144,333 FILES CLOSED FOR INCOMPLETENESS 2 $110,500 18 $139,111 33 $119,424 2 $25,000 2 $2,865,500 2 $87,000
Aggregated Statistics For Year 1999(Based on 5 full and 2 partial tracts) A) FHA, FSA/RHS & VA B) Conventional C) Refinancings D) Home Improvement Loans E) Loans on Dwellings For 5+ Families F) Non-occupant Loans on Number Average Value Number Average Value Number Average Value Number Average Value Number Average Value Number Average Value
LOANS ORIGINATED 674 $132,185 921 $126,908 1,043 $110,918 201 $28,759 17 $170,436 116 $89,773 APPLICATIONS APPROVED, NOT ACCEPTED 13 $142,855 99 $119,733 241 $103,710 113 $25,537 4 $81,405 40 $98,449 APPLICATIONS DENIED 70 $133,601 120 $119,133 497 $82,912 169 $24,554 2 $91,725 24 $90,327 APPLICATIONS WITHDRAWN 73 $133,836 137 $127,091 338 $382,139 20 $40,570 3 $109,413 17 $92,074 FILES CLOSED FOR INCOMPLETENESS 3 $143,693 22 $120,949 139 $109,963 5 $25,398 0 $0 9 $78,434
Detailed mortgage data for all 13 tracts in Elk Grove, CA
Private Mortgage Insurance Companies Aggregated Statistics For Year 2009(Based on 13 full tracts) A) Conventional B) Refinancings C) Non-occupant Loans on Number Average Value Number Average Value Number Average Value
LOANS ORIGINATED 56 $189,143 14 $222,929 1 $162,000 APPLICATIONS APPROVED, NOT ACCEPTED 31 $196,290 18 $206,000 1 $112,000 APPLICATIONS DENIED 11 $193,818 6 $204,833 1 $240,000 APPLICATIONS WITHDRAWN 9 $175,556 1 $236,000 0 $0 FILES CLOSED FOR INCOMPLETENESS 3 $268,333 1 $323,000 0 $0
Aggregated Statistics For Year 2008(Based on 13 full tracts) A) Conventional B) Refinancings C) Non-occupant Loans on Number Average Value Number Average Value Number Average Value
LOANS ORIGINATED 261 $233,069 46 $279,543 13 $204,692 APPLICATIONS APPROVED, NOT ACCEPTED 102 $280,010 65 $314,015 3 $240,333 APPLICATIONS DENIED 55 $209,364 13 $239,692 14 $210,929 APPLICATIONS WITHDRAWN 31 $263,161 7 $261,000 3 $277,333 FILES CLOSED FOR INCOMPLETENESS 10 $298,200 2 $292,000 6 $298,667
Aggregated Statistics For Year 2007(Based on 13 full tracts) A) Conventional B) Refinancings C) Non-occupant Loans on Number Average Value Number Average Value Number Average Value
LOANS ORIGINATED 176 $302,653 136 $324,794 15 $303,867 APPLICATIONS APPROVED, NOT ACCEPTED 20 $330,400 47 $368,872 5 $380,400 APPLICATIONS DENIED 9 $430,556 4 $371,250 0 $0 APPLICATIONS WITHDRAWN 9 $301,556 13 $357,615 0 $0 FILES CLOSED FOR INCOMPLETENESS 0 $0 0 $0 0 $0
Aggregated Statistics For Year 2006(Based on 13 full tracts) A) Conventional B) Refinancings C) Non-occupant Loans on Number Average Value Number Average Value Number Average Value
LOANS ORIGINATED 32 $352,938 57 $364,246 4 $314,500 APPLICATIONS APPROVED, NOT ACCEPTED 8 $396,875 19 $344,789 0 $0 APPLICATIONS DENIED 0 $0 3 $442,667 1 $450,000 APPLICATIONS WITHDRAWN 7 $407,286 8 $341,250 1 $278,000 FILES CLOSED FOR INCOMPLETENESS 1 $464,000 0 $0 0 $0
Aggregated Statistics For Year 2005(Based on 13 full tracts) A) Conventional B) Refinancings C) Non-occupant Loans on D) Loans On Manufactured Number Average Value Number Average Value Number Average Value Number Average Value
LOANS ORIGINATED 76 $347,789 80 $324,800 5 $281,600 1 $266,000 APPLICATIONS APPROVED, NOT ACCEPTED 11 $326,636 19 $295,842 2 $263,500 0 $0 APPLICATIONS DENIED 1 $142,000 3 $402,333 0 $0 0 $0 APPLICATIONS WITHDRAWN 6 $342,000 5 $333,800 1 $439,000 0 $0 FILES CLOSED FOR INCOMPLETENESS 0 $0 0 $0 0 $0 0 $0
Aggregated Statistics For Year 2004(Based on 13 full tracts) A) Conventional B) Refinancings C) Non-occupant Loans on Number Average Value Number Average Value Number Average Value
LOANS ORIGINATED 134 $289,843 87 $254,885 14 $252,714 APPLICATIONS APPROVED, NOT ACCEPTED 59 $281,186 64 $228,438 0 $0 APPLICATIONS DENIED 4 $287,500 1 $500,000 0 $0 APPLICATIONS WITHDRAWN 11 $272,182 4 $245,000 0 $0 FILES CLOSED FOR INCOMPLETENESS 2 $252,500 1 $275,000 0 $0
Aggregated Statistics For Year 2003(Based on 13 full tracts) A) Conventional B) Refinancings C) Non-occupant Loans on Number Average Value Number Average Value Number Average Value
LOANS ORIGINATED 337 $243,534 294 $215,772 30 $202,167 APPLICATIONS APPROVED, NOT ACCEPTED 96 $243,927 115 $205,948 12 $202,333 APPLICATIONS DENIED 9 $250,778 2 $210,500 4 $212,500 APPLICATIONS WITHDRAWN 18 $248,944 15 $202,800 5 $224,800 FILES CLOSED FOR INCOMPLETENESS 4 $234,500 0 $0 0 $0
Aggregated Statistics For Year 2002(Based on 4 full tracts) A) Conventional B) Refinancings C) Non-occupant Loans on Number Average Value Number Average Value Number Average Value
LOANS ORIGINATED 133 $219,286 101 $198,297 11 $144,091 APPLICATIONS APPROVED, NOT ACCEPTED 26 $220,423 24 $179,000 3 $107,333 APPLICATIONS DENIED 3 $189,333 3 $178,000 2 $173,500 APPLICATIONS WITHDRAWN 2 $180,500 5 $224,000 0 $0 FILES CLOSED FOR INCOMPLETENESS 0 $0 0 $0 0 $0
Aggregated Statistics For Year 2001(Based on 4 full tracts) A) Conventional B) Refinancings C) Non-occupant Loans on Number Average Value Number Average Value Number Average Value
LOANS ORIGINATED 207 $217,121 108 $188,852 8 $147,500 APPLICATIONS APPROVED, NOT ACCEPTED 40 $219,725 23 $179,043 1 $58,000 APPLICATIONS DENIED 4 $214,250 2 $145,000 1 $63,000 APPLICATIONS WITHDRAWN 8 $194,875 1 $92,000 0 $0 FILES CLOSED FOR INCOMPLETENESS 0 $0 0 $0 0 $0
Aggregated Statistics For Year 2000(Based on 4 full tracts) A) Conventional B) Refinancings C) Non-occupant Loans on Number Average Value Number Average Value Number Average Value
LOANS ORIGINATED 127 $181,055 19 $146,211 6 $99,000 APPLICATIONS APPROVED, NOT ACCEPTED 14 $211,857 4 $146,750 2 $98,000 APPLICATIONS DENIED 5 $208,600 3 $145,333 1 $132,000 APPLICATIONS WITHDRAWN 2 $154,000 2 $149,500 0 $0 FILES CLOSED FOR INCOMPLETENESS 0 $0 0 $0 0 $0
Aggregated Statistics For Year 1999(Based on 5 full and 2 partial tracts) A) Conventional B) Refinancings C) Non-occupant Loans on Number Average Value Number Average Value Number Average Value
LOANS ORIGINATED 331 $163,452 230 $140,357 11 $110,497 APPLICATIONS APPROVED, NOT ACCEPTED 18 $143,335 44 $140,365 2 $82,720 APPLICATIONS DENIED 15 $169,806 2 $109,885 0 $0 APPLICATIONS WITHDRAWN 8 $163,692 9 $112,447 1 $95,000 FILES CLOSED FOR INCOMPLETENESS 8 $172,445 6 $138,735 0 $0
Fire-safe hotels and motels in Elk Grove, California:
Extended Stay America - Sacramento - Elk Grove, 2201 Long Port Ct, Elk Grove, California 95758 Phone: (916) 683-3753, Fax: (916) 683-3786
Holiday Inn Express & Suites Elk Grove-Sacramento, 2460 Maritime Dr, Elk Grove, California 95758 Phone: (916) 478-4000, Fax: (916) 478-3718
Fairfield Inn & Suites, 8058 Orch Loop Ln, Elk Grove, California 95624 Phone: (916) 681-5400, Fax: (916) 681-1331
Hampton Inn & Suites - Elk Grove, 2305 Longport Ct, Elk Grove, California 95758 Phone: (916) 683-9545, Fax: (916) 683-9546
Hilton Garden Inn, 9241 Laguna Springs Dr, Elk Grove, California 95758 Phone: (916) 691-1900, Fax: (916) 691-1945
All 5 fire-safe hotels and motels in Elk Grove, California
Most common first names in Elk Grove, CA among deceased individuals Name Count Lived (average)
John 131 74.6 years William 123 76.4 years Robert 122 69.5 years Mary 118 79.7 years George 91 75.2 years James 77 72.8 years Charles 72 75.7 years Helen 62 81.0 years Richard 58 67.2 years Dorothy 58 81.9 years
Most common last names in Elk Grove, CA among deceased individuals Last name Count Lived (average)
Smith 76 74.4 years Johnson 44 72.6 years Williams 33 74.4 years Brown 32 76.0 years Miller 31 71.8 years Jones 30 74.8 years Anderson 23 81.2 years Martin 23 78.1 years Wilson 20 80.6 years Davis 19 74.2 years
Elk Grove compared to California state average:
Unemployed percentage significantly below state average. Black race population percentage significantly above state average. Foreign-born population percentage significantly above state average. Renting percentage below state average. Length of stay since moving in below state average. Number of rooms per house above state average. House age significantly below state average. Number of college students above state average. Elk Grove, CA compared to other similar cities:
#3 on the list of "Top 101 cities with the highest maximum monthly sunshine amount (population 50,000+)"
#6 on the list of "Top 101 cities with largest percentage of females in occupations: installation, maintenance, and repair occupations (population 50,000+)"
#8 on the list of "Top 101 cities with largest percentage population increases in the 1990s) (population 50,000+)"
#8 on the list of "Top 101 cities with the largest percentage population increase from 2000 (population 50,000+)"
#9 on the list of "Top 101 cities with largest percentage of females in industries: public administration (population 50,000+)"
#12 on the list of "Top 101 cities with largest percentage of males in occupations: law enforcement workers including supervisors (population 50,000+)"
#12 on the list of "Top 101 cities with the lowest number of police officers per 1000 residents (population 50,000+)"
#15 on the list of "Top 101 cities with largest percentage of males in industries: public administration (population 50,000+)"
#15 on the list of "Top 100 fastest growing cities from 2000 to 2014 (pop. 50,000+)"
#20 on the list of "Top 101 cities with the smallest household incomes disparities (population 50,000+)"
#20 on the list of "Top 101 cities with the highest percentage of family households, population 100,000+"
#22 on the list of "Top 100 high-educated but low-earning cities"
#22 on the list of "Top 101 cities with the largest sunshine amount differences during a year (population 50,000+)"
#23 on the list of "Top 101 cities with the most local government spending on highway construction per resident (population 10,000+)"
#35 on the list of "Top 100 cities with newest houses (pop. 50,000+)"
#38 on the list of "Top 101 cities with largest percentage of females in occupations: law enforcement workers including supervisors (population 50,000+)"
#39 on the list of "Top 100 most racially diverse cities"
#50 on the list of "Top 101 cities with the most residents born in Afghanistan (population 500+)"
#52 on the list of "Top 100 cities with highest median household income and median resident age less than 35 (pop. 50,000+)"
#52 on the list of "Top 101 cities that people commute from (largest negative percentage daily daytime population change due to commuting) (population 50,000+)"
#12 on the list of "Top 101 counties with the highest percentage of residents that drank alcohol in the past 30 days"
#18 on the list of "Top 101 counties with the highest ground withdrawal of fresh water for public supply"
#19 on the list of "Top 101 counties with the highest total withdrawal of fresh water for public supply"
#23 on the list of "Top 101 counties with the most Other adherents"
#25 on the list of "Top 101 counties with the most Other congregations (pop. 50,000+)"
Top Patent Applicants
Kimberly Brown (38)
Sergiy Vasylyev (21)
Amitav Mukherjee (15)
Duane De Jong (13)
Suzanne Otani (12)
Stephen M. Howell (11)
Makoto N. Masuno (11)
Jeremy Graul (11)
Sergiy Victorovich Vasylyev (10)
Tim Hagen (7)
Total of 426 patent applications in 2008-2024.


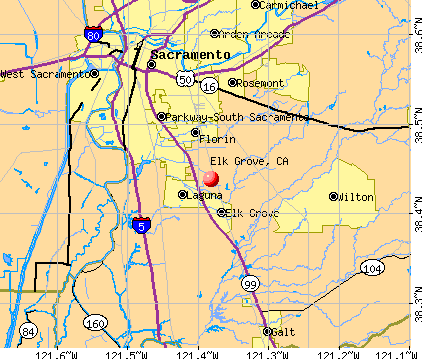


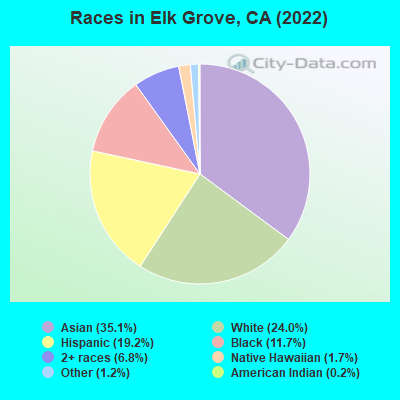
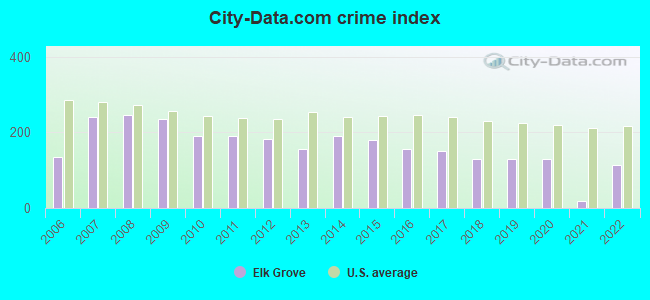
 Recent articles from our blog. Our writers, many of them Ph.D. graduates or candidates, create easy-to-read articles on a wide variety of topics.


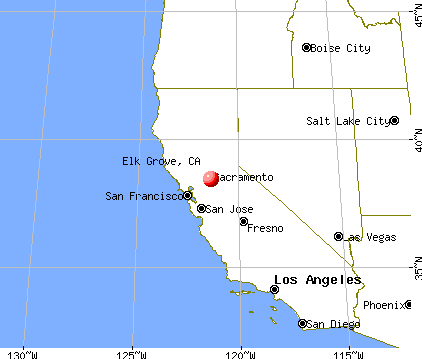
 (9.4 miles
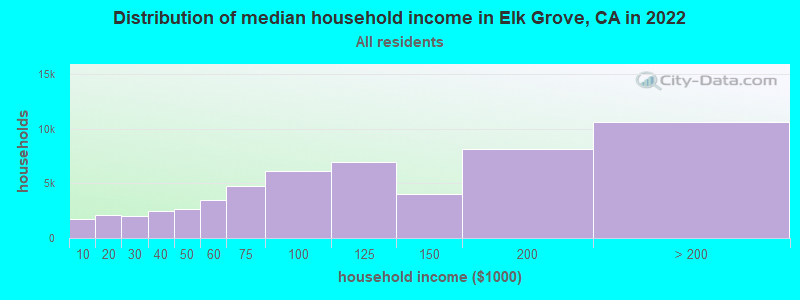
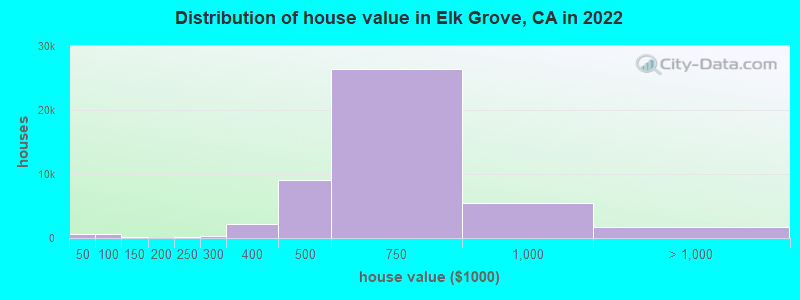
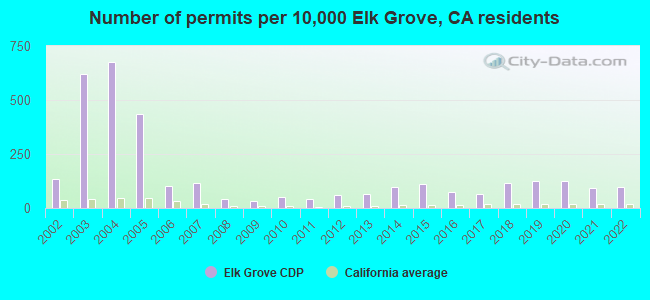
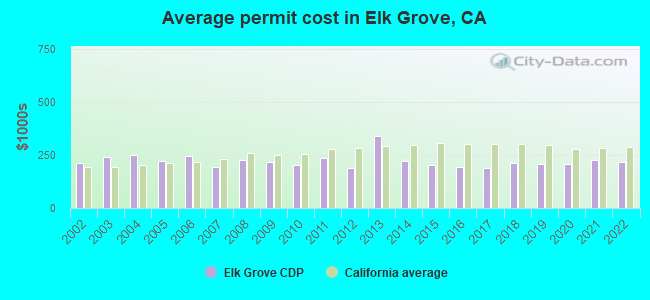
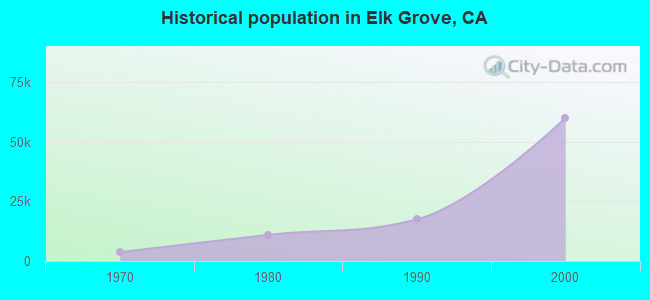
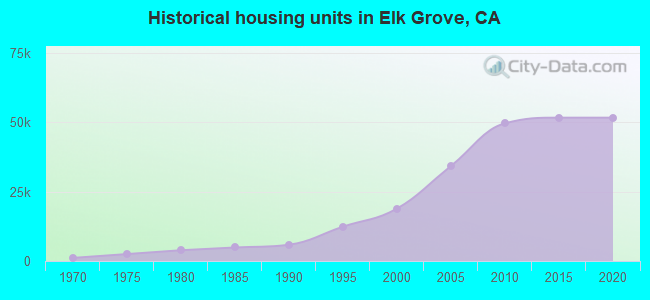
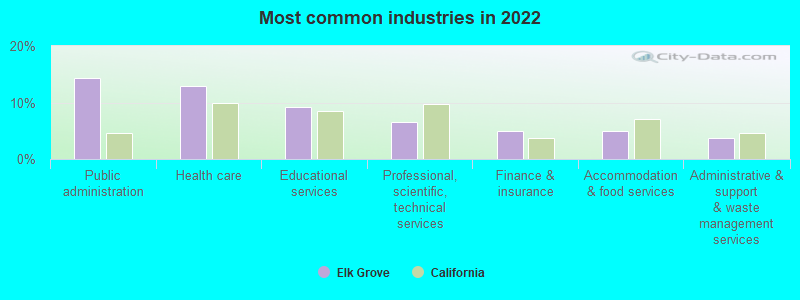
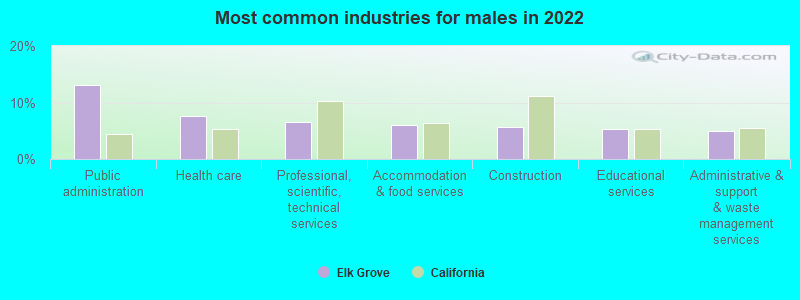
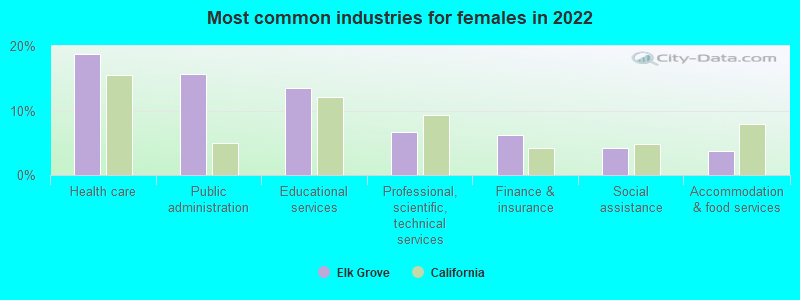
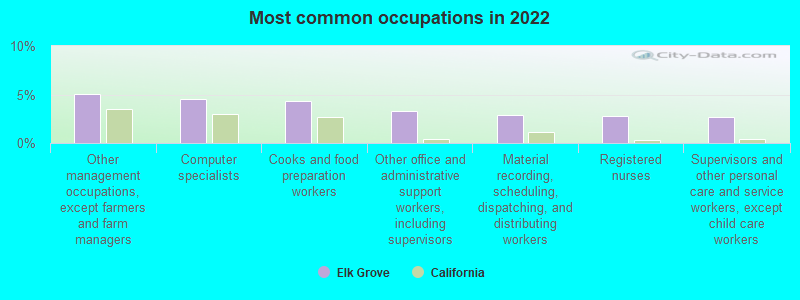
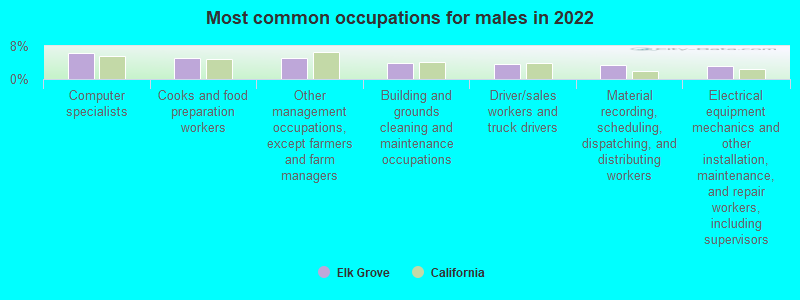
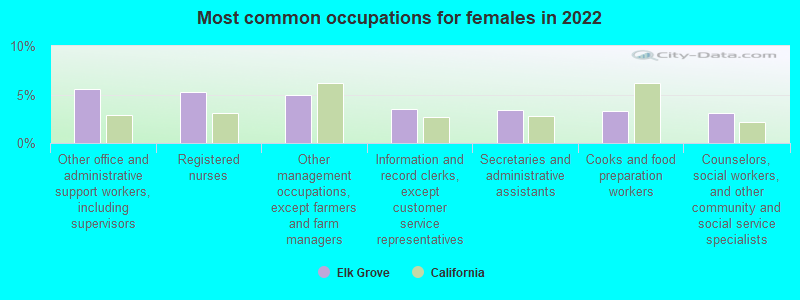
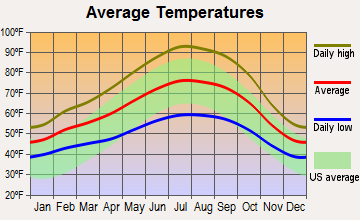
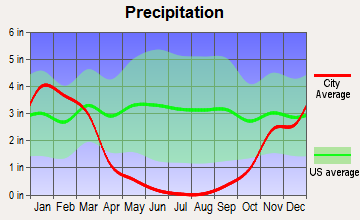
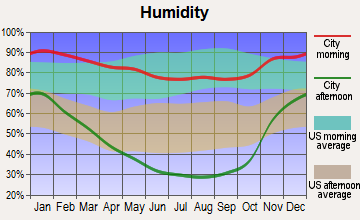
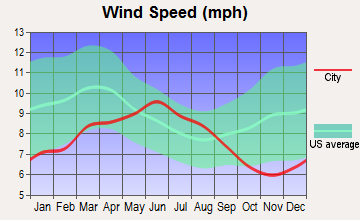
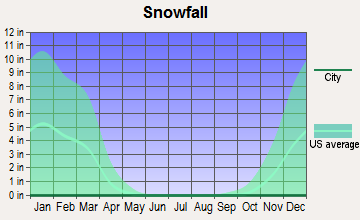

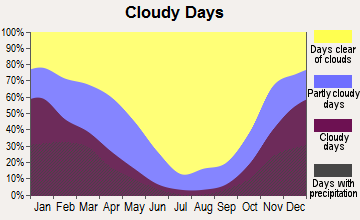
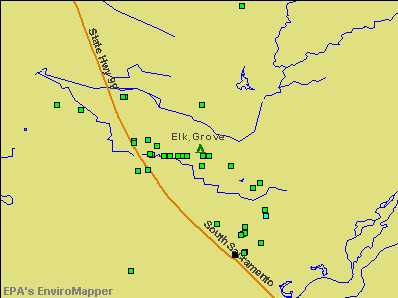

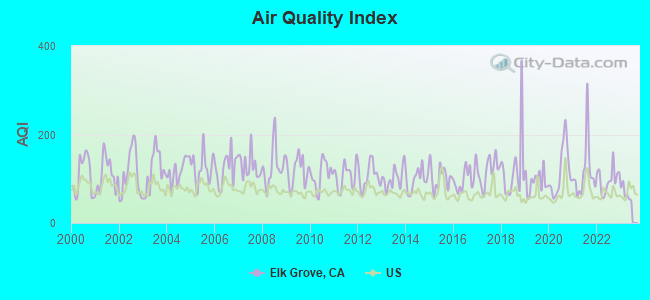
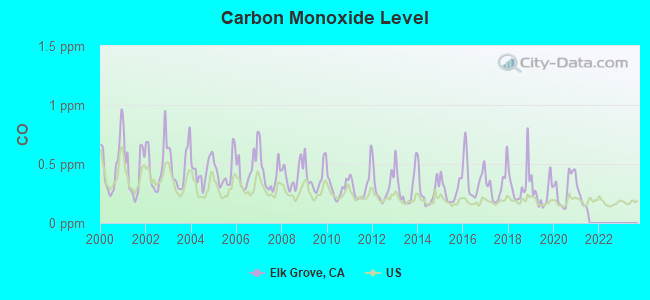
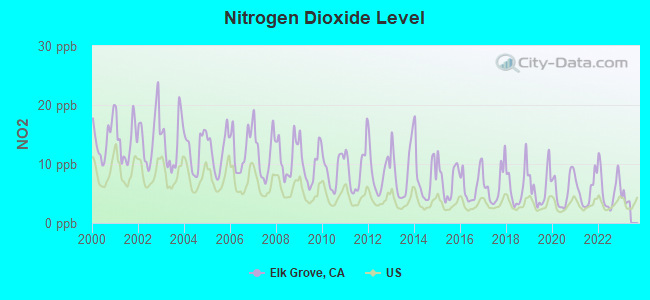
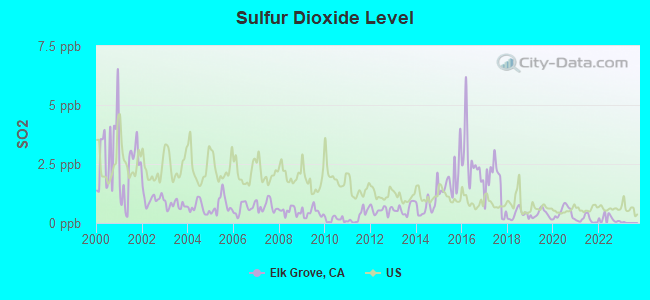
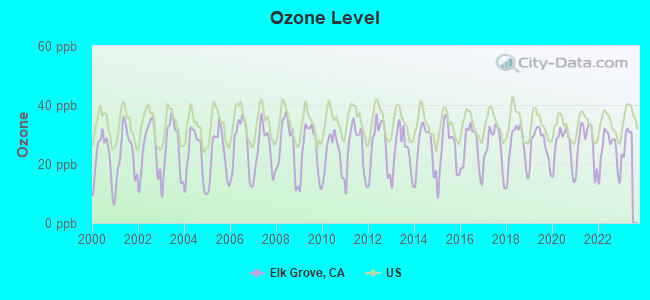
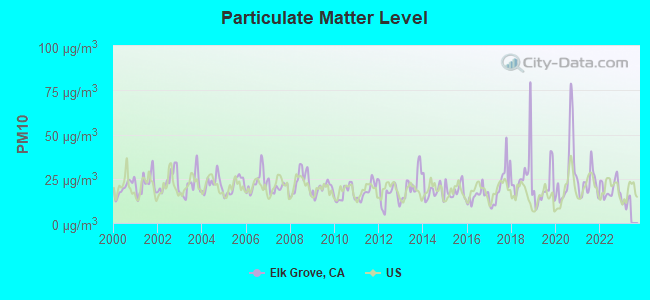
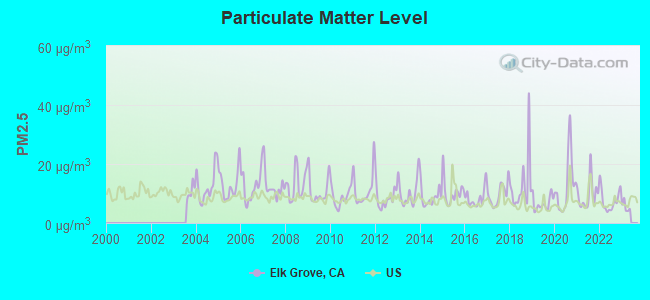
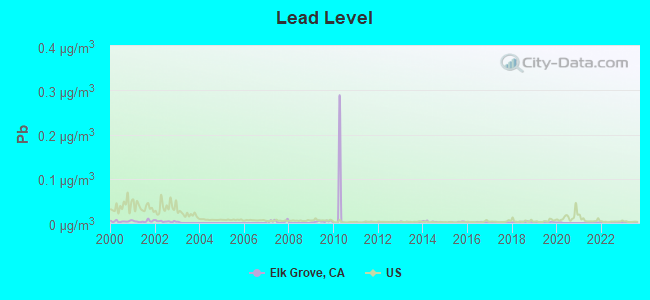
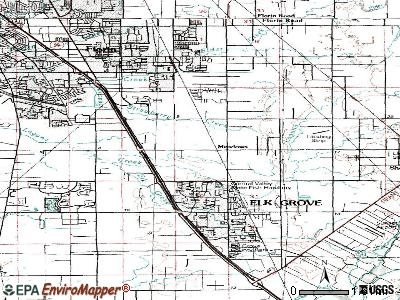
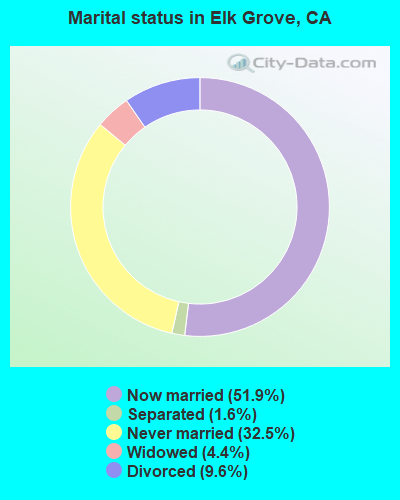
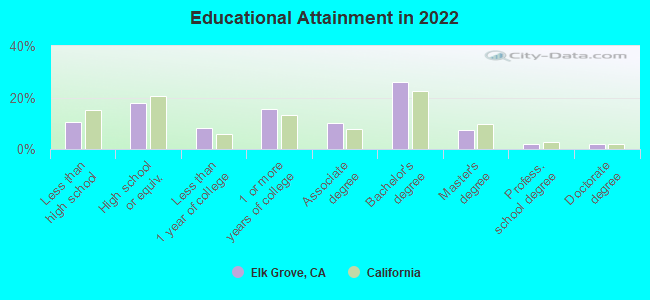
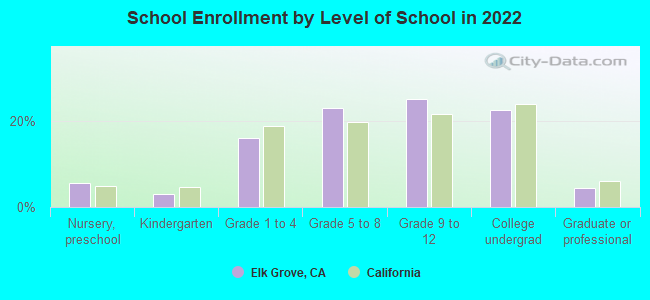
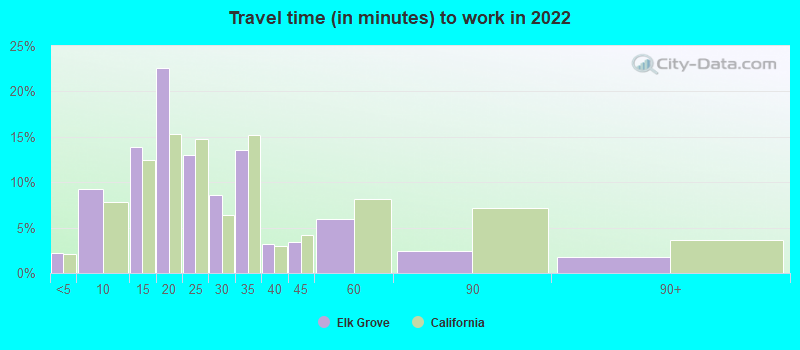
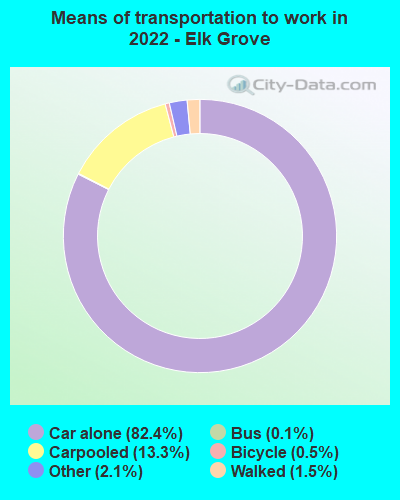
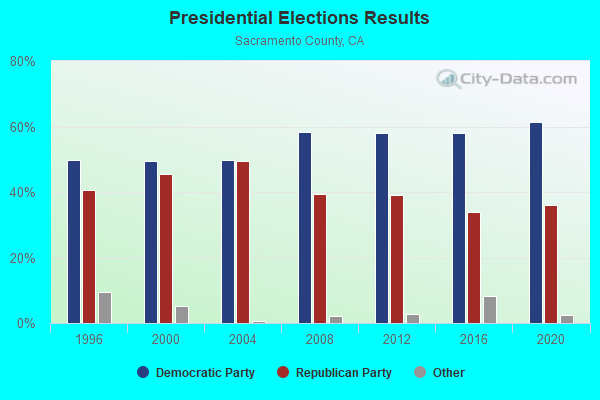
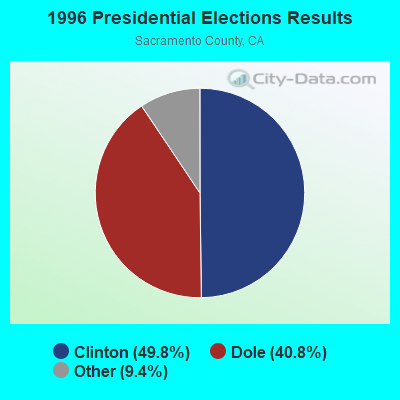
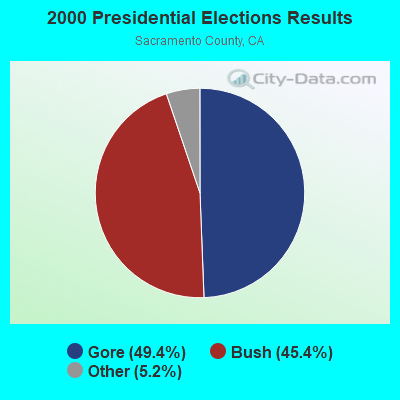
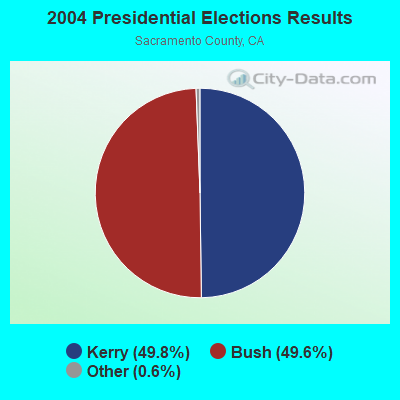
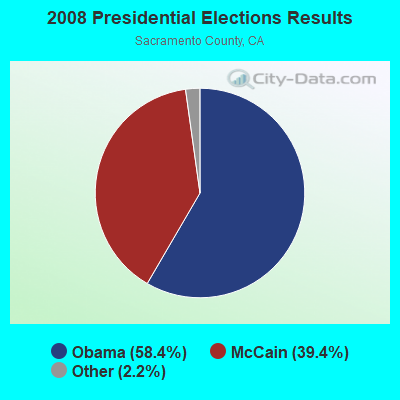
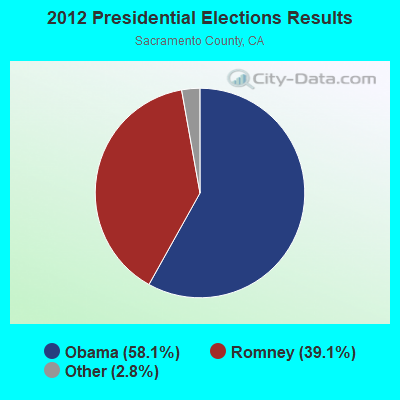
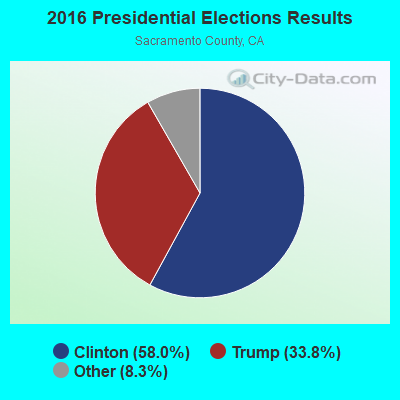
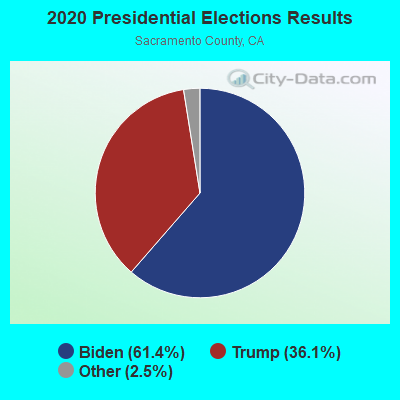
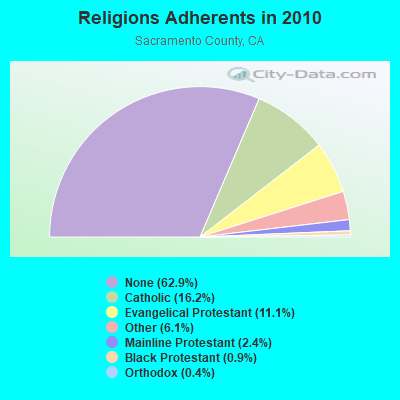
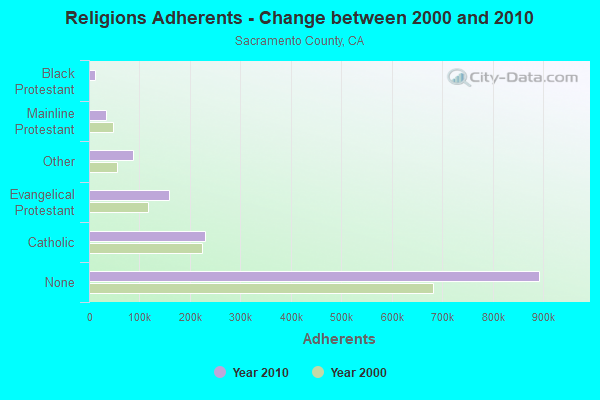
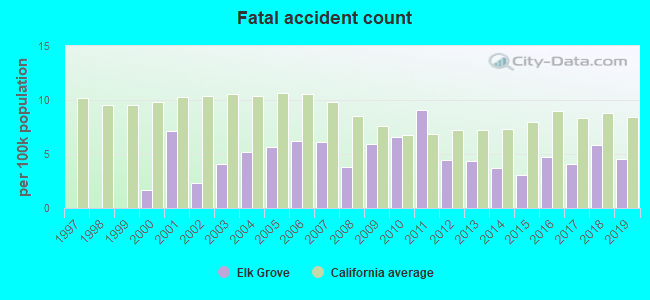
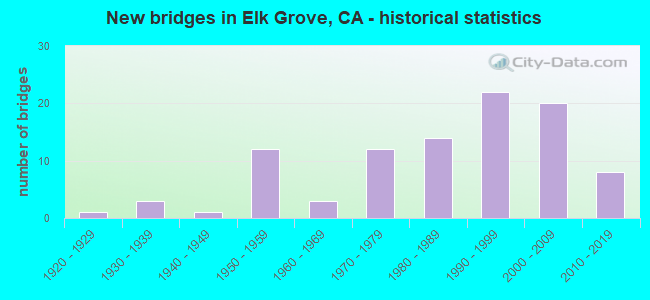
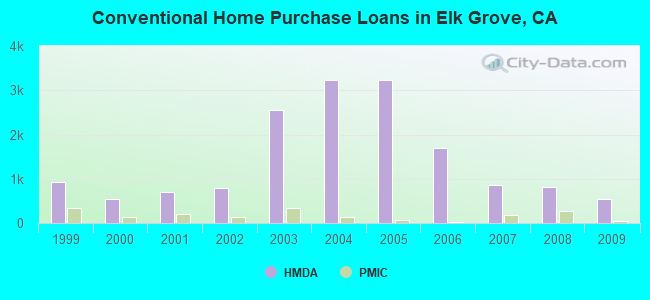
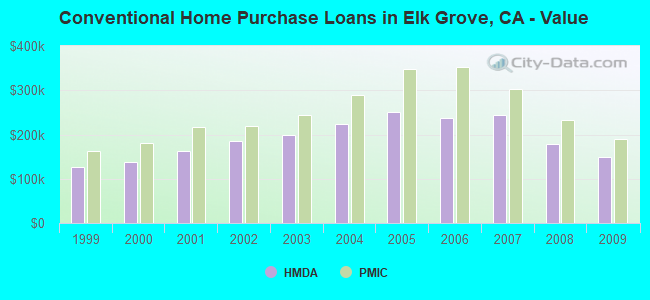
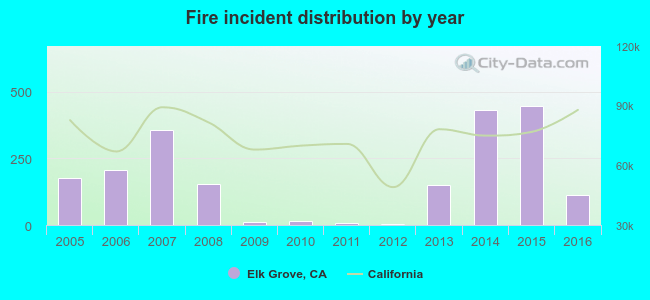 Based on the data from the years 2005 - 2016 the average number of fires per year is 172. The highest number of reported fires - 447 took place in 2015, and the least - 4 in 2012. The data has a dropping trend.
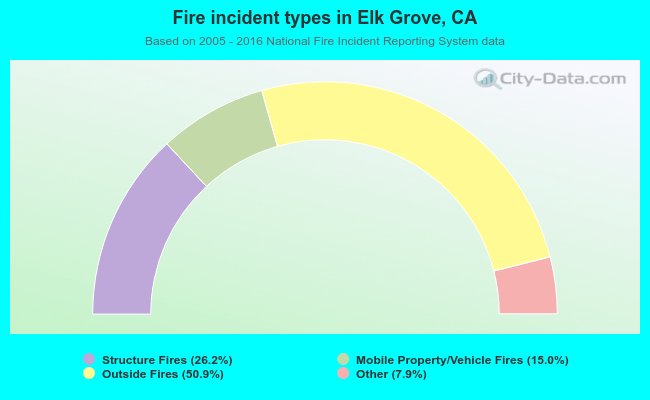 When looking into fire subcategories, the most incidents belonged to: Outside Fires (50.9%), and Structure Fires (26.2%).