Hawaiian Gardens, California Submit your own pictures of this city and show them to the world
OSM Map
General Map
Google Map
MSN Map
OSM Map
General Map
Google Map
MSN Map
OSM Map
General Map
Google Map
MSN Map
OSM Map
General Map
Google Map
MSN Map
Please wait while loading the map...
Population in 2022: 13,593 (100% urban, 0% rural). Population change since 2000: -8.0%Males: 6,645 Females: 6,948
March 2022 cost of living index in Hawaiian Gardens: 136.3 (high, U.S. average is 100) Percentage of residents living in poverty in 2022: 14.4%for White Non-Hispanic residents , 0.8% for Black residents , 16.0% for Hispanic or Latino residents , 16.8% for other race residents , 15.7% for two or more races residents )
Profiles of local businesses
Business Search - 14 Million verified businesses
Data:
Median household income ($)
Median household income (% change since 2000)
Household income diversity
Ratio of average income to average house value (%)
Ratio of average income to average rent
Median household income ($) - White
Median household income ($) - Black or African American
Median household income ($) - Asian
Median household income ($) - Hispanic or Latino
Median household income ($) - American Indian and Alaska Native
Median household income ($) - Multirace
Median household income ($) - Other Race
Median household income for houses/condos with a mortgage ($)
Median household income for apartments without a mortgage ($)
Races - White alone (%)
Races - White alone (% change since 2000)
Races - Black alone (%)
Races - Black alone (% change since 2000)
Races - American Indian alone (%)
Races - American Indian alone (% change since 2000)
Races - Asian alone (%)
Races - Asian alone (% change since 2000)
Races - Hispanic (%)
Races - Hispanic (% change since 2000)
Races - Native Hawaiian and Other Pacific Islander alone (%)
Races - Native Hawaiian and Other Pacific Islander alone (% change since 2000)
Races - Two or more races (%)
Races - Two or more races (% change since 2000)
Races - Other race alone (%)
Races - Other race alone (% change since 2000)
Racial diversity
Unemployment (%)
Unemployment (% change since 2000)
Unemployment (%) - White
Unemployment (%) - Black or African American
Unemployment (%) - Asian
Unemployment (%) - Hispanic or Latino
Unemployment (%) - American Indian and Alaska Native
Unemployment (%) - Multirace
Unemployment (%) - Other Race
Population density (people per square mile)
Population - Males (%)
Population - Females (%)
Population - Males (%) - White
Population - Males (%) - Black or African American
Population - Males (%) - Asian
Population - Males (%) - Hispanic or Latino
Population - Males (%) - American Indian and Alaska Native
Population - Males (%) - Multirace
Population - Males (%) - Other Race
Population - Females (%) - White
Population - Females (%) - Black or African American
Population - Females (%) - Asian
Population - Females (%) - Hispanic or Latino
Population - Females (%) - American Indian and Alaska Native
Population - Females (%) - Multirace
Population - Females (%) - Other Race
Coronavirus confirmed cases (Apr 26, 2024)
Deaths caused by coronavirus (Apr 26, 2024)
Coronavirus confirmed cases (per 100k population) (Apr 26, 2024)
Deaths caused by coronavirus (per 100k population) (Apr 26, 2024)
Daily increase in number of cases (Apr 26, 2024)
Weekly increase in number of cases (Apr 26, 2024)
Cases doubled (in days) (Apr 26, 2024)
Hospitalized patients (Apr 18, 2022)
Negative test results (Apr 18, 2022)
Total test results (Apr 18, 2022)
COVID Vaccine doses distributed (per 100k population) (Sep 19, 2023)
COVID Vaccine doses administered (per 100k population) (Sep 19, 2023)
COVID Vaccine doses distributed (Sep 19, 2023)
COVID Vaccine doses administered (Sep 19, 2023)
Likely homosexual households (%)
Likely homosexual households (% change since 2000)
Likely homosexual households - Lesbian couples (%)
Likely homosexual households - Lesbian couples (% change since 2000)
Likely homosexual households - Gay men (%)
Likely homosexual households - Gay men (% change since 2000)
Cost of living index
Median gross rent ($)
Median contract rent ($)
Median monthly housing costs ($)
Median house or condo value ($)
Median house or condo value ($ change since 2000)
Mean house or condo value by units in structure - 1, detached ($)
Mean house or condo value by units in structure - 1, attached ($)
Mean house or condo value by units in structure - 2 ($)
Mean house or condo value by units in structure by units in structure - 3 or 4 ($)
Mean house or condo value by units in structure - 5 or more ($)
Mean house or condo value by units in structure - Boat, RV, van, etc. ($)
Mean house or condo value by units in structure - Mobile home ($)
Median house or condo value ($) - White
Median house or condo value ($) - Black or African American
Median house or condo value ($) - Asian
Median house or condo value ($) - Hispanic or Latino
Median house or condo value ($) - American Indian and Alaska Native
Median house or condo value ($) - Multirace
Median house or condo value ($) - Other Race
Median resident age
Resident age diversity
Median resident age - Males
Median resident age - Females
Median resident age - White
Median resident age - Black or African American
Median resident age - Asian
Median resident age - Hispanic or Latino
Median resident age - American Indian and Alaska Native
Median resident age - Multirace
Median resident age - Other Race
Median resident age - Males - White
Median resident age - Males - Black or African American
Median resident age - Males - Asian
Median resident age - Males - Hispanic or Latino
Median resident age - Males - American Indian and Alaska Native
Median resident age - Males - Multirace
Median resident age - Males - Other Race
Median resident age - Females - White
Median resident age - Females - Black or African American
Median resident age - Females - Asian
Median resident age - Females - Hispanic or Latino
Median resident age - Females - American Indian and Alaska Native
Median resident age - Females - Multirace
Median resident age - Females - Other Race
Commute - mean travel time to work (minutes)
Travel time to work - Less than 5 minutes (%)
Travel time to work - Less than 5 minutes (% change since 2000)
Travel time to work - 5 to 9 minutes (%)
Travel time to work - 5 to 9 minutes (% change since 2000)
Travel time to work - 10 to 19 minutes (%)
Travel time to work - 10 to 19 minutes (% change since 2000)
Travel time to work - 20 to 29 minutes (%)
Travel time to work - 20 to 29 minutes (% change since 2000)
Travel time to work - 30 to 39 minutes (%)
Travel time to work - 30 to 39 minutes (% change since 2000)
Travel time to work - 40 to 59 minutes (%)
Travel time to work - 40 to 59 minutes (% change since 2000)
Travel time to work - 60 to 89 minutes (%)
Travel time to work - 60 to 89 minutes (% change since 2000)
Travel time to work - 90 or more minutes (%)
Travel time to work - 90 or more minutes (% change since 2000)
Marital status - Never married (%)
Marital status - Now married (%)
Marital status - Separated (%)
Marital status - Widowed (%)
Marital status - Divorced (%)
Median family income ($)
Median family income (% change since 2000)
Median non-family income ($)
Median non-family income (% change since 2000)
Median per capita income ($)
Median per capita income (% change since 2000)
Median family income ($) - White
Median family income ($) - Black or African American
Median family income ($) - Asian
Median family income ($) - Hispanic or Latino
Median family income ($) - American Indian and Alaska Native
Median family income ($) - Multirace
Median family income ($) - Other Race
Median year house/condo built
Median year apartment built
Year house built - Built 2005 or later (%)
Year house built - Built 2000 to 2004 (%)
Year house built - Built 1990 to 1999 (%)
Year house built - Built 1980 to 1989 (%)
Year house built - Built 1970 to 1979 (%)
Year house built - Built 1960 to 1969 (%)
Year house built - Built 1950 to 1959 (%)
Year house built - Built 1940 to 1949 (%)
Year house built - Built 1939 or earlier (%)
Average household size
Household density (households per square mile)
Average household size - White
Average household size - Black or African American
Average household size - Asian
Average household size - Hispanic or Latino
Average household size - American Indian and Alaska Native
Average household size - Multirace
Average household size - Other Race
Occupied housing units (%)
Vacant housing units (%)
Owner occupied housing units (%)
Renter occupied housing units (%)
Vacancy status - For rent (%)
Vacancy status - For sale only (%)
Vacancy status - Rented or sold, not occupied (%)
Vacancy status - For seasonal, recreational, or occasional use (%)
Vacancy status - For migrant workers (%)
Vacancy status - Other vacant (%)
Residents with income below the poverty level (%)
Residents with income below 50% of the poverty level (%)
Children below poverty level (%)
Poor families by family type - Married-couple family (%)
Poor families by family type - Male, no wife present (%)
Poor families by family type - Female, no husband present (%)
Poverty status for native-born residents (%)
Poverty status for foreign-born residents (%)
Poverty among high school graduates not in families (%)
Poverty among people who did not graduate high school not in families (%)
Residents with income below the poverty level (%) - White
Residents with income below the poverty level (%) - Black or African American
Residents with income below the poverty level (%) - Asian
Residents with income below the poverty level (%) - Hispanic or Latino
Residents with income below the poverty level (%) - American Indian and Alaska Native
Residents with income below the poverty level (%) - Multirace
Residents with income below the poverty level (%) - Other Race
Air pollution - Air Quality Index (AQI)
Air pollution - CO
Air pollution - NO2
Air pollution - SO2
Air pollution - Ozone
Air pollution - PM10
Air pollution - PM25
Air pollution - Pb
Crime - Murders per 100,000 population
Crime - Rapes per 100,000 population
Crime - Robberies per 100,000 population
Crime - Assaults per 100,000 population
Crime - Burglaries per 100,000 population
Crime - Thefts per 100,000 population
Crime - Auto thefts per 100,000 population
Crime - Arson per 100,000 population
Crime - City-data.com crime index
Crime - Violent crime index
Crime - Property crime index
Crime - Murders per 100,000 population (5 year average)
Crime - Rapes per 100,000 population (5 year average)
Crime - Robberies per 100,000 population (5 year average)
Crime - Assaults per 100,000 population (5 year average)
Crime - Burglaries per 100,000 population (5 year average)
Crime - Thefts per 100,000 population (5 year average)
Crime - Auto thefts per 100,000 population (5 year average)
Crime - Arson per 100,000 population (5 year average)
Crime - City-data.com crime index (5 year average)
Crime - Violent crime index (5 year average)
Crime - Property crime index (5 year average)
1996 Presidential Elections Results (%) - Democratic Party (Clinton)
1996 Presidential Elections Results (%) - Republican Party (Dole)
1996 Presidential Elections Results (%) - Other
2000 Presidential Elections Results (%) - Democratic Party (Gore)
2000 Presidential Elections Results (%) - Republican Party (Bush)
2000 Presidential Elections Results (%) - Other
2004 Presidential Elections Results (%) - Democratic Party (Kerry)
2004 Presidential Elections Results (%) - Republican Party (Bush)
2004 Presidential Elections Results (%) - Other
2008 Presidential Elections Results (%) - Democratic Party (Obama)
2008 Presidential Elections Results (%) - Republican Party (McCain)
2008 Presidential Elections Results (%) - Other
2012 Presidential Elections Results (%) - Democratic Party (Obama)
2012 Presidential Elections Results (%) - Republican Party (Romney)
2012 Presidential Elections Results (%) - Other
2016 Presidential Elections Results (%) - Democratic Party (Clinton)
2016 Presidential Elections Results (%) - Republican Party (Trump)
2016 Presidential Elections Results (%) - Other
2020 Presidential Elections Results (%) - Democratic Party (Biden)
2020 Presidential Elections Results (%) - Republican Party (Trump)
2020 Presidential Elections Results (%) - Other
Ancestries Reported - Arab (%)
Ancestries Reported - Czech (%)
Ancestries Reported - Danish (%)
Ancestries Reported - Dutch (%)
Ancestries Reported - English (%)
Ancestries Reported - French (%)
Ancestries Reported - French Canadian (%)
Ancestries Reported - German (%)
Ancestries Reported - Greek (%)
Ancestries Reported - Hungarian (%)
Ancestries Reported - Irish (%)
Ancestries Reported - Italian (%)
Ancestries Reported - Lithuanian (%)
Ancestries Reported - Norwegian (%)
Ancestries Reported - Polish (%)
Ancestries Reported - Portuguese (%)
Ancestries Reported - Russian (%)
Ancestries Reported - Scotch-Irish (%)
Ancestries Reported - Scottish (%)
Ancestries Reported - Slovak (%)
Ancestries Reported - Subsaharan African (%)
Ancestries Reported - Swedish (%)
Ancestries Reported - Swiss (%)
Ancestries Reported - Ukrainian (%)
Ancestries Reported - United States (%)
Ancestries Reported - Welsh (%)
Ancestries Reported - West Indian (%)
Ancestries Reported - Other (%)
Educational Attainment - No schooling completed (%)
Educational Attainment - Less than high school (%)
Educational Attainment - High school or equivalent (%)
Educational Attainment - Less than 1 year of college (%)
Educational Attainment - 1 or more years of college (%)
Educational Attainment - Associate degree (%)
Educational Attainment - Bachelor's degree (%)
Educational Attainment - Master's degree (%)
Educational Attainment - Professional school degree (%)
Educational Attainment - Doctorate degree (%)
School Enrollment - Nursery, preschool (%)
School Enrollment - Kindergarten (%)
School Enrollment - Grade 1 to 4 (%)
School Enrollment - Grade 5 to 8 (%)
School Enrollment - Grade 9 to 12 (%)
School Enrollment - College undergrad (%)
School Enrollment - Graduate or professional (%)
School Enrollment - Not enrolled in school (%)
School enrollment - Public schools (%)
School enrollment - Private schools (%)
School enrollment - Not enrolled (%)
Median number of rooms in houses and condos
Median number of rooms in apartments
Housing units lacking complete plumbing facilities (%)
Housing units lacking complete kitchen facilities (%)
Density of houses
Urban houses (%)
Rural houses (%)
Households with people 60 years and over (%)
Households with people 65 years and over (%)
Households with people 75 years and over (%)
Households with one or more nonrelatives (%)
Households with no nonrelatives (%)
Population in households (%)
Family households (%)
Nonfamily households (%)
Population in families (%)
Family households with own children (%)
Median number of bedrooms in owner occupied houses
Mean number of bedrooms in owner occupied houses
Median number of bedrooms in renter occupied houses
Mean number of bedrooms in renter occupied houses
Median number of vehichles in owner occupied houses
Mean number of vehichles in owner occupied houses
Median number of vehichles in renter occupied houses
Mean number of vehichles in renter occupied houses
Mortgage status - with mortgage (%)
Mortgage status - with second mortgage (%)
Mortgage status - with home equity loan (%)
Mortgage status - with both second mortgage and home equity loan (%)
Mortgage status - without a mortgage (%)
Average family size
Average family size - White
Average family size - Black or African American
Average family size - Asian
Average family size - Hispanic or Latino
Average family size - American Indian and Alaska Native
Average family size - Multirace
Average family size - Other Race
Geographical mobility - Same house 1 year ago (%)
Geographical mobility - Moved within same county (%)
Geographical mobility - Moved from different county within same state (%)
Geographical mobility - Moved from different state (%)
Geographical mobility - Moved from abroad (%)
Place of birth - Born in state of residence (%)
Place of birth - Born in other state (%)
Place of birth - Native, outside of US (%)
Place of birth - Foreign born (%)
Housing units in structures - 1, detached (%)
Housing units in structures - 1, attached (%)
Housing units in structures - 2 (%)
Housing units in structures - 3 or 4 (%)
Housing units in structures - 5 to 9 (%)
Housing units in structures - 10 to 19 (%)
Housing units in structures - 20 to 49 (%)
Housing units in structures - 50 or more (%)
Housing units in structures - Mobile home (%)
Housing units in structures - Boat, RV, van, etc. (%)
House/condo owner moved in on average (years ago)
Renter moved in on average (years ago)
Year householder moved into unit - Moved in 1999 to March 2000 (%)
Year householder moved into unit - Moved in 1995 to 1998 (%)
Year householder moved into unit - Moved in 1990 to 1994 (%)
Year householder moved into unit - Moved in 1980 to 1989 (%)
Year householder moved into unit - Moved in 1970 to 1979 (%)
Year householder moved into unit - Moved in 1969 or earlier (%)
Means of transportation to work - Drove car alone (%)
Means of transportation to work - Carpooled (%)
Means of transportation to work - Public transportation (%)
Means of transportation to work - Bus or trolley bus (%)
Means of transportation to work - Streetcar or trolley car (%)
Means of transportation to work - Subway or elevated (%)
Means of transportation to work - Railroad (%)
Means of transportation to work - Ferryboat (%)
Means of transportation to work - Taxicab (%)
Means of transportation to work - Motorcycle (%)
Means of transportation to work - Bicycle (%)
Means of transportation to work - Walked (%)
Means of transportation to work - Other means (%)
Working at home (%)
Industry diversity
Most Common Industries - Agriculture, forestry, fishing and hunting, and mining (%)
Most Common Industries - Agriculture, forestry, fishing and hunting (%)
Most Common Industries - Mining, quarrying, and oil and gas extraction (%)
Most Common Industries - Construction (%)
Most Common Industries - Manufacturing (%)
Most Common Industries - Wholesale trade (%)
Most Common Industries - Retail trade (%)
Most Common Industries - Transportation and warehousing, and utilities (%)
Most Common Industries - Transportation and warehousing (%)
Most Common Industries - Utilities (%)
Most Common Industries - Information (%)
Most Common Industries - Finance and insurance, and real estate and rental and leasing (%)
Most Common Industries - Finance and insurance (%)
Most Common Industries - Real estate and rental and leasing (%)
Most Common Industries - Professional, scientific, and management, and administrative and waste management services (%)
Most Common Industries - Professional, scientific, and technical services (%)
Most Common Industries - Management of companies and enterprises (%)
Most Common Industries - Administrative and support and waste management services (%)
Most Common Industries - Educational services, and health care and social assistance (%)
Most Common Industries - Educational services (%)
Most Common Industries - Health care and social assistance (%)
Most Common Industries - Arts, entertainment, and recreation, and accommodation and food services (%)
Most Common Industries - Arts, entertainment, and recreation (%)
Most Common Industries - Accommodation and food services (%)
Most Common Industries - Other services, except public administration (%)
Most Common Industries - Public administration (%)
Occupation diversity
Most Common Occupations - Management, business, science, and arts occupations (%)
Most Common Occupations - Management, business, and financial occupations (%)
Most Common Occupations - Management occupations (%)
Most Common Occupations - Business and financial operations occupations (%)
Most Common Occupations - Computer, engineering, and science occupations (%)
Most Common Occupations - Computer and mathematical occupations (%)
Most Common Occupations - Architecture and engineering occupations (%)
Most Common Occupations - Life, physical, and social science occupations (%)
Most Common Occupations - Education, legal, community service, arts, and media occupations (%)
Most Common Occupations - Community and social service occupations (%)
Most Common Occupations - Legal occupations (%)
Most Common Occupations - Education, training, and library occupations (%)
Most Common Occupations - Arts, design, entertainment, sports, and media occupations (%)
Most Common Occupations - Healthcare practitioners and technical occupations (%)
Most Common Occupations - Health diagnosing and treating practitioners and other technical occupations (%)
Most Common Occupations - Health technologists and technicians (%)
Most Common Occupations - Service occupations (%)
Most Common Occupations - Healthcare support occupations (%)
Most Common Occupations - Protective service occupations (%)
Most Common Occupations - Fire fighting and prevention, and other protective service workers including supervisors (%)
Most Common Occupations - Law enforcement workers including supervisors (%)
Most Common Occupations - Food preparation and serving related occupations (%)
Most Common Occupations - Building and grounds cleaning and maintenance occupations (%)
Most Common Occupations - Personal care and service occupations (%)
Most Common Occupations - Sales and office occupations (%)
Most Common Occupations - Sales and related occupations (%)
Most Common Occupations - Office and administrative support occupations (%)
Most Common Occupations - Natural resources, construction, and maintenance occupations (%)
Most Common Occupations - Farming, fishing, and forestry occupations (%)
Most Common Occupations - Construction and extraction occupations (%)
Most Common Occupations - Installation, maintenance, and repair occupations (%)
Most Common Occupations - Production, transportation, and material moving occupations (%)
Most Common Occupations - Production occupations (%)
Most Common Occupations - Transportation occupations (%)
Most Common Occupations - Material moving occupations (%)
People in Group quarters - Institutionalized population (%)
People in Group quarters - Correctional institutions (%)
People in Group quarters - Federal prisons and detention centers (%)
People in Group quarters - Halfway houses (%)
People in Group quarters - Local jails and other confinement facilities (including police lockups) (%)
People in Group quarters - Military disciplinary barracks (%)
People in Group quarters - State prisons (%)
People in Group quarters - Other types of correctional institutions (%)
People in Group quarters - Nursing homes (%)
People in Group quarters - Hospitals/wards, hospices, and schools for the handicapped (%)
People in Group quarters - Hospitals/wards and hospices for chronically ill (%)
People in Group quarters - Hospices or homes for chronically ill (%)
People in Group quarters - Military hospitals or wards for chronically ill (%)
People in Group quarters - Other hospitals or wards for chronically ill (%)
People in Group quarters - Hospitals or wards for drug/alcohol abuse (%)
People in Group quarters - Mental (Psychiatric) hospitals or wards (%)
People in Group quarters - Schools, hospitals, or wards for the mentally retarded (%)
People in Group quarters - Schools, hospitals, or wards for the physically handicapped (%)
People in Group quarters - Institutions for the deaf (%)
People in Group quarters - Institutions for the blind (%)
People in Group quarters - Orthopedic wards and institutions for the physically handicapped (%)
People in Group quarters - Wards in general hospitals for patients who have no usual home elsewhere (%)
People in Group quarters - Wards in military hospitals for patients who have no usual home elsewhere (%)
People in Group quarters - Juvenile institutions (%)
People in Group quarters - Long-term care (%)
People in Group quarters - Homes for abused, dependent, and neglected children (%)
People in Group quarters - Residential treatment centers for emotionally disturbed children (%)
People in Group quarters - Training schools for juvenile delinquents (%)
People in Group quarters - Short-term care, detention or diagnostic centers for delinquent children (%)
People in Group quarters - Type of juvenile institution unknown (%)
People in Group quarters - Noninstitutionalized population (%)
People in Group quarters - College dormitories (includes college quarters off campus) (%)
People in Group quarters - Military quarters (%)
People in Group quarters - On base (%)
People in Group quarters - Barracks, unaccompanied personnel housing (UPH), (Enlisted/Officer), ;and similar group living quarters for military personnel (%)
People in Group quarters - Transient quarters for temporary residents (%)
People in Group quarters - Military ships (%)
People in Group quarters - Group homes (%)
People in Group quarters - Homes or halfway houses for drug/alcohol abuse (%)
People in Group quarters - Homes for the mentally ill (%)
People in Group quarters - Homes for the mentally retarded (%)
People in Group quarters - Homes for the physically handicapped (%)
People in Group quarters - Other group homes (%)
People in Group quarters - Religious group quarters (%)
People in Group quarters - Dormitories (%)
People in Group quarters - Agriculture workers' dormitories on farms (%)
People in Group quarters - Job Corps and vocational training facilities (%)
People in Group quarters - Other workers' dormitories (%)
People in Group quarters - Crews of maritime vessels (%)
People in Group quarters - Other nonhousehold living situations (%)
People in Group quarters - Other noninstitutional group quarters (%)
Residents speaking English at home (%)
Residents speaking English at home - Born in the United States (%)
Residents speaking English at home - Native, born elsewhere (%)
Residents speaking English at home - Foreign born (%)
Residents speaking Spanish at home (%)
Residents speaking Spanish at home - Born in the United States (%)
Residents speaking Spanish at home - Native, born elsewhere (%)
Residents speaking Spanish at home - Foreign born (%)
Residents speaking other language at home (%)
Residents speaking other language at home - Born in the United States (%)
Residents speaking other language at home - Native, born elsewhere (%)
Residents speaking other language at home - Foreign born (%)
Class of Workers - Employee of private company (%)
Class of Workers - Self-employed in own incorporated business (%)
Class of Workers - Private not-for-profit wage and salary workers (%)
Class of Workers - Local government workers (%)
Class of Workers - State government workers (%)
Class of Workers - Federal government workers (%)
Class of Workers - Self-employed workers in own not incorporated business and Unpaid family workers (%)
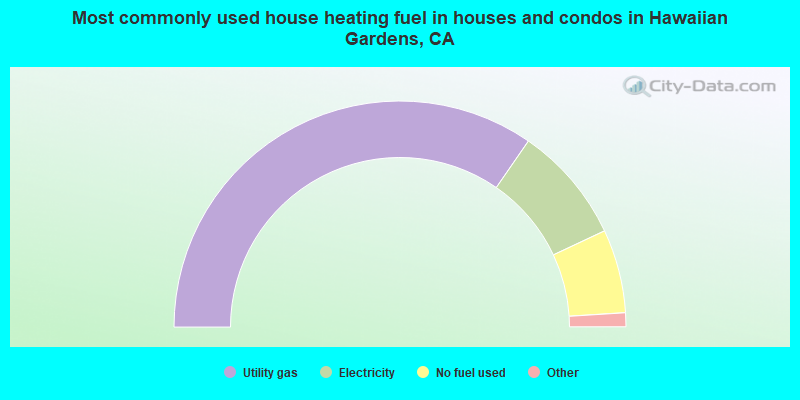
House heating fuel used in houses and condos - Utility gas (%)
House heating fuel used in houses and condos - Bottled, tank, or LP gas (%)
House heating fuel used in houses and condos - Electricity (%)
House heating fuel used in houses and condos - Fuel oil, kerosene, etc. (%)
House heating fuel used in houses and condos - Coal or coke (%)
House heating fuel used in houses and condos - Wood (%)
House heating fuel used in houses and condos - Solar energy (%)
House heating fuel used in houses and condos - Other fuel (%)
House heating fuel used in houses and condos - No fuel used (%)
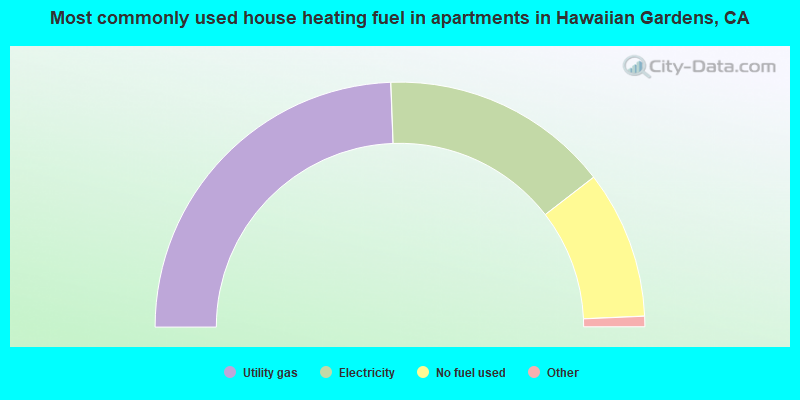
House heating fuel used in apartments - Utility gas (%)
House heating fuel used in apartments - Bottled, tank, or LP gas (%)
House heating fuel used in apartments - Electricity (%)
House heating fuel used in apartments - Fuel oil, kerosene, etc. (%)
House heating fuel used in apartments - Coal or coke (%)
House heating fuel used in apartments - Wood (%)
House heating fuel used in apartments - Solar energy (%)
House heating fuel used in apartments - Other fuel (%)
House heating fuel used in apartments - No fuel used (%)
Armed forces status - In Armed Forces (%)
Armed forces status - Civilian (%)
Armed forces status - Civilian - Veteran (%)
Armed forces status - Civilian - Nonveteran (%)
Fatal accidents locations in years 2005-2021
Fatal accidents locations in 2005
Fatal accidents locations in 2006
Fatal accidents locations in 2007
Fatal accidents locations in 2008
Fatal accidents locations in 2009
Fatal accidents locations in 2010
Fatal accidents locations in 2011
Fatal accidents locations in 2012
Fatal accidents locations in 2013
Fatal accidents locations in 2014
Fatal accidents locations in 2015
Fatal accidents locations in 2016
Fatal accidents locations in 2017
Fatal accidents locations in 2018
Fatal accidents locations in 2019
Fatal accidents locations in 2020
Fatal accidents locations in 2021
Alcohol use - People drinking some alcohol every month (%)
Alcohol use - People not drinking at all (%)
Alcohol use - Average days/month drinking alcohol
Alcohol use - Average drinks/week
Alcohol use - Average days/year people drink much
Audiometry - Average condition of hearing (%)
Audiometry - People that can hear a whisper from across a quiet room (%)
Audiometry - People that can hear normal voice from across a quiet room (%)
Audiometry - Ears ringing, roaring, buzzing (%)
Audiometry - Had a job exposure to loud noise (%)
Audiometry - Had off-work exposure to loud noise (%)
Blood Pressure & Cholesterol - Has high blood pressure (%)
Blood Pressure & Cholesterol - Checking blood pressure at home (%)
Blood Pressure & Cholesterol - Frequently checking blood cholesterol (%)
Blood Pressure & Cholesterol - Has high cholesterol level (%)
Consumer Behavior - Money monthly spent on food at supermarket/grocery store
Consumer Behavior - Money monthly spent on food at other stores
Consumer Behavior - Money monthly spent on eating out
Consumer Behavior - Money monthly spent on carryout/delivered foods
Consumer Behavior - Income spent on food at supermarket/grocery store (%)
Consumer Behavior - Income spent on food at other stores (%)
Consumer Behavior - Income spent on eating out (%)
Consumer Behavior - Income spent on carryout/delivered foods (%)
Current Health Status - General health condition (%)
Current Health Status - Blood donors (%)
Current Health Status - Has blood ever tested for HIV virus (%)
Current Health Status - Left-handed people (%)
Dermatology - People using sunscreen (%)
Diabetes - Diabetics (%)
Diabetes - Had a blood test for high blood sugar (%)
Diabetes - People taking insulin (%)
Diet Behavior & Nutrition - Diet health (%)
Diet Behavior & Nutrition - Milk product consumption (# of products/month)
Diet Behavior & Nutrition - Meals not home prepared (#/week)
Diet Behavior & Nutrition - Meals from fast food or pizza place (#/week)
Diet Behavior & Nutrition - Ready-to-eat foods (#/month)
Diet Behavior & Nutrition - Frozen meals/pizza (#/month)
Drug Use - People that ever used marijuana or hashish (%)
Drug Use - Ever used hard drugs (%)
Drug Use - Ever used any form of cocaine (%)
Drug Use - Ever used heroin (%)
Drug Use - Ever used methamphetamine (%)
Health Insurance - People covered by health insurance (%)
Kidney Conditions-Urology - Avg. # of times urinating at night
Medical Conditions - People with asthma (%)
Medical Conditions - People with anemia (%)
Medical Conditions - People with psoriasis (%)
Medical Conditions - People with overweight (%)
Medical Conditions - Elderly people having difficulties in thinking or remembering (%)
Medical Conditions - People who ever received blood transfusion (%)
Medical Conditions - People having trouble seeing even with glass/contacts (%)
Medical Conditions - People with arthritis (%)
Medical Conditions - People with gout (%)
Medical Conditions - People with congestive heart failure (%)
Medical Conditions - People with coronary heart disease (%)
Medical Conditions - People with angina pectoris (%)
Medical Conditions - People who ever had heart attack (%)
Medical Conditions - People who ever had stroke (%)
Medical Conditions - People with emphysema (%)
Medical Conditions - People with thyroid problem (%)
Medical Conditions - People with chronic bronchitis (%)
Medical Conditions - People with any liver condition (%)
Medical Conditions - People who ever had cancer or malignancy (%)
Mental Health - People who have little interest in doing things (%)
Mental Health - People feeling down, depressed, or hopeless (%)
Mental Health - People who have trouble sleeping or sleeping too much (%)
Mental Health - People feeling tired or having little energy (%)
Mental Health - People with poor appetite or overeating (%)
Mental Health - People feeling bad about themself (%)
Mental Health - People who have trouble concentrating on things (%)
Mental Health - People moving or speaking slowly or too fast (%)
Mental Health - People having thoughts they would be better off dead (%)
Oral Health - Average years since last visit a dentist
Oral Health - People embarrassed because of mouth (%)
Oral Health - People with gum disease (%)
Oral Health - General health of teeth and gums (%)
Oral Health - Average days a week using dental floss/device
Oral Health - Average days a week using mouthwash for dental problem
Oral Health - Average number of teeth
Pesticide Use - Households using pesticides to control insects (%)
Pesticide Use - Households using pesticides to kill weeds (%)
Physical Activity - People doing vigorous-intensity work activities (%)
Physical Activity - People doing moderate-intensity work activities (%)
Physical Activity - People walking or bicycling (%)
Physical Activity - People doing vigorous-intensity recreational activities (%)
Physical Activity - People doing moderate-intensity recreational activities (%)
Physical Activity - Average hours a day doing sedentary activities
Physical Activity - Average hours a day watching TV or videos
Physical Activity - Average hours a day using computer
Physical Functioning - People having limitations keeping them from working (%)
Physical Functioning - People limited in amount of work they can do (%)
Physical Functioning - People that need special equipment to walk (%)
Physical Functioning - People experiencing confusion/memory problems (%)
Physical Functioning - People requiring special healthcare equipment (%)
Prescription Medications - Average number of prescription medicines taking
Preventive Aspirin Use - Adults 40+ taking low-dose aspirin (%)
Reproductive Health - Vaginal deliveries (%)
Reproductive Health - Cesarean deliveries (%)
Reproductive Health - Deliveries resulted in a live birth (%)
Reproductive Health - Pregnancies resulted in a delivery (%)
Reproductive Health - Women breastfeeding newborns (%)
Reproductive Health - Women that had a hysterectomy (%)
Reproductive Health - Women that had both ovaries removed (%)
Reproductive Health - Women that have ever taken birth control pills (%)
Reproductive Health - Women taking birth control pills (%)
Reproductive Health - Women that have ever used Depo-Provera or injectables (%)
Reproductive Health - Women that have ever used female hormones (%)
Sexual Behavior - People 18+ that ever had sex (vaginal, anal, or oral) (%)
Sexual Behavior - Males 18+ that ever had vaginal sex with a woman (%)
Sexual Behavior - Males 18+ that ever performed oral sex on a woman (%)
Sexual Behavior - Males 18+ that ever had anal sex with a woman (%)
Sexual Behavior - Males 18+ that ever had any sex with a man (%)
Sexual Behavior - Females 18+ that ever had vaginal sex with a man (%)
Sexual Behavior - Females 18+ that ever performed oral sex on a man (%)
Sexual Behavior - Females 18+ that ever had anal sex with a man (%)
Sexual Behavior - Females 18+ that ever had any kind of sex with a woman (%)
Sexual Behavior - Average age people first had sex
Sexual Behavior - Average number of female sex partners in lifetime (males 18+)
Sexual Behavior - Average number of female vaginal sex partners in lifetime (males 18+)
Sexual Behavior - Average age people first performed oral sex on a woman (18+)
Sexual Behavior - Average number of woman performed oral sex on in lifetime (18+)
Sexual Behavior - Average number of male sex partners in lifetime (males 18+)
Sexual Behavior - Average number of male anal sex partners in lifetime (males 18+)
Sexual Behavior - Average age people first performed oral sex on a man (18+)
Sexual Behavior - Average number of male oral sex partners in lifetime (18+)
Sexual Behavior - People using protection when performing oral sex (%)
Sexual Behavior - Average number of times people have vaginal or anal sex a year
Sexual Behavior - People having sex without condom (%)
Sexual Behavior - Average number of male sex partners in lifetime (females 18+)
Sexual Behavior - Average number of male vaginal sex partners in lifetime (females 18+)
Sexual Behavior - Average number of female sex partners in lifetime (females 18+)
Sexual Behavior - Circumcised males 18+ (%)
Sleep Disorders - Average hours sleeping at night
Sleep Disorders - People that has trouble sleeping (%)
Smoking-Cigarette Use - People smoking cigarettes (%)
Taste & Smell - People 40+ having problems with smell (%)
Taste & Smell - People 40+ having problems with taste (%)
Taste & Smell - People 40+ that ever had wisdom teeth removed (%)
Taste & Smell - People 40+ that ever had tonsils teeth removed (%)
Taste & Smell - People 40+ that ever had a loss of consciousness because of a head injury (%)
Taste & Smell - People 40+ that ever had a broken nose or other serious injury to face or skull (%)
Taste & Smell - People 40+ that ever had two or more sinus infections (%)
Weight - Average height (inches)
Weight - Average weight (pounds)
Weight - Average BMI
Weight - People that are obese (%)
Weight - People that ever were obese (%)
Weight - People trying to lose weight (%)
10,645 77.7% Hispanic 1,693 12.4% Asian alone 876 6.4% White alone 373 2.7% Black alone 119 0.9% Two or more races 22 0.2% American Indian alone 23 0.2% Native Hawaiian and Other 20 0.1% Other race alone
Officers per 1,000 residents here:
0.07California average:
1.98
Latest news from Hawaiian Gardens, CA collected exclusively by city-data.com from local newspapers, TV, and radio stations
Ancestries: Iranian (2.4%).
Current Local Time:
Land area: 0.96 square miles.
Population density: 14,155 people per square mile (very high).
4,877 residents are foreign born (26.1% Latin America , 9.3% Asia ).
This city:
35.6%California:
26.5%
Median real estate property taxes paid for housing units with mortgages in 2022: $3,536 (0.6%)Median real estate property taxes paid for housing units with no mortgage in 2022: $2,376 (0.6%)
Nearest city with pop. 50,000+: Cerritos, CA
Nearest city with pop. 200,000+: Long Beach, CA
Nearest city with pop. 1,000,000+: Los Angeles, CA
Nearest cities:
Latitude: 33.83 N, Longitude: 118.07 W
Daytime population change due to commuting: -2,820 (-20.6%)Workers who live and work in this city: 1,075 (16.6%)
Property values in Hawaiian Gardens, CA
Single-family new house construction building permits:
2022: 7 buildings , average cost: $139,4002021: 8 buildings , average cost: $195,8002019: 5 buildings , average cost: $249,5002018: 5 buildings , average cost: $243,3002017: 3 buildings , average cost: $189,4002016: 1 building , cost: $52,0002015: 4 buildings , average cost: $219,6002014: 3 buildings , average cost: $155,2002012: 1 building , cost: $60,0002009: 3 buildings , average cost: $189,3002008: 10 buildings , average cost: $129,1002007: 15 buildings , average cost: $119,7002006: 19 buildings , average cost: $119,7002005: 25 buildings , average cost: $119,7002004: 26 buildings , average cost: $119,8002003: 24 buildings , average cost: $119,3002002: 16 buildings , average cost: $121,7002001: 23 buildings , average cost: $112,1002000: 6 buildings , average cost: $93,3001999: 9 buildings , average cost: $90,5001998: 10 buildings , average cost: $90,5001997: 11 buildings , average cost: $90,500Unemployment in December 2023:
Population change in the 1990s: +1,121 (+8.2%).
Most common occupations in Hawaiian Gardens, CA (%)
Both Males Females
Building and grounds cleaning and maintenance occupations (6.4%)
Other production occupations, including supervisors (4.7%)
Driver/sales workers and truck drivers (4.1%)
Textile, apparel, and furnishings workers (3.6%)
Cooks and food preparation workers (3.6%)
Cashiers (3.4%)
Laborers and material movers, hand (3.4%)
Building and grounds cleaning and maintenance occupations (8.0%)
Driver/sales workers and truck drivers (6.7%)
Metal workers and plastic workers (5.4%)
Other production occupations, including supervisors (5.3%)
Laborers and material movers, hand (4.5%)
Material recording, scheduling, dispatching, and distributing workers (4.3%)
Vehicle and mobile equipment mechanics, installers, and repairers (4.1%)
Information and record clerks, except customer service representatives (5.6%)
Cashiers (5.0%)
Other office and administrative support workers, including supervisors (5.0%)
Child care workers (4.6%)
Building and grounds cleaning and maintenance occupations (4.4%)
Supervisors and other personal care and service workers, except child care workers (4.2%)
Textile, apparel, and furnishings workers (4.1%)
Earthquake activity:
Hawaiian Gardens-area historical earthquake activity is significantly above California state average. It is 6846% greater than the overall U.S. average. On 7/21/1952 at 11:52:14, a magnitude 7.7 (7.7 UK, Class: Major, Intensity: VIII - XII) earthquake occurred 96.7 miles away from the city center, causing $50,000,000 total damage On 6/28/1992 at 11:57:34, a magnitude 7.6 (6.2 MB, 7.6 MS, 7.3 MW, Depth: 0.7 mi) earthquake occurred 91.7 miles away from the city center, causing 3 deaths ( 1 shaking deaths, 2 other deaths) and 400 injuries, causing $100,000,000 total damage and $40,000,000 insured lossesOn 10/16/1999 at 09:46:44, a magnitude 7.4 (6.3 MB, 7.4 MS, 7.2 MW, 7.3 ML) earthquake occurred 105.1 miles away from the city center On 11/4/1927 at 13:51:53, a magnitude 7.5 (7.5 UK) earthquake occurred 184.8 miles away from Hawaiian Gardens center On 4/21/1918 at 22:32:30, a magnitude 6.8 (6.8 UK, Class: Strong, Intensity: VII - IX) earthquake occurred 36.4 miles away from Hawaiian Gardens center On 1/17/1994 at 12:30:55, a magnitude 6.8 (6.4 MB, 6.8 MS, 6.7 MW, Depth: 11.4 mi) earthquake occurred 36.6 miles away from the city center, causing 60 deaths ( 60 shaking deaths) and 7000 injuriesMagnitude types: body-wave magnitude (MB), local magnitude (ML), surface-wave magnitude (MS), moment magnitude (MW) Natural disasters: The number of natural disasters in Los Angeles County (57) is a lot greater than the US average (15).Major Disasters (Presidential) Declared: 27Emergencies Declared: 3Fires: 37, Floods: 16, Storms: 9, Winter Storms: 6, Landslides: 5, Mudslides: 5, Earthquakes: 3, Freeze: 1, Heavy Rain: 1, Hurricane: 1, Snow: 1, Tornado: 1, Wind: 1, Other: 1 (Note: some incidents may be assigned to more than one category). Hospitals and medical centers in Hawaiian Gardens: HAWAIIAN HOUSE (12440 224TH STREET) TRI-CITY REGIONAL MEDICAL CENTER (Government - Hospital District or Authority, 21530 S PIONEER BLVD) HAWAIIAN GARDENS DIAYSIS (12191 226TH STREET)
Amtrak stations near Hawaiian Gardens: 8 miles: LONG BEACH (601 N. LONG BEACH BLVD.) - Bus Station Services: fully wheelchair accessible, public restrooms, public payphones, full-service food facilities, paid short-term parking, paid long-term parking, call for taxi service, public transit connection.
10 miles: FULLERTON (120 E. SANTA FE AVE.) Services: ticket office, fully wheelchair accessible, enclosed waiting area, public restrooms, public payphones, full-service food facilities, free short-term parking, paid long-term parking, taxi stand, public transit connection.
11 miles: ANAHEIM (2150 KATELLA AVE.) Services: ticket office, fully wheelchair accessible, enclosed waiting area, public restrooms, public payphones, vending machines, free short-term parking, free long-term parking, call for car rental service, call for taxi service.
Colleges/universities with over 2000 students nearest to Hawaiian Gardens:
Trident University International (about 3 miles; Cypress, CA ; Full-time enrollment: 5,974)
Cypress College (about 3 miles; Cypress, CA ; FT enrollment: 8,732)
Long Beach City College (about 4 miles; Long Beach, CA ; FT enrollment: 15,602)
California State University-Long Beach (about 4 miles; Long Beach, CA ; FT enrollment: 28,287)
Cerritos College (about 5 miles; Norwalk, CA ; FT enrollment: 13,090)
Biola University (about 7 miles; La Mirada, CA ; FT enrollment: 5,325)
Golden West College (about 8 miles; Huntington Beach, CA ; FT enrollment: 7,358)
Private high school in Hawaiian Gardens: TURNER CHRISTIAN HIGH SCHOOL Students: 17, Location: 22427 NORWALK BLVD, Grades: 9-12)
Public elementary/middle schools in Hawaiian Gardens: HAWAIIAN ELEMENTARY Students: 357, Location: 12350 E. 226TH ST., Grades: KG-6)FURGESON (VENN W.) ELEMENTARY Location: 22215 ELAINE AVE., Grades: KG-6)
FEDDE (PHARIS F.) MIDDLE Location: 21409 S. ELAINE AVE., Grades: 7-8)
See full list of schools located in Hawaiian Gardens Birthplace of: Bad Azz (rapper) - Rapper.
Los Angeles County has a predicted average indoor radon screening level between 2 and 4 pCi/L (pico curies per liter) - Moderate Potential Average household size: This city:
4.0 peopleCalifornia:
2.9 people
Percentage of family households: This city:
80.6%Whole state:
68.7%
Percentage of households with unmarried partners: This city:
6.7%Whole state:
7.2%
Likely homosexual households (counted as self-reported same-sex unmarried-partner households)
Lesbian couples: 0.3% of all households Gay men: 0.2% of all households
9 people in group homes intended for adults in 2010people in other noninstitutional facilities in 2010people in religious group quarters in 2000
For population 15 years and over in Hawaiian Gardens:
Never married: 43.3%Now married: 41.0%Separated: 2.6%Widowed: 4.4%Divorced: 8.8% For population 25 years and over in Hawaiian Gardens:
High school or higher: 65.8%Bachelor's degree or higher: 17.5%Graduate or professional degree: 5.5%Unemployed: 8.8%Mean travel time to work (commute): 21.9 minutes
Education Gini index (Inequality in education) Here:
19.7California average:
15.5
Religion statistics for Hawaiian Gardens, CA (based on Los Angeles County data)
Religion Adherents Congregations Catholic 3,542,994 275 Evangelical Protestant 814,611 3,249 Other 451,594 1,023 Mainline Protestant 229,056 860 Black Protestant 112,338 290 Orthodox 63,517 76 None 4,604,495 -
Source: Clifford Grammich, Kirk Hadaway, Richard Houseal, Dale E.Jones, Alexei Krindatch, Richie Stanley and Richard H.Taylor. 2012. 2010 U.S.Religion Census: Religious Congregations & Membership Study. Association of Statisticians of American Religious Bodies. Jones, Dale E., et al. 2002. Congregations and Membership in the United States 2000. Nashville, TN: Glenmary Research Center. Graphs represent county-level data
Food Environment Statistics: Number of grocery stores : 2,084This county :
2.12 / 10,000 pop.State :
2.14 / 10,000 pop.
Number of supercenters and club stores : 32Los Angeles County :
0.03 / 10,000 pop.California :
0.04 / 10,000 pop.
Number of convenience stores (no gas) : 567This county :
0.58 / 10,000 pop.State :
0.62 / 10,000 pop.
Number of convenience stores (with gas) : 1,206This county :
1.23 / 10,000 pop.State :
1.49 / 10,000 pop.
Number of full-service restaurants : 7,008Here :
7.15 / 10,000 pop.California :
7.42 / 10,000 pop.
Adult diabetes rate : Los Angeles County :
7.5%California :
7.3%
Adult obesity rate : Los Angeles County :
20.4%California :
21.3%
Low-income preschool obesity rate : This county :
18.6%California :
17.9%
Health and Nutrition:
Average overall health of teeth and gums : Here:
46.9%California:
48.0%
Average BMI : This city:
28.0California:
28.1
People feeling badly about themselves : Here:
22.3%California:
20.2%
People not drinking alcohol at all : Hawaiian Gardens:
10.5%California:
11.2%
Average hours sleeping at night : Overweight people : Hawaiian Gardens:
29.2%California:
31.5%
General health condition : Here:
54.9%California:
56.4%
Average condition of hearing : Hawaiian Gardens:
82.3%California:
80.9%
More about Health and Nutrition of Hawaiian Gardens, CA Residents
Local government employment and payroll (March 2022)
Function
Full-time employees
Monthly full-time payroll
Average yearly full-time wage
Part-time employees
Monthly part-time payroll
Streets and Highways
12 $69,563 $69,563 0 $0 Financial Administration
10 $123,922 $148,706 0 $0 Other Government Administration
8 $98,499 $147,749 0 $0 Parks and Recreation
8 $53,374 $80,061 8 $29,477 Welfare
5 $27,299 $65,518 1 $1,402 Housing and Community Development (Local)
4 $19,634 $58,902 0 $0 Police - Other
0 $0 11 $20,234
Totals for Government
47 $392,291 $100,159 20 $51,114
Hawaiian Gardens government finances - Expenditure in 2017 (per resident):
Construction - Central Staff Services: $8,686,000 ($639.01)
Housing and Community Development: $380,000 ($27.96)Current Operations - Central Staff Services: $5,722,000 ($420.95)
Police Protection: $4,090,000 ($300.89)Parks and Recreation: $3,544,000 ($260.72)Protective Inspection and Regulation - Other: $2,387,000 ($175.61)Housing and Community Development: $1,463,000 ($107.63)Transit Utilities: $832,000 ($61.21)Financial Administration: $636,000 ($46.79)Regular Highways: $566,000 ($41.64)Health - Other: $41,000 ($3.02)General - Interest on Debt: $1,504,000 ($110.65)
Intergovernmental to Local - Other - Police Protection: $3,657,000 ($269.04)
Other - General - Other: $1,205,000 ($88.65)Other - Housing and Community Development: $197,000 ($14.49)Other Capital Outlay - Parks and Recreation: $68,000 ($5.00)
Hawaiian Gardens government finances - Revenue in 2017 (per resident):
Charges - Parks and Recreation: $550,000 ($40.46)
Regular Highways: $234,000 ($17.21)Other: $113,000 ($8.31)Federal Intergovernmental - Other: $1,852,000 ($136.25)
Housing and Community Development: $115,000 ($8.46)Local Intergovernmental - Other: $2,649,000 ($194.88)
Miscellaneous - Rents: $115,000 ($8.46)
Fines and Forfeits: $109,000 ($8.02)Interest Earnings: $87,000 ($6.40)Donations From Private Sources: $11,000 ($0.81)State Intergovernmental - Highways: $289,000 ($21.26)
Other: $175,000 ($12.87)General Local Government Support: $1,000 ($0.07)Tax - Occupation and Business License - Other: $14,177,000 ($1042.96)
Property: $1,744,000 ($128.30)General Sales and Gross Receipts: $1,609,000 ($118.37)Other License: $208,000 ($15.30)Public Utilities Sales: $191,000 ($14.05)Other Selective Sales: $174,000 ($12.80)Documentary and Stock Transfer: $17,000 ($1.25)
Hawaiian Gardens government finances - Debt in 2017 (per resident):
Long Term Debt - Beginning Outstanding - Unspecified Public Purpose: $31,142,000 ($2291.03)
Outstanding Unspecified Public Purpose: $29,971,000 ($2204.88)Retired Unspecified Public Purpose: $1,171,000 ($86.15)
Hawaiian Gardens government finances - Cash and Securities in 2017 (per resident):
Bond Funds - Cash and Securities: $678,000 ($49.88)
Other Funds - Cash and Securities: $34,718,000 ($2554.11)
2.98% of this county's 2021 resident taxpayers lived in other counties in 2020 ($81,235 average adjusted gross income )
Here:
2.98%California average:
5.19%
0.01% of residents moved from foreign countries ($155 average AGI )Los Angeles County:
0.01%California average:
0.03%
Top counties from which taxpayers relocated into this county between 2020 and 2021:
4.68% of this county's 2020 resident taxpayers moved to other counties in 2021 ($97,324 average adjusted gross income )
Here:
4.68%California average:
6.14%
0.01% of residents moved to foreign countries ($196 average AGI )Los Angeles County:
0.01%California average:
0.02%
Top counties to which taxpayers relocated from this county between 2020 and 2021:
Businesses in Hawaiian Gardens, CA
Name Count Name Count
99 Cents Only Stores 1 La Quinta 1 AT&T 1 Little Caesars Pizza 1 AutoZone 1 McDonald's 1 Burger King 1 Nike 2 CVS 1 Popeyes 1 Jones New York 1 Skechers USA 1 KFC 1 Taco Bell 1 Kroger 1
Strongest AM radio stations in Hawaiian Gardens:
KFI (640 AM; 50 kW; LOS ANGELES, CA; Owner: CAPSTAR TX LIMITED PARTNERSHIP)
KTNQ (1020 AM; 50 kW; LOS ANGELES, CA; Owner: KTNQ-AM LICENSE CORP.)
KLAC (570 AM; 50 kW; LOS ANGELES, CA; Owner: AMFM RADIO LICENSES, L.L.C.)
KXTA (1150 AM; 50 kW; LOS ANGELES, CA; Owner: CITICASTERS LICENSES, L.P.)
KNX (1070 AM; 50 kW; LOS ANGELES, CA; Owner: INFINITY BROADCASTING OPERATIONS, INC.)
KFWB (980 AM; 50 kW; LOS ANGELES, CA; Owner: INFINITY BROADCASTING OPERATIONS, INC.)
KDIS (1110 AM; 50 kW; PASADENA, CA; Owner: ABC,INC.)
KMPC (1540 AM; 50 kW; LOS ANGELES, CA; Owner: ROSE CITY RADIO CORPORATION)
KPLS (830 AM; 50 kW; ORANGE, CA; Owner: CRN LICENSES, LLC)
KBLA (1580 AM; 50 kW; SANTA MONICA, CA)
KSPN (710 AM; 50 kW; LOS ANGELES, CA; Owner: KABC-AM RADIO, INC.)
KLTX (1390 AM; 5 kW; LONG BEACH, CA; Owner: HI-FAVOR BROADCASTING, LLC)
KXMX (1190 AM; 25 kW; ANAHEIM, CA; Owner: NEW INSPIRATION BROADCASTING COMPANY)
Strongest FM radio stations in Hawaiian Gardens:
KLAX-FM (97.9 FM; EAST LOS ANGELES, CA; Owner: KLAX LICENSING, INC.)
KKJZ (88.1 FM; LONG BEACH, CA; Owner: CALIF. STATE UNIV LONG BEACH FOUND.)
KZLA-FM (93.9 FM; LOS ANGELES, CA; Owner: EMMIS RADIO LICENSE CORPORATION)
KPWR (105.9 FM; LOS ANGELES, CA; Owner: EMMIS RADIO LICENSE CORPORATION)
KLSX (97.1 FM; LOS ANGELES, CA; Owner: INFINITY BROADCASTING OPERATIONS, INC.)
KUSC (91.5 FM; LOS ANGELES, CA; Owner: UNIVERSITY OF SOUTHERN CALIFORNIA)
KCBS-FM (93.1 FM; LOS ANGELES, CA; Owner: INFINITY BROADCASTING OPERATIONS, INC.)
KKLA-FM (99.5 FM; LOS ANGELES, CA; Owner: NEW INSPIRATION BROADCASTING CO., INC.)
KSCA (101.9 FM; GLENDALE, CA; Owner: HBC LICENSE CORPORATION)
KRTH-FM (101.1 FM; LOS ANGELES, CA; Owner: INFINITY BROADCASTING OPERATIONS, INC.)
KLOS (95.5 FM; LOS ANGELES, CA; Owner: KLOS-FM RADIO, INC.)
K212FA (90.3 FM; TEMPLE CITY, CA; Owner: EDUCATIONAL MEDIA FOUNDATION)
KOST (103.5 FM; LOS ANGELES, CA; Owner: CAPSTAR TX LIMITED PARTNERSHIP)
KKBT (100.3 FM; LOS ANGELES, CA; Owner: RADIO ONE LICENSES, LLC)
KIIS-FM (102.7 FM; LOS ANGELES, CA; Owner: CITICASTERS LICENSES, L.P.)
KLVE (107.5 FM; LOS ANGELES, CA; Owner: KLVE-FM LICENSE CORP.)
KPCC (89.3 FM; PASADENA, CA; Owner: PASADENA AREA COMMUNITY COLLEGE DISTRICT)
KHHT (92.3 FM; LOS ANGELES, CA; Owner: AMFM RADIO LICENSES, L.L.C.)
KBIG-FM (104.3 FM; LOS ANGELES, CA; Owner: AMFM RADIO LICENSES, L.L.C.)
KMZT-FM (105.1 FM; LOS ANGELES, CA; Owner: MOUNT WILSON FM BROADCASTERS, INC.)
TV broadcast stations around Hawaiian Gardens:
KTRO-LP (Channel 50; LANCASTER, CA; Owner: ROBERT D. ADELMAN)
KCBS-TV (Channel 2; LOS ANGELES, CA; Owner: CBS BROADCASTING INC.)
KTLA-TV (Channel 5; LOS ANGELES, CA; Owner: KTLA INC.)
KABC-TV (Channel 7; LOS ANGELES, CA; Owner: ABC HOLDING COMPANY, INC.)
KCAL-TV (Channel 9; LOS ANGELES, CA; Owner: VIACOM TELEVISION STATIONS GROUP OF LOS ANGELES LLC)
KNBC (Channel 4; LOS ANGELES, CA; Owner: NBC SUBSIDIARY (KNBC-TV), INC.)
KMEX-TV (Channel 34; LOS ANGELES, CA; Owner: KMEX LICENSE PARTNERSHIP, G.P.)
National Bridge Inventory (NBI) Statistics 6 Number of bridges23ft / 6.5m Total length $1,233,000 Total costs39,265 Total average daily traffic1,180 Total average daily truck traffic45,535 Total future (year 2041) average daily traffic
FCC Registered Antenna Towers: 1
21815 Pioneer Blvd (Lat: 33.827500 Lon: -118.081944), Type: 11.9, Overall height: 10.1 m, Registrant: Pacific Bell Mobile Services, Pleas-anton, Phone: (510) 227-3059 FCC Registered Broadcast Land Mobile Towers: 5
21207 S Norwalk Blvd (Lat: 33.837250 Lon: -118.072833), Call Sign: WIK441, Licensee ID: L00007682, Assigned Frequencies: 473.512 MHz, 473.537 MHz, 485.662 MHz, 485.687 MHz, 485.712 MHz, 485.737 MHz, 485.762 MHz, 485.787 MHz, Grant Date: 01/09/2015, Expiration Date: 04/02/2025, Registrant: County Of Los Angeles, 1110 N Eastern Ave, Los Angeles, CA 90063, Phone: (323) 267-3004, Fax: (323) 262-4607, Email:
12110 Carson (Lat: 33.831389 Lon: -118.071944), Call Sign: WPTS914, Assigned Frequencies: 468.837 MHz, 469.137 MHz, 469.462 MHz, 469.637 MHz, 469.662 MHz, 469.887 MHz, 457.512 MHz, 457.537 MHz, 457.562 MHz, 457.587 MHz, 457.612 MHz, Grant Date: 12/10/2001, Expiration Date: 12/10/2011, Cancellation Date: 02/11/2012, Certifier: Gildardo Garcia, Registrant: Hm Electronics, Inc., 6675 Mesa Ridge Rd, San Diego, CA 92121, Phone: (858) 535-6166, Fax: (858) 552-0139, Email:
Lat: 33.831722 Lon: -118.078750, Call Sign: WQCX573, Assigned Frequencies: 72.1000 MHz, Grant Date: 05/20/2015, Expiration Date: 06/17/2025, Certifier: Anthony Dipaolo, Registrant: Primex Wireless Inc, 965 Wells St., Lake Geneva, WI 53147, Phone: (800) 537-0464Lat: 33.832500 Lon: -118.078889, Call Sign: WQVS962, Assigned Frequencies: 468.512 MHz, 469.587 MHz, 466.837 MHz, 469.812 MHz, 469.612 MHz, 466.762 MHz, 468.687 MHz, Grant Date: 05/05/2015, Expiration Date: 05/05/2025, Certifier: Ron Sarabi, Registrant: Business Radio Licensing, 30251 Golden Lantern Ste E #501, Laguna Niguel, CA 92677, Phone: (949) 348-8510, Fax: (949) 348-8514, Email:
Lat: 33.832528 Lon: -118.079028, Call Sign: WQYA975, Assigned Frequencies: 72.2000 MHz, Grant Date: 08/03/2016, Expiration Date: 08/03/2026, Certifier: Gerard Lara, Registrant: Primex Wireless Inc, 965 Wells St., Lake Geneva, WI 53147, Phone: (800) 537-0464, Email:
FCC Registered Microwave Towers: 2
LAC313, 21205 Juan Avenue #e (Lat: 33.837056 Lon: -118.076111), Type: Pole, Structure height: 18.6 m, Overall height: 18.9 m, Call Sign: WQJK210, Assigned Frequencies: 17985.0 MHz, Grant Date: 10/07/2008, Expiration Date: 10/07/2018, Cancellation Date: 09/21/2016, Certifier: Don Houghton, Registrant: At&t Mobility LLC, 1120 20th Street, Nw - Suite 1000, Washington, DC 20036, Phone: (202) 457-2055, Fax: (202) 457-3073, Email:
American Advanced Ma, 21530 Pioneer Blvd (Lat: 33.833750 Lon: -118.079250), Type: Building, Structure height: 3.7 m, Call Sign: WRDA987, Assigned Frequencies: 19375.0 MHz, Grant Date: 03/16/2019, Expiration Date: 03/16/2029, Certifier: Ryan Hauf, Registrant: Micronet Communications, Inc., 812 Lexington Dr, Plano, TX 75075, Phone: (972) 422-7200, Email:
FCC Registered Amateur Radio Licenses: 18 (
See the full list of FCC Registered Amateur Radio Licenses in Hawaiian Gardens )
FAA Registered Aircraft: 1
Aircraft: CESSNA 150L (Category: Land, Seats: 2, Weight: Up to 12,499 Pounds, Speed: 90 mph), Engine: CONT MOTOR 0-200 SERIES (100 HP) (Reciprocating)N-Number: 1218Q, N1218Q, N-1218Q, Serial Number: 15072518, Year manufactured: 1971, Airworthiness Date: 04/08/1971, Certificate Issue Date: 12/18/2018Registrant (Individual): Sinath Aman Marasingha, 21827 Seine Ave, Hawaiian Gardens, CA 90716
Home Mortgage Disclosure Act Aggregated Statistics For Year 2009(Based on 2 full and 2 partial tracts) A) FHA, FSA/RHS & VA B) Conventional C) Refinancings D) Home Improvement Loans E) Loans on Dwellings For 5+ Families F) Non-occupant Loans on G) Loans On Manufactured Number Average Value Number Average Value Number Average Value Number Average Value Number Average Value Number Average Value Number Average Value
LOANS ORIGINATED 46 $224,403 37 $142,798 60 $213,770 3 $99,240 1 $261,640 23 $143,669 2 $35,000 APPLICATIONS APPROVED, NOT ACCEPTED 4 $216,970 9 $131,850 13 $232,422 1 $8,980 0 $0 8 $133,070 0 $0 APPLICATIONS DENIED 5 $224,218 11 $166,543 48 $245,084 6 $73,492 2 $1,720,000 10 $150,984 0 $0 APPLICATIONS WITHDRAWN 15 $221,210 6 $144,245 15 $259,895 3 $139,020 0 $0 4 $72,278 0 $0 FILES CLOSED FOR INCOMPLETENESS 1 $236,000 2 $225,510 10 $227,437 1 $25,000 0 $0 0 $0 0 $0
Aggregated Statistics For Year 2008(Based on 2 full and 2 partial tracts) A) FHA, FSA/RHS & VA B) Conventional C) Refinancings D) Home Improvement Loans E) Loans on Dwellings For 5+ Families F) Non-occupant Loans on G) Loans On Manufactured Number Average Value Number Average Value Number Average Value Number Average Value Number Average Value Number Average Value Number Average Value
LOANS ORIGINATED 31 $240,091 56 $193,136 75 $235,458 6 $123,772 3 $1,127,827 25 $210,727 0 $0 APPLICATIONS APPROVED, NOT ACCEPTED 2 $216,570 13 $264,425 35 $272,918 2 $210,000 0 $0 8 $231,699 0 $0 APPLICATIONS DENIED 7 $284,504 22 $228,845 83 $291,212 10 $142,918 1 $875,000 17 $230,241 1 $49,280 APPLICATIONS WITHDRAWN 4 $198,515 15 $191,129 23 $264,565 3 $90,060 0 $0 3 $308,670 0 $0 FILES CLOSED FOR INCOMPLETENESS 0 $0 7 $273,431 12 $273,991 0 $0 0 $0 3 $208,070 0 $0
Aggregated Statistics For Year 2007(Based on 2 full and 2 partial tracts) B) Conventional C) Refinancings D) Home Improvement Loans E) Loans on Dwellings For 5+ Families F) Non-occupant Loans on G) Loans On Manufactured Number Average Value Number Average Value Number Average Value Number Average Value Number Average Value Number Average Value
LOANS ORIGINATED 80 $277,181 266 $277,199 34 $208,143 4 $1,250,950 42 $274,033 1 $35,000 APPLICATIONS APPROVED, NOT ACCEPTED 36 $258,187 90 $290,522 12 $198,802 1 $1,605,190 12 $264,961 0 $0 APPLICATIONS DENIED 59 $270,720 246 $329,091 31 $140,703 0 $0 26 $327,782 3 $50,680 APPLICATIONS WITHDRAWN 27 $252,134 83 $303,628 12 $202,022 2 $292,500 9 $333,494 0 $0 FILES CLOSED FOR INCOMPLETENESS 13 $241,923 39 $307,806 2 $186,420 0 $0 5 $268,414 0 $0
Aggregated Statistics For Year 2006(Based on 2 full and 2 partial tracts) B) Conventional C) Refinancings D) Home Improvement Loans E) Loans on Dwellings For 5+ Families F) Non-occupant Loans on G) Loans On Manufactured Number Average Value Number Average Value Number Average Value Number Average Value Number Average Value Number Average Value
LOANS ORIGINATED 250 $240,061 385 $278,765 57 $220,788 4 $2,233,902 66 $248,190 2 $45,500 APPLICATIONS APPROVED, NOT ACCEPTED 53 $236,127 77 $258,846 6 $288,143 0 $0 14 $243,929 1 $35,000 APPLICATIONS DENIED 133 $238,340 194 $290,834 36 $188,224 1 $1,672,230 36 $307,384 2 $82,920 APPLICATIONS WITHDRAWN 67 $237,604 127 $281,753 10 $236,108 0 $0 19 $284,511 0 $0 FILES CLOSED FOR INCOMPLETENESS 11 $214,962 42 $301,926 3 $279,727 0 $0 5 $264,884 0 $0
Aggregated Statistics For Year 2005(Based on 2 full and 2 partial tracts) A) FHA, FSA/RHS & VA B) Conventional C) Refinancings D) Home Improvement Loans E) Loans on Dwellings For 5+ Families F) Non-occupant Loans on G) Loans On Manufactured Number Average Value Number Average Value Number Average Value Number Average Value Number Average Value Number Average Value Number Average Value
LOANS ORIGINATED 5 $257,228 328 $209,702 450 $240,487 40 $226,757 5 $671,436 72 $236,786 1 $30,000 APPLICATIONS APPROVED, NOT ACCEPTED 0 $0 99 $202,591 88 $212,696 8 $231,479 0 $0 21 $225,911 1 $199,000 APPLICATIONS DENIED 0 $0 119 $205,764 210 $263,720 24 $141,857 0 $0 34 $288,252 5 $54,088 APPLICATIONS WITHDRAWN 0 $0 74 $225,574 168 $251,562 15 $174,146 1 $1,274,970 23 $280,748 0 $0 FILES CLOSED FOR INCOMPLETENESS 0 $0 22 $205,152 53 $262,776 3 $77,123 0 $0 5 $322,278 0 $0
Aggregated Statistics For Year 2004(Based on 2 full and 2 partial tracts) A) FHA, FSA/RHS & VA B) Conventional C) Refinancings D) Home Improvement Loans E) Loans on Dwellings For 5+ Families F) Non-occupant Loans on G) Loans On Manufactured Number Average Value Number Average Value Number Average Value Number Average Value Number Average Value Number Average Value Number Average Value
LOANS ORIGINATED 22 $227,753 314 $165,784 498 $188,499 47 $156,955 8 $1,495,144 80 $188,013 4 $44,452 APPLICATIONS APPROVED, NOT ACCEPTED 0 $0 53 $195,602 80 $187,765 7 $117,414 0 $0 21 $215,526 0 $0 APPLICATIONS DENIED 1 $258,430 87 $195,494 196 $190,568 26 $107,740 0 $0 31 $196,287 2 $40,000 APPLICATIONS WITHDRAWN 3 $239,630 62 $181,503 115 $180,727 8 $101,252 1 $306,910 10 $178,441 2 $93,945 FILES CLOSED FOR INCOMPLETENESS 0 $0 19 $200,158 68 $197,503 3 $114,173 0 $0 6 $227,307 0 $0
Aggregated Statistics For Year 2003(Based on 2 full and 2 partial tracts) A) FHA, FSA/RHS & VA B) Conventional C) Refinancings D) Home Improvement Loans E) Loans on Dwellings For 5+ Families F) Non-occupant Loans on Number Average Value Number Average Value Number Average Value Number Average Value Number Average Value Number Average Value
LOANS ORIGINATED 33 $180,369 200 $139,972 594 $148,030 12 $54,672 4 $936,822 63 $126,893 APPLICATIONS APPROVED, NOT ACCEPTED 1 $254,830 43 $153,107 93 $163,840 8 $91,075 0 $0 15 $146,594 APPLICATIONS DENIED 7 $198,561 42 $143,215 216 $149,204 8 $30,269 1 $537,400 16 $140,142 APPLICATIONS WITHDRAWN 4 $197,838 28 $152,938 159 $145,135 9 $69,094 0 $0 11 $111,695 FILES CLOSED FOR INCOMPLETENESS 1 $372,280 8 $129,607 25 $149,734 1 $18,970 0 $0 1 $242,130
Aggregated Statistics For Year 2002(Based on 2 full and 1 partial tracts) A) FHA, FSA/RHS & VA B) Conventional C) Refinancings D) Home Improvement Loans E) Loans on Dwellings For 5+ Families F) Non-occupant Loans on Number Average Value Number Average Value Number Average Value Number Average Value Number Average Value Number Average Value
LOANS ORIGINATED 55 $138,663 169 $116,517 220 $128,469 7 $15,300 5 $927,966 38 $111,537 APPLICATIONS APPROVED, NOT ACCEPTED 4 $154,305 22 $148,550 51 $130,440 2 $41,320 0 $0 6 $135,570 APPLICATIONS DENIED 12 $161,295 35 $141,614 85 $141,581 8 $16,580 0 $0 12 $132,420 APPLICATIONS WITHDRAWN 10 $162,686 23 $128,330 70 $141,950 2 $17,860 0 $0 6 $130,787 FILES CLOSED FOR INCOMPLETENESS 3 $118,333 11 $120,039 49 $138,009 0 $0 0 $0 2 $114,310
Aggregated Statistics For Year 2001(Based on 2 full and 1 partial tracts) A) FHA, FSA/RHS & VA B) Conventional C) Refinancings D) Home Improvement Loans E) Loans on Dwellings For 5+ Families F) Non-occupant Loans on Number Average Value Number Average Value Number Average Value Number Average Value Number Average Value Number Average Value
LOANS ORIGINATED 66 $148,202 81 $93,188 180 $121,075 6 $13,807 5 $606,776 33 $108,740 APPLICATIONS APPROVED, NOT ACCEPTED 3 $131,057 8 $107,395 36 $127,405 1 $141,000 0 $0 6 $128,838 APPLICATIONS DENIED 17 $120,129 30 $122,839 91 $113,192 15 $25,459 0 $0 8 $107,142 APPLICATIONS WITHDRAWN 15 $130,144 16 $107,829 53 $126,577 5 $31,970 0 $0 5 $88,486 FILES CLOSED FOR INCOMPLETENESS 3 $148,173 2 $170,695 17 $120,641 0 $0 0 $0 3 $100,333
Aggregated Statistics For Year 2000(Based on 2 full and 1 partial tracts) A) FHA, FSA/RHS & VA B) Conventional C) Refinancings D) Home Improvement Loans E) Loans on Dwellings For 5+ Families F) Non-occupant Loans on Number Average Value Number Average Value Number Average Value Number Average Value Number Average Value Number Average Value
LOANS ORIGINATED 69 $134,014 63 $84,423 46 $135,271 10 $27,368 3 $326,007 17 $72,722 APPLICATIONS APPROVED, NOT ACCEPTED 3 $183,973 6 $100,237 16 $127,065 1 $36,080 0 $0 4 $88,905 APPLICATIONS DENIED 10 $141,184 38 $73,196 52 $71,461 18 $14,072 0 $0 6 $69,107 APPLICATIONS WITHDRAWN 7 $126,196 7 $86,483 34 $86,817 1 $57,340 0 $0 1 $111,240 FILES CLOSED FOR INCOMPLETENESS 2 $155,000 0 $0 24 $125,142 3 $24,667 0 $0 3 $114,250
Aggregated Statistics For Year 1999(Based on 1 full and 3 partial tracts) A) FHA, FSA/RHS & VA B) Conventional C) Refinancings D) Home Improvement Loans E) Loans on Dwellings For 5+ Families F) Non-occupant Loans on Number Average Value Number Average Value Number Average Value Number Average Value Number Average Value Number Average Value
LOANS ORIGINATED 88 $116,950 58 $84,582 91 $112,196 21 $10,617 3 $357,750 22 $85,749 APPLICATIONS APPROVED, NOT ACCEPTED 5 $73,242 6 $97,990 23 $98,555 6 $27,132 1 $103,340 2 $114,310 APPLICATIONS DENIED 14 $129,619 14 $98,976 62 $95,051 20 $18,142 1 $81,690 5 $86,914 APPLICATIONS WITHDRAWN 11 $122,409 12 $117,472 29 $98,094 3 $34,960 1 $122,540 3 $127,287 FILES CLOSED FOR INCOMPLETENESS 2 $128,905 3 $96,523 23 $92,455 1 $8,850 1 $4,501,200 6 $98,293
Detailed HMDA statistics for the following Tracts:
5551.02
, 5551.04 , 5552.11 , 5552.12
Private Mortgage Insurance Companies Aggregated Statistics For Year 2009(Based on 2 full and 2 partial tracts) A) Conventional Number Average Value
LOANS ORIGINATED 1 $189,000 APPLICATIONS APPROVED, NOT ACCEPTED 3 $202,333 APPLICATIONS DENIED 2 $191,480 APPLICATIONS WITHDRAWN 0 $0 FILES CLOSED FOR INCOMPLETENESS 1 $162,000
Aggregated Statistics For Year 2008(Based on 2 full and 2 partial tracts) A) Conventional B) Refinancings C) Non-occupant Loans on Number Average Value Number Average Value Number Average Value
LOANS ORIGINATED 21 $304,642 3 $363,113 0 $0 APPLICATIONS APPROVED, NOT ACCEPTED 16 $295,867 11 $359,748 2 $351,000 APPLICATIONS DENIED 2 $281,175 4 $363,750 0 $0 APPLICATIONS WITHDRAWN 1 $257,520 0 $0 0 $0 FILES CLOSED FOR INCOMPLETENESS 0 $0 0 $0 0 $0
Aggregated Statistics For Year 2007(Based on 2 full and 2 partial tracts) A) Conventional B) Refinancings Number Average Value Number Average Value
LOANS ORIGINATED 9 $335,784 10 $341,168 APPLICATIONS APPROVED, NOT ACCEPTED 1 $382,650 11 $357,939 APPLICATIONS DENIED 0 $0 0 $0 APPLICATIONS WITHDRAWN 0 $0 1 $179,000 FILES CLOSED FOR INCOMPLETENESS 0 $0 0 $0
Aggregated Statistics For Year 2006(Based on 2 full and 2 partial tracts) A) Conventional B) Refinancings Number Average Value Number Average Value
LOANS ORIGINATED 4 $358,148 12 $338,587 APPLICATIONS APPROVED, NOT ACCEPTED 0 $0 0 $0 APPLICATIONS DENIED 0 $0 1 $261,000 APPLICATIONS WITHDRAWN 1 $288,630 0 $0 FILES CLOSED FOR INCOMPLETENESS 0 $0 0 $0
Aggregated Statistics For Year 2005(Based on 2 full and 2 partial tracts) A) Conventional B) Refinancings C) Non-occupant Loans on Number Average Value Number Average Value Number Average Value
LOANS ORIGINATED 9 $317,566 6 $295,588 0 $0 APPLICATIONS APPROVED, NOT ACCEPTED 1 $164,870 1 $313,000 0 $0 APPLICATIONS DENIED 1 $461,330 0 $0 0 $0 APPLICATIONS WITHDRAWN 2 $372,875 1 $313,000 2 $372,875 FILES CLOSED FOR INCOMPLETENESS 0 $0 0 $0 0 $0
Aggregated Statistics For Year 2004(Based on 2 full and 2 partial tracts) A) Conventional B) Refinancings C) Non-occupant Loans on Number Average Value Number Average Value Number Average Value
LOANS ORIGINATED 13 $264,505 5 $210,404 0 $0 APPLICATIONS APPROVED, NOT ACCEPTED 0 $0 7 $178,023 1 $276,000 APPLICATIONS DENIED 2 $142,655 0 $0 0 $0 APPLICATIONS WITHDRAWN 0 $0 0 $0 0 $0 FILES CLOSED FOR INCOMPLETENESS 0 $0 2 $215,500 1 $200,000
Aggregated Statistics For Year 2003(Based on 2 full and 2 partial tracts) A) Conventional B) Refinancings C) Non-occupant Loans on Number Average Value Number Average Value Number Average Value
LOANS ORIGINATED 40 $185,176 25 $183,292 2 $225,990 APPLICATIONS APPROVED, NOT ACCEPTED 12 $187,091 5 $208,292 1 $109,220 APPLICATIONS DENIED 0 $0 0 $0 0 $0 APPLICATIONS WITHDRAWN 3 $189,013 1 $276,180 0 $0 FILES CLOSED FOR INCOMPLETENESS 0 $0 0 $0 0 $0
Aggregated Statistics For Year 2002(Based on 2 full and 1 partial tracts) A) Conventional B) Refinancings C) Non-occupant Loans on Number Average Value Number Average Value Number Average Value
LOANS ORIGINATED 41 $154,356 8 $129,352 1 $106,000 APPLICATIONS APPROVED, NOT ACCEPTED 8 $147,232 6 $156,637 1 $148,620 APPLICATIONS DENIED 1 $128,000 1 $165,000 1 $165,000 APPLICATIONS WITHDRAWN 3 $121,813 0 $0 1 $99,670 FILES CLOSED FOR INCOMPLETENESS 0 $0 0 $0 0 $0
Aggregated Statistics For Year 2001(Based on 2 full and 1 partial tracts) A) Conventional B) Refinancings C) Non-occupant Loans on Number Average Value Number Average Value Number Average Value
LOANS ORIGINATED 27 $129,269 14 $131,651 2 $99,850 APPLICATIONS APPROVED, NOT ACCEPTED 5 $164,678 2 $111,000 0 $0 APPLICATIONS DENIED 0 $0 0 $0 0 $0 APPLICATIONS WITHDRAWN 1 $104,660 1 $144,000 0 $0 FILES CLOSED FOR INCOMPLETENESS 0 $0 0 $0 0 $0
Aggregated Statistics For Year 2000(Based on 2 full and 1 partial tracts) A) Conventional B) Refinancings C) Non-occupant Loans on Number Average Value Number Average Value Number Average Value
LOANS ORIGINATED 28 $112,769 8 $138,751 4 $78,250 APPLICATIONS APPROVED, NOT ACCEPTED 5 $92,978 2 $91,535 1 $68,000 APPLICATIONS DENIED 3 $85,333 0 $0 1 $41,000 APPLICATIONS WITHDRAWN 0 $0 0 $0 0 $0 FILES CLOSED FOR INCOMPLETENESS 0 $0 0 $0 0 $0
Aggregated Statistics For Year 1999(Based on 1 full and 3 partial tracts) A) Conventional B) Refinancings C) Non-occupant Loans on Number Average Value Number Average Value Number Average Value
LOANS ORIGINATED 21 $115,266 14 $133,504 0 $0 APPLICATIONS APPROVED, NOT ACCEPTED 1 $144,920 5 $110,750 1 $66,930 APPLICATIONS DENIED 1 $109,370 0 $0 0 $0 APPLICATIONS WITHDRAWN 1 $110,310 0 $0 0 $0 FILES CLOSED FOR INCOMPLETENESS 1 $93,700 0 $0 0 $0
Detailed PMIC statistics for the following Tracts:
5551.02
, 5551.04 , 5552.11 , 5552.12
Most common first names in Hawaiian Gardens, CA among deceased individuals Name Count Lived (average)
John 37 70.9 years Robert 22 72.1 years Mary 21 71.9 years William 18 69.3 years James 17 70.5 years Charles 17 68.7 years Jose 15 66.7 years Maria 14 77.1 years Jesus 13 76.0 years Joseph 12 76.3 years
Most common last names in Hawaiian Gardens, CA among deceased individuals Last name Count Lived (average)
Rodriguez 14 59.4 years Kim 13 67.9 years Martinez 12 70.6 years Garcia 11 57.5 years Johnson 11 76.3 years Lee 11 76.9 years Smith 11 69.5 years Castillo 10 74.1 years Miller 10 70.7 years Wilson 9 72.3 years
Hawaiian Gardens compared to California state average:
Unemployed percentage below state average. Black race population percentage below state average. Hispanic race population percentage above state average. Length of stay since moving in above state average. Hawaiian Gardens on our top lists :
#52 on the list of "Top 101 cities with the least people having Master's or Doctorate degrees (population 5,000+)"
#70 on the list of "Top 101 cities with the most residents born in Korea (population 500+)"
#96 on the list of "Top 101 cities with the most residents born in Other Central America (population 500+)"
#87 (90716) on the list of "Top 101 zip codes with the largest percentage of taxpayers using paid preparers for 2012 taxes (pop 5,000+)"
#1 on the list of "Top 101 counties with the most Evangelical Protestant congregations"
#1 on the list of "Top 101 counties with the most Mainline Protestant congregations"
#1 on the list of "Top 101 counties with the most Orthodox adherents"
#1 on the list of "Top 101 counties with the highest ground withdrawal of fresh water for public supply (pop. 50,000+)"
#1 on the list of "Top 101 counties with the most Catholic adherents (pop. 50,000+)"
Top Patent Applicants
Dong Hwan Sul (3)
Ji Yong Kim (1)
Kimiyo Nishio (1)
Man Duck Kim (1)
Total of 5 patent applications in 2008-2024.
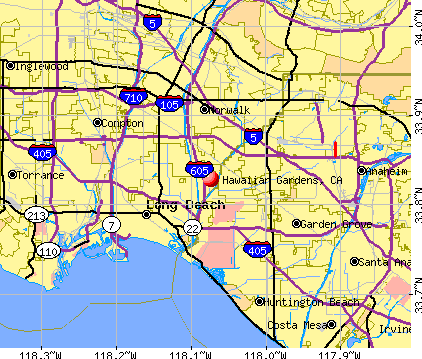


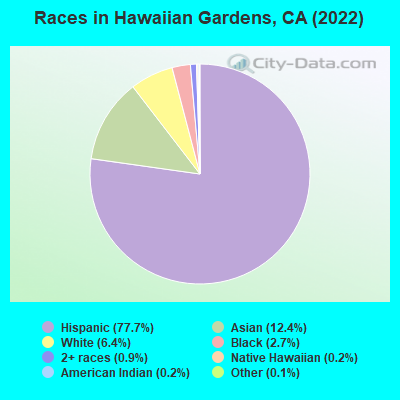
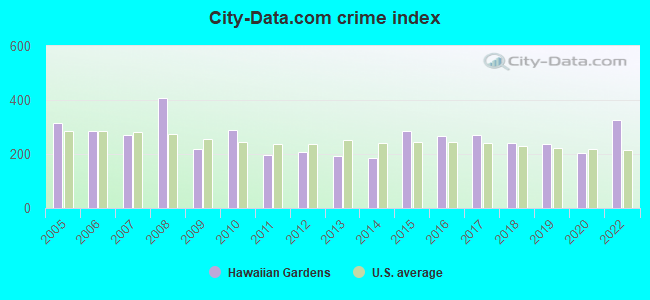
 Recent articles from our blog. Our writers, many of them Ph.D. graduates or candidates, create easy-to-read articles on a wide variety of topics.


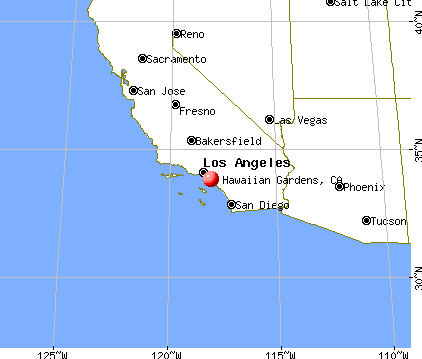
 (2.8 miles
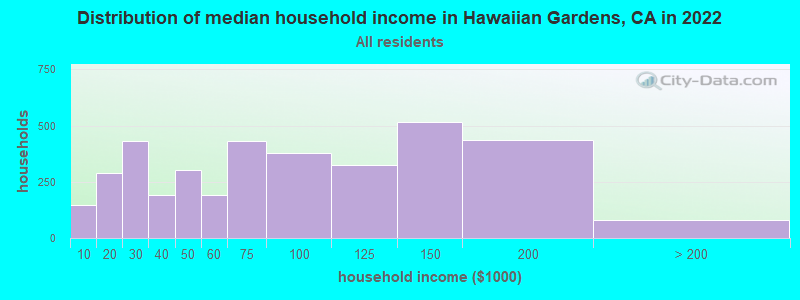
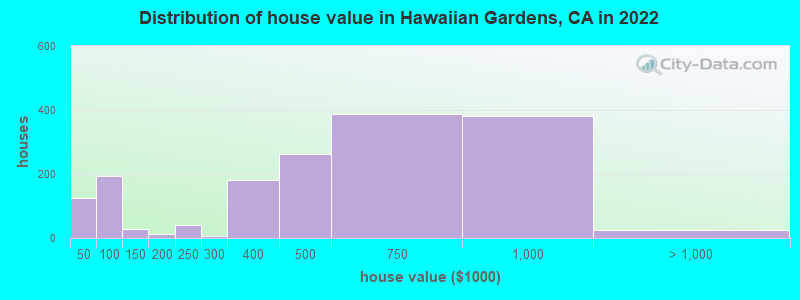

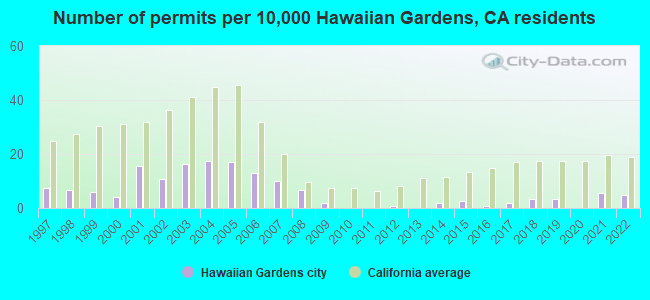
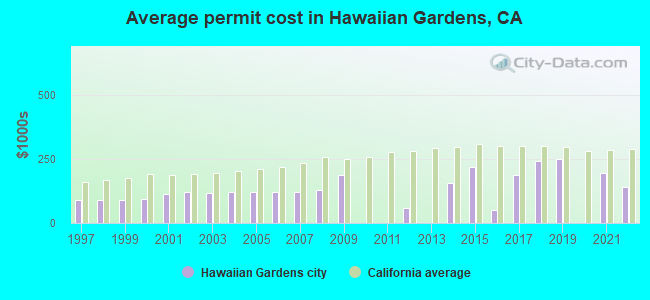
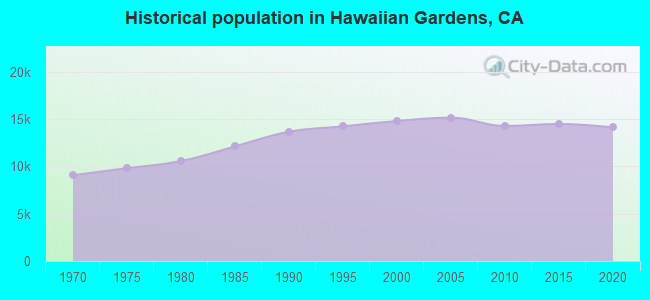
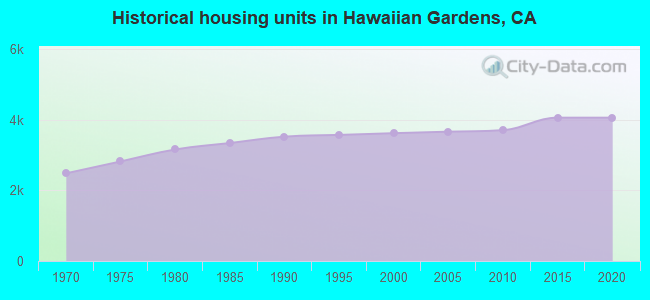
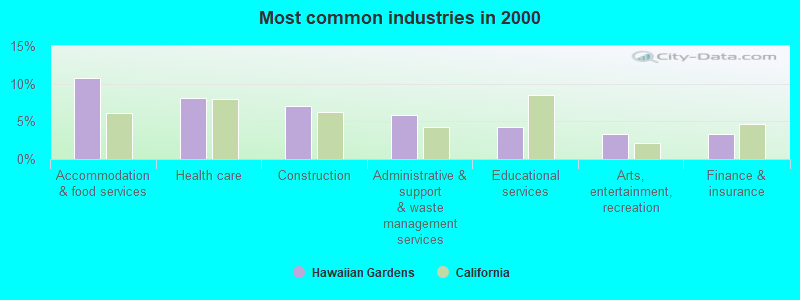
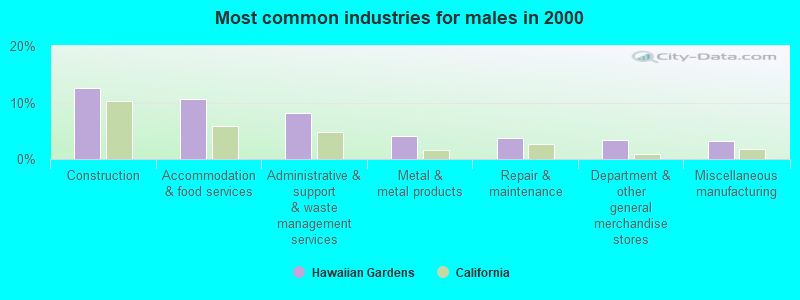
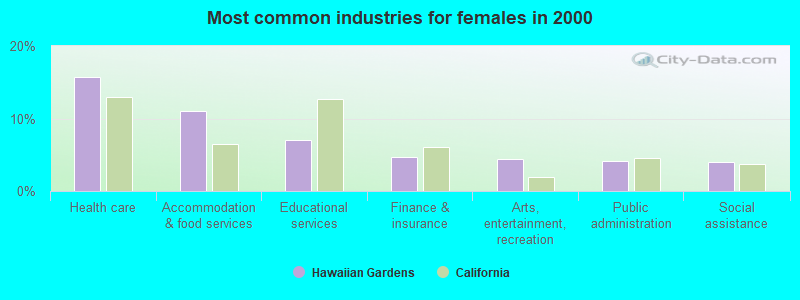
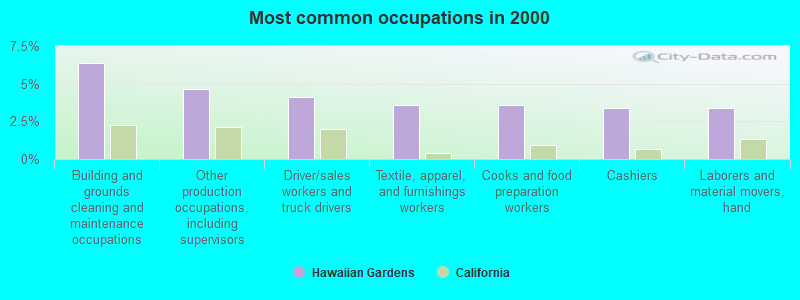
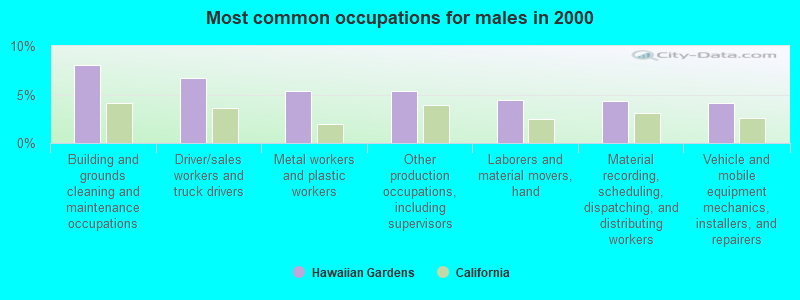
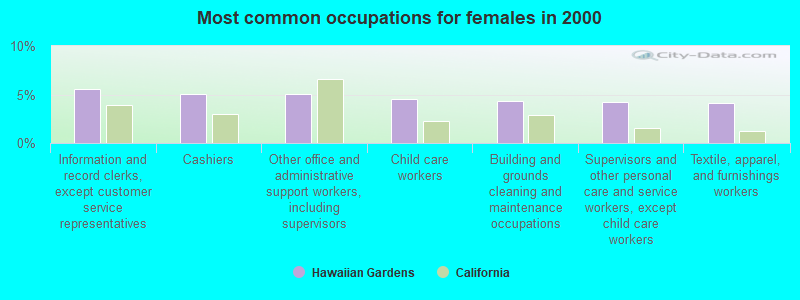
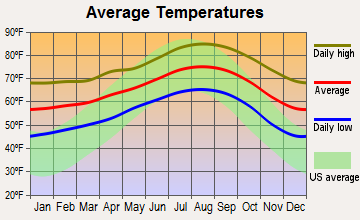
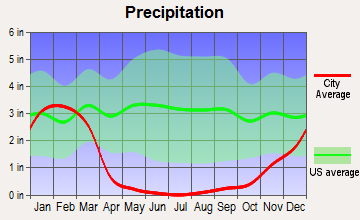
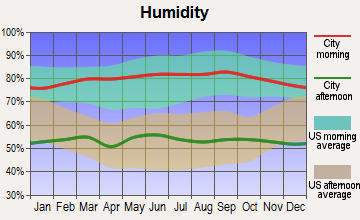
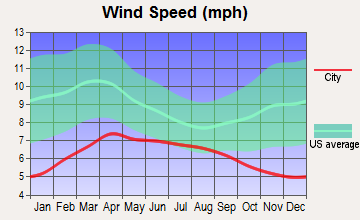
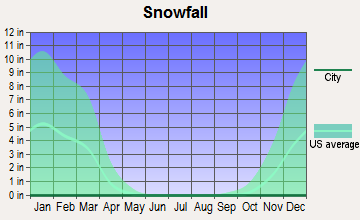
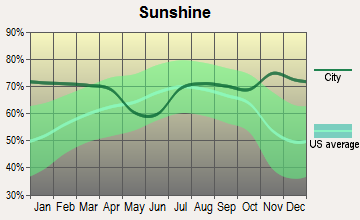
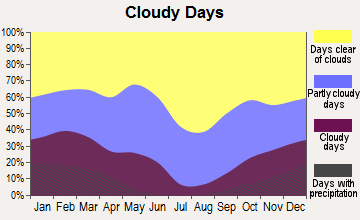
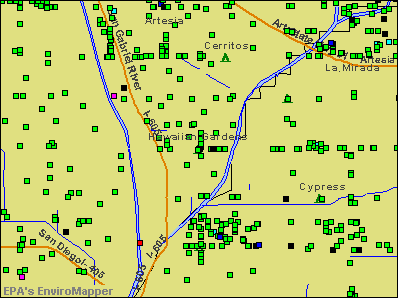

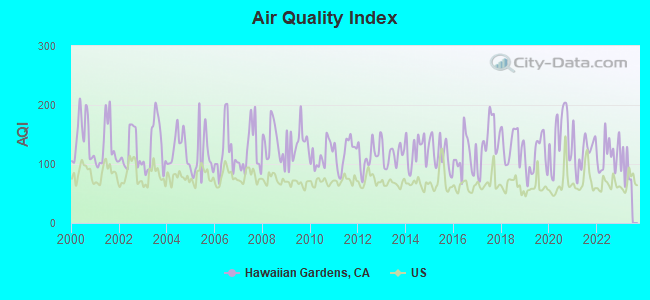
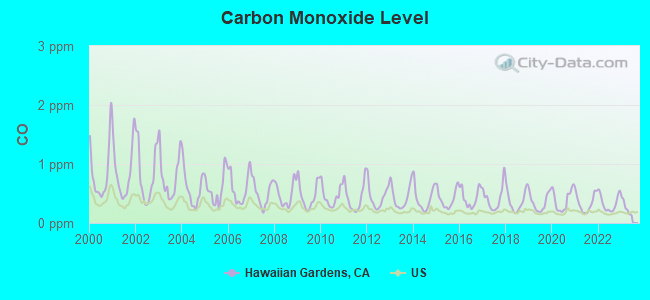
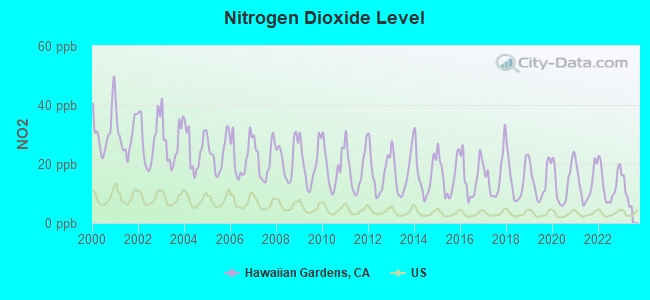
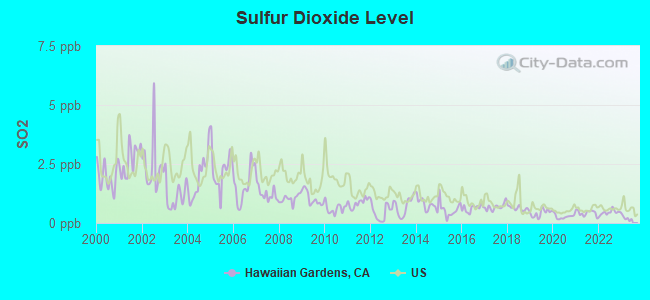
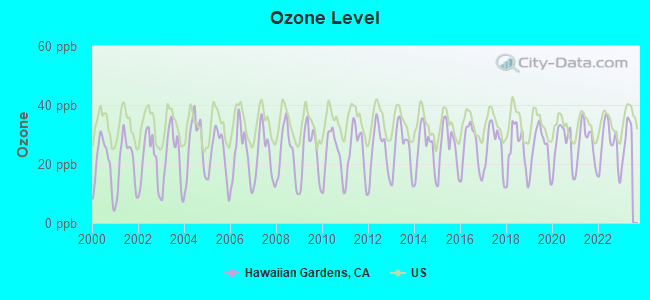
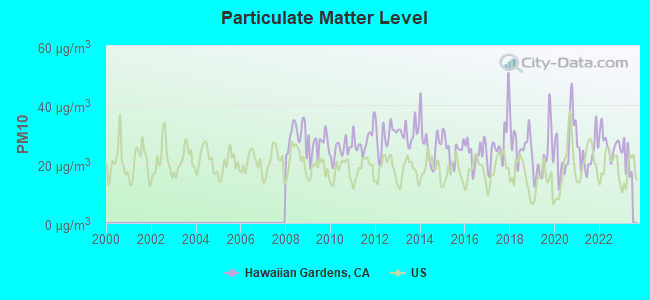
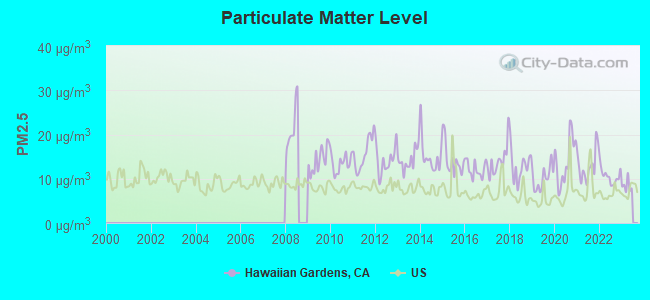
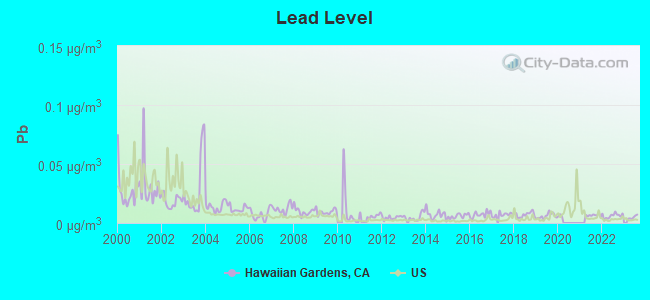
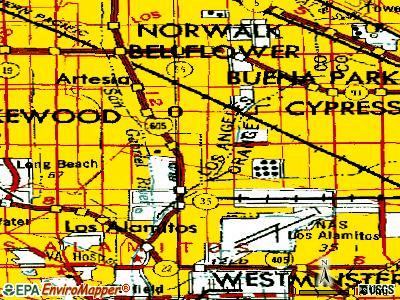
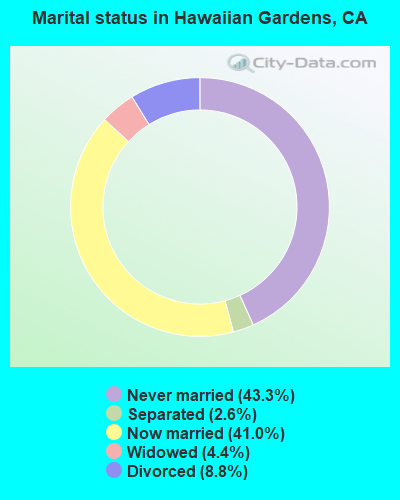
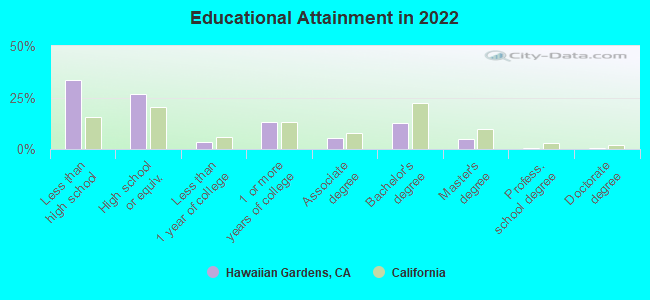
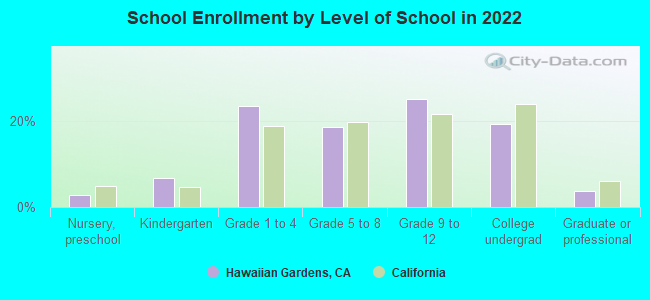
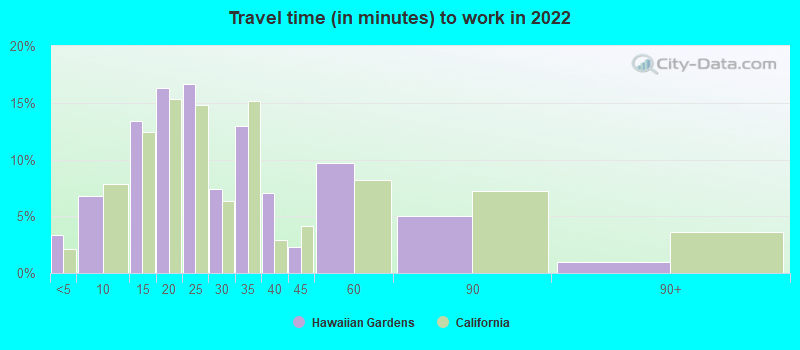
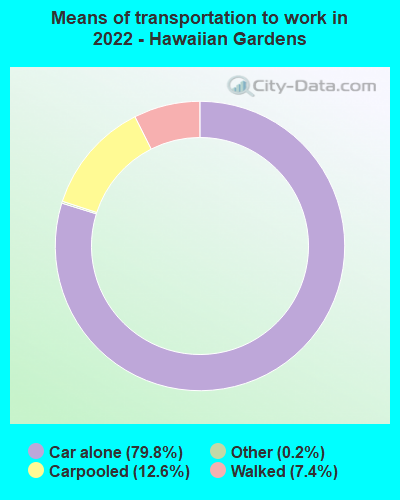


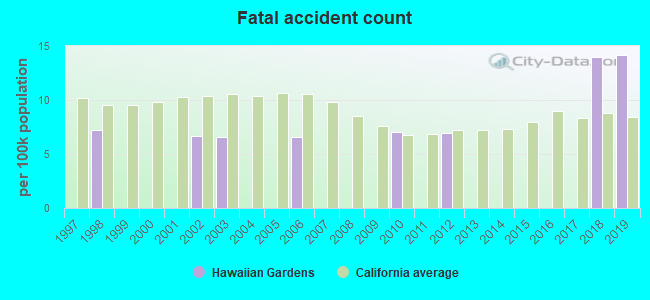
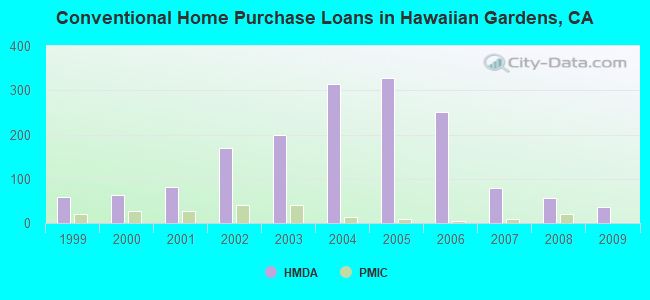
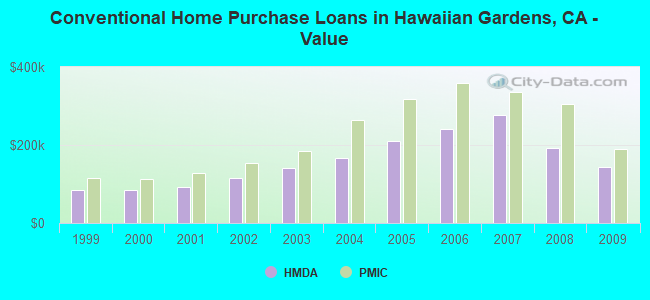
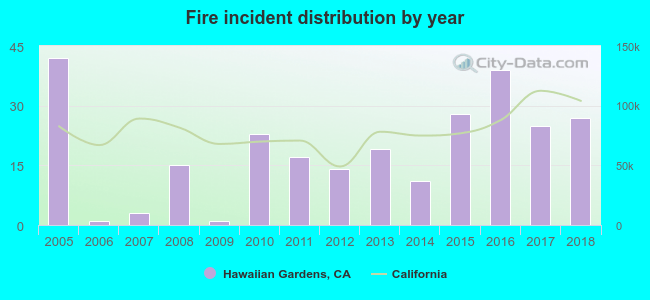 According to the data from the years 2005 - 2018 the average number of fires per year is 19. The highest number of fires - 42 took place in 2005, and the least - 1 in 2006. The data has a declining trend.
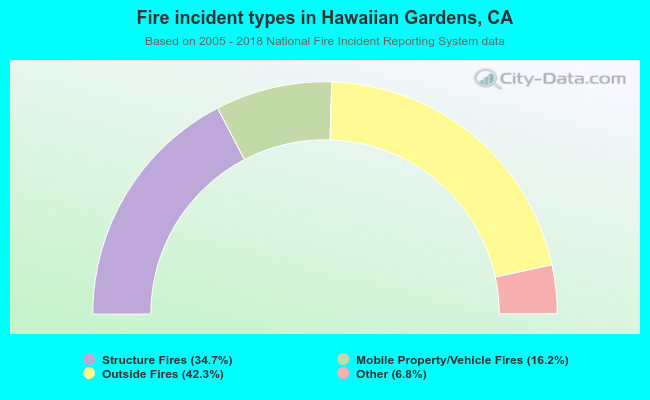 When looking into fire subcategories, the most reports belonged to: Outside Fires (42.3%), and Structure Fires (34.7%).