Nipomo, California Submit your own pictures of this place and show them to the world
OSM Map
General Map
Google Map
MSN Map
OSM Map
General Map
Google Map
MSN Map
OSM Map
General Map
Google Map
MSN Map
OSM Map
General Map
Google Map
MSN Map
Please wait while loading the map...
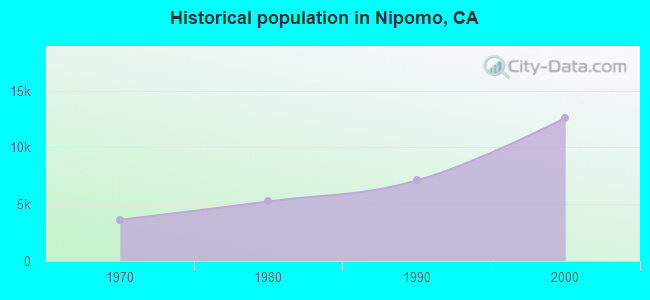
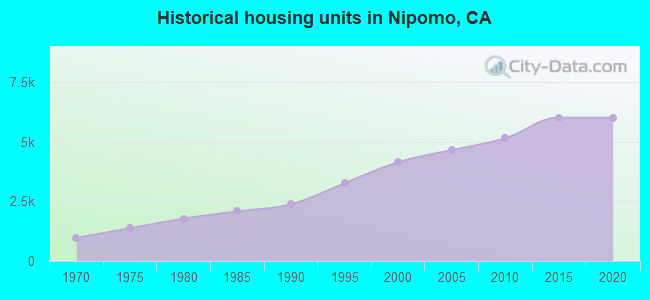
Population in 2010: 16,714. Population change since 2000: +32.4%Males: 8,289 Females: 8,425
March 2022 cost of living index in Nipomo: 107.1 (more than average, U.S. average is 100) Percentage of residents living in poverty in 2022: 7.4%for White Non-Hispanic residents , 29.0% for Black residents , 8.7% for Hispanic or Latino residents , 12.4% for American Indian residents , 14.9% for other race residents , 4.7% for two or more races residents )
Profiles of local businesses
Business Search - 14 Million verified businesses
Data:
Median household income ($)
Median household income (% change since 2000)
Household income diversity
Ratio of average income to average house value (%)
Ratio of average income to average rent
Median household income ($) - White
Median household income ($) - Black or African American
Median household income ($) - Asian
Median household income ($) - Hispanic or Latino
Median household income ($) - American Indian and Alaska Native
Median household income ($) - Multirace
Median household income ($) - Other Race
Median household income for houses/condos with a mortgage ($)
Median household income for apartments without a mortgage ($)
Races - White alone (%)
Races - White alone (% change since 2000)
Races - Black alone (%)
Races - Black alone (% change since 2000)
Races - American Indian alone (%)
Races - American Indian alone (% change since 2000)
Races - Asian alone (%)
Races - Asian alone (% change since 2000)
Races - Hispanic (%)
Races - Hispanic (% change since 2000)
Races - Native Hawaiian and Other Pacific Islander alone (%)
Races - Native Hawaiian and Other Pacific Islander alone (% change since 2000)
Races - Two or more races (%)
Races - Two or more races (% change since 2000)
Races - Other race alone (%)
Races - Other race alone (% change since 2000)
Racial diversity
Unemployment (%)
Unemployment (% change since 2000)
Unemployment (%) - White
Unemployment (%) - Black or African American
Unemployment (%) - Asian
Unemployment (%) - Hispanic or Latino
Unemployment (%) - American Indian and Alaska Native
Unemployment (%) - Multirace
Unemployment (%) - Other Race
Population density (people per square mile)
Population - Males (%)
Population - Females (%)
Population - Males (%) - White
Population - Males (%) - Black or African American
Population - Males (%) - Asian
Population - Males (%) - Hispanic or Latino
Population - Males (%) - American Indian and Alaska Native
Population - Males (%) - Multirace
Population - Males (%) - Other Race
Population - Females (%) - White
Population - Females (%) - Black or African American
Population - Females (%) - Asian
Population - Females (%) - Hispanic or Latino
Population - Females (%) - American Indian and Alaska Native
Population - Females (%) - Multirace
Population - Females (%) - Other Race
Coronavirus confirmed cases (Apr 26, 2024)
Deaths caused by coronavirus (Apr 26, 2024)
Coronavirus confirmed cases (per 100k population) (Apr 26, 2024)
Deaths caused by coronavirus (per 100k population) (Apr 26, 2024)
Daily increase in number of cases (Apr 26, 2024)
Weekly increase in number of cases (Apr 26, 2024)
Cases doubled (in days) (Apr 26, 2024)
Hospitalized patients (Apr 18, 2022)
Negative test results (Apr 18, 2022)
Total test results (Apr 18, 2022)
COVID Vaccine doses distributed (per 100k population) (Sep 19, 2023)
COVID Vaccine doses administered (per 100k population) (Sep 19, 2023)
COVID Vaccine doses distributed (Sep 19, 2023)
COVID Vaccine doses administered (Sep 19, 2023)
Likely homosexual households (%)
Likely homosexual households (% change since 2000)
Likely homosexual households - Lesbian couples (%)
Likely homosexual households - Lesbian couples (% change since 2000)
Likely homosexual households - Gay men (%)
Likely homosexual households - Gay men (% change since 2000)
Cost of living index
Median gross rent ($)
Median contract rent ($)
Median monthly housing costs ($)
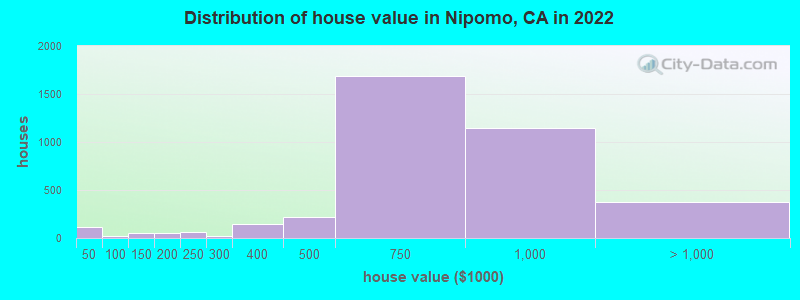
Median house or condo value ($)
Median house or condo value ($ change since 2000)
Mean house or condo value by units in structure - 1, detached ($)
Mean house or condo value by units in structure - 1, attached ($)
Mean house or condo value by units in structure - 2 ($)
Mean house or condo value by units in structure by units in structure - 3 or 4 ($)
Mean house or condo value by units in structure - 5 or more ($)
Mean house or condo value by units in structure - Boat, RV, van, etc. ($)
Mean house or condo value by units in structure - Mobile home ($)
Median house or condo value ($) - White
Median house or condo value ($) - Black or African American
Median house or condo value ($) - Asian
Median house or condo value ($) - Hispanic or Latino
Median house or condo value ($) - American Indian and Alaska Native
Median house or condo value ($) - Multirace
Median house or condo value ($) - Other Race
Median resident age
Resident age diversity
Median resident age - Males
Median resident age - Females
Median resident age - White
Median resident age - Black or African American
Median resident age - Asian
Median resident age - Hispanic or Latino
Median resident age - American Indian and Alaska Native
Median resident age - Multirace
Median resident age - Other Race
Median resident age - Males - White
Median resident age - Males - Black or African American
Median resident age - Males - Asian
Median resident age - Males - Hispanic or Latino
Median resident age - Males - American Indian and Alaska Native
Median resident age - Males - Multirace
Median resident age - Males - Other Race
Median resident age - Females - White
Median resident age - Females - Black or African American
Median resident age - Females - Asian
Median resident age - Females - Hispanic or Latino
Median resident age - Females - American Indian and Alaska Native
Median resident age - Females - Multirace
Median resident age - Females - Other Race
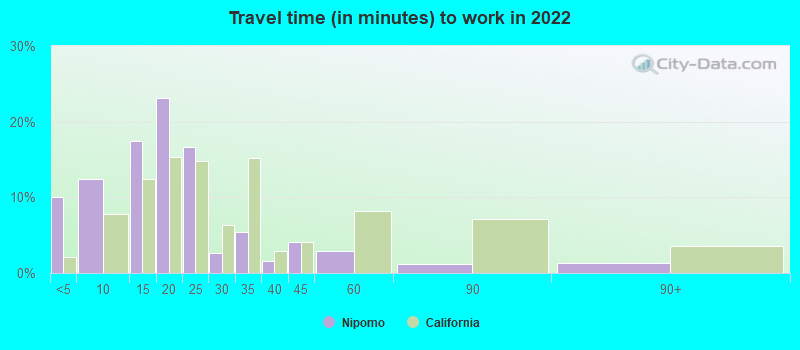
Commute - mean travel time to work (minutes)
Travel time to work - Less than 5 minutes (%)
Travel time to work - Less than 5 minutes (% change since 2000)
Travel time to work - 5 to 9 minutes (%)
Travel time to work - 5 to 9 minutes (% change since 2000)
Travel time to work - 10 to 19 minutes (%)
Travel time to work - 10 to 19 minutes (% change since 2000)
Travel time to work - 20 to 29 minutes (%)
Travel time to work - 20 to 29 minutes (% change since 2000)
Travel time to work - 30 to 39 minutes (%)
Travel time to work - 30 to 39 minutes (% change since 2000)
Travel time to work - 40 to 59 minutes (%)
Travel time to work - 40 to 59 minutes (% change since 2000)
Travel time to work - 60 to 89 minutes (%)
Travel time to work - 60 to 89 minutes (% change since 2000)
Travel time to work - 90 or more minutes (%)
Travel time to work - 90 or more minutes (% change since 2000)
Marital status - Never married (%)
Marital status - Now married (%)
Marital status - Separated (%)
Marital status - Widowed (%)
Marital status - Divorced (%)
Median family income ($)
Median family income (% change since 2000)
Median non-family income ($)
Median non-family income (% change since 2000)
Median per capita income ($)
Median per capita income (% change since 2000)
Median family income ($) - White
Median family income ($) - Black or African American
Median family income ($) - Asian
Median family income ($) - Hispanic or Latino
Median family income ($) - American Indian and Alaska Native
Median family income ($) - Multirace
Median family income ($) - Other Race
Median year house/condo built
Median year apartment built
Year house built - Built 2005 or later (%)
Year house built - Built 2000 to 2004 (%)
Year house built - Built 1990 to 1999 (%)
Year house built - Built 1980 to 1989 (%)
Year house built - Built 1970 to 1979 (%)
Year house built - Built 1960 to 1969 (%)
Year house built - Built 1950 to 1959 (%)
Year house built - Built 1940 to 1949 (%)
Year house built - Built 1939 or earlier (%)
Average household size
Household density (households per square mile)
Average household size - White
Average household size - Black or African American
Average household size - Asian
Average household size - Hispanic or Latino
Average household size - American Indian and Alaska Native
Average household size - Multirace
Average household size - Other Race
Occupied housing units (%)
Vacant housing units (%)
Owner occupied housing units (%)
Renter occupied housing units (%)
Vacancy status - For rent (%)
Vacancy status - For sale only (%)
Vacancy status - Rented or sold, not occupied (%)
Vacancy status - For seasonal, recreational, or occasional use (%)
Vacancy status - For migrant workers (%)
Vacancy status - Other vacant (%)
Residents with income below the poverty level (%)
Residents with income below 50% of the poverty level (%)
Children below poverty level (%)
Poor families by family type - Married-couple family (%)
Poor families by family type - Male, no wife present (%)
Poor families by family type - Female, no husband present (%)
Poverty status for native-born residents (%)
Poverty status for foreign-born residents (%)
Poverty among high school graduates not in families (%)
Poverty among people who did not graduate high school not in families (%)
Residents with income below the poverty level (%) - White
Residents with income below the poverty level (%) - Black or African American
Residents with income below the poverty level (%) - Asian
Residents with income below the poverty level (%) - Hispanic or Latino
Residents with income below the poverty level (%) - American Indian and Alaska Native
Residents with income below the poverty level (%) - Multirace
Residents with income below the poverty level (%) - Other Race
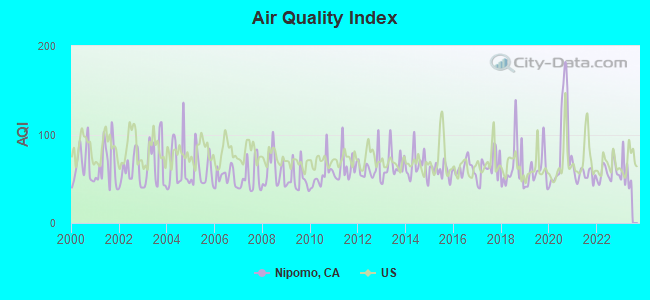
Air pollution - Air Quality Index (AQI)
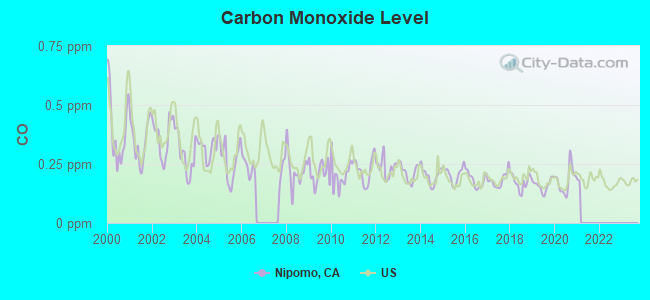
Air pollution - CO
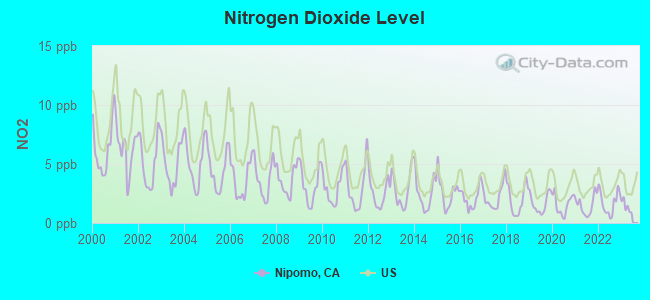
Air pollution - NO2
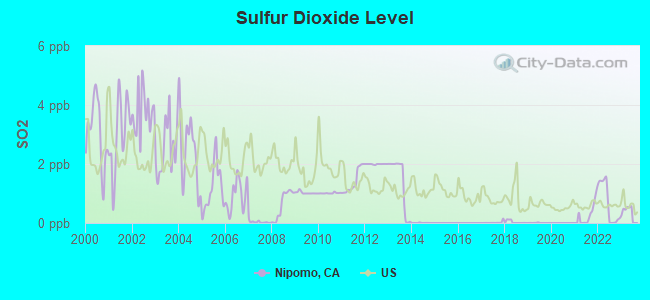
Air pollution - SO2
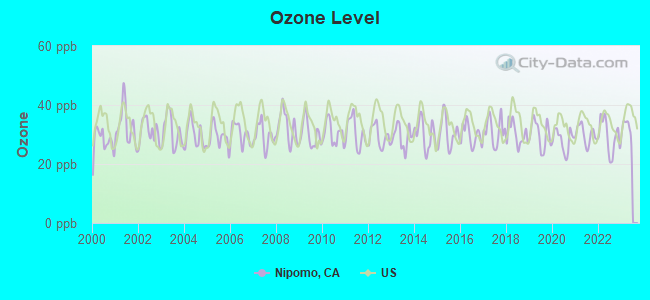
Air pollution - Ozone
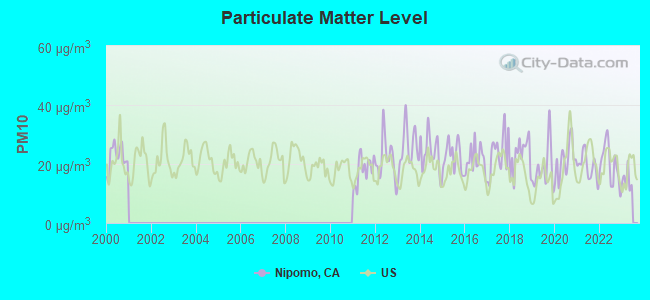
Air pollution - PM10
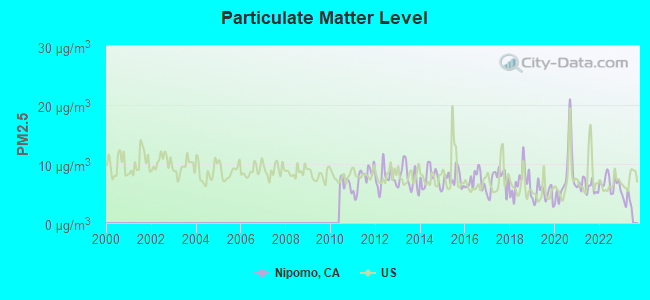
Air pollution - PM25
Air pollution - Pb
Crime - Murders per 100,000 population
Crime - Rapes per 100,000 population
Crime - Robberies per 100,000 population
Crime - Assaults per 100,000 population
Crime - Burglaries per 100,000 population
Crime - Thefts per 100,000 population
Crime - Auto thefts per 100,000 population
Crime - Arson per 100,000 population
Crime - City-data.com crime index
Crime - Violent crime index
Crime - Property crime index
Crime - Murders per 100,000 population (5 year average)
Crime - Rapes per 100,000 population (5 year average)
Crime - Robberies per 100,000 population (5 year average)
Crime - Assaults per 100,000 population (5 year average)
Crime - Burglaries per 100,000 population (5 year average)
Crime - Thefts per 100,000 population (5 year average)
Crime - Auto thefts per 100,000 population (5 year average)
Crime - Arson per 100,000 population (5 year average)
Crime - City-data.com crime index (5 year average)
Crime - Violent crime index (5 year average)
Crime - Property crime index (5 year average)
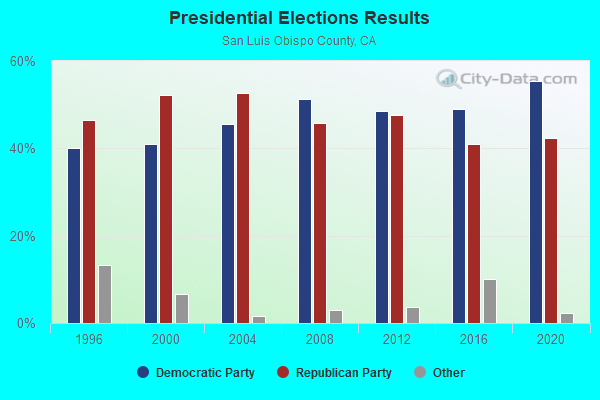
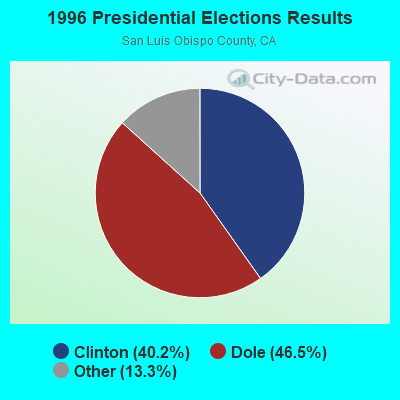
1996 Presidential Elections Results (%) - Democratic Party (Clinton)
1996 Presidential Elections Results (%) - Republican Party (Dole)
1996 Presidential Elections Results (%) - Other
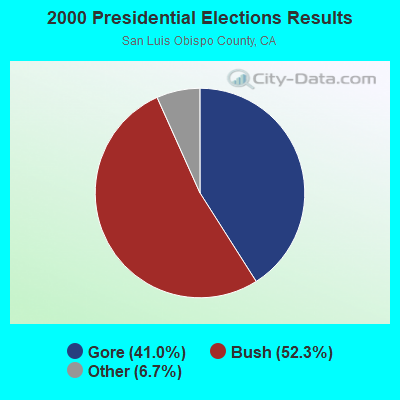
2000 Presidential Elections Results (%) - Democratic Party (Gore)
2000 Presidential Elections Results (%) - Republican Party (Bush)
2000 Presidential Elections Results (%) - Other
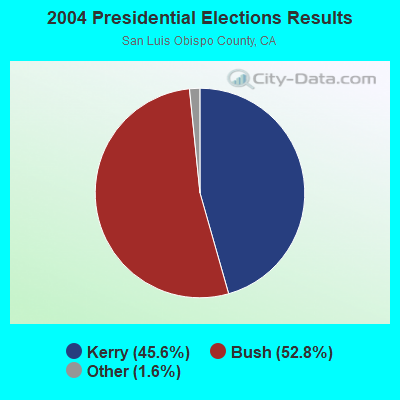
2004 Presidential Elections Results (%) - Democratic Party (Kerry)
2004 Presidential Elections Results (%) - Republican Party (Bush)
2004 Presidential Elections Results (%) - Other
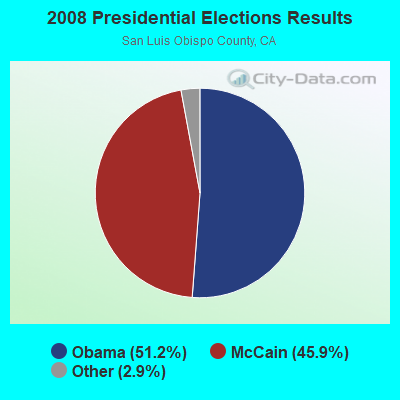
2008 Presidential Elections Results (%) - Democratic Party (Obama)
2008 Presidential Elections Results (%) - Republican Party (McCain)
2008 Presidential Elections Results (%) - Other
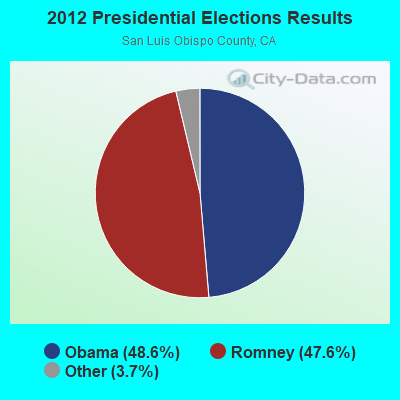
2012 Presidential Elections Results (%) - Democratic Party (Obama)
2012 Presidential Elections Results (%) - Republican Party (Romney)
2012 Presidential Elections Results (%) - Other
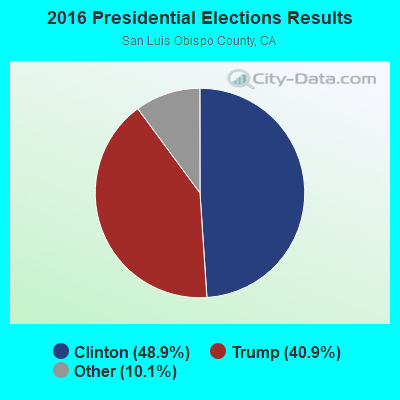
2016 Presidential Elections Results (%) - Democratic Party (Clinton)
2016 Presidential Elections Results (%) - Republican Party (Trump)
2016 Presidential Elections Results (%) - Other
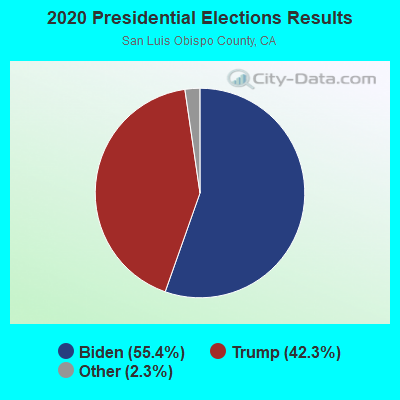
2020 Presidential Elections Results (%) - Democratic Party (Biden)
2020 Presidential Elections Results (%) - Republican Party (Trump)
2020 Presidential Elections Results (%) - Other
Ancestries Reported - Arab (%)
Ancestries Reported - Czech (%)
Ancestries Reported - Danish (%)
Ancestries Reported - Dutch (%)
Ancestries Reported - English (%)
Ancestries Reported - French (%)
Ancestries Reported - French Canadian (%)
Ancestries Reported - German (%)
Ancestries Reported - Greek (%)
Ancestries Reported - Hungarian (%)
Ancestries Reported - Irish (%)
Ancestries Reported - Italian (%)
Ancestries Reported - Lithuanian (%)
Ancestries Reported - Norwegian (%)
Ancestries Reported - Polish (%)
Ancestries Reported - Portuguese (%)
Ancestries Reported - Russian (%)
Ancestries Reported - Scotch-Irish (%)
Ancestries Reported - Scottish (%)
Ancestries Reported - Slovak (%)
Ancestries Reported - Subsaharan African (%)
Ancestries Reported - Swedish (%)
Ancestries Reported - Swiss (%)
Ancestries Reported - Ukrainian (%)
Ancestries Reported - United States (%)
Ancestries Reported - Welsh (%)
Ancestries Reported - West Indian (%)
Ancestries Reported - Other (%)
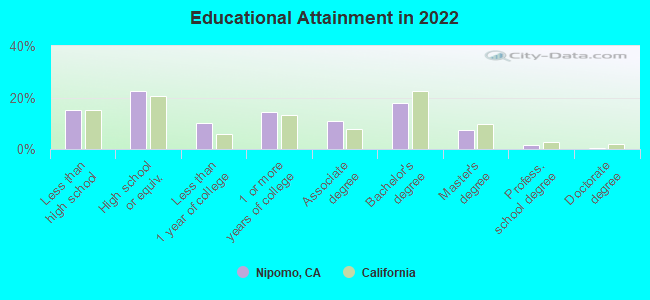
Educational Attainment - No schooling completed (%)
Educational Attainment - Less than high school (%)
Educational Attainment - High school or equivalent (%)
Educational Attainment - Less than 1 year of college (%)
Educational Attainment - 1 or more years of college (%)
Educational Attainment - Associate degree (%)
Educational Attainment - Bachelor's degree (%)
Educational Attainment - Master's degree (%)
Educational Attainment - Professional school degree (%)
Educational Attainment - Doctorate degree (%)
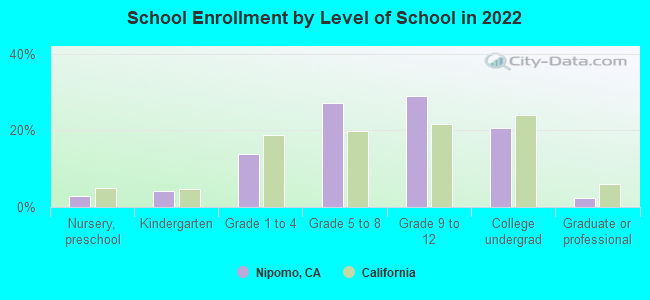
School Enrollment - Nursery, preschool (%)
School Enrollment - Kindergarten (%)
School Enrollment - Grade 1 to 4 (%)
School Enrollment - Grade 5 to 8 (%)
School Enrollment - Grade 9 to 12 (%)
School Enrollment - College undergrad (%)
School Enrollment - Graduate or professional (%)
School Enrollment - Not enrolled in school (%)
School enrollment - Public schools (%)
School enrollment - Private schools (%)
School enrollment - Not enrolled (%)
Median number of rooms in houses and condos
Median number of rooms in apartments
Housing units lacking complete plumbing facilities (%)
Housing units lacking complete kitchen facilities (%)
Density of houses
Urban houses (%)
Rural houses (%)
Households with people 60 years and over (%)
Households with people 65 years and over (%)
Households with people 75 years and over (%)
Households with one or more nonrelatives (%)
Households with no nonrelatives (%)
Population in households (%)
Family households (%)
Nonfamily households (%)
Population in families (%)
Family households with own children (%)
Median number of bedrooms in owner occupied houses
Mean number of bedrooms in owner occupied houses
Median number of bedrooms in renter occupied houses
Mean number of bedrooms in renter occupied houses
Median number of vehichles in owner occupied houses
Mean number of vehichles in owner occupied houses
Median number of vehichles in renter occupied houses
Mean number of vehichles in renter occupied houses
Mortgage status - with mortgage (%)
Mortgage status - with second mortgage (%)
Mortgage status - with home equity loan (%)
Mortgage status - with both second mortgage and home equity loan (%)
Mortgage status - without a mortgage (%)
Average family size
Average family size - White
Average family size - Black or African American
Average family size - Asian
Average family size - Hispanic or Latino
Average family size - American Indian and Alaska Native
Average family size - Multirace
Average family size - Other Race
Geographical mobility - Same house 1 year ago (%)
Geographical mobility - Moved within same county (%)
Geographical mobility - Moved from different county within same state (%)
Geographical mobility - Moved from different state (%)
Geographical mobility - Moved from abroad (%)
Place of birth - Born in state of residence (%)
Place of birth - Born in other state (%)
Place of birth - Native, outside of US (%)
Place of birth - Foreign born (%)
Housing units in structures - 1, detached (%)
Housing units in structures - 1, attached (%)
Housing units in structures - 2 (%)
Housing units in structures - 3 or 4 (%)
Housing units in structures - 5 to 9 (%)
Housing units in structures - 10 to 19 (%)
Housing units in structures - 20 to 49 (%)
Housing units in structures - 50 or more (%)
Housing units in structures - Mobile home (%)
Housing units in structures - Boat, RV, van, etc. (%)
House/condo owner moved in on average (years ago)
Renter moved in on average (years ago)
Year householder moved into unit - Moved in 1999 to March 2000 (%)
Year householder moved into unit - Moved in 1995 to 1998 (%)
Year householder moved into unit - Moved in 1990 to 1994 (%)
Year householder moved into unit - Moved in 1980 to 1989 (%)
Year householder moved into unit - Moved in 1970 to 1979 (%)
Year householder moved into unit - Moved in 1969 or earlier (%)
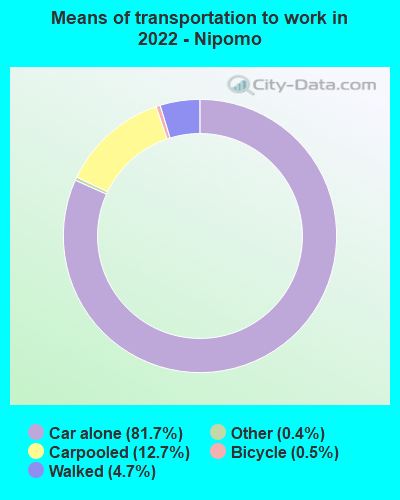
Means of transportation to work - Drove car alone (%)
Means of transportation to work - Carpooled (%)
Means of transportation to work - Public transportation (%)
Means of transportation to work - Bus or trolley bus (%)
Means of transportation to work - Streetcar or trolley car (%)
Means of transportation to work - Subway or elevated (%)
Means of transportation to work - Railroad (%)
Means of transportation to work - Ferryboat (%)
Means of transportation to work - Taxicab (%)
Means of transportation to work - Motorcycle (%)
Means of transportation to work - Bicycle (%)
Means of transportation to work - Walked (%)
Means of transportation to work - Other means (%)
Working at home (%)
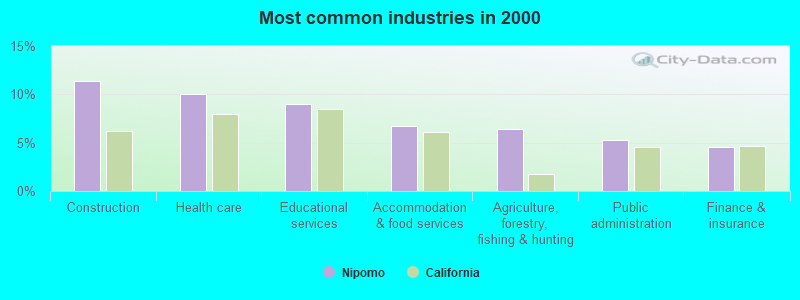
Industry diversity
Most Common Industries - Agriculture, forestry, fishing and hunting, and mining (%)
Most Common Industries - Agriculture, forestry, fishing and hunting (%)
Most Common Industries - Mining, quarrying, and oil and gas extraction (%)
Most Common Industries - Construction (%)
Most Common Industries - Manufacturing (%)
Most Common Industries - Wholesale trade (%)
Most Common Industries - Retail trade (%)
Most Common Industries - Transportation and warehousing, and utilities (%)
Most Common Industries - Transportation and warehousing (%)
Most Common Industries - Utilities (%)
Most Common Industries - Information (%)
Most Common Industries - Finance and insurance, and real estate and rental and leasing (%)
Most Common Industries - Finance and insurance (%)
Most Common Industries - Real estate and rental and leasing (%)
Most Common Industries - Professional, scientific, and management, and administrative and waste management services (%)
Most Common Industries - Professional, scientific, and technical services (%)
Most Common Industries - Management of companies and enterprises (%)
Most Common Industries - Administrative and support and waste management services (%)
Most Common Industries - Educational services, and health care and social assistance (%)
Most Common Industries - Educational services (%)
Most Common Industries - Health care and social assistance (%)
Most Common Industries - Arts, entertainment, and recreation, and accommodation and food services (%)
Most Common Industries - Arts, entertainment, and recreation (%)
Most Common Industries - Accommodation and food services (%)
Most Common Industries - Other services, except public administration (%)
Most Common Industries - Public administration (%)
Occupation diversity
Most Common Occupations - Management, business, science, and arts occupations (%)
Most Common Occupations - Management, business, and financial occupations (%)
Most Common Occupations - Management occupations (%)
Most Common Occupations - Business and financial operations occupations (%)
Most Common Occupations - Computer, engineering, and science occupations (%)
Most Common Occupations - Computer and mathematical occupations (%)
Most Common Occupations - Architecture and engineering occupations (%)
Most Common Occupations - Life, physical, and social science occupations (%)
Most Common Occupations - Education, legal, community service, arts, and media occupations (%)
Most Common Occupations - Community and social service occupations (%)
Most Common Occupations - Legal occupations (%)
Most Common Occupations - Education, training, and library occupations (%)
Most Common Occupations - Arts, design, entertainment, sports, and media occupations (%)
Most Common Occupations - Healthcare practitioners and technical occupations (%)
Most Common Occupations - Health diagnosing and treating practitioners and other technical occupations (%)
Most Common Occupations - Health technologists and technicians (%)
Most Common Occupations - Service occupations (%)
Most Common Occupations - Healthcare support occupations (%)
Most Common Occupations - Protective service occupations (%)
Most Common Occupations - Fire fighting and prevention, and other protective service workers including supervisors (%)
Most Common Occupations - Law enforcement workers including supervisors (%)
Most Common Occupations - Food preparation and serving related occupations (%)
Most Common Occupations - Building and grounds cleaning and maintenance occupations (%)
Most Common Occupations - Personal care and service occupations (%)
Most Common Occupations - Sales and office occupations (%)
Most Common Occupations - Sales and related occupations (%)
Most Common Occupations - Office and administrative support occupations (%)
Most Common Occupations - Natural resources, construction, and maintenance occupations (%)
Most Common Occupations - Farming, fishing, and forestry occupations (%)
Most Common Occupations - Construction and extraction occupations (%)
Most Common Occupations - Installation, maintenance, and repair occupations (%)
Most Common Occupations - Production, transportation, and material moving occupations (%)
Most Common Occupations - Production occupations (%)
Most Common Occupations - Transportation occupations (%)
Most Common Occupations - Material moving occupations (%)
People in Group quarters - Institutionalized population (%)
People in Group quarters - Correctional institutions (%)
People in Group quarters - Federal prisons and detention centers (%)
People in Group quarters - Halfway houses (%)
People in Group quarters - Local jails and other confinement facilities (including police lockups) (%)
People in Group quarters - Military disciplinary barracks (%)
People in Group quarters - State prisons (%)
People in Group quarters - Other types of correctional institutions (%)
People in Group quarters - Nursing homes (%)
People in Group quarters - Hospitals/wards, hospices, and schools for the handicapped (%)
People in Group quarters - Hospitals/wards and hospices for chronically ill (%)
People in Group quarters - Hospices or homes for chronically ill (%)
People in Group quarters - Military hospitals or wards for chronically ill (%)
People in Group quarters - Other hospitals or wards for chronically ill (%)
People in Group quarters - Hospitals or wards for drug/alcohol abuse (%)
People in Group quarters - Mental (Psychiatric) hospitals or wards (%)
People in Group quarters - Schools, hospitals, or wards for the mentally retarded (%)
People in Group quarters - Schools, hospitals, or wards for the physically handicapped (%)
People in Group quarters - Institutions for the deaf (%)
People in Group quarters - Institutions for the blind (%)
People in Group quarters - Orthopedic wards and institutions for the physically handicapped (%)
People in Group quarters - Wards in general hospitals for patients who have no usual home elsewhere (%)
People in Group quarters - Wards in military hospitals for patients who have no usual home elsewhere (%)
People in Group quarters - Juvenile institutions (%)
People in Group quarters - Long-term care (%)
People in Group quarters - Homes for abused, dependent, and neglected children (%)
People in Group quarters - Residential treatment centers for emotionally disturbed children (%)
People in Group quarters - Training schools for juvenile delinquents (%)
People in Group quarters - Short-term care, detention or diagnostic centers for delinquent children (%)
People in Group quarters - Type of juvenile institution unknown (%)
People in Group quarters - Noninstitutionalized population (%)
People in Group quarters - College dormitories (includes college quarters off campus) (%)
People in Group quarters - Military quarters (%)
People in Group quarters - On base (%)
People in Group quarters - Barracks, unaccompanied personnel housing (UPH), (Enlisted/Officer), ;and similar group living quarters for military personnel (%)
People in Group quarters - Transient quarters for temporary residents (%)
People in Group quarters - Military ships (%)
People in Group quarters - Group homes (%)
People in Group quarters - Homes or halfway houses for drug/alcohol abuse (%)
People in Group quarters - Homes for the mentally ill (%)
People in Group quarters - Homes for the mentally retarded (%)
People in Group quarters - Homes for the physically handicapped (%)
People in Group quarters - Other group homes (%)
People in Group quarters - Religious group quarters (%)
People in Group quarters - Dormitories (%)
People in Group quarters - Agriculture workers' dormitories on farms (%)
People in Group quarters - Job Corps and vocational training facilities (%)
People in Group quarters - Other workers' dormitories (%)
People in Group quarters - Crews of maritime vessels (%)
People in Group quarters - Other nonhousehold living situations (%)
People in Group quarters - Other noninstitutional group quarters (%)
Residents speaking English at home (%)
Residents speaking English at home - Born in the United States (%)
Residents speaking English at home - Native, born elsewhere (%)
Residents speaking English at home - Foreign born (%)
Residents speaking Spanish at home (%)
Residents speaking Spanish at home - Born in the United States (%)
Residents speaking Spanish at home - Native, born elsewhere (%)
Residents speaking Spanish at home - Foreign born (%)
Residents speaking other language at home (%)
Residents speaking other language at home - Born in the United States (%)
Residents speaking other language at home - Native, born elsewhere (%)
Residents speaking other language at home - Foreign born (%)
Class of Workers - Employee of private company (%)
Class of Workers - Self-employed in own incorporated business (%)
Class of Workers - Private not-for-profit wage and salary workers (%)
Class of Workers - Local government workers (%)
Class of Workers - State government workers (%)
Class of Workers - Federal government workers (%)
Class of Workers - Self-employed workers in own not incorporated business and Unpaid family workers (%)
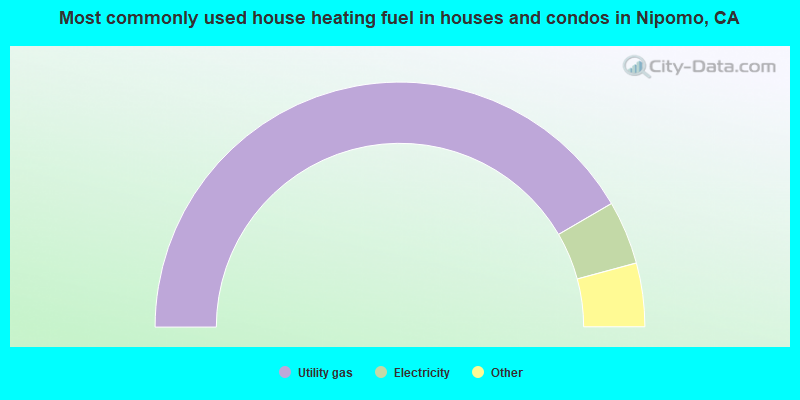
House heating fuel used in houses and condos - Utility gas (%)
House heating fuel used in houses and condos - Bottled, tank, or LP gas (%)
House heating fuel used in houses and condos - Electricity (%)
House heating fuel used in houses and condos - Fuel oil, kerosene, etc. (%)
House heating fuel used in houses and condos - Coal or coke (%)
House heating fuel used in houses and condos - Wood (%)
House heating fuel used in houses and condos - Solar energy (%)
House heating fuel used in houses and condos - Other fuel (%)
House heating fuel used in houses and condos - No fuel used (%)
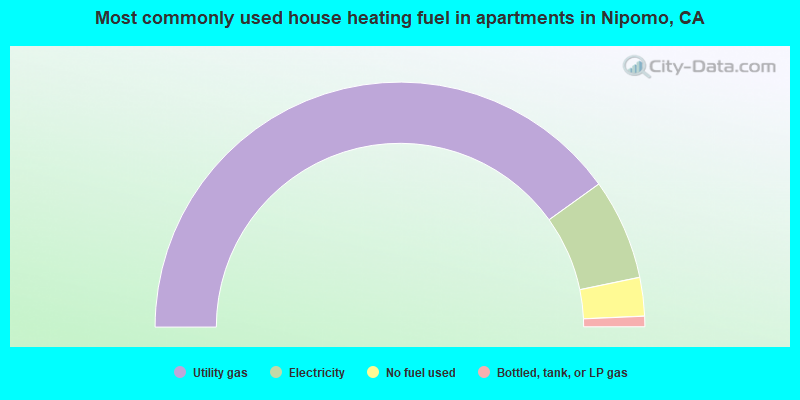
House heating fuel used in apartments - Utility gas (%)
House heating fuel used in apartments - Bottled, tank, or LP gas (%)
House heating fuel used in apartments - Electricity (%)
House heating fuel used in apartments - Fuel oil, kerosene, etc. (%)
House heating fuel used in apartments - Coal or coke (%)
House heating fuel used in apartments - Wood (%)
House heating fuel used in apartments - Solar energy (%)
House heating fuel used in apartments - Other fuel (%)
House heating fuel used in apartments - No fuel used (%)
Armed forces status - In Armed Forces (%)
Armed forces status - Civilian (%)
Armed forces status - Civilian - Veteran (%)
Armed forces status - Civilian - Nonveteran (%)
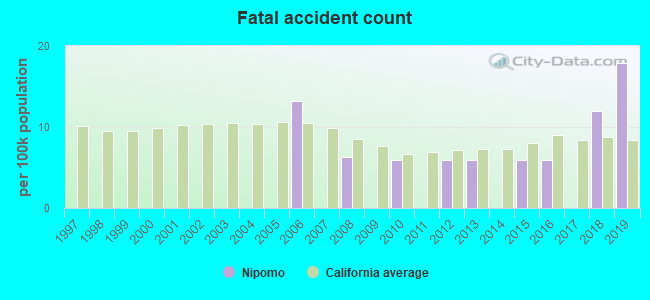
Fatal accidents locations in years 2005-2021
Fatal accidents locations in 2005
Fatal accidents locations in 2006
Fatal accidents locations in 2007
Fatal accidents locations in 2008
Fatal accidents locations in 2009
Fatal accidents locations in 2010
Fatal accidents locations in 2011
Fatal accidents locations in 2012
Fatal accidents locations in 2013
Fatal accidents locations in 2014
Fatal accidents locations in 2015
Fatal accidents locations in 2016
Fatal accidents locations in 2017
Fatal accidents locations in 2018
Fatal accidents locations in 2019
Fatal accidents locations in 2020
Fatal accidents locations in 2021
Alcohol use - People drinking some alcohol every month (%)
Alcohol use - People not drinking at all (%)
Alcohol use - Average days/month drinking alcohol
Alcohol use - Average drinks/week
Alcohol use - Average days/year people drink much
Audiometry - Average condition of hearing (%)
Audiometry - People that can hear a whisper from across a quiet room (%)
Audiometry - People that can hear normal voice from across a quiet room (%)
Audiometry - Ears ringing, roaring, buzzing (%)
Audiometry - Had a job exposure to loud noise (%)
Audiometry - Had off-work exposure to loud noise (%)
Blood Pressure & Cholesterol - Has high blood pressure (%)
Blood Pressure & Cholesterol - Checking blood pressure at home (%)
Blood Pressure & Cholesterol - Frequently checking blood cholesterol (%)
Blood Pressure & Cholesterol - Has high cholesterol level (%)
Consumer Behavior - Money monthly spent on food at supermarket/grocery store
Consumer Behavior - Money monthly spent on food at other stores
Consumer Behavior - Money monthly spent on eating out
Consumer Behavior - Money monthly spent on carryout/delivered foods
Consumer Behavior - Income spent on food at supermarket/grocery store (%)
Consumer Behavior - Income spent on food at other stores (%)
Consumer Behavior - Income spent on eating out (%)
Consumer Behavior - Income spent on carryout/delivered foods (%)
Current Health Status - General health condition (%)
Current Health Status - Blood donors (%)
Current Health Status - Has blood ever tested for HIV virus (%)
Current Health Status - Left-handed people (%)
Dermatology - People using sunscreen (%)
Diabetes - Diabetics (%)
Diabetes - Had a blood test for high blood sugar (%)
Diabetes - People taking insulin (%)
Diet Behavior & Nutrition - Diet health (%)
Diet Behavior & Nutrition - Milk product consumption (# of products/month)
Diet Behavior & Nutrition - Meals not home prepared (#/week)
Diet Behavior & Nutrition - Meals from fast food or pizza place (#/week)
Diet Behavior & Nutrition - Ready-to-eat foods (#/month)
Diet Behavior & Nutrition - Frozen meals/pizza (#/month)
Drug Use - People that ever used marijuana or hashish (%)
Drug Use - Ever used hard drugs (%)
Drug Use - Ever used any form of cocaine (%)
Drug Use - Ever used heroin (%)
Drug Use - Ever used methamphetamine (%)
Health Insurance - People covered by health insurance (%)
Kidney Conditions-Urology - Avg. # of times urinating at night
Medical Conditions - People with asthma (%)
Medical Conditions - People with anemia (%)
Medical Conditions - People with psoriasis (%)
Medical Conditions - People with overweight (%)
Medical Conditions - Elderly people having difficulties in thinking or remembering (%)
Medical Conditions - People who ever received blood transfusion (%)
Medical Conditions - People having trouble seeing even with glass/contacts (%)
Medical Conditions - People with arthritis (%)
Medical Conditions - People with gout (%)
Medical Conditions - People with congestive heart failure (%)
Medical Conditions - People with coronary heart disease (%)
Medical Conditions - People with angina pectoris (%)
Medical Conditions - People who ever had heart attack (%)
Medical Conditions - People who ever had stroke (%)
Medical Conditions - People with emphysema (%)
Medical Conditions - People with thyroid problem (%)
Medical Conditions - People with chronic bronchitis (%)
Medical Conditions - People with any liver condition (%)
Medical Conditions - People who ever had cancer or malignancy (%)
Mental Health - People who have little interest in doing things (%)
Mental Health - People feeling down, depressed, or hopeless (%)
Mental Health - People who have trouble sleeping or sleeping too much (%)
Mental Health - People feeling tired or having little energy (%)
Mental Health - People with poor appetite or overeating (%)
Mental Health - People feeling bad about themself (%)
Mental Health - People who have trouble concentrating on things (%)
Mental Health - People moving or speaking slowly or too fast (%)
Mental Health - People having thoughts they would be better off dead (%)
Oral Health - Average years since last visit a dentist
Oral Health - People embarrassed because of mouth (%)
Oral Health - People with gum disease (%)
Oral Health - General health of teeth and gums (%)
Oral Health - Average days a week using dental floss/device
Oral Health - Average days a week using mouthwash for dental problem
Oral Health - Average number of teeth
Pesticide Use - Households using pesticides to control insects (%)
Pesticide Use - Households using pesticides to kill weeds (%)
Physical Activity - People doing vigorous-intensity work activities (%)
Physical Activity - People doing moderate-intensity work activities (%)
Physical Activity - People walking or bicycling (%)
Physical Activity - People doing vigorous-intensity recreational activities (%)
Physical Activity - People doing moderate-intensity recreational activities (%)
Physical Activity - Average hours a day doing sedentary activities
Physical Activity - Average hours a day watching TV or videos
Physical Activity - Average hours a day using computer
Physical Functioning - People having limitations keeping them from working (%)
Physical Functioning - People limited in amount of work they can do (%)
Physical Functioning - People that need special equipment to walk (%)
Physical Functioning - People experiencing confusion/memory problems (%)
Physical Functioning - People requiring special healthcare equipment (%)
Prescription Medications - Average number of prescription medicines taking
Preventive Aspirin Use - Adults 40+ taking low-dose aspirin (%)
Reproductive Health - Vaginal deliveries (%)
Reproductive Health - Cesarean deliveries (%)
Reproductive Health - Deliveries resulted in a live birth (%)
Reproductive Health - Pregnancies resulted in a delivery (%)
Reproductive Health - Women breastfeeding newborns (%)
Reproductive Health - Women that had a hysterectomy (%)
Reproductive Health - Women that had both ovaries removed (%)
Reproductive Health - Women that have ever taken birth control pills (%)
Reproductive Health - Women taking birth control pills (%)
Reproductive Health - Women that have ever used Depo-Provera or injectables (%)
Reproductive Health - Women that have ever used female hormones (%)
Sexual Behavior - People 18+ that ever had sex (vaginal, anal, or oral) (%)
Sexual Behavior - Males 18+ that ever had vaginal sex with a woman (%)
Sexual Behavior - Males 18+ that ever performed oral sex on a woman (%)
Sexual Behavior - Males 18+ that ever had anal sex with a woman (%)
Sexual Behavior - Males 18+ that ever had any sex with a man (%)
Sexual Behavior - Females 18+ that ever had vaginal sex with a man (%)
Sexual Behavior - Females 18+ that ever performed oral sex on a man (%)
Sexual Behavior - Females 18+ that ever had anal sex with a man (%)
Sexual Behavior - Females 18+ that ever had any kind of sex with a woman (%)
Sexual Behavior - Average age people first had sex
Sexual Behavior - Average number of female sex partners in lifetime (males 18+)
Sexual Behavior - Average number of female vaginal sex partners in lifetime (males 18+)
Sexual Behavior - Average age people first performed oral sex on a woman (18+)
Sexual Behavior - Average number of woman performed oral sex on in lifetime (18+)
Sexual Behavior - Average number of male sex partners in lifetime (males 18+)
Sexual Behavior - Average number of male anal sex partners in lifetime (males 18+)
Sexual Behavior - Average age people first performed oral sex on a man (18+)
Sexual Behavior - Average number of male oral sex partners in lifetime (18+)
Sexual Behavior - People using protection when performing oral sex (%)
Sexual Behavior - Average number of times people have vaginal or anal sex a year
Sexual Behavior - People having sex without condom (%)
Sexual Behavior - Average number of male sex partners in lifetime (females 18+)
Sexual Behavior - Average number of male vaginal sex partners in lifetime (females 18+)
Sexual Behavior - Average number of female sex partners in lifetime (females 18+)
Sexual Behavior - Circumcised males 18+ (%)
Sleep Disorders - Average hours sleeping at night
Sleep Disorders - People that has trouble sleeping (%)
Smoking-Cigarette Use - People smoking cigarettes (%)
Taste & Smell - People 40+ having problems with smell (%)
Taste & Smell - People 40+ having problems with taste (%)
Taste & Smell - People 40+ that ever had wisdom teeth removed (%)
Taste & Smell - People 40+ that ever had tonsils teeth removed (%)
Taste & Smell - People 40+ that ever had a loss of consciousness because of a head injury (%)
Taste & Smell - People 40+ that ever had a broken nose or other serious injury to face or skull (%)
Taste & Smell - People 40+ that ever had two or more sinus infections (%)
Weight - Average height (inches)
Weight - Average weight (pounds)
Weight - Average BMI
Weight - People that are obese (%)
Weight - People that ever were obese (%)
Weight - People trying to lose weight (%)
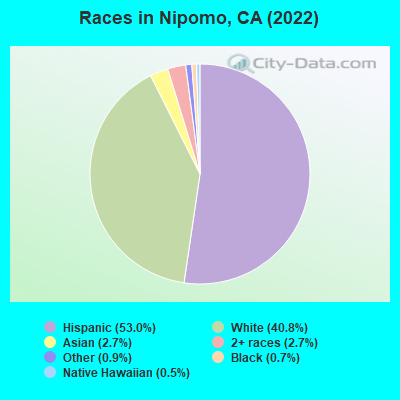
9,559 53.0% Hispanic 7,359 40.8% White alone 490 2.7% Asian alone 482 2.7% Two or more races 156 0.9% Other race alone 132 0.7% Black alone 86 0.5% Native Hawaiian and Other 2 0.01% American Indian alone
Latest news from Nipomo, CA collected exclusively by city-data.com from local newspapers, TV, and radio stations
Ancestries: English (4.7%), German (3.7%), Irish (3.0%), European (2.8%), American (2.1%), Portuguese (1.5%).
Current Local Time:
Land area: 11.4 square miles.
Population density: 1,464 people per square mile (low).
2,828 residents are foreign born (12.3% Latin America , 2.0% Asia ).
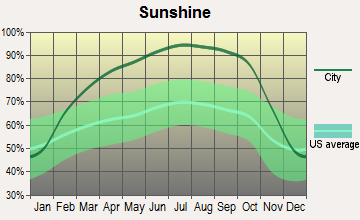
This place:
15.7%California:
26.5%
Median real estate property taxes paid for housing units with mortgages in 2022: $4,799 (0.7%)Median real estate property taxes paid for housing units with no mortgage in 2022: $4,822 (0.7%)
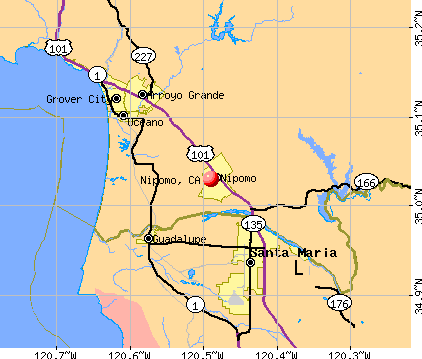
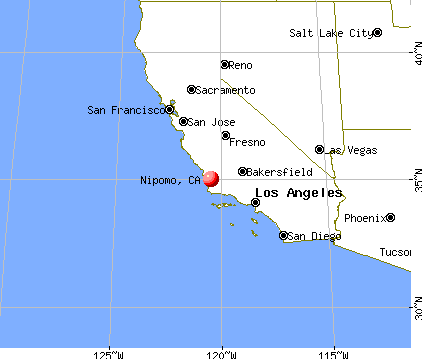
Nearest city with pop. 50,000+: Santa Maria, CA
Nearest city with pop. 200,000+: Bakersfield, CA
Nearest city with pop. 1,000,000+: Los Angeles, CA
Nearest cities:
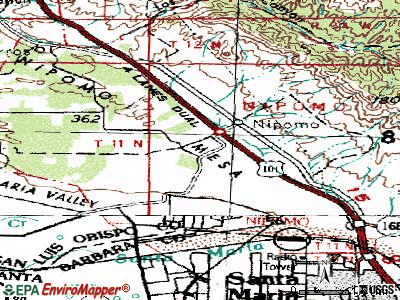
Latitude: 35.03 N, Longitude: 120.49 W
Daytime population change due to commuting: -4,474 (-24.8%)Workers who live and work in this place: 1,523 (18.7%)
Unemployment in December 2023:
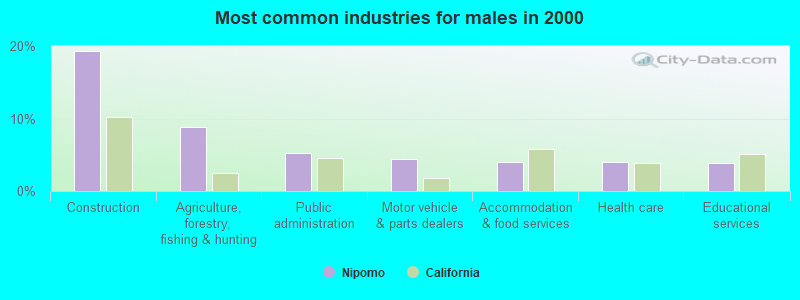
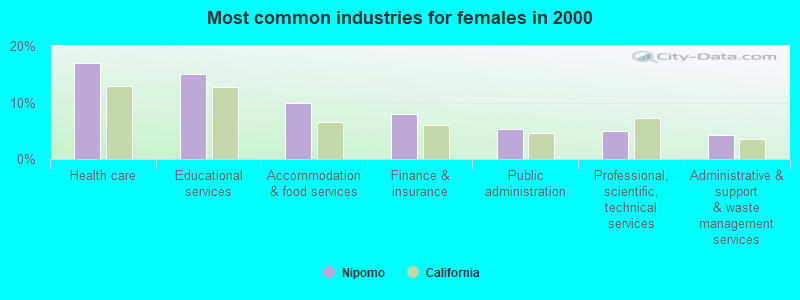
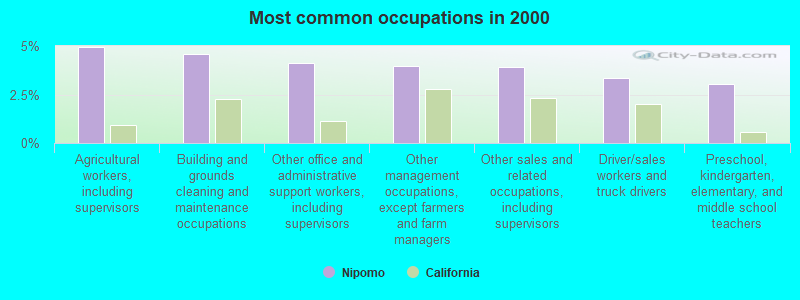
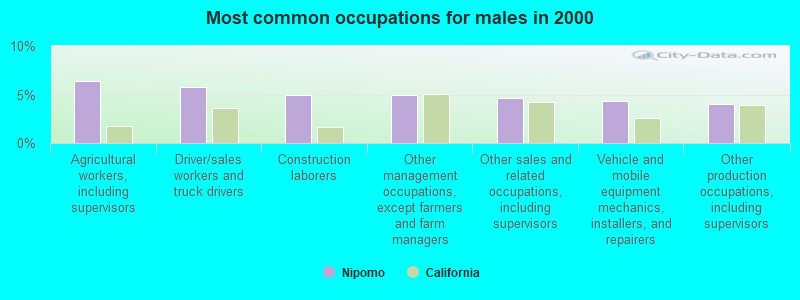
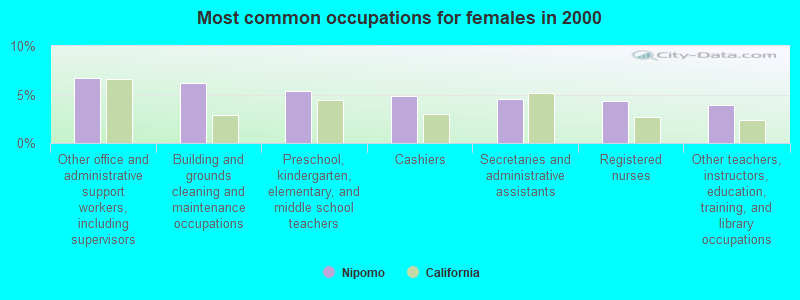
Most common occupations in Nipomo, CA (%)
Both Males Females
Agricultural workers, including supervisors (5.0%)
Building and grounds cleaning and maintenance occupations (4.6%)
Other office and administrative support workers, including supervisors (4.1%)
Other management occupations, except farmers and farm managers (4.0%)
Other sales and related occupations, including supervisors (3.9%)
Driver/sales workers and truck drivers (3.3%)
Preschool, kindergarten, elementary, and middle school teachers (3.1%)
Agricultural workers, including supervisors (6.4%)
Driver/sales workers and truck drivers (5.7%)
Construction laborers (5.0%)
Other management occupations, except farmers and farm managers (4.9%)
Other sales and related occupations, including supervisors (4.7%)
Vehicle and mobile equipment mechanics, installers, and repairers (4.3%)
Other production occupations, including supervisors (4.0%)
Other office and administrative support workers, including supervisors (6.7%)
Building and grounds cleaning and maintenance occupations (6.2%)
Preschool, kindergarten, elementary, and middle school teachers (5.4%)
Cashiers (4.9%)
Secretaries and administrative assistants (4.6%)
Registered nurses (4.3%)
Other teachers, instructors, education, training, and library occupations (3.9%)
Earthquake activity:
Nipomo-area historical earthquake activity is significantly above California state average. It is 6681% greater than the overall U.S. average. On 7/21/1952 at 11:52:14, a magnitude 7.7 (7.7 UK, Class: Major, Intensity: VIII - XII) earthquake occurred 84.4 miles away from the city center, causing $50,000,000 total damage On 11/4/1927 at 13:51:53, a magnitude 7.5 (7.5 UK) earthquake occurred 31.7 miles away from the city center On 4/18/1906 at 13:12:21, a magnitude 7.9 (7.9 UK) earthquake occurred 248.3 miles away from the city center, causing $524,000,000 total damage On 6/28/1992 at 11:57:34, a magnitude 7.6 (6.2 MB, 7.6 MS, 7.3 MW, Depth: 0.7 mi) earthquake occurred 232.8 miles away from Nipomo center, causing 3 deaths ( 1 shaking deaths, 2 other deaths) and 400 injuries, causing $100,000,000 total damage and $40,000,000 insured lossesOn 10/18/1989 at 00:04:15, a magnitude 7.1 (6.5 MB, 7.1 MS, 6.9 MW, 7.0 ML) earthquake occurred 160.7 miles away from the city center, causing 62 deaths ( 62 shaking deaths) and 3757 injuries, causing $1,305,032,704 total damage On 10/16/1999 at 09:46:44, a magnitude 7.4 (6.3 MB, 7.4 MS, 7.2 MW, 7.3 ML) earthquake occurred 233.1 miles away from the city center Magnitude types: body-wave magnitude (MB), local magnitude (ML), surface-wave magnitude (MS), moment magnitude (MW) Natural disasters: The number of natural disasters in San Luis Obispo County (20) is greater than the US average (15).Major Disasters (Presidential) Declared: 14Emergencies Declared: 2Floods: 14, Storms: 7, Winter Storms: 7, Mudslides: 5, Landslides: 3, Drought: 1, Earthquake: 1, Fire: 1, Freeze: 1, Hurricane: 1, Tornado: 1, Other: 1 (Note: some incidents may be assigned to more than one category). Hospitals and medical centers near Nipomo: SANTA MARIA CARE CENTER (Nursing Home, about 7 miles away; SANTA MARIA, CA)
VNS HOSPICE (Hospital, about 7 miles away; SANTA MARIA, CA)
COUNTRY OAKS CARE CENTER (Nursing Home, about 7 miles away; SANTA MARIA, CA)
MARIAN REGIONAL MEDICAL CENTER (about 7 miles away; SANTA MARIA, CA)
ENDOSCOPY SURGERY CENTER OF SANTA MARIA (Hospital, about 7 miles away; SANTA MARIA, CA)
MARIAN MEDICAL CENTER D/P SNF (Nursing Home, about 8 miles away; SANTA MARIA, CA)
MARIAN HOSPITAL HOMECARE AND HOSPICE (Home Health Center, about 8 miles away; SANTA MARIA, CA)
Amtrak stations near Nipomo: 7 miles: GUADALUPE/SANTA MARIA (SANTA MARIA, 330 GUADELUPE ST.) 7 miles: SANTA MARIA (CYPRESS ST. & NICHOLSON AVE.) - Bus Station Services: fully wheelchair accessible, public payphones, free short-term parking, call for taxi service, public transit connection.
11 miles: GROVER BEACH (180 GRAND AVE.) Services: fully wheelchair accessible, enclosed waiting area, public payphones, free short-term parking, free long-term parking, call for car rental service, call for taxi service.
Operable nuclear power plants near Nipomo:
18 miles: Diablo Canyon 1 and 2 in Avila Beach, CA.
Colleges/universities with over 2000 students nearest to Nipomo:
Allan Hancock College (about 8 miles; Santa Maria, CA ; Full-time enrollment: 6,639)
California Polytechnic State University-San Luis Obispo (about 21 miles; San Luis Obispo, CA ; FT enrollment: 17,345)
Cuesta College (about 26 miles; San Luis Obispo, CA ; FT enrollment: 6,518)
University of California-Santa Barbara (about 57 miles; Santa Barbara, CA ; FT enrollment: 22,806)
Taft College (about 59 miles; Taft, CA ; FT enrollment: 2,121)
Santa Barbara City College (about 63 miles; Santa Barbara, CA ; FT enrollment: 12,568)
California State University-Bakersfield (about 82 miles; Bakersfield, CA ; FT enrollment: 7,564)
Public high schools in Nipomo: NIPOMO HIGH Students: 829, Location: 525 N. THOMPSON RD., Grades: 8-12)CENTRAL COAST NEW TECH HIGH Location: 525 N. THOMPSON AVE., Grades: 9-12)
Public elementary/middle schools in Nipomo:
See full list of schools located in Nipomo
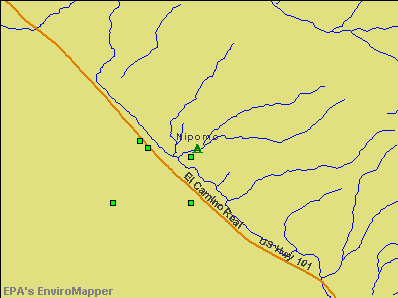
Notable locations in Nipomo: (A) , Kaminaka Farms (B) , Fantasy Farm (C) , Nipomo Senior Center (D) , Nipomo Community Center (E) , Nipomo Branch San Luis Obispo City-County Library (F) , Dana Adobe (G) , Nipomo Old Town Nursery (H) , Brassica Wholesale Nursery (I) , California Department of Forestry and Fire Protection Station 20 Nipomo (J) . Display/hide their locations on the map
Shopping Center: (1) . Display/hide its location on the map
Churches in Nipomo include: (A) , First Baptist Church of Nipomo (B) , Jesus Saves Full Gospel Tabernacle Church (C) , Kingdom Hall of Jehovahs Witnesses (D) , Lighthouse Christian Center (E) , New Harvest Community Foursquare Church (F) , Nipomo Shepherd of Hope Church (G) , Yo En Dios, Dios En Mi Church (H) . Display/hide their locations on the map
Creeks: (A) , Mehlschau Creek (B) . Display/hide their locations on the map
Park in Nipomo: (1) . Display/hide its location on the map
San Luis Obispo County has a predicted average indoor radon screening level between 2 and 4 pCi/L (pico curies per liter) - Moderate Potential Drinking water stations with addresses in Nipomo and their reported violations in the past:
THREE M'S RV RESORT (Serves ND, Population served: 50, Groundwater):
Past monitoring violations:
2 routine major monitoring violations
Drinking water stations with addresses in Nipomo that have no violations reported:
SANTA MARIA SPEEDWAY (Population served: 100, Primary Water Source Type: Groundwater)
CALLENDER GROVE MUTUAL WATER (Population served: 30, Primary Water Source Type: Groundwater)
Average household size: This place:
3.0 peopleCalifornia:
2.9 people
Percentage of family households: This place:
79.7%Whole state:
68.7%
Percentage of households with unmarried partners: This place:
7.1%Whole state:
7.2%
Likely homosexual households (counted as self-reported same-sex unmarried-partner households)
Lesbian couples: 0.5% of all households Gay men: 0.4% of all households
8 people in group homes intended for adults in 2010people in other noninstitutional facilities in 2010people in training schools for juvenile delinquents in 2000people in halfway houses in 2000
Banks with branches in Nipomo (2011 data):
Pacific Western Bank: Nipomo Branch at 542 West Tefft Street, branch established on 2003/06/30. Info updated 2011/03/14: Bank assets: $5,513.1 mil, Deposits: $4,614.5 mil, headquarters in Los Angeles, CA, positive income , Commercial Lending Specialization, 78 total offices , Holding Company: Capgen Capital Group Ii Lp
Wells Fargo Bank, National Association: Nipomo Branch at 555 W Tefft Street, branch established on 2008/10/20. Info updated 2011/04/05: Bank assets: $1,161,490.0 mil, Deposits: $905,653.0 mil, headquarters in Sioux Falls, SD, positive income , 6395 total offices , Holding Company: Wells Fargo & Company
Rabobank, National Association: Nipomo Branch at 615 West Tefft Street, branch established on 1974/05/28. Info updated 2011/01/27: Bank assets: $11,745.0 mil, Deposits: $8,446.0 mil, headquarters in Roseville, CA, positive income , Agricultural Specialization, 124 total offices , Holding Company: Cooperatieve Centrale Raiffeisen-Boerenleenbank B.A., "rabobank Nederland
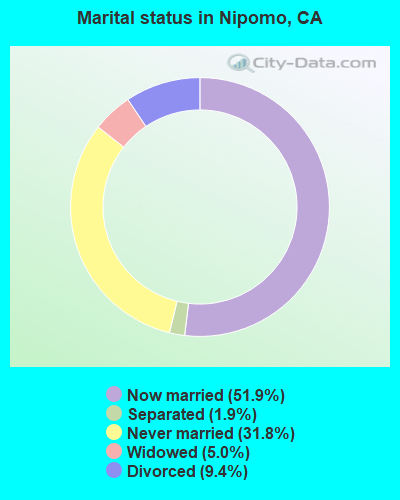
For population 15 years and over in Nipomo:
Never married: 31.8%Now married: 51.9%Separated: 1.9%Widowed: 5.0%Divorced: 9.4% For population 25 years and over in Nipomo:
High school or higher: 84.7%Bachelor's degree or higher: 24.8%Graduate or professional degree: 9.1%Unemployed: 6.7%Mean travel time to work (commute): 24.1 minutes
Education Gini index (Inequality in education) Here:
14.7California average:
15.5
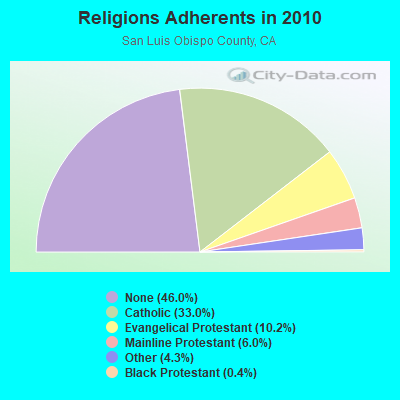
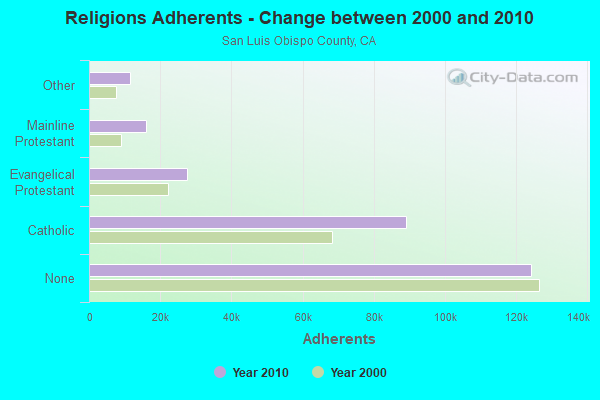
Religion statistics for Nipomo, CA (based on San Luis Obispo County data)
Religion Adherents Congregations Catholic 89,075 17 Evangelical Protestant 27,483 138 Mainline Protestant 16,099 56 Other 11,530 47 Black Protestant 1,078 3 Orthodox 205 2 None 124,167 -
Source: Clifford Grammich, Kirk Hadaway, Richard Houseal, Dale E.Jones, Alexei Krindatch, Richie Stanley and Richard H.Taylor. 2012. 2010 U.S.Religion Census: Religious Congregations & Membership Study. Association of Statisticians of American Religious Bodies. Jones, Dale E., et al. 2002. Congregations and Membership in the United States 2000. Nashville, TN: Glenmary Research Center. Graphs represent county-level data
Food Environment Statistics: Number of grocery stores : 60This county :
2.29 / 10,000 pop.State :
2.14 / 10,000 pop.
Number of supercenters and club stores : 1Here :
0.04 / 10,000 pop.State :
0.04 / 10,000 pop.
Number of convenience stores (no gas) : 18San Luis Obispo County :
0.69 / 10,000 pop.California :
0.62 / 10,000 pop.
Number of convenience stores (with gas) : 58San Luis Obispo County :
2.22 / 10,000 pop.California :
1.49 / 10,000 pop.
Number of full-service restaurants : 288Here :
11.00 / 10,000 pop.California :
7.42 / 10,000 pop.
Adult diabetes rate : San Luis Obispo County :
6.1%State :
7.3%
Adult obesity rate : This county :
21.5%California :
21.3%
Low-income preschool obesity rate : This county :
14.5%California :
17.9%
Health and Nutrition:
Average overall health of teeth and gums : This city:
46.7%California:
48.0%
Average BMI : Nipomo:
28.7California:
28.1
People feeling badly about themselves : Nipomo:
21.6%California:
20.2%
People not drinking alcohol at all : This city:
10.0%State:
11.2%
Average hours sleeping at night : Overweight people : Here:
35.3%California:
31.5%
General health condition : Average condition of hearing : Nipomo:
79.1%California:
80.9%
More about Health and Nutrition of Nipomo, CA Residents
6.17% of this county's 2020 resident taxpayers moved to other counties in 2021 ($68,140 average adjusted gross income )
Here:
6.17%California average:
6.14%
0.02% of residents moved to foreign countries ($212 average AGI )San Luis Obispo County:
0.02%California average:
0.02%
Top counties to which taxpayers relocated from this county between 2020 and 2021:
Businesses in Nipomo, CA
Name Count Name Count
AT&T 1 McDonald's 1 Ace Hardware 1 Safeway 2 CVS 1 Starbucks 2 Carl\s Jr. 1 Subway 1 Domino's Pizza 1 Taco Bell 1 FedEx 1 U-Haul 1 Lane Furniture 1 UPS 1 MasterBrand Cabinets 1 Vons 2
Strongest AM radio stations in Nipomo:
KGDP (660 AM; 50 kW; ORCUTT, CA; Owner: RADIO REPRESENTATIVES, INC.)
KUHL (1440 AM; 5 kW; SANTA MARIA, CA; Owner: MAPLETON COMMUNICATIONS, LLC)
KXTK (1280 AM; 10 kW; ARROYO GRANDE, CA; Owner: PAMPLIN BROADCASTING, INC.)
KLFF (890 AM; 5 kW; ARROYO GRANDE, CA; Owner: JERRY J. COLLINS)
KSMA (1240 AM; 1 kW; SANTA MARIA, CA; Owner: CLEAR CHANNEL BROADCASTING LICENSES, INC.)
KSBQ (1480 AM; 1 kW; SANTA MARIA, CA; Owner: LAZER BROADCASTING CORP.)
KTAP (1600 AM; daytime; 0 kW; SANTA MARIA, CA; Owner: EMERALD WAVE MEDIA)
KERI (1180 AM; 50 kW; WASCO-GREENACRES, CA; Owner: KWSO, INC.)
KJDJ (1030 AM; 2 kW; SAN LUIS OBISPO, CA; Owner: PADRE SERRA COMMUNICATIONS, INC)
KMJ (580 AM; 50 kW; FRESNO, CA; Owner: INFINITY RADIO OPERATIONS INC.)
KSPN (710 AM; 50 kW; LOS ANGELES, CA; Owner: KABC-AM RADIO, INC.)
KWRU (940 AM; 50 kW; FRESNO, CA)
KLAC (570 AM; 50 kW; LOS ANGELES, CA; Owner: AMFM RADIO LICENSES, L.L.C.)
Strongest FM radio stations in Nipomo:
KIDI-FM (105.5 FM; GUADALUPE, CA; Owner: EMERALD WAVE MEDIA)
KURQ (107.3 FM; GROVER BEACH, CA; Owner: CLEAR CHANNEL BROADCASTING LICENSES, INC.)
KXFM (99.1 FM; SANTA MARIA, CA; Owner: CLEAR CHANNEL BROADCASTING LICENSES, INC.)
KSNI-FM (102.5 FM; SANTA MARIA, CA; Owner: CLEAR CHANNEL BROADCASTING LICENSES, INC.)
KSTT-FM (101.3 FM; LOS OSOS-BAYWOOD PAR, CA; Owner: CLEAR CHANNEL BROADCASTING LICENSES, INC.)
KSLY-FM (96.1 FM; SAN LUIS OBISPO, CA; Owner: CLEAR CHANNEL BROADCASTING LICENSES, INC.)
KKAL (99.7 FM; MORRO BAY, CA; Owner: SALISBURY BROADCASTING CORP.)
KZOZ (93.3 FM; SAN LUIS OBISPO, CA; Owner: AMERICAN GENERAL MEDIA-TEXAS, INC.)
KWSR (92.5 FM; PASO ROBLES, CA; Owner: LAGNIAPPE BROADCASTING, INC)
KKJG (98.1 FM; SAN LUIS OBISPO, CA; Owner: AGM SAN LUIS OBISPO, L.P.)
KWWV (106.1 FM; SANTA MARGARITA, CA; Owner: SALISBURY RADIO LLC)
K209CE (89.7 FM; SAN LUIS OBISPO, CA; Owner: FAMILY STATIONS, INC.)
K216FQ (90.9 FM; SANTA MARIA, CA; Owner: CALVARY CHAPEL OF TWIN FALLS, INC.)
KLRM (97.1 FM; SAN LUIS OBISPO, CA; Owner: GTM SAN LUIS OBISPO)
KIQO (104.5 FM; ATASCADERO, CA; Owner: AMERICAN GENERAL MEDIA OF TEXAS, INC)
KCBX (90.1 FM; SAN LUIS OBISPO, CA; Owner: KCBX, INC.)
KLVH (88.5 FM; SAN LUIS OBISPO, CA; Owner: EDUCATIONAL MEDIA FOUNDATION)
K213CO (90.5 FM; SAN LUIS OBISPO, CA; Owner: PENSACOLA CHRISTIAN COLLEGE, INC.)
KRAZ (105.9 FM; SANTA YNEZ, CA; Owner: KNIGHT BROADCASTING, INC.)
KRUZ (103.3 FM; SANTA BARBARA, CA; Owner: CUMULUS LICENSING CORP.)
TV broadcast stations around Nipomo:
KSSY-LP (Channel 66; ARROYO GRANDE, CA; Owner: CHERIE ERWIN)
KFUL-LP (Channel 44; SAN LUIS OBISPO, CA; Owner: KJLA, LLC)
KAGP-LP (Channel 8; ARROYO GRANDE, CA; Owner: GARY M. COCOLA FAMILY TRUST, GARY M. COCOLA TRUSTEE)
KSBY (Channel 6; SAN LUIS OBISPO, CA; Owner: NVG-SANTA BARBARA II, LLC)
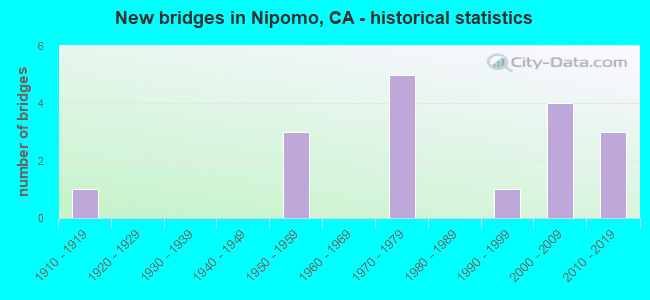
National Bridge Inventory (NBI) Statistics 17 Number of bridges161ft / 49.0m Total length $1,612,000 Total costs282,641 Total average daily traffic29,592 Total average daily truck traffic
New bridges - historical statistics
1 1910-1919 3 1950-1959 5 1970-1979 1 1990-1999 4 2000-2009 3 2010-2019
See full National Bridge Inventory statistics for Nipomo, CA
FCC Registered Antenna Towers: 6
Richard Byrne, 913 W. Tefft (Lat: 35.028361 Lon: -120.496167), Type: 23.1, Overall height: 21.3 m, Registrant: Towerco Assets LLC, Afry@towerco.Com, , Cary, Phone: (919) 653-5710 Richard Byrne, 913 W. Tefft (Lat: 35.028361 Lon: -120.496167), Type: 23.1, Overall height: 21.3 m, Registrant: Towerco Assets LLC, Afry@towerco.Com, , Cary, Phone: (919) 653-5710 Edward G Roach, 913 W. Tefft (Lat: 35.028361 Lon: -120.496167), Type: 23.1, Structure height: 06079 m, Overall height: 21.3 m, Registrant: Sba 2012 Tc Assets, LLC, Eroach@sbasite.Com, , Boca -Raton, Phone: (561) 995-7670 David McGlothlin, 526 North Oakglen Avenue (Lat: 35.047722 Lon: -120.492361), Type: 24.4, Structure height: 06079 m, Overall height: 24.4 m, Registrant: Apc Towers, LLC, Palvarez@apctowers.Com, Suite 250, Ralei-gh, Phone: (919) 324-1945 Candace Bailey, 526 North Oakglen Avenue (Lat: 35.047722 Lon: -120.492361), Type: 24.4, Structure height: 06079 m, Overall height: 24.4 m, Registrant: Apc Towers, LLC, Palvarez@apctowers.Com, Suite 250, Ralei-gh, Phone: (919) 324-1945 Paul Alvarez, 526 North Oakglen Avenue (Lat: 35.047722 Lon: -120.492361), Type: 24.4, Structure height: 06079 m, Overall height: 24.4 m, Registrant: Apc Towers, LLC, Palvarez@apctowers.Com, Suite 250, Ralei-gh, Phone: (919) 324-1945 FCC Registered Broadcast Land Mobile Towers: 8 (
See the full list of FCC Registered Broadcast Land Mobile Towers in Nipomo, CA )
FCC Registered Microwave Towers: 12 (
See the full list of FCC Registered Microwave Towers in this town )
FCC Registered Amateur Radio Licenses: 205 (
See the full list of FCC Registered Amateur Radio Licenses in Nipomo )
FAA Registered Aircraft: 30 (
See the full list of FAA Registered Aircraft in Nipomo )
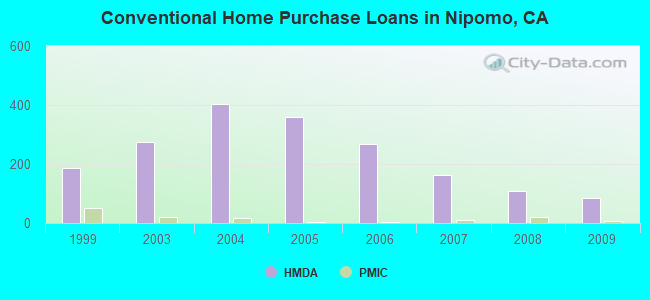
Home Mortgage Disclosure Act Aggregated Statistics For Year 2009(Based on 1 full and 1 partial tracts) A) FHA, FSA/RHS & VA B) Conventional C) Refinancings D) Home Improvement Loans F) Non-occupant Loans on G) Loans On Manufactured Number Average Value Number Average Value Number Average Value Number Average Value Number Average Value Number Average Value
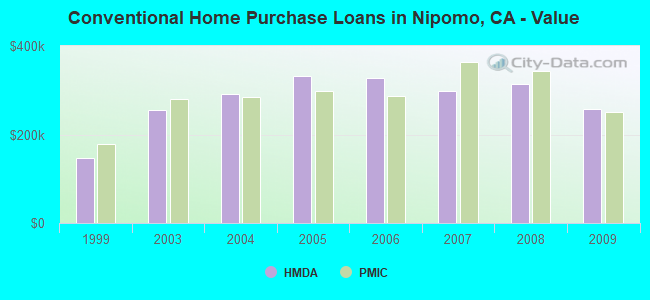
LOANS ORIGINATED 77 $305,023 84 $257,720 336 $276,208 17 $238,026 41 $214,616 23 $180,296 APPLICATIONS APPROVED, NOT ACCEPTED 7 $314,474 13 $265,004 33 $313,278 1 $437,280 4 $213,522 5 $111,450 APPLICATIONS DENIED 15 $298,809 21 $232,467 107 $343,871 6 $154,692 11 $234,159 13 $121,905 APPLICATIONS WITHDRAWN 9 $374,620 17 $253,676 116 $295,817 4 $147,728 8 $238,135 5 $207,394 FILES CLOSED FOR INCOMPLETENESS 1 $231,560 0 $0 17 $354,596 0 $0 1 $310,000 0 $0
Aggregated Statistics For Year 2008(Based on 1 full and 1 partial tracts) A) FHA, FSA/RHS & VA B) Conventional C) Refinancings D) Home Improvement Loans E) Loans on Dwellings For 5+ Families F) Non-occupant Loans on G) Loans On Manufactured Number Average Value Number Average Value Number Average Value Number Average Value Number Average Value Number Average Value Number Average Value
LOANS ORIGINATED 31 $286,738 107 $314,097 153 $284,666 16 $186,807 2 $903,960 34 $298,322 17 $192,892 APPLICATIONS APPROVED, NOT ACCEPTED 2 $335,075 19 $280,503 45 $297,659 5 $101,866 0 $0 7 $216,367 6 $211,872 APPLICATIONS DENIED 7 $275,887 28 $340,832 170 $309,147 11 $145,126 0 $0 23 $269,359 17 $208,798 APPLICATIONS WITHDRAWN 16 $268,426 26 $299,938 84 $303,218 7 $116,256 0 $0 11 $235,392 11 $179,820 FILES CLOSED FOR INCOMPLETENESS 0 $0 3 $279,650 17 $342,380 5 $261,822 0 $0 4 $185,912 1 $199,490
Aggregated Statistics For Year 2007(Based on 1 full and 1 partial tracts) A) FHA, FSA/RHS & VA B) Conventional C) Refinancings D) Home Improvement Loans E) Loans on Dwellings For 5+ Families F) Non-occupant Loans on G) Loans On Manufactured Number Average Value Number Average Value Number Average Value Number Average Value Number Average Value Number Average Value Number Average Value
LOANS ORIGINATED 5 $307,436 163 $299,281 301 $300,983 46 $220,843 0 $0 57 $307,129 42 $189,000 APPLICATIONS APPROVED, NOT ACCEPTED 0 $0 33 $357,512 69 $310,197 4 $121,482 1 $150,000 3 $253,877 3 $114,217 APPLICATIONS DENIED 2 $302,805 85 $321,526 241 $367,904 27 $241,533 0 $0 31 $284,321 20 $180,102 APPLICATIONS WITHDRAWN 1 $417,000 36 $289,858 107 $340,394 7 $198,494 0 $0 7 $303,939 10 $219,159 FILES CLOSED FOR INCOMPLETENESS 0 $0 7 $315,389 35 $341,419 3 $122,170 0 $0 7 $308,580 3 $202,270
Aggregated Statistics For Year 2006(Based on 1 full and 1 partial tracts) A) FHA, FSA/RHS & VA B) Conventional C) Refinancings D) Home Improvement Loans E) Loans on Dwellings For 5+ Families F) Non-occupant Loans on G) Loans On Manufactured Number Average Value Number Average Value Number Average Value Number Average Value Number Average Value Number Average Value Number Average Value
LOANS ORIGINATED 1 $236,900 268 $328,505 453 $311,536 67 $223,636 1 $1,737,560 56 $348,553 32 $199,028 APPLICATIONS APPROVED, NOT ACCEPTED 0 $0 57 $300,544 109 $330,853 11 $326,098 0 $0 19 $312,999 9 $157,430 APPLICATIONS DENIED 2 $236,900 69 $310,602 261 $320,571 38 $173,084 1 $320,000 22 $350,812 43 $221,982 APPLICATIONS WITHDRAWN 1 $236,900 58 $359,171 187 $310,951 17 $311,582 0 $0 7 $201,419 6 $145,783 FILES CLOSED FOR INCOMPLETENESS 0 $0 9 $350,066 48 $299,081 2 $82,295 0 $0 4 $371,930 3 $201,220
Aggregated Statistics For Year 2005(Based on 1 full and 1 partial tracts) A) FHA, FSA/RHS & VA B) Conventional C) Refinancings D) Home Improvement Loans E) Loans on Dwellings For 5+ Families F) Non-occupant Loans on G) Loans On Manufactured Number Average Value Number Average Value Number Average Value Number Average Value Number Average Value Number Average Value Number Average Value
LOANS ORIGINATED 4 $347,780 361 $332,220 556 $321,031 74 $216,526 1 $2,315,560 78 $333,013 41 $195,355 APPLICATIONS APPROVED, NOT ACCEPTED 0 $0 51 $312,495 104 $306,979 9 $269,319 0 $0 9 $323,694 12 $156,195 APPLICATIONS DENIED 2 $223,540 76 $334,172 198 $286,206 56 $188,394 0 $0 26 $300,504 32 $155,939 APPLICATIONS WITHDRAWN 0 $0 67 $332,215 176 $317,466 21 $244,173 1 $44,530 17 $361,906 19 $197,866 FILES CLOSED FOR INCOMPLETENESS 0 $0 9 $282,857 80 $314,871 2 $218,640 0 $0 5 $363,262 7 $196,496
Aggregated Statistics For Year 2004(Based on 1 full and 1 partial tracts) A) FHA, FSA/RHS & VA B) Conventional C) Refinancings D) Home Improvement Loans E) Loans on Dwellings For 5+ Families F) Non-occupant Loans on G) Loans On Manufactured Number Average Value Number Average Value Number Average Value Number Average Value Number Average Value Number Average Value Number Average Value
LOANS ORIGINATED 9 $252,091 403 $290,862 569 $250,392 85 $145,638 1 $1,402,700 82 $258,678 47 $186,090 APPLICATIONS APPROVED, NOT ACCEPTED 1 $189,700 59 $264,321 112 $238,626 9 $135,876 0 $0 7 $212,370 15 $167,247 APPLICATIONS DENIED 4 $288,332 94 $302,446 229 $244,595 42 $124,310 0 $0 20 $190,338 41 $197,730 APPLICATIONS WITHDRAWN 3 $208,697 73 $283,815 206 $249,798 18 $200,353 0 $0 11 $207,759 25 $212,045 FILES CLOSED FOR INCOMPLETENESS 2 $140,715 11 $309,492 30 $255,062 8 $116,039 0 $0 4 $267,078 5 $149,960
Aggregated Statistics For Year 2003(Based on 1 full and 1 partial tracts) A) FHA, FSA/RHS & VA B) Conventional C) Refinancings D) Home Improvement Loans F) Non-occupant Loans on Number Average Value Number Average Value Number Average Value Number Average Value Number Average Value
LOANS ORIGINATED 20 $210,739 274 $256,370 1,174 $200,164 20 $55,884 94 $217,414 APPLICATIONS APPROVED, NOT ACCEPTED 1 $298,000 30 $232,183 144 $192,186 4 $101,972 8 $203,832 APPLICATIONS DENIED 3 $159,713 44 $238,740 200 $194,035 29 $45,653 18 $171,721 APPLICATIONS WITHDRAWN 2 $217,500 26 $248,199 262 $210,246 7 $40,144 8 $241,316 FILES CLOSED FOR INCOMPLETENESS 0 $0 8 $257,531 27 $212,725 0 $0 1 $311,710
Aggregated Statistics For Year 1999(Based on 1 partial tract) A) FHA, FSA/RHS & VA B) Conventional C) Refinancings D) Home Improvement Loans E) Loans on Dwellings For 5+ Families F) Non-occupant Loans on Number Average Value Number Average Value Number Average Value Number Average Value Number Average Value Number Average Value
LOANS ORIGINATED 50 $137,466 185 $145,967 205 $132,277 19 $55,902 3 $89,127 26 $118,959 APPLICATIONS APPROVED, NOT ACCEPTED 2 $119,350 17 $192,822 36 $127,061 6 $17,270 0 $0 4 $80,492 APPLICATIONS DENIED 8 $139,242 43 $114,918 122 $123,909 13 $19,643 0 $0 6 $106,090 APPLICATIONS WITHDRAWN 4 $127,215 26 $141,912 66 $127,201 3 $93,753 0 $0 3 $90,053 FILES CLOSED FOR INCOMPLETENESS 1 $125,830 5 $239,626 19 $120,325 0 $0 0 $0 0 $0
Detailed HMDA statistics for the following Tracts:
0124.01
, 0124.02
Private Mortgage Insurance Companies Aggregated Statistics For Year 2009(Based on 1 full and 1 partial tracts) A) Conventional B) Refinancings Number Average Value Number Average Value
LOANS ORIGINATED 6 $251,577 2 $408,370 APPLICATIONS APPROVED, NOT ACCEPTED 1 $300,000 2 $515,310 APPLICATIONS DENIED 1 $268,960 1 $417,000 APPLICATIONS WITHDRAWN 0 $0 1 $195,930 FILES CLOSED FOR INCOMPLETENESS 0 $0 1 $368,000
Aggregated Statistics For Year 2008(Based on 1 full and 1 partial tracts) A) Conventional B) Refinancings C) Non-occupant Loans on D) Loans On Manufactured Number Average Value Number Average Value Number Average Value Number Average Value
LOANS ORIGINATED 20 $342,690 6 $326,918 1 $655,480 1 $268,960 APPLICATIONS APPROVED, NOT ACCEPTED 8 $339,922 5 $336,196 0 $0 1 $293,010 APPLICATIONS DENIED 3 $331,863 1 $368,000 0 $0 0 $0 APPLICATIONS WITHDRAWN 2 $352,285 0 $0 0 $0 0 $0 FILES CLOSED FOR INCOMPLETENESS 0 $0 0 $0 0 $0 0 $0
Aggregated Statistics For Year 2007(Based on 1 full and 1 partial tracts) A) Conventional B) Refinancings C) Non-occupant Loans on D) Loans On Manufactured Number Average Value Number Average Value Number Average Value Number Average Value
LOANS ORIGINATED 11 $363,481 9 $351,178 0 $0 3 $236,010 APPLICATIONS APPROVED, NOT ACCEPTED 9 $445,141 3 $582,000 5 $509,000 0 $0 APPLICATIONS DENIED 0 $0 1 $441,000 0 $0 0 $0 APPLICATIONS WITHDRAWN 0 $0 1 $529,910 0 $0 0 $0 FILES CLOSED FOR INCOMPLETENESS 1 $555,000 0 $0 0 $0 0 $0
Aggregated Statistics For Year 2006(Based on 1 full and 1 partial tracts) A) Conventional B) Refinancings D) Loans On Manufactured Number Average Value Number Average Value Number Average Value
LOANS ORIGINATED 4 $286,328 4 $362,342 0 $0 APPLICATIONS APPROVED, NOT ACCEPTED 3 $330,257 1 $315,000 1 $228,880 APPLICATIONS DENIED 1 $504,000 0 $0 0 $0 APPLICATIONS WITHDRAWN 1 $386,000 1 $386,000 0 $0 FILES CLOSED FOR INCOMPLETENESS 0 $0 0 $0 0 $0
Aggregated Statistics For Year 2005(Based on 1 full and 1 partial tracts) A) Conventional B) Refinancings C) Non-occupant Loans on Number Average Value Number Average Value Number Average Value
LOANS ORIGINATED 5 $298,840 2 $344,500 2 $292,500 APPLICATIONS APPROVED, NOT ACCEPTED 1 $190,590 1 $425,000 1 $190,590 APPLICATIONS DENIED 1 $243,000 0 $0 1 $243,000 APPLICATIONS WITHDRAWN 2 $209,735 0 $0 1 $190,590 FILES CLOSED FOR INCOMPLETENESS 0 $0 0 $0 0 $0
Aggregated Statistics For Year 2004(Based on 1 full and 1 partial tracts) A) Conventional B) Refinancings C) Non-occupant Loans on Number Average Value Number Average Value Number Average Value
LOANS ORIGINATED 17 $284,643 5 $290,982 4 $197,775 APPLICATIONS APPROVED, NOT ACCEPTED 5 $280,930 4 $285,028 1 $279,000 APPLICATIONS DENIED 2 $434,615 0 $0 0 $0 APPLICATIONS WITHDRAWN 0 $0 3 $225,023 0 $0 FILES CLOSED FOR INCOMPLETENESS 0 $0 0 $0 0 $0
Aggregated Statistics For Year 2003(Based on 1 full and 1 partial tracts) A) Conventional B) Refinancings C) Non-occupant Loans on Number Average Value Number Average Value Number Average Value
LOANS ORIGINATED 21 $280,845 13 $239,532 1 $146,950 APPLICATIONS APPROVED, NOT ACCEPTED 3 $239,100 9 $262,121 0 $0 APPLICATIONS DENIED 0 $0 1 $280,000 0 $0 APPLICATIONS WITHDRAWN 0 $0 0 $0 0 $0 FILES CLOSED FOR INCOMPLETENESS 0 $0 0 $0 0 $0
Aggregated Statistics For Year 1999(Based on 1 partial tract) A) Conventional B) Refinancings C) Non-occupant Loans on Number Average Value Number Average Value Number Average Value
LOANS ORIGINATED 51 $178,219 13 $145,114 1 $78,640 APPLICATIONS APPROVED, NOT ACCEPTED 6 $177,175 5 $118,240 0 $0 APPLICATIONS DENIED 1 $153,580 2 $123,975 0 $0 APPLICATIONS WITHDRAWN 2 $227,600 2 $143,870 0 $0 FILES CLOSED FOR INCOMPLETENESS 0 $0 0 $0 0 $0
Detailed PMIC statistics for the following Tracts:
0124.01
, 0124.02
Most common first names in Nipomo, CA among deceased individuals Name Count Lived (average)
Robert 55 73.8 years John 52 74.5 years William 47 75.5 years Mary 42 80.4 years James 38 71.4 years Richard 28 72.4 years Dorothy 27 79.1 years Charles 27 75.0 years George 24 76.5 years Thomas 22 73.0 years
Most common last names in Nipomo, CA among deceased individuals Last name Count Lived (average)
Smith 22 80.5 years Jones 15 78.3 years Johnson 12 72.6 years Dana 12 80.6 years Moore 11 73.7 years Perez 10 77.8 years Castillo 10 63.4 years Thompson 10 75.7 years Thomas 9 73.0 years Hernandez 9 74.6 years
Nipomo compared to California state average:
Unemployed percentage below state average. Black race population percentage significantly below state average. Hispanic race population percentage above state average. Median age above state average. Renting percentage below state average. Length of stay since moving in significantly above state average. House age below state average.
Top Patent Applicants
William Waycott (6)
Christopher Scott Gifford (6)
Jason Jandrew (4)
Robert Derohan (3)
David Ernest Silva (3)
Keith William Schindler (3)
Lloyd R. Baggs (2)
C. Arthur Maccarley (2)
Thomas C. Chadwick (2)
William Fitzpatrick (2)
Total of 49 patent applications in 2008-2024.


 Recent articles from our blog. Our writers, many of them Ph.D. graduates or candidates, create easy-to-read articles on a wide variety of topics.


 (6.3 miles
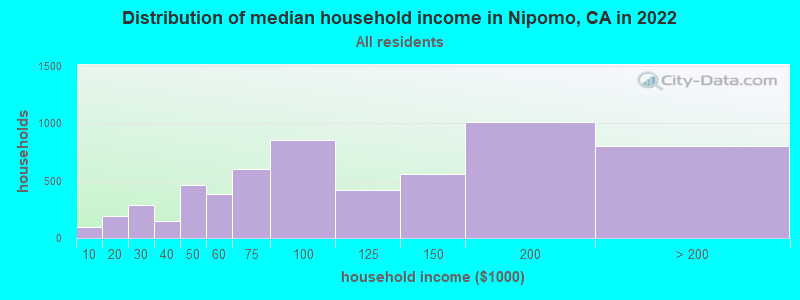

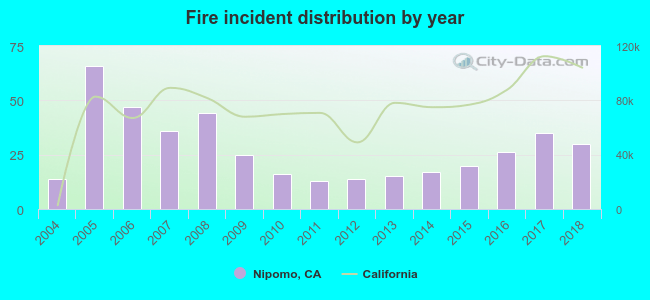 Based on the data from the years 2004 - 2018 the average number of fires per year is 28. The highest number of fires - 66 took place in 2005, and the least - 13 in 2011. The data has a growing trend.
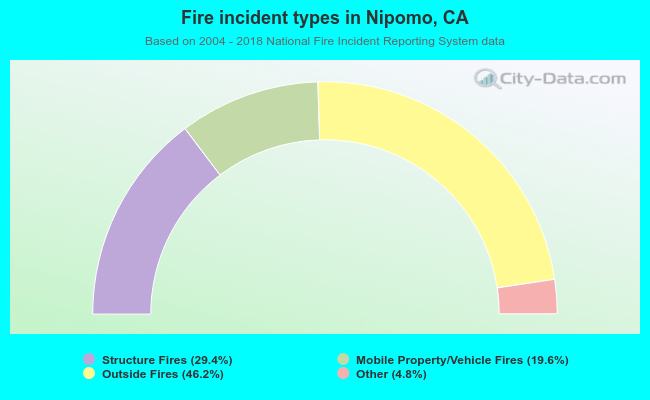 When looking into fire subcategories, the most incidents belonged to: Outside Fires (46.2%), and Structure Fires (29.4%).