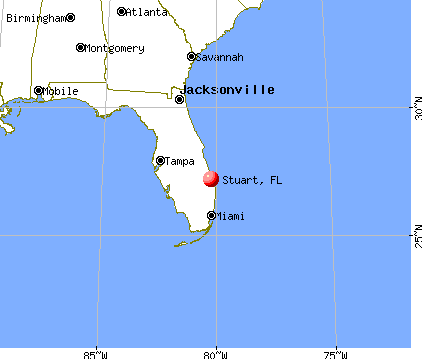
Stuart, Florida
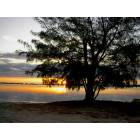
Stuart: This is a picture of the sunrise by the causeway in Stuart.
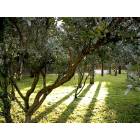
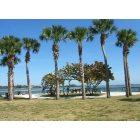
Stuart: Morning in the park by Stuart beach
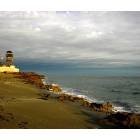
Stuart: A picture of the house of refuge in Stuart.
Stuart: Stuart Inlet 2010
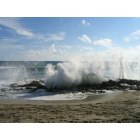
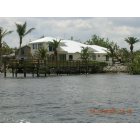
Stuart: Santa Lucea Beach, Stuart, FL
Stuart: Sandsprit Park overlooking the St. Lucie Inlet in Stuart, FL

Stuart
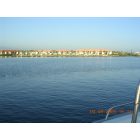
Stuart: Stuart Inlet 2010
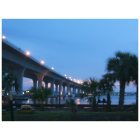
Stuart: The Roosevelt Bridge span ning the St. Lucie River in Stuart, FL
Stuart: Pretty Rainbow
Stuart: Double Rainbow
- see
25
more - add
your


Submit your own pictures of this city and show them to the world
- OSM Map
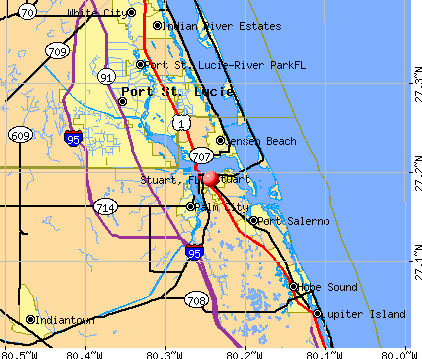
- General Map
- Google Map
- MSN Map
Population change since 2000: +24.7%
 |
| Males: 8,903 | |
| Females: 9,350 |
| Median resident age: | 52.7 years |
| Florida median age: | 42.7 years |
Zip codes: 34994.
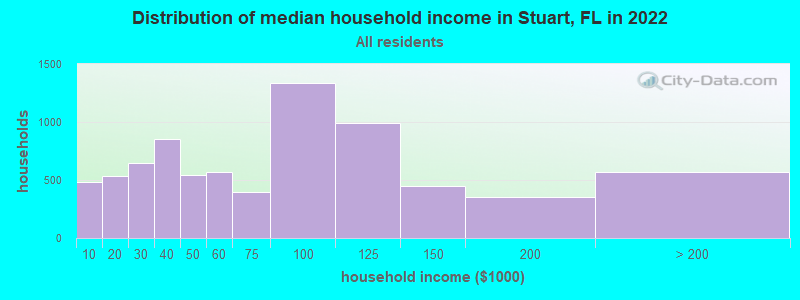
| Stuart: | $63,570 |
| FL: | $69,303 |
Estimated per capita income in 2022: $41,562 (it was $21,139 in 2000)
Stuart city income, earnings, and wages data
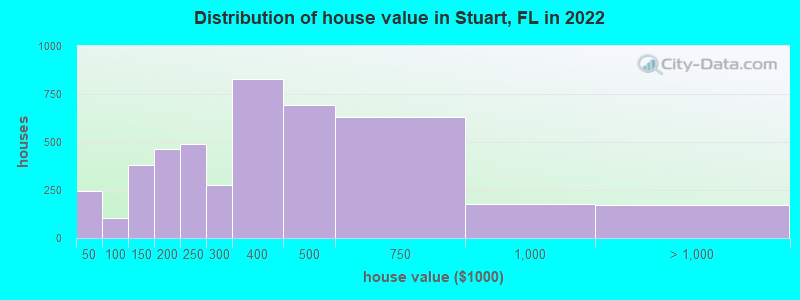
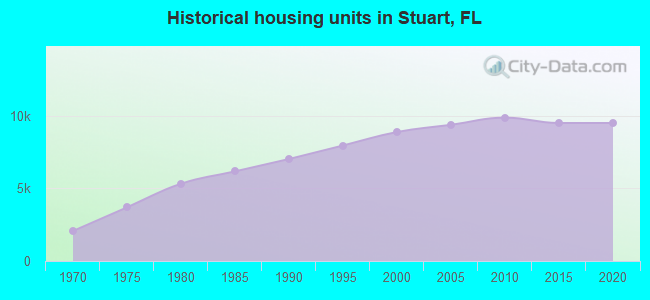
Estimated median house or condo value in 2022: $333,463 (it was $67,000 in 2000)
| Stuart: | $333,463 |
| FL: | $354,100 |
Mean prices in 2022: all housing units: $280,195; detached houses: $391,600; townhouses or other attached units: $251,258; in 3-to-4-unit structures: $232,534; in 5-or-more-unit structures: $176,408; mobile homes: $59,105
Median gross rent in 2022: $1,649.
(9.4% for White Non-Hispanic residents, 40.3% for Black residents, 22.2% for Hispanic or Latino residents, 38.6% for other race residents, 3.0% for two or more races residents)
Detailed information about poverty and poor residents in Stuart, FL


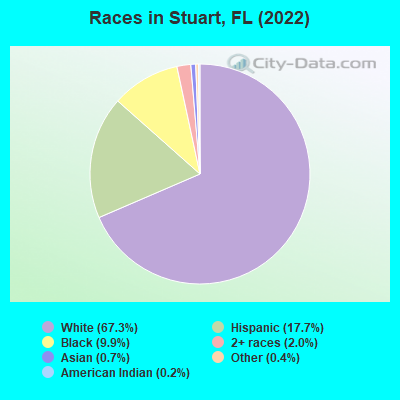
- 12,06367.3%White alone
- 3,16917.7%Hispanic
- 1,7749.9%Black alone
- 3572.0%Two or more races
- 1210.7%Asian alone
- 680.4%Other race alone
- 420.2%American Indian alone
Races in Stuart detailed stats: ancestries, foreign born residents, place of birth
According to our research of Florida and other state lists, there were 67 registered sex offenders living in Stuart, Florida as of April 26, 2024.
The ratio of all residents to sex offenders in Stuart is 250 to 1.
Type |
2009 |
2010 |
2011 |
2012 |
2013 |
2014 |
2015 |
2016 |
2017 |
2018 |
2019 |
2020 |
|---|---|---|---|---|---|---|---|---|---|---|---|---|
| Murders (per 100,000) | 3 (18.8) | 0 (0.0) | 2 (12.7) | 0 (0.0) | 0 (0.0) | 0 (0.0) | 0 (0.0) | 0 (0.0) | 0 (0.0) | 0 (0.0) | 2 (12.2) | 0 (0.0) |
| Rapes (per 100,000) | 2 (12.5) | 4 (25.7) | 5 (31.6) | 5 (31.4) | 5 (31.4) | 13 (80.3) | 5 (30.6) | 13 (78.1) | 12 (71.4) | 6 (36.0) | 13 (79.2) | 7 (42.8) |
| Robberies (per 100,000) | 22 (137.5) | 10 (64.1) | 9 (56.9) | 10 (62.8) | 11 (69.1) | 14 (86.4) | 10 (61.2) | 10 (60.1) | 8 (47.6) | 6 (36.0) | 9 (54.8) | 5 (30.6) |
| Assaults (per 100,000) | 43 (268.8) | 38 (243.7) | 42 (265.7) | 40 (251.1) | 38 (238.7) | 37 (228.4) | 69 (422.0) | 41 (246.4) | 39 (232.1) | 38 (227.7) | 29 (176.6) | 33 (201.9) |
| Burglaries (per 100,000) | 120 (750.0) | 108 (692.6) | 98 (620.0) | 79 (495.9) | 66 (414.6) | 86 (530.9) | 49 (299.7) | 68 (408.7) | 82 (488.1) | 56 (335.6) | 27 (164.4) | 36 (220.2) |
| Thefts (per 100,000) | 611 (3,819) | 560 (3,591) | 613 (3,878) | 521 (3,270) | 568 (3,568) | 527 (3,253) | 473 (2,893) | 491 (2,951) | 489 (2,911) | 428 (2,565) | 355 (2,161) | 303 (1,854) |
| Auto thefts (per 100,000) | 19 (118.8) | 19 (121.8) | 10 (63.3) | 23 (144.4) | 19 (119.3) | 32 (197.5) | 21 (128.4) | 9 (54.1) | 16 (95.2) | 9 (53.9) | 20 (121.8) | 16 (97.9) |
| Arson (per 100,000) | 2 (12.5) | 1 (6.4) | 0 (0.0) | 1 (6.3) | 0 (0.0) | 1 (6.2) | 0 (0.0) | 1 (6.0) | 1 (6.0) | 1 (6.0) | 1 (6.1) | 0 (0.0) |
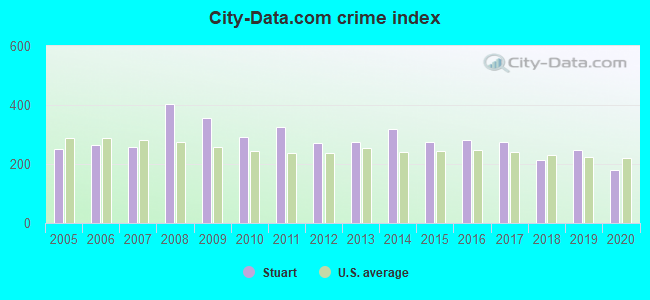
| City-Data.com crime index | 357.2 | 290.4 | 324.4 | 271.2 | 274.9 | 318.9 | 274.2 | 280.8 | 276.1 | 215.5 | 247.1 | 181.2 |
The City-Data.com crime index weighs serious crimes and violent crimes more heavily. Higher means more crime, U.S. average is 246.1. It adjusts for the number of visitors and daily workers commuting into cities.
Crime rate in Stuart detailed stats: murders, rapes, robberies, assaults, burglaries, thefts, arson
Full-time law enforcement employees in 2021, including police officers: 61 (45 officers - 39 male; 6 female).
| Officers per 1,000 residents here: | 2.68 |
| Florida average: | 2.33 |
 Recent articles from our blog. Our writers, many of them Ph.D. graduates or candidates, create easy-to-read articles on a wide variety of topics.


 | Stuart/Jensen Beach- good hospitals? (7 replies) |
| Young Family Looking to move to Port St. Lucie/Stuart from Carlsbad CA (5 replies) |
| How affordable is the Stuart area? (35 replies) |
| Moving to Stuart (28 replies) |
| Vero, PSL or Stuart (3 replies) |
| Question on Stuart Development (4 replies) |
Latest news from Stuart, FL collected exclusively by city-data.com from local newspapers, TV, and radio stations
Ancestries: American (10.9%), Italian (7.6%), German (7.3%), Irish (7.0%), English (6.1%), Haitian (3.1%).
Current Local Time: EST time zone
Elevation: 10 feet
Land area: 6.31 square miles.
Population density: 2,895 people per square mile (average).
2,356 residents are foreign born (9.8% Latin America, 1.8% Europe).
| This city: | 13.1% |
| Florida: | 21.1% |
Median real estate property taxes paid for housing units with mortgages in 2022: $2,006 (0.5%)
Median real estate property taxes paid for housing units with no mortgage in 2022: $1,819 (0.6%)
Nearest city with pop. 50,000+: Port St. Lucie, FL  (9.0 miles , pop. 88,769).
Nearest city with pop. 200,000+: Hialeah, FL (92.2 miles , pop. 226,419).
Nearest city with pop. 1,000,000+: Philadelphia, PA (932.7 miles , pop. 1,517,550).
Nearest cities:
), ), ), ), Latitude: 27.19 N, Longitude: 80.24 W
Daytime population change due to commuting: +20,097 (+112.1%)
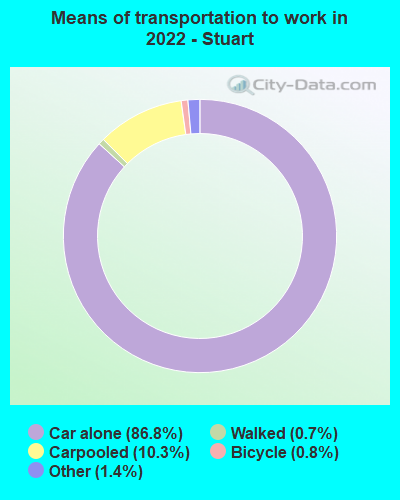
Workers who live and work in this city: 4,480 (52.9%)
Area code: 772
Stuart tourist attractions:
Stuart, Florida accommodation & food services, waste management - Economy and Business Data
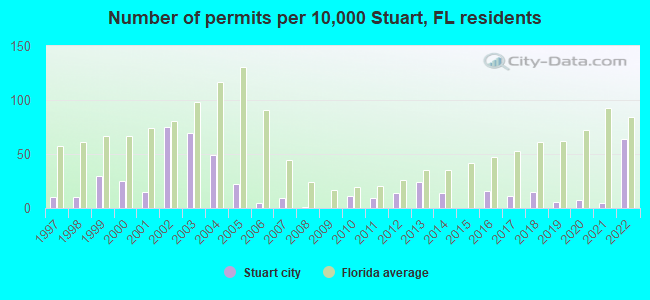
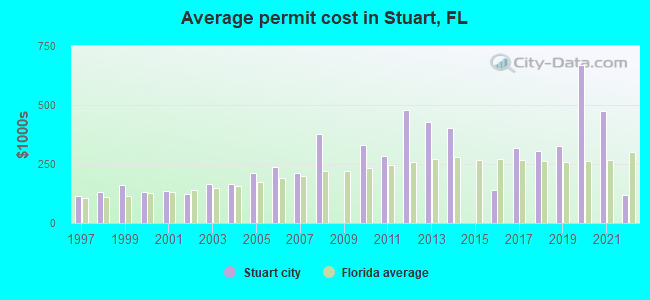
Single-family new house construction building permits:
- 2022: 93 buildings, average cost: $118,700
- 2021: 8 buildings, average cost: $476,300
- 2020: 10 buildings, average cost: $667,900
- 2019: 9 buildings, average cost: $325,000
- 2018: 22 buildings, average cost: $305,600
- 2017: 16 buildings, average cost: $319,400
- 2016: 23 buildings, average cost: $138,800
- 2014: 20 buildings, average cost: $403,000
- 2013: 35 buildings, average cost: $428,500
- 2012: 20 buildings, average cost: $476,600
- 2011: 13 buildings, average cost: $285,500
- 2010: 16 buildings, average cost: $330,200
- 2008: 2 buildings, average cost: $376,000
- 2007: 13 buildings, average cost: $210,400
- 2006: 8 buildings, average cost: $235,600
- 2005: 32 buildings, average cost: $210,800
- 2004: 71 buildings, average cost: $164,500
- 2003: 101 buildings, average cost: $164,200
- 2002: 110 buildings, average cost: $121,900
- 2001: 22 buildings, average cost: $134,900
- 2000: 37 buildings, average cost: $131,700
- 1999: 44 buildings, average cost: $160,400
- 1998: 15 buildings, average cost: $130,100
- 1997: 14 buildings, average cost: $115,100
| Here: | 2.9% |
| Florida: | 2.9% |
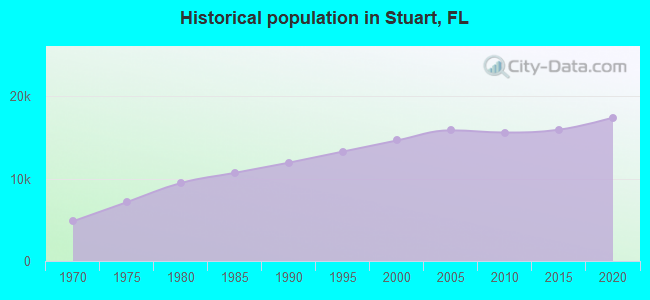
Population change in the 1990s: +1,921 (+15.1%).
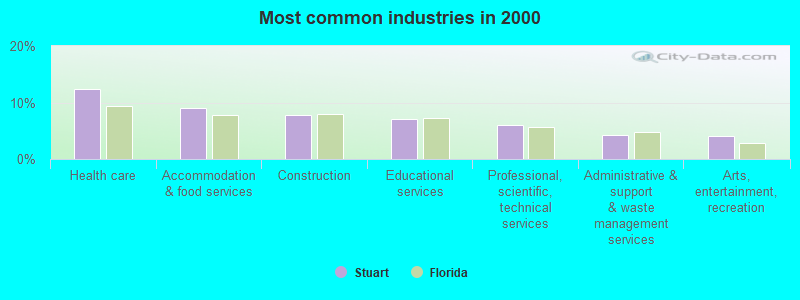
- Health care (12.3%)
- Accommodation & food services (8.9%)
- Construction (7.9%)
- Educational services (7.0%)
- Professional, scientific, technical services (6.0%)
- Administrative & support & waste management services (4.2%)
- Arts, entertainment, recreation (4.1%)
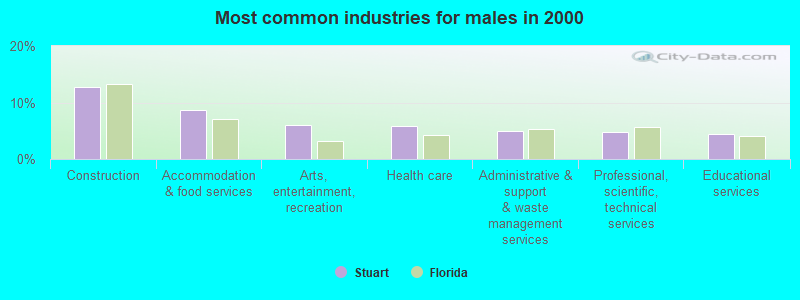
- Construction (12.8%)
- Accommodation & food services (8.7%)
- Arts, entertainment, recreation (6.1%)
- Health care (5.9%)
- Administrative & support & waste management services (4.9%)
- Professional, scientific, technical services (4.7%)
- Educational services (4.5%)
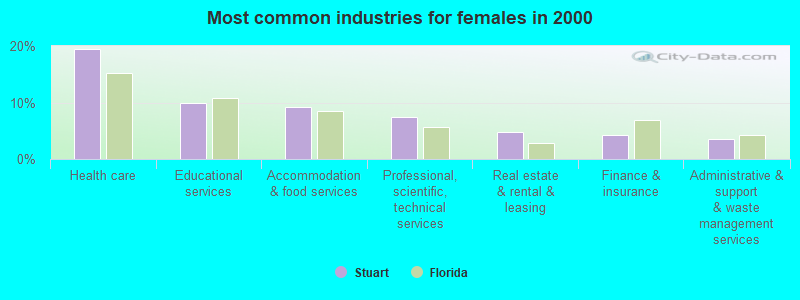
- Health care (19.4%)
- Educational services (9.8%)
- Accommodation & food services (9.3%)
- Professional, scientific, technical services (7.4%)
- Real estate & rental & leasing (4.8%)
- Finance & insurance (4.3%)
- Administrative & support & waste management services (3.5%)
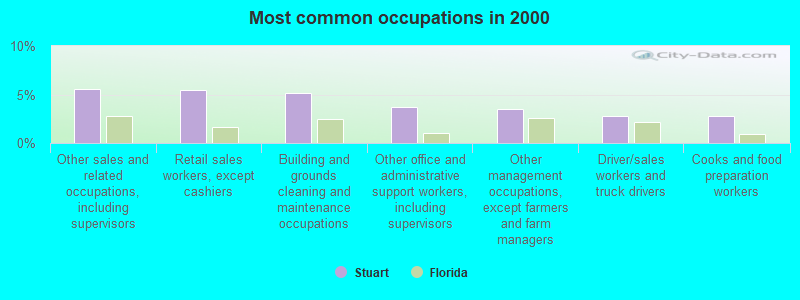
- Other sales and related occupations, including supervisors (5.6%)
- Retail sales workers, except cashiers (5.5%)
- Building and grounds cleaning and maintenance occupations (5.1%)
- Other office and administrative support workers, including supervisors (3.7%)
- Other management occupations, except farmers and farm managers (3.5%)
- Driver/sales workers and truck drivers (2.7%)
- Cooks and food preparation workers (2.7%)
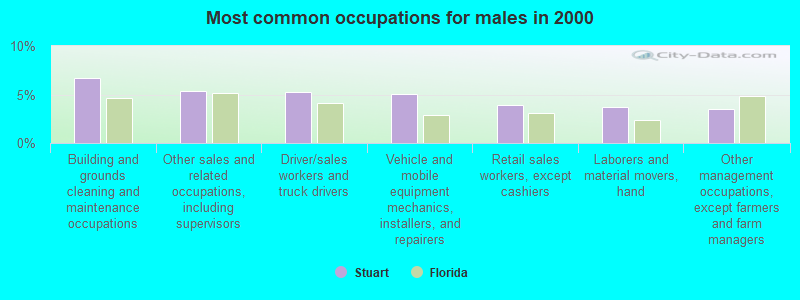
- Building and grounds cleaning and maintenance occupations (6.7%)
- Other sales and related occupations, including supervisors (5.3%)
- Driver/sales workers and truck drivers (5.2%)
- Vehicle and mobile equipment mechanics, installers, and repairers (5.0%)
- Retail sales workers, except cashiers (3.9%)
- Laborers and material movers, hand (3.7%)
- Other management occupations, except farmers and farm managers (3.5%)
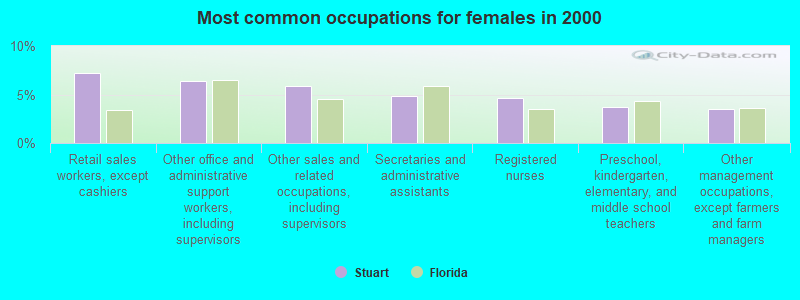
- Retail sales workers, except cashiers (7.2%)
- Other office and administrative support workers, including supervisors (6.3%)
- Other sales and related occupations, including supervisors (5.9%)
- Secretaries and administrative assistants (4.8%)
- Registered nurses (4.6%)
- Preschool, kindergarten, elementary, and middle school teachers (3.8%)
- Other management occupations, except farmers and farm managers (3.5%)
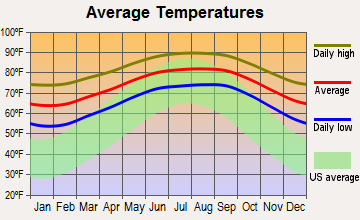
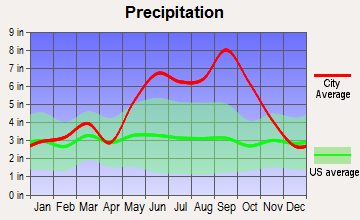
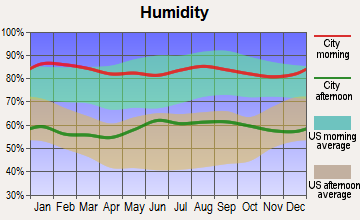
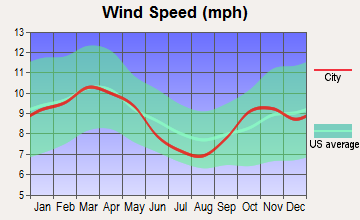
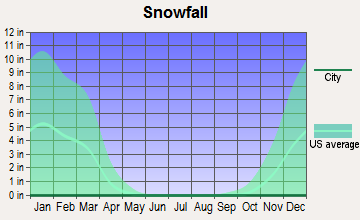
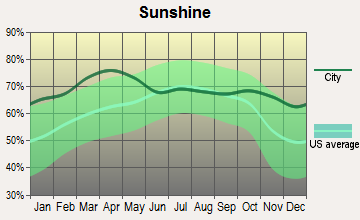
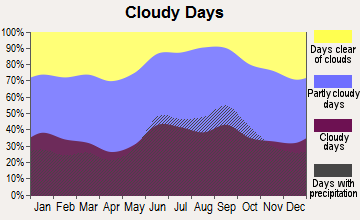
Average climate in Stuart, Florida
Based on data reported by over 4,000 weather stations
|
|


(lower is better)
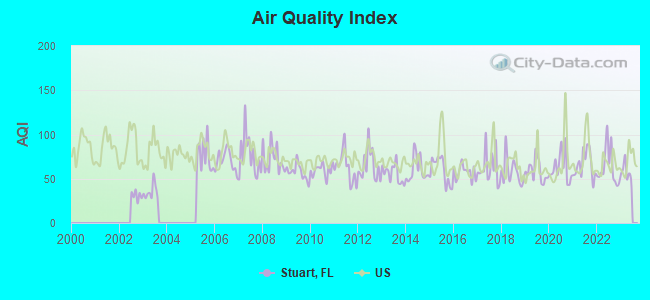
Air Quality Index (AQI) level in 2022 was 63.1. This is about average.
| City: | 63.1 |
| U.S.: | 72.6 |
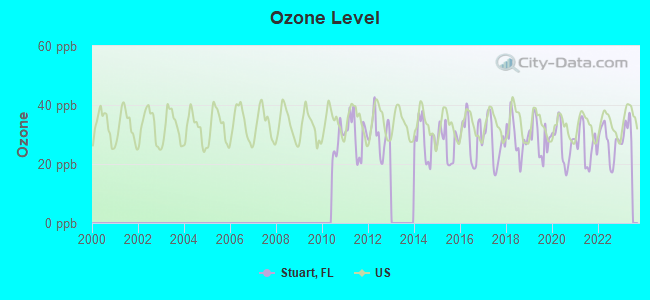
Ozone [ppb] level in 2022 was 27.1. This is better than average. Closest monitor was 1.4 miles away from the city center.
| City: | 27.1 |
| U.S.: | 33.3 |
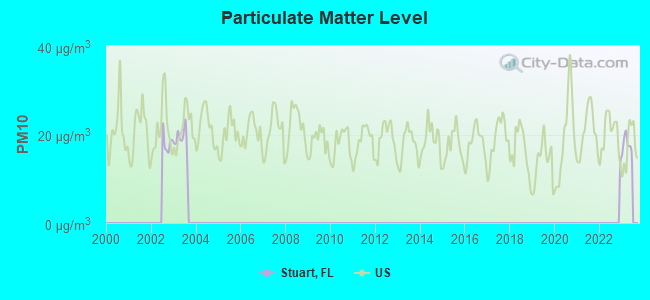
Particulate Matter (PM10) [µg/m3] level in 2003 was 18.9. This is about average. Closest monitor was 1.4 miles away from the city center.
| City: | 18.9 |
| U.S.: | 19.2 |
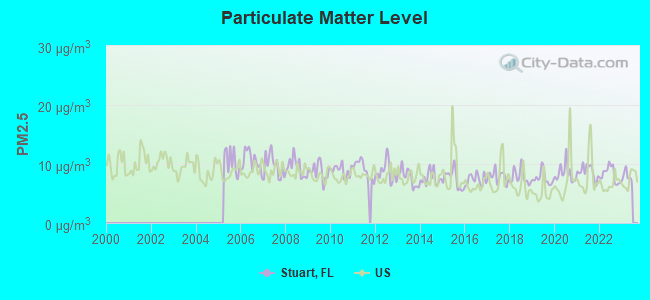
Particulate Matter (PM2.5) [µg/m3] level in 2022 was 8.20. This is about average. Closest monitor was 1.4 miles away from the city center.
| City: | 8.20 |
| U.S.: | 8.11 |
Tornado activity:
Stuart-area historical tornado activity is below Florida state average. It is 34% smaller than the overall U.S. average.
On 9/18/1954, a category F3 (max. wind speeds 158-206 mph) tornado 16.6 miles away from the Stuart city center killed 2 people and injured 2 people and caused between $5000 and $50,000 in damages.
On 10/19/1958, a category F3 tornado 17.0 miles away from the city center killed one person and injured 24 people and caused between $50,000 and $500,000 in damages.
Earthquake activity:
Stuart-area historical earthquake activity is above Florida state average. It is 93% smaller than the overall U.S. average.On 9/10/2006 at 14:56:08, a magnitude 5.9 (5.9 MB, 5.5 MS, 5.8 MW, Class: Moderate, Intensity: VI - VII) earthquake occurred 399.9 miles away from Stuart center
On 6/23/2016 at 17:20:29, a magnitude 3.8 (3.8 ML, Class: Light, Intensity: II - III) earthquake occurred 199.8 miles away from Stuart center
On 7/16/2016 at 20:00:10, a magnitude 3.7 (3.7 MB) earthquake occurred 184.6 miles away from the city center
On 9/21/2016 at 16:30:52, a magnitude 3.8 (3.8 ML) earthquake occurred 204.3 miles away from Stuart center
On 9/4/2016 at 18:29:29, a magnitude 3.8 (3.8 ML) earthquake occurred 205.3 miles away from the city center
On 2/22/1992 at 04:21:34, a magnitude 3.2 (3.2 MB, Depth: 6.2 mi) earthquake occurred 101.7 miles away from Stuart center
Magnitude types: body-wave magnitude (MB), local magnitude (ML), surface-wave magnitude (MS), moment magnitude (MW)
Natural disasters:
The number of natural disasters in Martin County (28) is a lot greater than the US average (15).Major Disasters (Presidential) Declared: 14
Emergencies Declared: 7
Causes of natural disasters: Hurricanes: 17, Fires: 6, Tropical Storms: 3, Floods: 2, Freeze: 1, Storm: 1, Tornado: 1, Wind: 1, Other: 1 (Note: some incidents may be assigned to more than one category).
Main business address for: NUCO2 INC /FL (WHOLESALE-CHEMICALS & ALLIED PRODUCTS), SEACOAST BANKING CORP OF FLORIDA (STATE COMMERCIAL BANKS).
Hospitals in Stuart:
- FLORIDA MENTOR (1000 EAST 14TH STREET)
- HOSPICE OF MARTIN AND SAINT LUCI (2300 SE OCEAN BOULEVARD)
- HOSPICE OF THE TREASURE COAST (1201 SE INDIAN STREET)
- MARTIN MEDICAL CENTER (Voluntary non-profit - Private, provides emergency services, 200 SE HOSPITAL AVE)
Nursing Homes in Stuart:
- HEARTLAND HEALTH CARE CENTER (800 SE CENTRAL PARKWAY)
- MARTIN NURSING AND RESTORATIVE CARE CENTER (6011 SE TOWER DR)
- PARKWAY HEALTH AND REHABILITATION CENTER (800 SE CENTRAL PKWY)
- SALERNO BAY MANOR (4801 SE COVE ROAD)
- STUART NURSING AND RESTORATIVE CARE CENTER (1500 PALM BEACH RD)
Dialysis Facilities in Stuart:
Home Health Centers in Stuart:
- ALOHA HOME CARE LLC (2690 SE WILLOUGHBY BLVD)
- ANCHOR HOME HEALTH SERVICES (3725 SE OCEAN BLVD SUITE 205)
- FLAGSHIP HOME HEALTH OF STUART (900 EAST OCEAN BOULEVARD)
- HEALTH AT HOME (10 SE CENTRAL PKWY, SUITE 307)
- K AND D HOME HEALTH CARE CORP (2440 SE FEDERAL HIGHWAY STE U)
- VISITING NURSE ASSOCIATION OF FLORIDA INC (2400 SE MONTEREY ROAD, SUITE 300)
Airports and heliports located in Stuart:
- Witham Field Airport (SUA) (Runways: 3, Air Taxi Ops: 4,460, Itinerant Ops: 63,063, Local Ops: 52,798, Military Ops: 235)
- Naked Lady Ranch Airport (64FA) (Runways: 2)
- Floridian National Golf Club, Llc Heliport (65FL)
- Martin Memorial Medical Center Heliport (44FL)
Operable nuclear power plants near Stuart:
- 13 miles: St. Lucie 1 and 2 in Hutchinson Island, FL.
Colleges/universities with over 2000 students nearest to Stuart:
- Indian River State College (about 18 miles; Fort Pierce, FL; Full-time enrollment: 12,211)
- Palm Beach Atlantic University (about 36 miles; West Palm Beach, FL; FT enrollment: 2,868)
- Palm Beach State College (about 42 miles; Lake Worth, FL; FT enrollment: 19,938)
- Lynn University (about 57 miles; Boca Raton, FL; FT enrollment: 2,151)
- Florida Atlantic University (about 58 miles; Boca Raton, FL; FT enrollment: 24,403)
- Florida Institute of Technology-Online (about 65 miles; Melbourne, FL; FT enrollment: 3,046)
- Florida Institute of Technology (about 65 miles; Melbourne, FL; FT enrollment: 4,452)
Biggest public high schools in Stuart:
- PROJECT SEARCH (Students: 1,072, Location: 200 SE HOSPITAL AVE, Grades: 12)
- RIVERBEND ACADEMY (Students: 957, Location: 500 E OCEAN BLVD, Grades: PK-12)
- SPECTRUM JUNIOR/SENIOR HIGH SCHOOL (Students: 866, Location: 800 SE BAHAMA AVE, Grades: 6-12)
- ESE HOMEBOUND (Students: 609, Location: 5OO E OCEAN BLVD, Grades: PK-12)
- SOUTH FORK HIGH SCHOOL (Students: 329, Location: 10000 SW BULLDOG WAY, Grades: 9-12)
- MARTIN COUNTY HIGH SCHOOL (Students: 311, Location: 2801 S KANNER HWY, Grades: 9-12)
- CLARK ADVANCED LEARNING CENTER (Students: 71, Location: 2400 SE SALERNO RD, Grades: 10-12, Charter school)
- CHALLENGER SCHOOL (Location: 5150 SE WILLOUGHBY BLVD, Grades: PK-12)
- MARTIN COUNTY JAIL (Location: 800 SOUTHEAST MONTEREY ROAD, Grades: 9-12)
- MARTIN COUNTY GIRLS ACADEMY (Location: 800 SW MONTEREY RD, Grades: 6-12)
Private high schools in Stuart:
Public elementary/middle schools in Stuart:
- FELIX A WILLIAMS ELEMENTARY SCHOOL (Students: 1,135, Location: 401 NW BAKER RD, Grades: PK-5)
- PORT SALERNO ELEMENTARY SCHOOL (Students: 597, Location: 3260 SE LIONEL TER, Grades: KG-5)
- MURRAY MIDDLE SCHOOL (Students: 534, Location: 4400 SE MURRAY ST, Grades: 6-8)
- DR. DAVID L. ANDERSON MIDDLE SCHOOL (Students: 418, Location: 7000 SE ATLANTIC RIDGE DR, Grades: 6-8)
- STUART MIDDLE SCHOOL (Students: 281, Location: 575 SE GEORGIA AVE, Grades: 6-8)
- J. D. PARKER SCHOOL OF TECHNOLOGY (Students: 202, Location: 1010 SE 10TH ST, Grades: PK-5)
- CRYSTAL LAKE ELEMENTARY SCHOOL (Students: 61, Location: 2095 SW 96TH ST, Grades: PK-5)
- PINEWOOD ELEMENTARY SCHOOL (Location: 5200 SE WILLOUGHBY BLVD, Grades: KG-5)
- THE HOPE CHARTER CENTER FOR AUTISM (Location: 1695 SE INDIAN ST, Grades: PK-2, Charter school)
Private elementary/middle schools in Stuart:
- ST JOSEPH CATHOLIC SCHOOL (Students: 294, Location: 1200 E 10TH ST, Grades: PK-8)
- REDEEMER LUTHERAN SCHOOL (Students: 209, Location: 2450 SE OCEAN BLVD, Grades: PK-8)
- FIRST BAPTIST CHRISTIAN SCHOOL (Students: 152, Location: 201 W OCEAN BLVD, Grades: KG-8)
- BRIDGES MONTESSORI (Students: 109, Location: 51 SE CENTRAL PKWY, Grades: PK-5)
- SAMARITAN HOUSE FOR BOYS (Students: 16, Location: 1490 SE COVE RD, Grades: 3-8, Boys only)
Points of interest:
Notable locations in Stuart: Treasure Coast Square (A), Stuart Centre (B), Stuart Heritage Museum (C), Martin County Public Library (D), Martin County Fire Marshall (E), City of Stuart Fire Rescue Station 2 (F), City of Stuart Fire Rescue Station 1 Headquarters (G), Stuart Police Department (H), Martin County Sheriff's Office (I). Display/hide their locations on the map
Shopping Center: Stuart Shopping Center (1). Display/hide its location on the map
Main business address in Stuart include: NUCO2 INC /FL (A), SEACOAST BANKING CORP OF FLORIDA (B). Display/hide their locations on the map
Churches in Stuart include: Treasure Coast Presbyterian Church (A), Temple Beit Hayam (B), Stuart Congregational United Church of Christ (C), Saint Paul African Methodist Episcopal Church (D), Mount Calvary Baptist Church (E), Lake Street Church of Christ (F), First Church of Christ Scientist (G), First Baptist Church of Stuart (H), Church of God by Faith (I). Display/hide their locations on the map
Cemetery: Fern Hill Cemetery (1). Display/hide its location on the map
Rivers and creeks: North Fork Saint Lucie River (A), Frazier Creek (B), Poppolton Creek (C), South Fork Saint Lucie River (D), Krueger Creek (E). Display/hide their locations on the map
Tourist attractions: Gilbert's Bar House of Refuge Museum (301 Southeast Macarthur Boulevard), The Studio Fine Arts Center & Gallery (Art Museums; 333 South East Tressler Drive), Allgolf (Amusement & Theme Parks; 6801 South Kanner Highway), Deggeller Amusement Company (4034 Southeast Old Street Lucie Boulevard), Bayley Enterprises (Arcades & Amusements; 5664 SE Pot-O-Gold Place).
Hotel: Bourbon Street Cafe & Lounge (1200 Southeast Federal Highway).
Courts: Stuart City - Recreation Dept- Court House Cultural Center (80 Southeast Ocean Boulevard), Martin County Clerk of the Circuit Court - Appellate Division (16550 Southwest Warfield Boulevard), Colony Court Motel (1007 Northwest Federal Highway), Florida State - Judicial- County Court Martin- Judges- Harper David (100 Southeast Ocean Boulevard).
Birthplace of: Kathy Rinaldi - Female tennis player, Chris Marquette - Child actor, Corey McIntyre - 2005 NFL player (Cleveland Browns, born: Jan 25, 1979), Derek Fathauer - Professional golfer, Ed Hearn (baseball) - Baseball player, Howard Porter (basketball) - Basketball player, Jack Walrath - Jazz Trumpeter, James Davis - 2005 NFL player (Detroit Lions, born: Apr 26, 1979), Scott Proctor - 2005 Major League Baseball player (New York Yankees, born: Jan 2, 1977), Lee Rinker - PGA Tour Golf player (born: 11/10/60).
Drinking water stations with addresses in Stuart and their reported violations in the past:
GOLDEN HILLS MHP (Population served: 323, Groundwater):Past monitoring violations:CORA-WIN COVE (Population served: 165, Groundwater):
- Failure to Conduct Assessment Monitoring - In DEC-2011, Contaminant: E. COLI. Follow-up actions: St Violation/Reminder Notice (JAN-31-2012)
Past health violations:NORTH RIVER SHORES TENNIS CLUB (Population served: 150, Groundwater):Past monitoring violations:
- MCL, Average - Between JUL-2007 and SEP-2007, Contaminant: Total Haloacetic Acids (HAA5). Follow-up actions: St Compliance achieved (MAR-18-2008)
- MCL, Average - Between JUL-2007 and SEP-2007, Contaminant: TTHM. Follow-up actions: St Compliance achieved (MAR-18-2008)
- MCL, Average - Between APR-2007 and JUN-2007, Contaminant: Total Haloacetic Acids (HAA5). Follow-up actions: St Public Notif received (JUL-07-2007), St Compliance achieved (MAR-18-2008)
- MCL, Average - Between APR-2007 and JUN-2007, Contaminant: TTHM. Follow-up actions: St Public Notif received (JUL-07-2007), St Compliance achieved (MAR-18-2008)
- MCL, Average - Between JAN-2007 and MAR-2007, Contaminant: TTHM. Follow-up actions: St Public Notif received (APR-07-2007), St Compliance achieved (MAR-18-2008)
- MCL, Average - Between JAN-2007 and MAR-2007, Contaminant: Total Haloacetic Acids (HAA5). Follow-up actions: St Public Notif received (APR-07-2007), St Compliance achieved (MAR-18-2008)
- 5 other older health violations
- One regular monitoring violation
Past monitoring violations:TIMER POWERS PARK (Population served: 100, Groundwater):
- One routine major monitoring violation
Past monitoring violations:LOG HARBOR CONDOMINIUMS (Population served: 60, Groundwater):
- One routine major monitoring violation
Past monitoring violations:PJ'S RV PARK (Population served: 30, Groundwater):
- Monitoring, Repeat Major (TCR) - Between JAN-2006 and MAR-2006, Contaminant: Coliform (TCR)
- One regular monitoring violation
Past monitoring violations:OPEN GATE TRAILER PARK (Population served: 25, Groundwater):
- One routine major monitoring violation
- One minor monitoring violation
- One regular monitoring violation
Past health violations:TWISTEE TREAT OF P.S.L. (Population served: 25, Groundwater):Past monitoring violations:
- MCL, Average - Between JAN-2006 and MAR-2006, Contaminant: Total Haloacetic Acids (HAA5). Follow-up actions: St Compliance achieved (APR-25-2006)
- MCL, Average - Between JAN-2006 and MAR-2006, Contaminant: TTHM. Follow-up actions: St Compliance achieved (APR-25-2006)
- MCL, Average - Between OCT-2005 and DEC-2005, Contaminant: TTHM. Follow-up actions: St Violation/Reminder Notice (OCT-12-2005), St Public Notif received (JAN-09-2006), St Compliance Meeting conducted (FEB-15-2006), St Compliance achieved (APR-25-2006)
- MCL, Average - Between OCT-2005 and DEC-2005, Contaminant: Total Haloacetic Acids (HAA5). Follow-up actions: St Violation/Reminder Notice (OCT-12-2005), St Public Notif received (JAN-09-2006), St Compliance Meeting conducted (FEB-15-2006), St Compliance achieved (APR-25-2006)
- MCL, Average - Between JUL-2005 and SEP-2005, Contaminant: Total Haloacetic Acids (HAA5). Follow-up actions: St Violation/Reminder Notice (OCT-12-2005), St Compliance Meeting conducted (FEB-15-2006), St Compliance achieved (APR-25-2006)
- MCL, Average - Between JUL-2005 and SEP-2005, Contaminant: TTHM. Follow-up actions: St Violation/Reminder Notice (OCT-12-2005), St Compliance Meeting conducted (FEB-15-2006), St Compliance achieved (APR-25-2006)
- 2 other older health violations
- Failure to Conduct Assessment Monitoring - Between APR-2014 and JUN-2014, Contaminant: E. COLI
- Failure to Conduct Assessment Monitoring - Between OCT-2013 and DEC-2013, Contaminant: E. COLI
- 11 routine major monitoring violations
- One minor monitoring violation
- 4 regular monitoring violations
Past monitoring violations:
- Failure to Conduct Assessment Monitoring - Between JAN-2012 and MAR-2012, Contaminant: E. COLI
- 3 routine major monitoring violations
- One regular monitoring violation
| This city: | 2.0 people |
| Florida: | 2.5 people |
| This city: | 47.3% |
| Whole state: | 65.2% |
| This city: | 7.1% |
| Whole state: | 7.3% |
Likely homosexual households (counted as self-reported same-sex unmarried-partner households)
- Lesbian couples: 0.3% of all households
- Gay men: 0.2% of all households
People in group quarters in Stuart in 2010:
- 228 people in nursing facilities/skilled-nursing facilities
- 150 people in other noninstitutional facilities
- 25 people in group homes intended for adults
- 18 people in correctional facilities intended for juveniles
- 4 people in in-patient hospice facilities
People in group quarters in Stuart in 2000:
- 487 people in local jails and other confinement facilities (including police lockups)
- 270 people in nursing homes
- 184 people in other noninstitutional group quarters
- 40 people in unknown juvenile institutions
- 26 people in other nonhousehold living situations
- 22 people in homes or halfway houses for drug/alcohol abuse
- 19 people in homes for the mentally retarded
- 14 people in homes for the mentally ill
- 13 people in hospitals/wards and hospices for chronically ill
- 13 people in hospices or homes for chronically ill
Banks with most branches in Stuart (2011 data):
- Wells Fargo Bank, National Association: Hutchinson Island Branch, Indian Street Branch, Stuart Main Branch, Salerno Village Square Branch. Info updated 2011/04/05: Bank assets: $1,161,490.0 mil, Deposits: $905,653.0 mil, headquarters in Sioux Falls, SD, positive income, 6395 total offices, Holding Company: Wells Fargo & Company
- Bank of America, National Association: Cove Road Branch, Stuart Plaza Branch, Sewalls Point Branch, Stuart Branch. Info updated 2009/11/18: Bank assets: $1,451,969.3 mil, Deposits: $1,077,176.8 mil, headquarters in Charlotte, NC, positive income, 5782 total offices, Holding Company: Bank Of America Corporation
- Seacoast National Bank: at 815 Colorado Avenue, Cove Road Branch, Wedgewood Commons Branch, East Ocean Boulevard Branch. Info updated 2006/10/25: Bank assets: $2,135.8 mil, Deposits: $1,726.5 mil, local headquarters, positive income, Commercial Lending Specialization, 42 total offices, Holding Company: Capgen Capital Group Iii Lp
- SunTrust Bank: Stuart Financial Center Branch, Stuart Wal-Mart Branch, Osceola Street Branch, Kanner Crossing Branch. Info updated 2010/05/27: Bank assets: $171,291.7 mil, Deposits: $129,833.2 mil, headquarters in Atlanta, GA, positive income, Commercial Lending Specialization, 1716 total offices, Holding Company: Suntrust Banks, Inc.
- PNC Bank, National Association: Martin Square Branch, East Ocean Branch, Kanner Branch. Info updated 2012/03/20: Bank assets: $263,309.6 mil, Deposits: $197,343.0 mil, headquarters in Wilmington, DE, positive income, Commercial Lending Specialization, 3085 total offices, Holding Company: Pnc Financial Services Group, Inc., The
- Branch Banking and Trust Company: Stuart Fl Branch at 1910 Se Federal Highway, branch established on 2005/11/22. Info updated 2010/03/29: Bank assets: $168,867.6 mil, Deposits: $127,549.5 mil, headquarters in Winston Salem, NC, positive income, Commercial Lending Specialization, 1793 total offices, Holding Company: Bb&T Corporation
- The Northern Trust Company: Stuart Branch at 2201 Southeast Kingswood Terrace, branch established on 1996/04/01. Info updated 2011/10/07: Bank assets: $99,831.2 mil, Deposits: $84,041.7 mil, headquarters in Chicago, IL, positive income, International Specialization, 91 total offices, Holding Company: Northern Trust Corporation
- BankUnited, National Association: Stuart Branch at 3316 Southeast Federal Highway, branch established on 2004/08/23. Info updated 2012/03/05: Bank assets: $11,197.9 mil, Deposits: $7,515.1 mil, headquarters in Miami Lakes, FL, positive income, 82 total offices
- Comerica Bank: Stuart Branch at 800 Se Monterey Commons Blvd Ste 102, branch established on 2006/02/13. Info updated 2011/07/29: Bank assets: $60,970.5 mil, Deposits: $48,300.9 mil, headquarters in Dallas, TX, positive income, Commercial Lending Specialization, 497 total offices, Holding Company: Comerica Incorporated
- 8 other banks with 8 local branches
For population 15 years and over in Stuart:
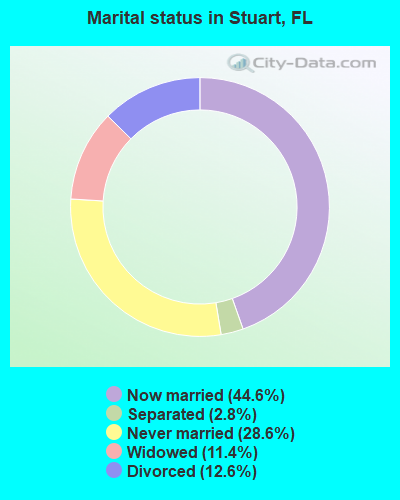
- Never married: 28.6%
- Now married: 44.6%
- Separated: 2.8%
- Widowed: 11.4%
- Divorced: 12.6%
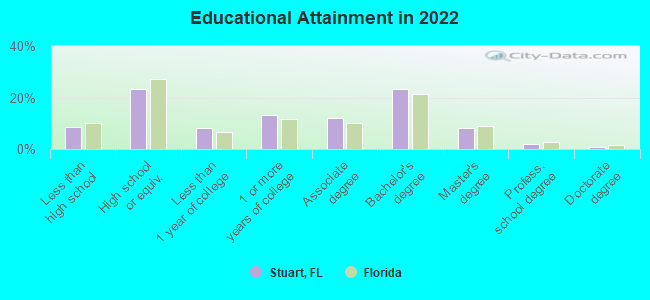
For population 25 years and over in Stuart:
- High school or higher: 92.5%
- Bachelor's degree or higher: 32.1%
- Graduate or professional degree: 11.0%
- Unemployed: 4.6%
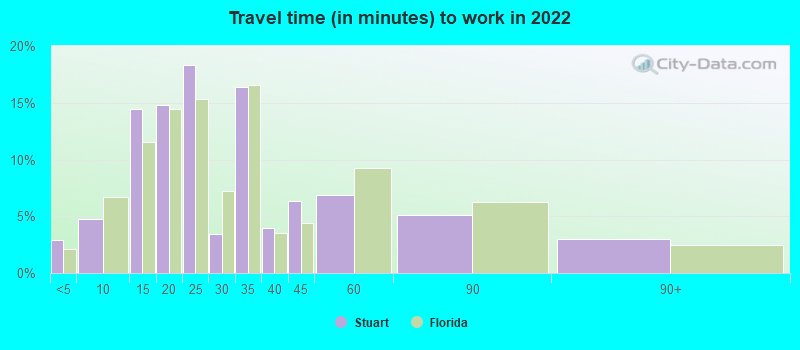
- Mean travel time to work (commute): 22.9 minutes
| Here: | 10.6 |
| Florida average: | 12.2 |
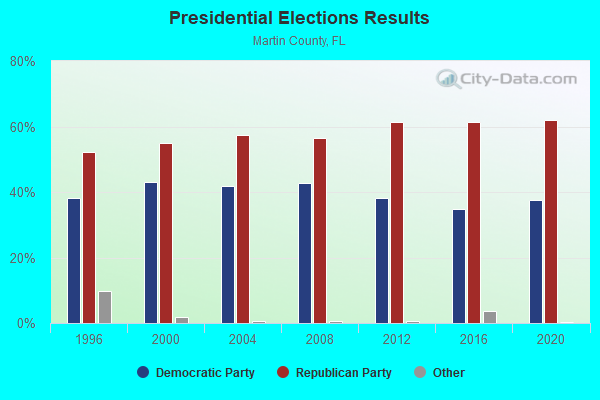
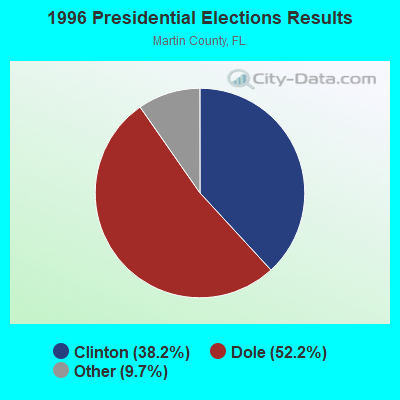
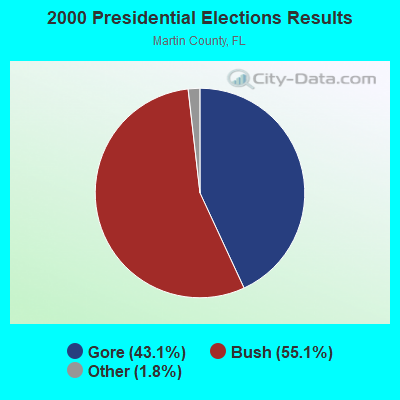
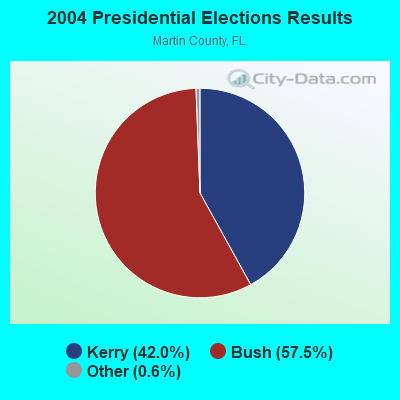
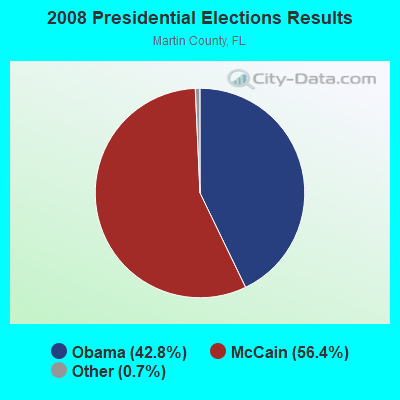
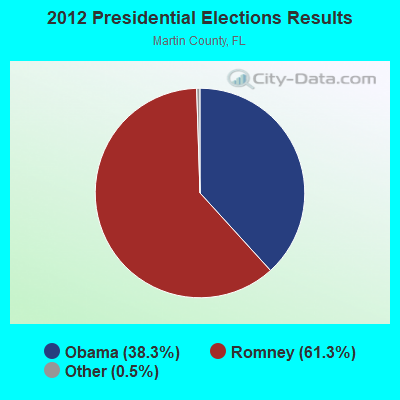
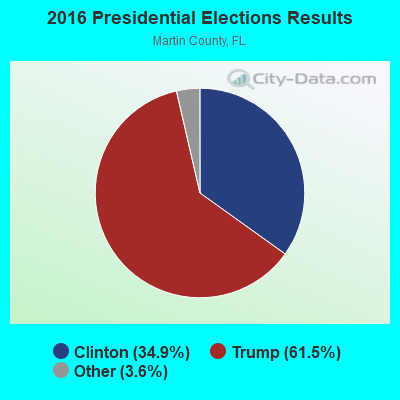
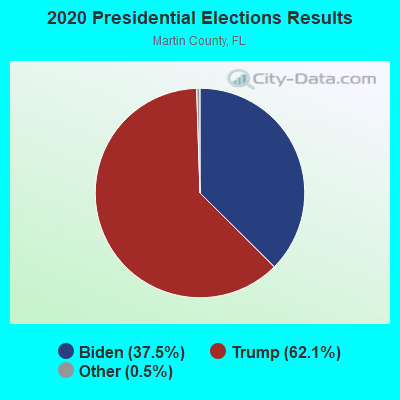
Graphs represent county-level data. Detailed 2008 Election Results
Neighborhoods in Stuart:
(Stuart, Florida Neighborhood Map)- 95 Riverside neighborhood
- Air Ref Building neighborhood
- Ault Acres neighborhood
- Brone Stuart Trade Center neighborhood
- Chalets of Salerno neighborhood
- Commerce Bank neighborhood
- Cove Lakes neighborhood
- Cove Road Commercial Center neighborhood
- Crystal Lake Estates South neighborhood
- Egret Pond neighborhood
- Ellipse neighborhood
- Everglades Plantation neighborhood
- Galleon on the River neighborhood
- Gran Park West neighborhood
- Hammock Ridge neighborhood
- Harmony Ranch neighborhood
- Hunter Lake neighborhood
- Hurricane Harbour neighborhood
- Inlet Isle neighborhood
- Kanner Commercial Center neighborhood
- Kanner Professional Center neighborhood
- Kanner Square neighborhood
- Leach Estates neighborhood
- Lost River Coach Homes neighborhood
- Lost River Manors neighborhood
- Mariner Sands neighborhood
- Mariner Village Town Homes neighborhood
- River Marina Townhomes neighborhood
- River Run Industrial Park neighborhood
- Salerno Village Shopping Center neighborhood
- Sandy Cove Plaza neighborhood
- Summerfield neighborhood
- Sunshine Mobile Home Park neighborhood
- Tres Belle neighborhood
- Tropical Business Park neighborhood
- Tuckers Cove neighborhood
- Venetian Villages neighborhood
- Waterside Commons neighborhood
- Whitemarsh Reserve neighborhood
- Woodmill Pond neighborhood
Religion statistics for Stuart, FL (based on Martin County data)
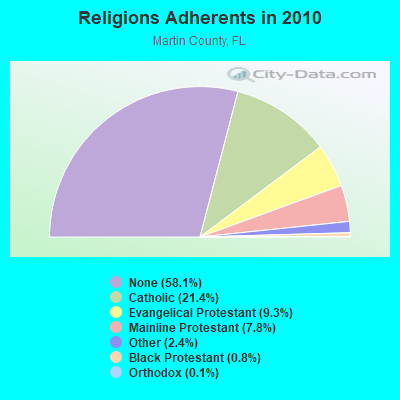
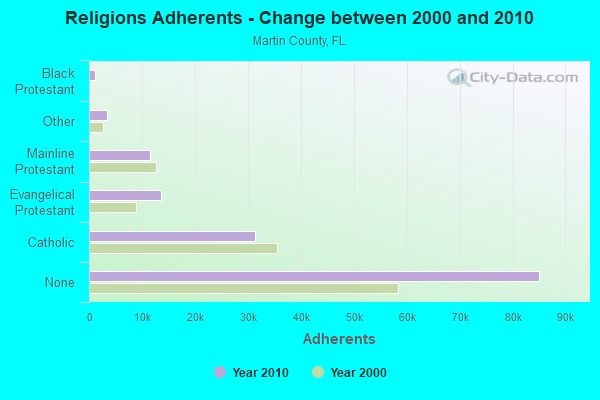
| Religion | Adherents | Congregations |
|---|---|---|
| Catholic | 31,282 | 6 |
| Evangelical Protestant | 13,636 | 68 |
| Mainline Protestant | 11,467 | 19 |
| Other | 3,454 | 15 |
| Black Protestant | 1,198 | 8 |
| Orthodox | 200 | 1 |
| None | 85,081 | - |
Food Environment Statistics:
| Here: | 2.02 / 10,000 pop. |
| Florida: | 2.04 / 10,000 pop. |
| Martin County: | 0.07 / 10,000 pop. |
| Florida: | 0.11 / 10,000 pop. |
| This county: | 1.22 / 10,000 pop. |
| State: | 1.28 / 10,000 pop. |
| This county: | 3.46 / 10,000 pop. |
| Florida: | 3.04 / 10,000 pop. |
| This county: | 11.82 / 10,000 pop. |
| Florida: | 7.45 / 10,000 pop. |
| Martin County: | 8.9% |
| State: | 9.2% |
| This county: | 20.3% |
| Florida: | 23.7% |
| This county: | 16.5% |
| Florida: | 14.0% |
Health and Nutrition:
| This city: | 53.7% |
| State: | 51.4% |
| Stuart: | 51.0% |
| Florida: | 49.4% |
| Stuart: | 28.4 |
| Florida: | 28.6 |
| Stuart: | 18.3% |
| Florida: | 19.5% |
| This city: | 10.9% |
| Florida: | 10.7% |
| Here: | 7.0 |
| Florida: | 6.9 |
| This city: | 34.6% |
| Florida: | 34.7% |
| Stuart: | 57.7% |
| State: | 57.0% |
| Stuart: | 76.9% |
| Florida: | 79.2% |
More about Health and Nutrition of Stuart, FL Residents
| Local government employment and payroll (March 2022) | |||||
| Function | Full-time employees | Monthly full-time payroll | Average yearly full-time wage | Part-time employees | Monthly part-time payroll |
|---|---|---|---|---|---|
| Police Protection - Officers | 42 | $300,723 | $85,921 | 1 | $384 |
| Firefighters | 42 | $342,788 | $97,939 | 0 | $0 |
| Water Supply | 29 | $152,219 | $62,987 | 0 | $0 |
| Other and Unallocable | 28 | $139,163 | $59,641 | 0 | $0 |
| Solid Waste Management | 17 | $144,489 | $101,992 | 0 | $0 |
| Police - Other | 15 | $73,330 | $58,664 | 4 | $7,215 |
| Financial Administration | 14 | $88,223 | $75,620 | 0 | $0 |
| Streets and Highways | 13 | $66,183 | $61,092 | 0 | $0 |
| Other Government Administration | 8 | $56,888 | $85,332 | 1 | $1,541 |
| Parks and Recreation | 5 | $20,450 | $49,080 | 7 | $26,385 |
| Sewerage | 4 | $16,824 | $50,472 | 0 | $0 |
| Housing and Community Development (Local) | 3 | $16,148 | $64,592 | 0 | $0 |
| Judicial and Legal | 2 | $15,616 | $93,696 | 0 | $0 |
| Fire - Other | 1 | $4,842 | $58,104 | 0 | $0 |
| Local Libraries | 0 | $0 | 8 | $27,926 | |
| Transit | 0 | $0 | 5 | $6,004 | |
| Totals for Government | 223 | $1,437,888 | $77,375 | 26 | $69,456 |
Stuart government finances - Expenditure in 2017 (per resident):
- Current Operations - Police Protection: $6,819,000 ($373.58)
Sewerage: $5,832,000 ($319.51)
Local Fire Protection: $4,928,000 ($269.98)
Solid Waste Management: $3,745,000 ($205.17)
Natural Resources - Other: $2,997,000 ($164.19)
Financial Administration: $2,113,000 ($115.76)
Central Staff Services: $2,016,000 ($110.45)
Water Utilities: $2,004,000 ($109.79)
Parks and Recreation: $1,214,000 ($66.51)
Regular Highways: $1,152,000 ($63.11)
General - Other: $870,000 ($47.66)
Judicial and Legal Services: $295,000 ($16.16)
- General - Interest on Debt: $334,000 ($18.30)
- Other Capital Outlay - Local Fire Protection: $744,000 ($40.76)
Solid Waste Management: $605,000 ($33.15)
Regular Highways: $562,000 ($30.79)
Police Protection: $534,000 ($29.26)
Natural Resources - Other: $437,000 ($23.94)
General - Other: $238,000 ($13.04)
Parks and Recreation: $17,000 ($0.93)
Central Staff Services: $13,000 ($0.71)
Financial Administration: $7,000 ($0.38)
Judicial and Legal Services: $1,000 ($0.05)
- Water Utilities - Interest on Debt: $864,000 ($47.33)
Stuart government finances - Revenue in 2017 (per resident):
- Charges - Sewerage: $5,336,000 ($292.34)
Solid Waste Management: $4,098,000 ($224.51)
Other: $1,797,000 ($98.45)
Natural Resources - Other: $805,000 ($44.10)
Parks and Recreation: $75,000 ($4.11)
- Federal Intergovernmental - Other: $186,000 ($10.19)
- Local Intergovernmental - General Local Government Support: $892,000 ($48.87)
Other: $621,000 ($34.02)
- Miscellaneous - Special Assessments: $1,828,000 ($100.15)
Rents: $944,000 ($51.72)
Interest Earnings: $337,000 ($18.46)
General Revenue - Other: $194,000 ($10.63)
Fines and Forfeits: $178,000 ($9.75)
Sale of Property: $118,000 ($6.46)
Donations From Private Sources: $19,000 ($1.04)
- Revenue - Water Utilities: $5,375,000 ($294.47)
- State Intergovernmental - General Local Government Support: $2,417,000 ($132.42)
Other: $237,000 ($12.98)
Highways: $68,000 ($3.73)
- Tax - Property: $7,654,000 ($419.33)
Public Utilities Sales: $3,590,000 ($196.68)
Occupation and Business License - Other: $2,275,000 ($124.64)
Other License: $903,000 ($49.47)
General Sales and Gross Receipts: $369,000 ($20.22)
Stuart government finances - Debt in 2017 (per resident):
- Long Term Debt - Outstanding Unspecified Public Purpose: $31,294,000 ($1714.46)
Beginning Outstanding - Unspecified Public Purpose: $31,230,000 ($1710.95)
Issue, Unspecified Public Purpose: $284,000 ($15.56)
Retired Unspecified Public Purpose: $219,000 ($12.00)
Stuart government finances - Cash and Securities in 2017 (per resident):
- Other Funds - Cash and Securities: $26,676,000 ($1461.46)
| Businesses in Stuart, FL | ||||
| Name | Count | Name | Count | |
|---|---|---|---|---|
| 7-Eleven | 2 | Long John Silver's | 1 | |
| AT&T | 2 | Lowe's | 1 | |
| Ace Hardware | 2 | Marriott | 1 | |
| Advance Auto Parts | 1 | Marshalls | 1 | |
| Applebee's | 1 | MasterBrand Cabinets | 2 | |
| Arby's | 1 | Mazda | 1 | |
| Ashley Furniture | 1 | McDonald's | 5 | |
| Audi | 1 | Men's Wearhouse | 1 | |
| Baskin-Robbins | 3 | New Balance | 4 | |
| Bed Bath & Beyond | 1 | Nike | 7 | |
| Best Western | 1 | Nissan | 1 | |
| Blockbuster | 1 | Office Depot | 1 | |
| Budget Car Rental | 1 | Outback | 1 | |
| Burger King | 1 | Outback Steakhouse | 1 | |
| CVS | 3 | Panda Express | 1 | |
| Casual Male XL | 1 | Panera Bread | 1 | |
| Chevrolet | 1 | Papa John's Pizza | 2 | |
| Chick-Fil-A | 1 | Payless | 1 | |
| Chico's | 1 | Penske | 1 | |
| Chuck E. Cheese's | 1 | PetSmart | 1 | |
| Circle K | 2 | Pizza Hut | 1 | |
| Clarion | 1 | Plato's Closet | 1 | |
| Cold Stone Creamery | 1 | Publix Super Markets | 6 | |
| Cracker Barrel | 1 | RadioShack | 2 | |
| Curves | 1 | Ruby Tuesday | 1 | |
| DHL | 2 | SAS Shoes | 1 | |
| Dairy Queen | 2 | Sears | 2 | |
| Dennys | 1 | Shoe Carnival | 1 | |
| Domino's Pizza | 1 | Sprint Nextel | 2 | |
| Dunkin Donuts | 4 | Staples | 1 | |
| FedEx | 18 | Starbucks | 4 | |
| Firestone Complete Auto Care | 1 | Steak 'n Shake | 1 | |
| Ford | 1 | Suburban | 1 | |
| GNC | 1 | Subway | 4 | |
| GameStop | 1 | T-Mobile | 2 | |
| H&R Block | 2 | T.J.Maxx | 1 | |
| Hilton | 1 | Taco Bell | 1 | |
| Holiday Inn | 1 | Target | 1 | |
| Home Depot | 1 | Tire Kingdom | 1 | |
| Honda | 1 | U-Haul | 5 | |
| Hyundai | 1 | UPS | 23 | |
| IHOP | 1 | Vans | 2 | |
| Jimmy John's | 1 | Verizon Wireless | 1 | |
| Jones New York | 5 | Volkswagen | 1 | |
| KFC | 1 | Walgreens | 2 | |
| LA Fitness | 1 | Walmart | 1 | |
| Lane Furniture | 2 | YMCA | 2 | |
Strongest AM radio stations in Stuart:
- WSTU (1450 AM; 1 kW; STUART, FL; Owner: TREASURE COAST BROADCASTERS, INC.)
- WPSL (1590 AM; 5 kW; PORT ST. LUCIE, FL; Owner: PORT ST LUCIE BROADCASTERS, INC.)
- WFTL (850 AM; 50 kW; WEST PALM BEACH, FL; Owner: JAMES CRYSTAL ENTERPRISES II, L.L.C.)
- WEFL (760 AM; 3 kW; TEQUESTA, FL; Owner: STAR OF THE PALM BEACHES, INC.)
- WJNA (640 AM; 38 kW; ROYAL PALM BEACH, FL; Owner: SOUTH FLORIDA RADIO, INC.)
- WJNX (1330 AM; 5 kW; FORT PIERCE, FL; Owner: CLEAR CHANNEL BROADCASTING LICENSES, INC.)
- WLVJ (1040 AM; 25 kW; BOYNTON BEACH, FL; Owner: JAMES CRYSTAL BOYNTON BEACH, INC.)
- WAQI (710 AM; 50 kW; MIAMI, FL; Owner: LICENSE CORPORATION #1)
- WJNO (1290 AM; 10 kW; WEST PALM BEACH, FL; Owner: CLEAR CHANNEL BROADCASTING LICENSES, INC.)
- WWFE (670 AM; 50 kW; MIAMI, FL; Owner: FENIX BROADCASTING CORP.)
- WRFX (940 AM; 50 kW; MIAMI, FL; Owner: CLEAR CHANNEL BROADCASTING LICENSES, INC.)
- WWNN (1470 AM; 50 kW; POMPANO BEACH, FL; Owner: WWNN LICENSE, LLC)
- WFLF (540 AM; 50 kW; PINE HILLS, FL; Owner: CLEAR CHANNEL BROADCASTING LICENSES, INC.)
Strongest FM radio stations in Stuart:
- WWFR (91.7 FM; STUART, FL; Owner: FAMILY STATIONS, INC.)
- WKGR (98.7 FM; FORT PIERCE, FL; Owner: CLEAR CHANNEL BROADCASTING LICENSES, INC.)
- WLDI (95.5 FM; FORT PIERCE, FL; Owner: CLEAR CHANNEL BROADCASTING LICENSES, INC.)
- WAVW (92.7 FM; STUART, FL; Owner: CAPSTAR TX LIMITED PARTNERSHIP)
- WMBX (102.3 FM; JENSEN BEACH, FL; Owner: INFINITY RADIO OPERATIONS INC.)
- WPBZ (103.1 FM; INDIANTOWN, FL; Owner: INFINITY RADIO OPERATIONS INC.)
- WHLG (101.3 FM; PORT ST. LUCIE, FL; Owner: HORTON BROADCASTING COMPANY, INC.)
- WCNO (89.9 FM; PALM CITY, FL; Owner: NATIONAL CHRISTIAN NETWORK, INC.)
- W242AC (96.3 FM; PORT ST. LUCIE, FL; Owner: FRIENDS BROADCASTING, INC.)
- WRMF (97.9 FM; PALM BEACH, FL; Owner: PBB LICENSES, LLC)
- W212AC (90.3 FM; STUART, FL; Owner: THERE'S HOPE RADIO, INC.)
- WZZR (94.3 FM; RIVIERA BEACH, FL; Owner: CLEAR CHANNEL BROADCASTING LICENSES, INC.)
- W244BD (96.7 FM; STUART, FL; Owner: SOUTHWEST FLORIDA COMMUNITY RADIO, INC.)
- WIRK-FM (107.9 FM; WEST PALM BEACH, FL; Owner: INFINITY RADIO OPERATIONS INC.)
- WAYF (88.1 FM; WEST PALM BEACH, FL; Owner: WAY-FM MEDIA GROUP. INC.)
- WOLL (105.5 FM; HOBE SOUND, FL; Owner: CLEAR CHANNEL BROADCASTING LICENSES, INC.)
- WQCS (88.9 FM; FORT PIERCE, FL; Owner: INDIAN RIVER COMMUNITY COLLEGE)
- WEAT-FM (104.3 FM; WEST PALM BEACH, FL; Owner: INFINITY RADIO OPERATIONS INC.)
- WFLM (104.7 FM; WHITE CITY, FL; Owner: MIDWAY BROADCASTING COMPANY)
- WXEL (90.7 FM; WEST PALM BEACH, FL; Owner: BARRY TELECOMMUNICATIONS, INC.)
TV broadcast stations around Stuart:
- WTVX (Channel 34; FORT PIERCE, FL; Owner: C-34 FCC LICENSEE SUBSIDIARY, LLC)
- WPBF (Channel 25; TEQUESTA, FL; Owner: WPBF-TV COMPANY)
- WTCN-CA (Channel 43; PALM BEACH, FL; Owner: WILLIAM H. BROTHERS)
- WTCE (Channel 21; FORT PIERCE, FL; Owner: JACKSONVILLE EDUCATORS B/CNG, INC.)
- WFGC (Channel 61; PALM BEACH, FL; Owner: CHRISTIAN TELEVISION OF PALM BEACH COUNTY, INC.)
- WPXP (Channel 67; LAKE WORTH, FL; Owner: PAXSON WEST PALM BEACH LICENSE, INC.)
- WPTV (Channel 5; WEST PALM BEACH, FL; Owner: SCRIPPS HOWARD BROADCASTING COMPANY)
- WOCX-CA (Channel 5; SEBRING, ETC., FL; Owner: SEBRING TELEVISION CORPORATION)
- WWHB-CA (Channel 15; STUART, FL; Owner: AMERICAN NETCOM, INC.)
- WFLX (Channel 29; WEST PALM BEACH, FL; Owner: RAYCOM NATIONAL, INC.)
- WXEL-TV (Channel 42; WEST PALM BEACH, FL; Owner: BARRY TELECOMMUNICATIONS, INC.)
- W53BS (Channel 53; JUPITER, FL; Owner: SPIRIT PRODUCTIONS, INC.)
- WPEC (Channel 12; WEST PALM BEACH, FL; Owner: FREEDOM BROADCASTING OF FLORIDA, INC)
- WWCI-CA (Channel 10; VERO BEACH, FL; Owner: V-1 PRODUCTIONS, INC.)
- W47BG (Channel 47; WEST PALM BEACH, FL; Owner: JACKSONVILLE EDUCATORS B/CING., INC.)
- W44AY (Channel 44; FORT PIERCE, FL; Owner: BARRY TELECOMMUNICATIONS, INC.)
- WFPI-LP (Channel 8; FORT PIERCE, ETC, FL; Owner: TIGER EYE BROADCASTING CORPORATION)
- National Bridge Inventory (NBI) Statistics
- 15Number of bridges
- 1,375ft / 419mTotal length
- 248,245Total average daily traffic
- 13,420Total average daily truck traffic
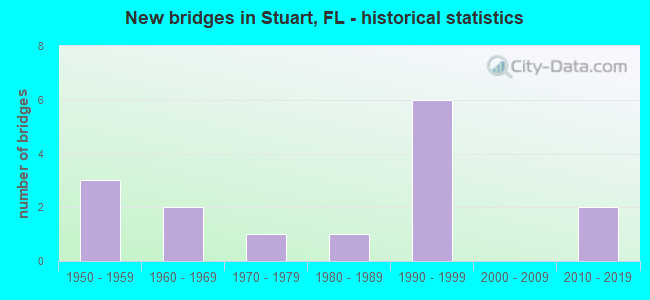
- New bridges - historical statistics
- 31950-1959
- 21960-1969
- 11970-1979
- 11980-1989
- 61990-1999
- 22010-2019
FCC Registered Private Land Mobile Towers: 9 (See the full list of FCC Registered Private Land Mobile Towers in Stuart, FL)
FCC Registered Broadcast Land Mobile Towers: 94 (See the full list of FCC Registered Broadcast Land Mobile Towers)
FCC Registered Microwave Towers: 26 (See the full list of FCC Registered Microwave Towers in this town)
FCC Registered Paging Towers: 19 (See the full list of FCC Registered Paging Towers)
FCC Registered Maritime Coast & Aviation Ground Towers: 42 (See the full list of FCC Registered Maritime Coast & Aviation Ground Towers)
FCC Registered Amateur Radio Licenses: 573 (See the full list of FCC Registered Amateur Radio Licenses in Stuart)
FAA Registered Aircraft Manufacturers and Dealers: 27 (See the full list of FAA Registered Manufacturers and Dealers in Stuart)
FAA Registered Aircraft: 218 (See the full list of FAA Registered Aircraft)
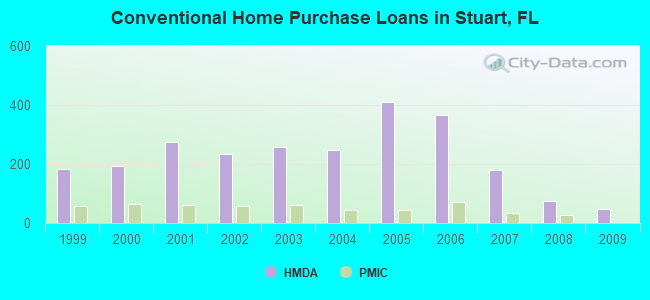
| Home Mortgage Disclosure Act Aggregated Statistics For Year 2009 (Based on 1 full and 8 partial tracts) | ||||||||||||
| A) FHA, FSA/RHS & VA Home Purchase Loans | B) Conventional Home Purchase Loans | C) Refinancings | D) Home Improvement Loans | F) Non-occupant Loans on < 5 Family Dwellings (A B C & D) | G) Loans On Manufactured Home Dwelling (A B C & D) | |||||||
|---|---|---|---|---|---|---|---|---|---|---|---|---|
| Number | Average Value | Number | Average Value | Number | Average Value | Number | Average Value | Number | Average Value | Number | Average Value | |
| LOANS ORIGINATED | 29 | $119,889 | 49 | $134,437 | 59 | $192,723 | 6 | $36,078 | 26 | $98,620 | 0 | $0 |
| APPLICATIONS APPROVED, NOT ACCEPTED | 3 | $100,153 | 11 | $151,664 | 11 | $170,641 | 2 | $129,345 | 7 | $137,646 | 0 | $0 |
| APPLICATIONS DENIED | 12 | $109,242 | 15 | $200,031 | 58 | $179,601 | 7 | $9,719 | 14 | $148,256 | 3 | $23,967 |
| APPLICATIONS WITHDRAWN | 2 | $155,405 | 6 | $100,083 | 23 | $200,475 | 0 | $0 | 5 | $179,650 | 0 | $0 |
| FILES CLOSED FOR INCOMPLETENESS | 2 | $98,445 | 1 | $155,920 | 16 | $196,227 | 0 | $0 | 0 | $0 | 0 | $0 |
Detailed HMDA statistics for the following Tracts: 0004.00 , 0007.00, 0008.00, 0009.00, 0010.00, 0011.01, 0012.00
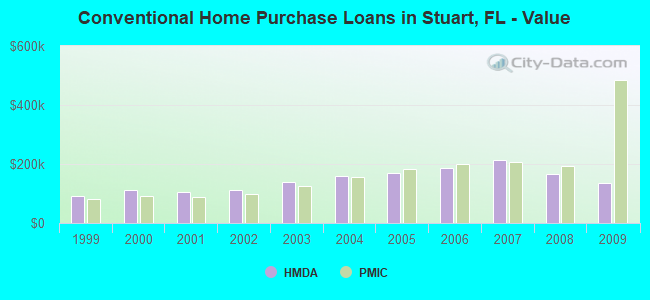
| Private Mortgage Insurance Companies Aggregated Statistics For Year 2009 (Based on 7 partial tracts) | ||||||
| A) Conventional Home Purchase Loans | B) Refinancings | C) Non-occupant Loans on < 5 Family Dwellings (A & B) | ||||
|---|---|---|---|---|---|---|
| Number | Average Value | Number | Average Value | Number | Average Value | |
| LOANS ORIGINATED | 1 | $484,380 | 1 | $215,820 | 0 | $0 |
| APPLICATIONS APPROVED, NOT ACCEPTED | 3 | $334,023 | 0 | $0 | 2 | $183,845 |
| APPLICATIONS DENIED | 1 | $158,220 | 0 | $0 | 0 | $0 |
| APPLICATIONS WITHDRAWN | 0 | $0 | 1 | $62,730 | 0 | $0 |
| FILES CLOSED FOR INCOMPLETENESS | 0 | $0 | 0 | $0 | 0 | $0 |
Detailed PMIC statistics for the following Tracts: 0004.00 , 0007.00, 0008.00, 0009.00, 0010.00, 0011.01, 0012.00
2002 - 2018 National Fire Incident Reporting System (NFIRS) incidents
- Fire incident types reported to NFIRS in Stuart, FL
- 1,03550.9%Outside Fires
- 52825.9%Structure Fires
- 42721.0%Mobile Property/Vehicle Fires
- 452.2%Other
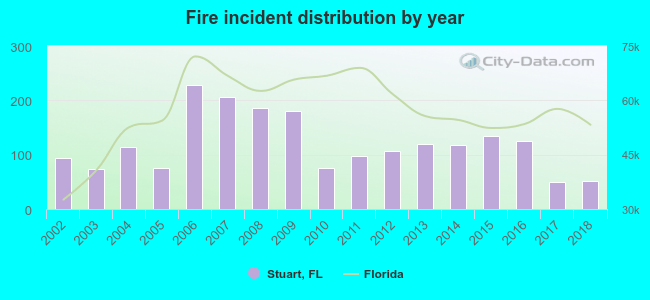 Based on the data from the years 2002 - 2018 the average number of fire incidents per year is 120. The highest number of fires - 229 took place in 2006, and the least - 50 in 2017. The data has a decreasing trend.
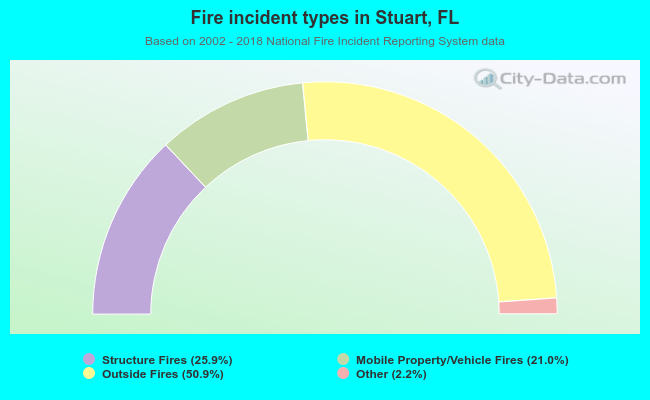 When looking into fire subcategories, the most incidents belonged to: Outside Fires (50.9%), and Structure Fires (25.9%).
Fire-safe hotels and motels in Stuart, Florida:
- Best Western Downtown Stuart, 1209 S Federal Hwy, Stuart, Florida 34994 , Phone: (772) 287-6200, Fax: (772) 600-2002
- Howard Johnson's Motor Lodge, 950 S Federal Hwy, Stuart, Florida 34994 , Phone: (000) 000-0000, Fax: (772) 220-3594
- Clarion Inn, 1200 S Federal Hwy, Stuart, Florida 34994 , Phone: (772) 287-6900, Fax: (772) 286-8188
- Pirates Cove Resort & Marina, 4307 SE Bayview St, Stuart, Florida 34997 , Phone: (772) 287-2500, Fax: (772) 220-2704
- Hutchinson Island Marriott Beach Resort and Marina, 555 N E Ocean Blvd, Stuart, Florida 34996 , Phone: (772) 225-3700, Fax: (772) 225-0003
- Hampton Inn And Suites Stuart North, 1150 NW Federal Hwy, Stuart, Florida 34994 , Phone: (772) 692-6922, Fax: (772) 692-6924
- Holiday Inn Express, 7900 SW Lost River Rd, Stuart, Florida 34997 , Phone: (772) 287-2522, Fax: (772) 287-2511
- Courtyard By Marriott Stuart, 7615 SW Lost River Rd, Stuart, Florida 34997 , Phone: (772) 781-3344, Fax: (772) 781-3304
| Most common first names in Stuart, FL among deceased individuals | ||
| Name | Count | Lived (average) |
|---|---|---|
| John | 427 | 78.6 years |
| Robert | 375 | 76.0 years |
| William | 368 | 78.5 years |
| Mary | 303 | 81.6 years |
| James | 221 | 76.5 years |
| Helen | 221 | 84.7 years |
| Joseph | 198 | 80.0 years |
| George | 184 | 79.5 years |
| Charles | 181 | 78.7 years |
| Dorothy | 165 | 82.6 years |
| Most common last names in Stuart, FL among deceased individuals | ||
| Last name | Count | Lived (average) |
|---|---|---|
| Smith | 139 | 80.2 years |
| Johnson | 80 | 77.1 years |
| Miller | 61 | 80.9 years |
| Williams | 59 | 79.0 years |
| Brown | 49 | 74.8 years |
| Jones | 48 | 76.2 years |
| Anderson | 46 | 79.9 years |
| Wilson | 46 | 76.4 years |
| White | 39 | 76.5 years |
| Davis | 38 | 78.1 years |
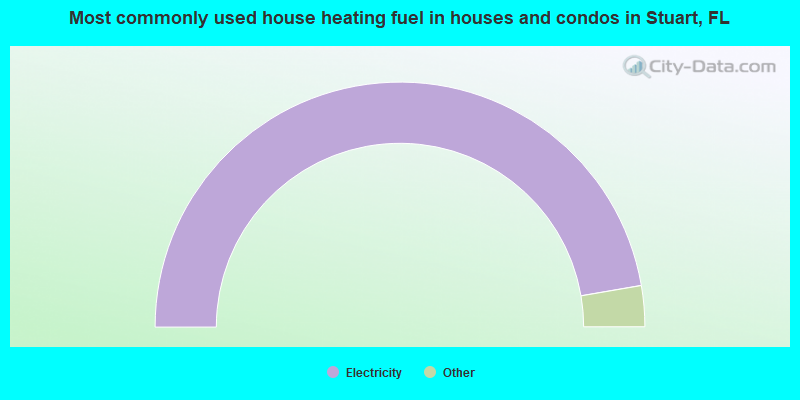
- 94.6%Electricity
- 3.2%No fuel used
- 1.8%Utility gas
- 0.4%Other fuel
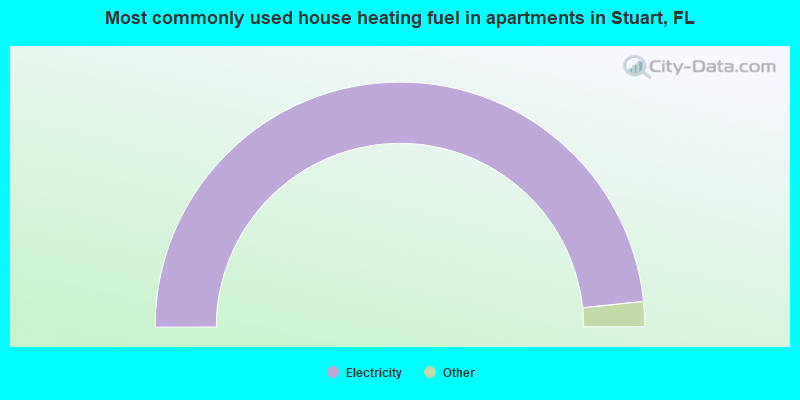
- 96.7%Electricity
- 1.8%Utility gas
- 1.5%No fuel used
Stuart compared to Florida state average:
- Unemployed percentage significantly below state average.
- Median age above state average.
- Length of stay since moving in significantly above state average.
Stuart on our top lists:
- #68 on the list of "Top 101 cities with the largest percentage of people in hospices or homes for chronically ill (population 1,000+)"
- #88 on the list of "Top 101 cities that people commute into (largest positive percentage daily daytime population change due to commuting) (population 5,000+)"
- #3 on the list of "Top 101 counties with the largest number of people without health insurance coverage in 2000 (pop. 50,000+)"
- #9 on the list of "Top 101 counties with the lowest number of births per 1000 residents 2007-2013"
- #69 on the list of "Top 101 counties with the largest decrease in the number of births per 1000 residents 2000-2006 to 2007-2013 (pop 50,000+)"
- #73 on the list of "Top 101 counties with the highest number of deaths per 1000 residents 2007-2013 (pop. 50,000+)"

|
|
Total of 402 patent applications in 2008-2024.