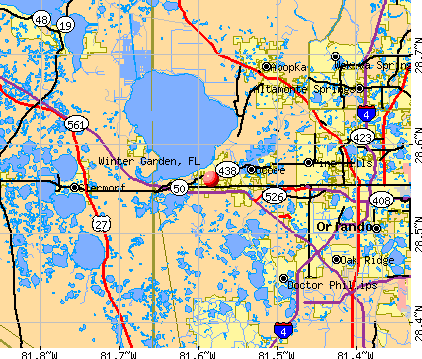
Winter Garden, Florida
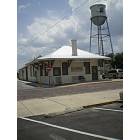
Winter Garden: Former Tavares & Gulf Railroad Station
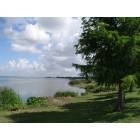
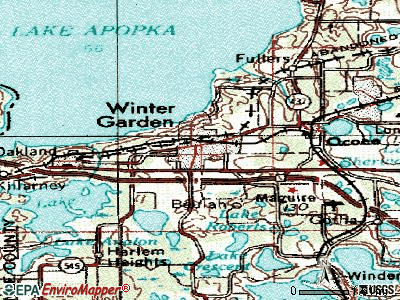
Winter Garden: Lake Apopka shore in Winter Garden
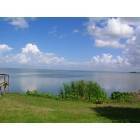
Winter Garden: Looking out across Lake Apopka
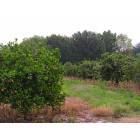
Winter Garden: Orange Grove on Hennis Street
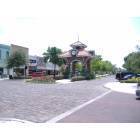
Winter Garden: Downtown Winter Garden
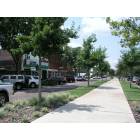
Winter Garden: Plant Street downtown Winter Garden
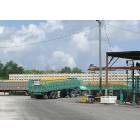
Winter Garden: Delivery of Oranges to the Juice Mill
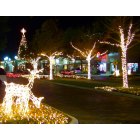
Winter Garden: Old Winter Garden Christmas at night
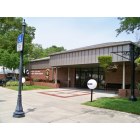
Winter Garden: Winter Garden Police Dept.
Winter Garden: Winter Garden
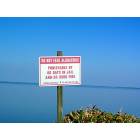
Winter Garden: Lake Apopka Do Not Feed Alligators
- see
14
more - add
your


Submit your own pictures of this city and show them to the world
- OSM Map
- General Map
- Google Map
- MSN Map
Population change since 2000: +227.8%
| Males: 23,108 | |
| Females: 23,941 |
| Median resident age: | 40.3 years |
| Florida median age: | 42.7 years |
Zip codes: 34787.
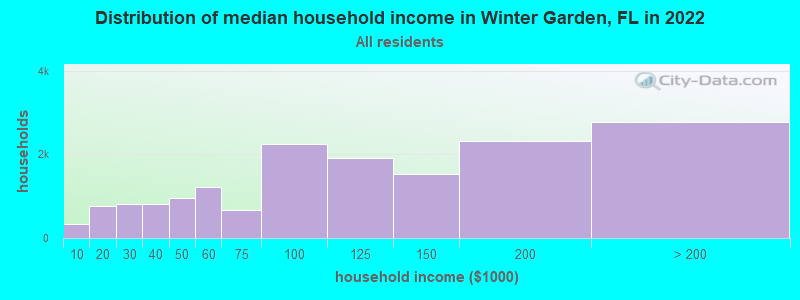
| Winter Garden: | $101,525 |
| FL: | $69,303 |
Estimated per capita income in 2022: $44,706 (it was $18,082 in 2000)
Winter Garden city income, earnings, and wages data
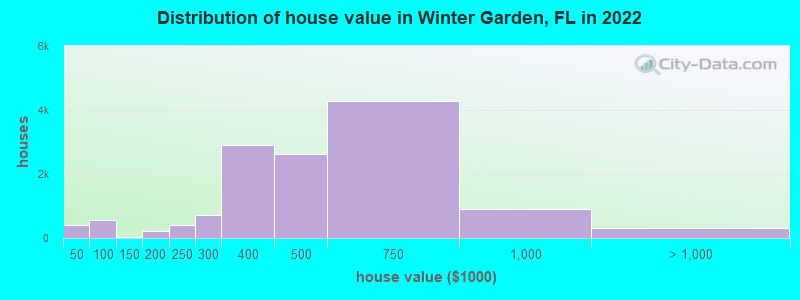
Estimated median house or condo value in 2022: $469,819 (it was $84,700 in 2000)
| Winter Garden: | $469,819 |
| FL: | $354,100 |
Mean prices in 2022: all housing units: $467,516; detached houses: $510,620; townhouses or other attached units: $313,280; in 3-to-4-unit structures: $242,304; in 5-or-more-unit structures: $83,113; mobile homes: $46,532
Median gross rent in 2022: $1,662.
(5.3% for White Non-Hispanic residents, 14.3% for Black residents, 15.5% for Hispanic or Latino residents, 8.4% for other race residents, 8.5% for two or more races residents)
Detailed information about poverty and poor residents in Winter Garden, FL


Compare current foreclosures in Winter Garden, FL:
| Photo | Address | Area | Beds / Baths | Price | Details |
|---|---|---|---|---|---|

|
#1
Lost Grove Cir
Winter Garden, FL 34787
|
2,880 sq. feet
|
2 baths 4 beds |
show details | |

|
#2
N Circle Ct
Winter Garden, FL 34787
|
1,036 sq. feet
|
2 baths 3 beds |
show details | |

|
#3
Portmoor Way
Winter Garden, FL 34787
|
1,719 sq. feet
|
2 baths 4 beds |
show details | |

|
#4
Country Cottage Ln
Winter Garden, FL 34787
|
3,069 sq. feet
|
2 baths 4 beds |
show details | |

|
#5
Avalon Woods Dr
Winter Garden, FL 34787
|
2,239 sq. feet
|
2 baths 3 beds |
show details | |

|
#6
Lincoln Ter
Winter Garden, FL 34787
|
814 sq. feet
|
1 baths 3 beds |
show details | |

|
#7
Cardinal Ln
Winter Garden, FL 34787
|
984 sq. feet
|
2 baths 3 beds |
show details | |

|
#8
Largovista Dr
Winter Garden, FL 34787
|
4,475 sq. feet
|
3 baths 5 beds |
show details | |

|
#9
Daughtery Dr
Winter Garden, FL 34787
|
1,956 sq. feet
|
2 baths 4 beds |
show details | |

|
#10
Beamleigh Rd
Winter Garden, FL 34787
|
1,345 sq. feet
|
2 baths 3 beds |
show details |
| Photo | Address | Area | Beds / Baths | Price | Details |
|---|---|---|---|---|---|

|
#11
Balforn Tower Way
Winter Garden, FL 34787
|
1,572 sq. feet
|
2 baths 3 beds |
show details | |

|
#12
Doe Run Dr
Winter Garden, FL 34787
|
2,303 sq. feet
|
2 baths 4 beds |
show details | |

|
#13
Horstfield Dr
Winter Garden, FL 34787
|
1,225 sq. feet
|
2 baths 3 beds |
show details | |

|
#14
Eagle Ln
Winter Garden, FL 34787
|
938 sq. feet
|
2 baths 2 beds |
show details | |

|
#15
Bainbridge Loop
Winter Garden, FL 34787
|
2,256 sq. feet
|
2 baths 3 beds |
show details | |

|
#16
Black Springs Ln
Winter Garden, FL 34787
|
2,238 sq. feet
|
2 baths 3 beds |
show details | |

|
#17
Hartsdale Dr
Winter Garden, FL 34787
|
1,182 sq. feet
|
2 baths 3 beds |
show details | |

|
#18
Scarlett Sage Ct
Winter Garden, FL 34787
|
2,543 sq. feet
|
3 baths 4 beds |
show details | |

|
#19
Beakrush Ln
Winter Garden, FL 34787
|
2,026 sq. feet
|
2 baths 3 beds |
show details | |

|
#20
Hawkslade Ct
Winter Garden, FL 34787
|
1,886 sq. feet
|
3 baths 4 beds |
show details |
| Photo | Address | Area | Beds / Baths | Price | Details |
|---|---|---|---|---|---|

|
#21
Thornbury Ct
Winter Garden, FL 34787
|
2,410 sq. feet
|
3 baths 3 beds |
show details | |

|
#22
Butter Oaks Ct
Winter Garden, FL 34787
|
2,884 sq. feet
|
2 baths 4 beds |
show details | |

|
#23
Seidner Rd
Winter Garden, FL 34787
|
3,851 sq. feet
|
3 baths 4 beds |
show details | |

|
#24
Home Grove Dr
Winter Garden, FL 34787
|
3,774 sq. feet
|
4 baths 5 beds |
show details | |

|
#25
Fox Glove St # 6
Winter Garden, FL 34787
|
2,122 sq. feet
|
2 baths 4 beds |
show details | |

|
#26
Dharma Cir
Winter Garden, FL 34787
|
1,260 sq. feet
|
2 baths 3 beds |
show details | |

|
#27
Bahama Swallow Blvd
Winter Garden, FL 34787
|
1,704 sq. feet
|
2 baths 3 beds |
show details | |

|
#28
Setting Sun Dr
Winter Garden, FL 34787
|
1,994 sq. feet
|
2 baths 3 beds |
show details | |

|
#29
Prairie View Dr
Winter Garden, FL 34787
|
2,782 sq. feet
|
4 baths 5 beds |
show details | |

|
#30
Lost Grove Cir
Winter Garden, FL 34787
|
3,382 sq. feet
|
3 baths 5 beds |
show details |
| Photo | Address | Area | Beds / Baths | Price | Details |
|---|---|---|---|---|---|

|
#31
Gaulberry Run
Winter Garden, FL 34787
|
3,422 sq. feet
|
4 baths 4 beds |
show details | |

|
#32
Stucki Ter
Winter Garden, FL 34787
|
1,216 sq. feet
|
2 baths 3 beds |
show details | |

|
#33
Daniels Cove Dr
Winter Garden, FL 34787
|
1,152 sq. feet
|
2 baths 3 beds |
show details | |

|
#34
Masthead Landing Cir
Winter Garden, FL 34787
|
2,027 sq. feet
|
2 baths 4 beds |
show details | |

|
#35
Daniels Landing Cir
Winter Garden, FL 34787
|
1,347 sq. feet
|
2 baths 2 beds |
show details | |

|
#36
Glynshel Dr
Winter Garden, FL 34787
|
3,867 sq. feet
|
4 baths 4 beds |
show details | |

|
#37
Desiree Aurora St
Winter Garden, FL 34787
|
2,356 sq. feet
|
2 baths 4 beds |
show details | |

|
#38
Regina Cir
Winter Garden, FL 34787
|
2,360 sq. feet
|
2 baths 4 beds |
show details | |

|
#39
Avalon Rd
Winter Garden, FL 34787
|
- sq. feet
|
- baths - beds |
show details | |

|
#40
Hyde Park Cir W
Winter Garden, FL 34787
|
- sq. feet
|
- baths - beds |
show details |
| Photo | Address | Area | Beds / Baths | Price | Details |
|---|---|---|---|---|---|

|
#41
Marina Bay Dr
Winter Garden, FL 34787
|
- sq. feet
|
- baths - beds |
show details | |

|
#42
Grove Resort 3627
Winter Garden, FL 34787
|
- sq. feet
|
- baths - beds |
show details | |

|
#43
Makrut Lime Dr
Winter Garden, FL 34787
|
- sq. feet
|
- baths - beds |
show details | |

|
#44
Heron Hideaway Cir
Winter Garden, FL 34787
|
- sq. feet
|
- baths - beds |
show details | |

|
#45
Evergreen Oak Loop
Winter Garden, FL 34787
|
- sq. feet
|
- baths - beds |
show details | |

|
#46
W Colonial Dr Apt 202
Winter Garden, FL 34787
|
- sq. feet
|
- baths - beds |
show details | |

|
#47
Larkspur Lake Dr
Winter Garden, FL 34787
|
- sq. feet
|
- baths - beds |
show details | |

|
#48
W Pointe Villas Blvd Apt 103
Winter Garden, FL 34787
|
- sq. feet
|
- baths - beds |
show details | |

|
#49
Latrina Ct
Winter Garden, FL 34787
|
- sq. feet
|
- baths - beds |
show details | |

|
Check over 1 million property listings on Foreclosure.com!
|
browse all offers | |||


- 21,93446.3%White alone
- 12,83527.1%Hispanic
- 5,66412.0%Black alone
- 3,3777.1%Asian alone
- 3,2086.8%Two or more races
- 2990.6%Other race alone
- 240.05%American Indian alone
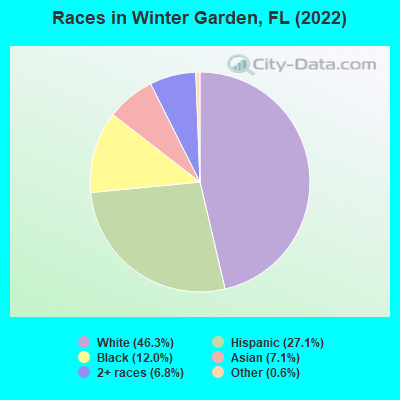
Races in Winter Garden detailed stats: ancestries, foreign born residents, place of birth
According to our research of Florida and other state lists, there were 40 registered sex offenders living in Winter Garden, Florida as of April 28, 2024.
The ratio of all residents to sex offenders in Winter Garden is 1,026 to 1.
The ratio of registered sex offenders to all residents in this city is lower than the state average.
Type |
2009 |
2010 |
2011 |
2012 |
2013 |
2014 |
2015 |
2016 |
2017 |
2018 |
2019 |
2020 |
|---|---|---|---|---|---|---|---|---|---|---|---|---|
| Murders (per 100,000) | 1 (3.2) | 0 (0.0) | 0 (0.0) | 0 (0.0) | 2 (5.3) | 2 (5.2) | 2 (5.0) | 1 (2.4) | 0 (0.0) | 0 (0.0) | 2 (4.3) | 3 (6.3) |
| Rapes (per 100,000) | 4 (12.7) | 6 (17.4) | 11 (31.4) | 11 (30.8) | 13 (34.4) | 11 (28.6) | 10 (25.1) | 5 (12.0) | 9 (20.8) | 13 (28.9) | 13 (27.8) | 12 (25.3) |
| Robberies (per 100,000) | 46 (145.8) | 30 (86.8) | 23 (65.6) | 30 (83.9) | 25 (66.1) | 32 (83.2) | 24 (60.3) | 19 (45.7) | 19 (43.9) | 31 (69.0) | 27 (57.8) | 18 (37.9) |
| Assaults (per 100,000) | 121 (383.5) | 124 (358.7) | 144 (411.0) | 155 (433.3) | 138 (364.9) | 118 (306.9) | 145 (364.5) | 109 (262.3) | 118 (272.5) | 111 (247.1) | 139 (297.3) | 120 (252.7) |
| Burglaries (per 100,000) | 203 (643.3) | 197 (569.9) | 256 (730.6) | 233 (651.4) | 226 (597.6) | 194 (504.5) | 163 (409.7) | 166 (399.5) | 140 (323.4) | 171 (380.7) | 111 (237.4) | 88 (185.3) |
| Thefts (per 100,000) | 890 (2,821) | 821 (2,375) | 857 (2,446) | 992 (2,773) | 1,135 (3,001) | 882 (2,294) | 784 (1,971) | 1,181 (2,842) | 929 (2,146) | 791 (1,761) | 918 (1,964) | 654 (1,377) |
| Auto thefts (per 100,000) | 81 (256.7) | 56 (162.0) | 74 (211.2) | 50 (139.8) | 51 (134.9) | 37 (96.2) | 51 (128.2) | 80 (192.5) | 57 (131.7) | 56 (124.7) | 83 (177.5) | 68 (143.2) |
| Arson (per 100,000) | 4 (12.7) | 8 (23.1) | 8 (22.8) | 3 (8.4) | 0 (0.0) | 0 (0.0) | 3 (7.5) | 3 (7.2) | 5 (11.5) | 1 (2.2) | 3 (6.4) | 5 (10.5) |
| City-Data.com crime index | 315.3 | 259.5 | 292.9 | 304.2 | 303.6 | 254.4 | 238.9 | 237.7 | 203.3 | 200.3 | 217.0 | 174.3 |
The City-Data.com crime index weighs serious crimes and violent crimes more heavily. Higher means more crime, U.S. average is 246.1. It adjusts for the number of visitors and daily workers commuting into cities.
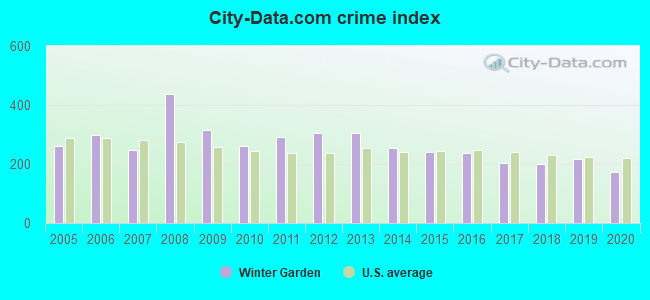
Crime rate in Winter Garden detailed stats: murders, rapes, robberies, assaults, burglaries, thefts, arson
Full-time law enforcement employees in 2021, including police officers: 110 (82 officers - 64 male; 18 female).
| Officers per 1,000 residents here: | 1.71 |
| Florida average: | 2.33 |
 Recent articles from our blog. Our writers, many of them Ph.D. graduates or candidates, create easy-to-read articles on a wide variety of topics.


Latest news from Winter Garden, FL collected exclusively by city-data.com from local newspapers, TV, and radio stations
Ancestries: American (26.7%), English (3.9%), German (3.1%), Irish (2.5%), European (2.4%), British (2.1%).
Current Local Time: EST time zone
Elevation: 126 feet
Land area: 12.1 square miles.
Population density: 3,902 people per square mile (average).
10,782 residents are foreign born (16.5% Latin America, 3.7% Asia).
| This city: | 22.8% |
| Florida: | 21.1% |
Median real estate property taxes paid for housing units with mortgages in 2022: $3,867 (0.8%)
Median real estate property taxes paid for housing units with no mortgage in 2022: $2,763 (0.7%)
Nearest city with pop. 50,000+: Southwest Orange, FL (9.7 miles  , pop. 105,946).
Nearest city with pop. 200,000+: Tampa, FL (67.4 miles , pop. 303,447).
Nearest city with pop. 1,000,000+: Houston, TX (837.1 miles , pop. 1,953,631).
Nearest cities:
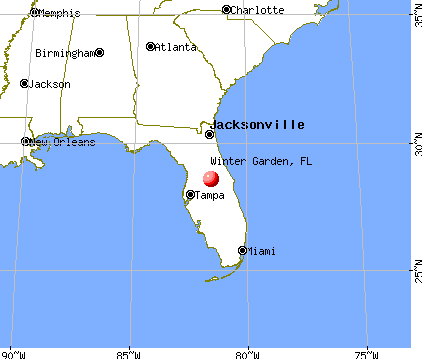
), ), ), ), ), Latitude: 28.56 N, Longitude: 81.58 W
Daytime population change due to commuting: -2,013 (-4.3%)
Workers who live and work in this city: 9,297 (38.9%)
Area codes: 407, 321
Property values in Winter Garden, FL
Winter Garden tourist attractions:
Winter Garden, Florida accommodation & food services, waste management - Economy and Business Data
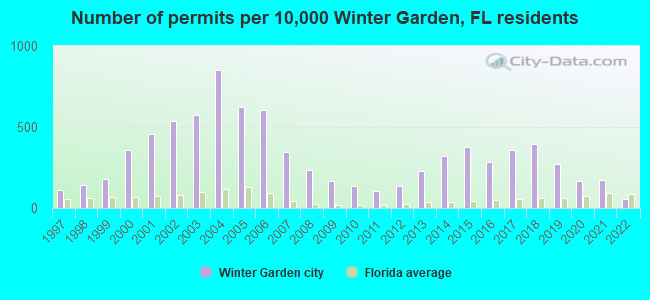
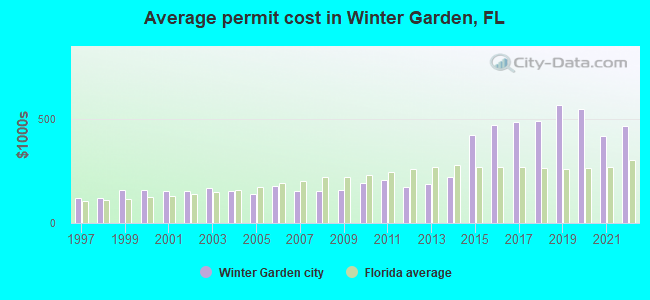
Single-family new house construction building permits:
- 2022: 79 buildings, average cost: $466,900
- 2021: 250 buildings, average cost: $416,200
- 2020: 243 buildings, average cost: $544,600
- 2019: 391 buildings, average cost: $566,400
- 2018: 569 buildings, average cost: $488,900
- 2017: 509 buildings, average cost: $483,200
- 2016: 410 buildings, average cost: $467,500
- 2015: 537 buildings, average cost: $420,000
- 2014: 456 buildings, average cost: $220,000
- 2013: 329 buildings, average cost: $187,700
- 2012: 196 buildings, average cost: $174,000
- 2011: 154 buildings, average cost: $204,300
- 2010: 196 buildings, average cost: $192,900
- 2009: 243 buildings, average cost: $158,500
- 2008: 340 buildings, average cost: $155,400
- 2007: 495 buildings, average cost: $154,200
- 2006: 865 buildings, average cost: $177,000
- 2005: 898 buildings, average cost: $141,300
- 2004: 1219 buildings, average cost: $151,900
- 2003: 819 buildings, average cost: $169,800
- 2002: 772 buildings, average cost: $153,600
- 2001: 653 buildings, average cost: $154,700
- 2000: 513 buildings, average cost: $157,500
- 1999: 257 buildings, average cost: $160,200
- 1998: 203 buildings, average cost: $121,700
- 1997: 156 buildings, average cost: $120,600
| Here: | 2.7% |
| Florida: | 2.9% |
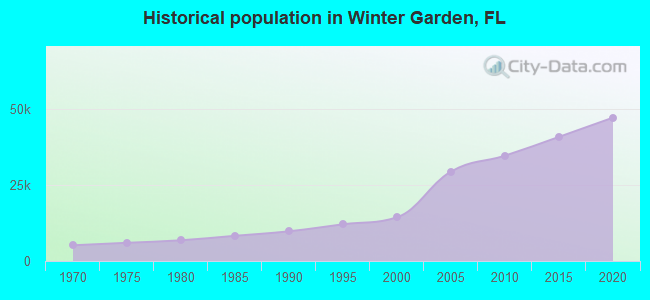
Population change in the 1990s: +4,460 (+45.1%).
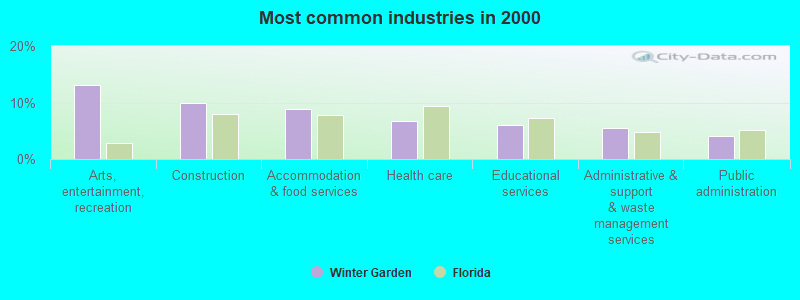
- Arts, entertainment, recreation (13.1%)
- Construction (9.9%)
- Accommodation & food services (8.9%)
- Health care (6.8%)
- Educational services (6.1%)
- Administrative & support & waste management services (5.5%)
- Public administration (4.1%)
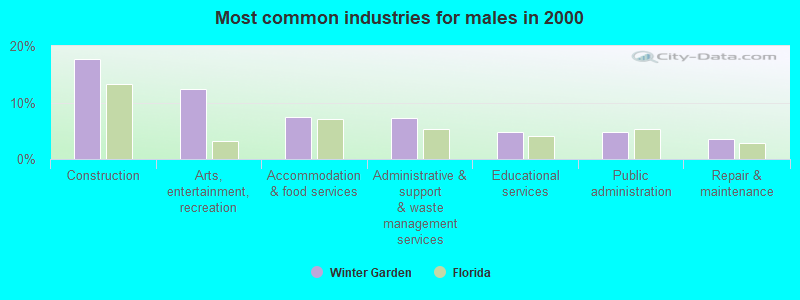
- Construction (17.8%)
- Arts, entertainment, recreation (12.4%)
- Accommodation & food services (7.4%)
- Administrative & support & waste management services (7.2%)
- Educational services (4.8%)
- Public administration (4.7%)
- Repair & maintenance (3.5%)
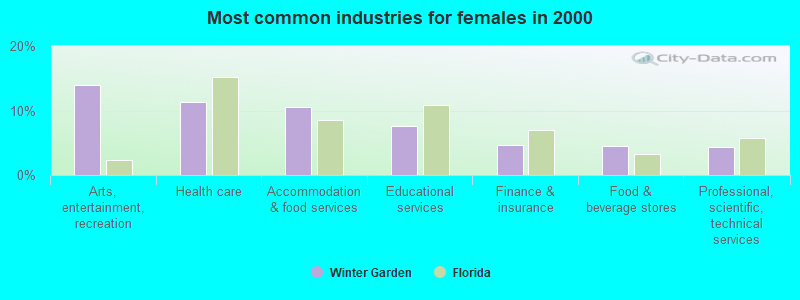
- Arts, entertainment, recreation (14.0%)
- Health care (11.3%)
- Accommodation & food services (10.5%)
- Educational services (7.5%)
- Finance & insurance (4.6%)
- Food & beverage stores (4.5%)
- Professional, scientific, technical services (4.4%)
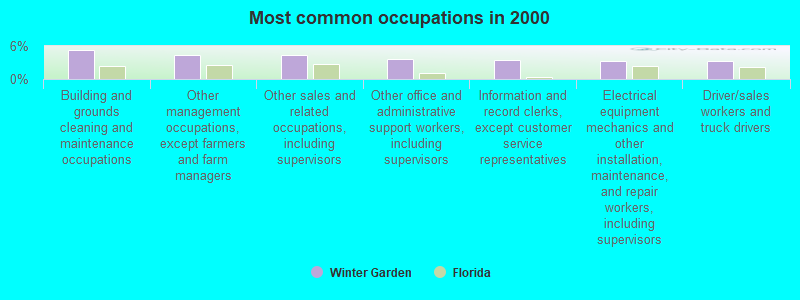
- Building and grounds cleaning and maintenance occupations (5.4%)
- Other management occupations, except farmers and farm managers (4.4%)
- Other sales and related occupations, including supervisors (4.4%)
- Other office and administrative support workers, including supervisors (3.6%)
- Information and record clerks, except customer service representatives (3.4%)
- Electrical equipment mechanics and other installation, maintenance, and repair workers, including supervisors (3.4%)
- Driver/sales workers and truck drivers (3.3%)
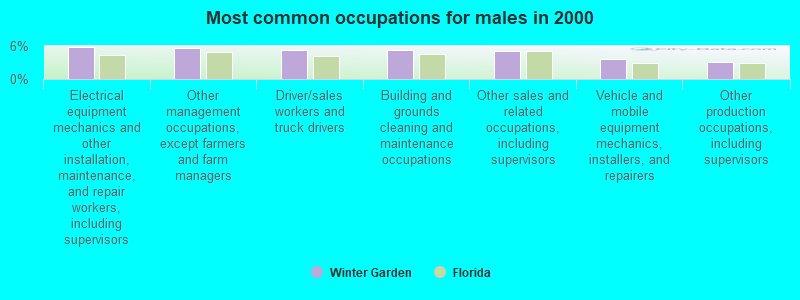
- Electrical equipment mechanics and other installation, maintenance, and repair workers, including supervisors (5.7%)
- Other management occupations, except farmers and farm managers (5.6%)
- Driver/sales workers and truck drivers (5.2%)
- Building and grounds cleaning and maintenance occupations (5.2%)
- Other sales and related occupations, including supervisors (5.0%)
- Vehicle and mobile equipment mechanics, installers, and repairers (3.6%)
- Other production occupations, including supervisors (3.1%)
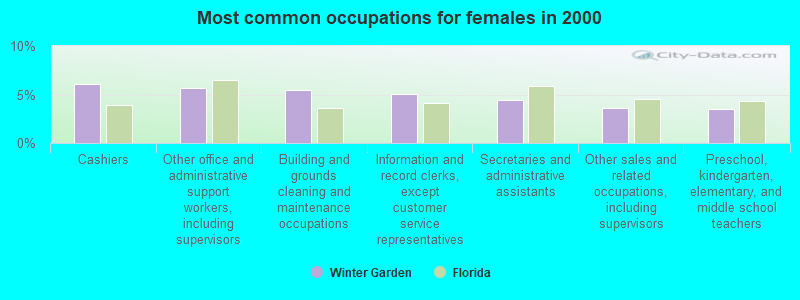
- Cashiers (6.1%)
- Other office and administrative support workers, including supervisors (5.7%)
- Building and grounds cleaning and maintenance occupations (5.5%)
- Information and record clerks, except customer service representatives (5.1%)
- Secretaries and administrative assistants (4.4%)
- Other sales and related occupations, including supervisors (3.6%)
- Preschool, kindergarten, elementary, and middle school teachers (3.5%)
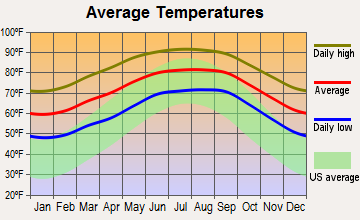
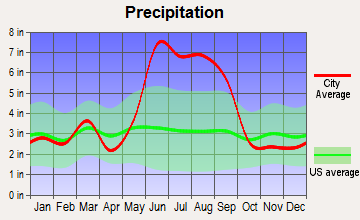
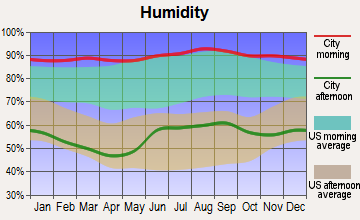
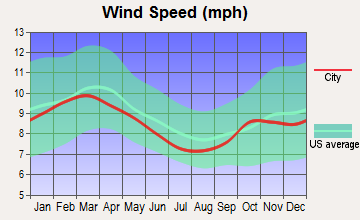
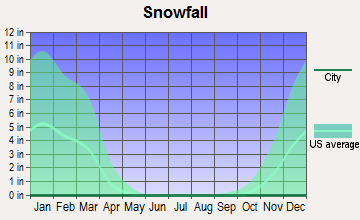
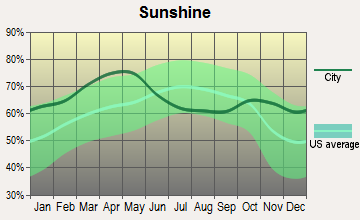
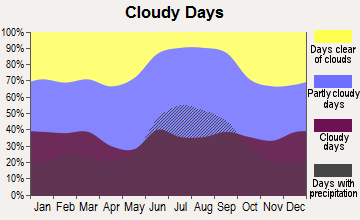
Average climate in Winter Garden, Florida
Based on data reported by over 4,000 weather stations
(lower is better)
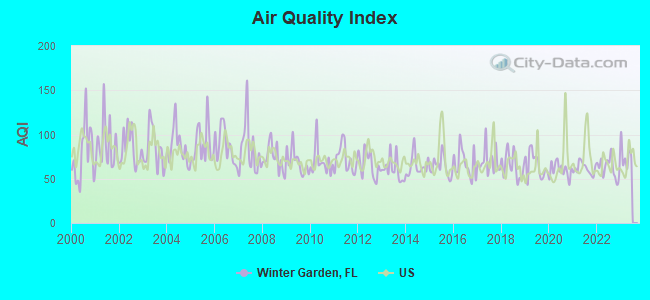
Air Quality Index (AQI) level in 2022 was 62.4. This is about average.
| City: | 62.4 |
| U.S.: | 72.6 |
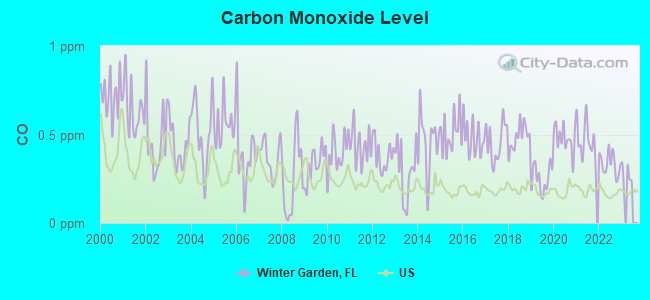
Carbon Monoxide (CO) [ppm] level in 2022 was 0.335. This is worse than average. Closest monitor was 12.6 miles away from the city center.
| City: | 0.335 |
| U.S.: | 0.251 |
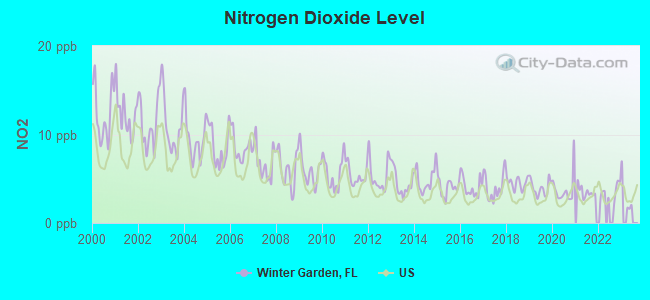
Nitrogen Dioxide (NO2) [ppb] level in 2022 was 3.57. This is significantly better than average. Closest monitor was 13.7 miles away from the city center.
| City: | 3.57 |
| U.S.: | 5.11 |
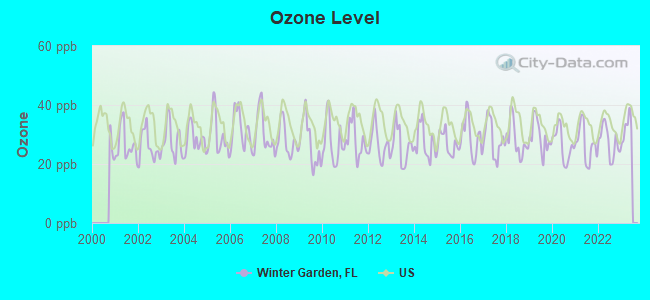
Ozone [ppb] level in 2022 was 27.6. This is better than average. Closest monitor was 8.8 miles away from the city center.
| City: | 27.6 |
| U.S.: | 33.3 |
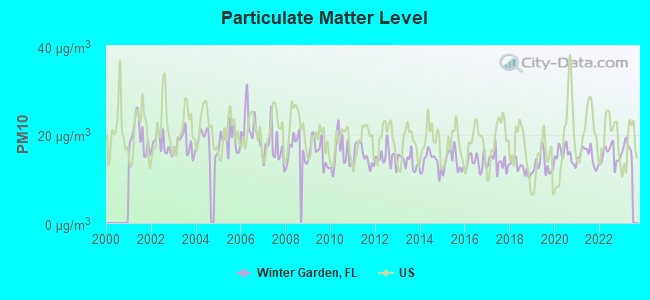
Particulate Matter (PM10) [µg/m3] level in 2022 was 15.4. This is better than average. Closest monitor was 7.7 miles away from the city center.
| City: | 15.4 |
| U.S.: | 19.2 |
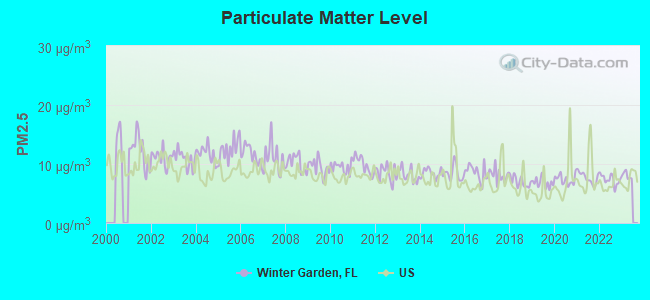
Particulate Matter (PM2.5) [µg/m3] level in 2022 was 7.34. This is about average. Closest monitor was 13.7 miles away from the city center.
| City: | 7.34 |
| U.S.: | 8.11 |
Tornado activity:
Winter Garden-area historical tornado activity is above Florida state average. It is 58% greater than the overall U.S. average.
On 2/22/1998, a category F3 (max. wind speeds 158-206 mph) tornado 9.5 miles away from the Winter Garden city center killed 3 people and injured 70 people and caused $15 million in damages.
On 3/19/1981, a category F3 tornado 10.8 miles away from the city center injured one person and caused between $500,000 and $5,000,000 in damages.
Earthquake activity:
Winter Garden-area historical earthquake activity is significantly above Florida state average. It is 88% smaller than the overall U.S. average.On 9/10/2006 at 14:56:08, a magnitude 5.9 (5.9 MB, 5.5 MS, 5.8 MW, Class: Moderate, Intensity: VI - VII) earthquake occurred 348.6 miles away from the city center
On 11/22/1974 at 05:25:55, a magnitude 4.7 (4.7 MB, Class: Light, Intensity: IV - V) earthquake occurred 312.1 miles away from Winter Garden center
On 6/23/2016 at 17:20:29, a magnitude 3.8 (3.8 ML, Class: Light, Intensity: II - III) earthquake occurred 162.6 miles away from the city center
On 9/4/2016 at 18:29:29, a magnitude 3.8 (3.8 ML) earthquake occurred 162.6 miles away from the city center
On 9/21/2016 at 16:30:52, a magnitude 3.8 (3.8 ML) earthquake occurred 163.4 miles away from the city center
On 7/16/2016 at 20:00:10, a magnitude 3.7 (3.7 MB) earthquake occurred 154.3 miles away from the city center
Magnitude types: body-wave magnitude (MB), local magnitude (ML), surface-wave magnitude (MS), moment magnitude (MW)
Natural disasters:
The number of natural disasters in Orange County (20) is greater than the US average (15).Major Disasters (Presidential) Declared: 9
Emergencies Declared: 6
Causes of natural disasters: Hurricanes: 10, Fires: 5, Tropical Storms: 4, Tornado: 1, Other: 1 (Note: some incidents may be assigned to more than one category).
Hospitals and medical centers in Winter Garden:
located in Winter Garden:
Amtrak stations near Winter Garden:
- 13 miles: ORLANDO (1400 SLIGH BLVD.) . Services: ticket office, fully wheelchair accessible, enclosed waiting area, public restrooms, public payphones, vending machines, free short-term parking, car rental agency, taxi stand, public transit connection.
- 14 miles: LAKE BUENA VISTA (12521 RTE. 535) - Bus Station . Services: fully wheelchair accessible.
- 15 miles: WINTER PARK (150 W. MORSE BLVD.) . Services: ticket office, partially wheelchair accessible, enclosed waiting area, public restrooms, public payphones, full-service food facilities, free short-term parking, free long-term parking, call for car rental service, taxi stand, public transit connection.
College/University in Winter Garden:
Colleges/universities with over 2000 students nearest to Winter Garden:
- Valencia College (about 8 miles; Orlando, FL; Full-time enrollment: 30,467)
- Everest University-South Orlando (about 13 miles; Orlando, FL; FT enrollment: 33,859)
- Universal Technical Institute-Auto Motorcycle & Marine Mechanics Institute Division-Orlando (about 15 miles; Orlando, FL; FT enrollment: 4,338)
- Rollins College (about 15 miles; Winter Park, FL; FT enrollment: 3,085)
- Full Sail University (about 18 miles; Winter Park, FL; FT enrollment: 31,435)
- Seminole State College of Florida (about 22 miles; Sanford, FL; FT enrollment: 14,124)
- Lake-Sumter State College (about 23 miles; Leesburg, FL; FT enrollment: 2,983)
Public high schools in Winter Garden:
- WEST ORANGE HIGH (Students: 1,592, Location: 1625 BEULAH RD, Grades: 9-12)
- WESTSIDE TECH (Location: 955 E STORY RD, Grades: 9-12)
Private high schools in Winter Garden:
Biggest public elementary/middle schools in Winter Garden:
- LAKEVIEW MIDDLE (Students: 1,338, Location: 1200 W BAY ST, Grades: 6-8)
- WHISPERING OAK ELEMENTARY (Students: 645, Location: 15300 STONEYBROOK WEST PKWY, Grades: PK-5)
- LAKE WHITNEY ELEMENTARY (Students: 538, Location: 1351 WINDEMERE RD, Grades: PK-5)
- DILLARD STREET ELEMENTARY (Students: 445, Location: 311 N DILLARD ST, Grades: PK-5)
- TILDENVILLE ELEMENTARY (Students: 418, Location: 1221 BRICK RD, Grades: PK-5)
- WILLIAM S MAXEY ELEMENTARY (Students: 105, Location: 1100 E MAPLE ST, Grades: PK-5)
- BRIDGEWATER MIDDLE (Location: 5600 TINY RD, Grades: 6-8)
- SUNRIDGE ELEMENTARY (Location: 14455 SUNRIDGE BLVD, Grades: PK-5)
- MONTESSORI OF WINTER GARDEN CHARTER (Location: 855 E PLANT ST STE 600, Grades: KG-8, Charter school)
- SUNRIDGE MIDDLE (Location: 14955 SUNRIDGE BLVD, Grades: 6-8)
Private elementary/middle schools in Winter Garden:
User-submitted facts and corrections:
- WKES 91.1 FM owned by Moody Bible Institute of Chicago is one of the strongest stations I can get in Winter Garden, FL 34787 which is where I live added by Art
Points of interest:
Notable locations in Winter Garden: Winter Garden Communication Center (A), Orange County Library System West Orange Branch Library (B), Heritage Foundation History Center (C), Winter Garden Heritage Museum (D), Winter Garden Fire Department Station 24 Headquarters (E), Winter Garden Fire Department Station 23 (F), Winter Garden Police Department (G), Orange County Fire Rescue Department Station 34 (H). Display/hide their locations on the map
Shopping Centers: Tri City Center Shopping Center (1), Winter Gardens Regal Shopping Center (2), Winter Garden Regional Shopping Center (3). Display/hide their locations on the map
Churches in Winter Garden include: First Baptist Church of Winter Garden (A), Saint John Lutheran Church (B), Christian Life Fellowship (C), Church of Abundant Life (D), First United Methodist Church of Winter Garden (E), Seventh Day Adventist Church (F), Park Avenue Baptist Church (G), Free Will Baptist Temple (H), Apostolic Gospel Church (I). Display/hide their locations on the map
Lake: Lake Beulah (A). Display/hide its location on the map
Parks in Winter Garden include: Lakeview Park (1), Irrgain Park (2). Display/hide their locations on the map
Hotel: Best Value Inn Orlando West (13607 West Colonial Drive).
Birthplace of: Jeff Demps - Sprinter, Mason Williams (baseball) - Baseball player.
Drinking water stations with addresses in Winter Garden and their reported violations in the past:
CITRUS COVE SUBDIVISION (Population served: 130, Groundwater):Past health violations:LAKE JOHN'S MOTEL (Population served: 95, Groundwater):Past monitoring violations:
- MCL, Monthly (TCR) - In SEP-2011, Contaminant: Coliform. Follow-up actions: St Public Notif requested (SEP-28-2011), St Public Notif received (OCT-26-2011), St Compliance achieved (OCT-28-2011)
- Follow-up Or Routine LCR Tap M/R - In JUL-01-2002, Contaminant: Lead and Copper Rule. Follow-up actions: St Compliance achieved (OCT-04-2009)
- Follow-up Or Routine LCR Tap M/R - In JUL-01-2002, Contaminant: Lead and Copper Rule
Past monitoring violations:KOREAN PRESBYTERIAN CHURCH OF ORLANDO (Population served: 25, Groundwater):
- Failure to Conduct Assessment Monitoring - Between APR-2014 and JUN-2014, Contaminant: E. COLI
- One routine major monitoring violation
Past monitoring violations:
- Failure to Conduct Assessment Monitoring - Between JUL-2013 and SEP-2013, Contaminant: E. COLI. Follow-up actions: St Tech Assistance Visit (NOV-07-2013), St Public Notif received (NOV-17-2013), St Compliance achieved (DEC-18-2013), St Tech Assistance Visit (DEC-18-2013)
- Monitoring, Source Water (GWR) - In SEP-01-2012, Contaminant: E. COLI
- Monitoring, Repeat Major (TCR) - In SEP-2012, Contaminant: Coliform (TCR)
- 2 routine major monitoring violations
| This city: | 2.9 people |
| Florida: | 2.5 people |
| This city: | 75.3% |
| Whole state: | 65.2% |
| This city: | 6.8% |
| Whole state: | 7.3% |
Likely homosexual households (counted as self-reported same-sex unmarried-partner households)
- Lesbian couples: 0.4% of all households
- Gay men: 0.4% of all households
14 people in emergency and transitional shelters (with sleeping facilities) for people experiencing homelessness in 2010
321 people in nursing homes in 2000
36 people in other noninstitutional group quarters in 2000
Banks with most branches in Winter Garden (2011 data):
- Wells Fargo Bank, National Association: Fowler Groves Branch at 3301 Daniels Road, branch established on 2007/11/19; South Dillard St Branch at 801 South Dillard Street, branch established on 1979/07/16. Info updated 2011/04/05: Bank assets: $1,161,490.0 mil, Deposits: $905,653.0 mil, headquarters in Sioux Falls, SD, positive income, 6395 total offices, Holding Company: Wells Fargo & Company
- Regions Bank: Stoneybrook West Branch at 15508 Stoneybrook West Pkwy, branch established on 2007/12/17; Winter Garden Branch at 14075 West Colonial Drive, branch established on 1992/09/01. Info updated 2011/02/24: Bank assets: $123,368.2 mil, Deposits: $98,301.3 mil, headquarters in Birmingham, AL, positive income, Commercial Lending Specialization, 1778 total offices, Holding Company: Regions Financial Corporation
- Fifth Third Bank: The Groves Branch at 3004 Daniels Rd., branch established on 2007/12/17. Info updated 2009/10/05: Bank assets: $114,540.4 mil, Deposits: $89,689.1 mil, headquarters in Cincinnati, OH, positive income, Commercial Lending Specialization, 1378 total offices, Holding Company: Fifth Third Bancorp
- Branch Banking and Trust Company: Winter Garden Branch at 3650 Winter Garden Vineland Road, branch established on 2007/08/06. Info updated 2010/03/29: Bank assets: $168,867.6 mil, Deposits: $127,549.5 mil, headquarters in Winston Salem, NC, positive income, Commercial Lending Specialization, 1793 total offices, Holding Company: Bb&T Corporation
- SunTrust Bank: Winter Garden Branch at 13502 W Colonial Dr, branch established on 2005/02/28. Info updated 2010/05/27: Bank assets: $171,291.7 mil, Deposits: $129,833.2 mil, headquarters in Atlanta, GA, positive income, Commercial Lending Specialization, 1716 total offices, Holding Company: Suntrust Banks, Inc.
- BMO Harris Bank National Association: Winter Garden Branch at 950 S Dillard Street, branch established on 2009/10/19. Info updated 2011/07/14: Bank assets: $97,264.0 mil, Deposits: $75,624.6 mil, headquarters in Chicago, IL, positive income, 717 total offices, Holding Company: Bank Of Montreal
- TrustCo Bank: Winter Garden Branch at 16118 Marsh Rd, branch established on 2008/07/07. Info updated 2011/07/21: Bank assets: $4,250.1 mil, Deposits: $3,736.0 mil, headquarters in Glenville, NY, positive income, Mortgage Lending Specialization, 135 total offices
- First Southern Bank: West Orange Office at 12901 West Colonial Drive, branch established on 2002/04/08. Info updated 2011/01/10: Bank assets: $959.5 mil, Deposits: $791.5 mil, headquarters in Boca Raton, FL, positive income, Commercial Lending Specialization, 15 total offices, Holding Company: First Southern Bancorp, Inc.
- American Momentum Bank: Winter Garden Branch at Daniels Road, branch established on 2008/10/14. Info updated 2011/07/25: Bank assets: $934.1 mil, Deposits: $728.1 mil, headquarters in Tampa, FL, positive income, Commercial Lending Specialization, 22 total offices, Holding Company: Adam Bank Group, Inc.
- 3 other banks with 3 local branches
For population 15 years and over in Winter Garden:
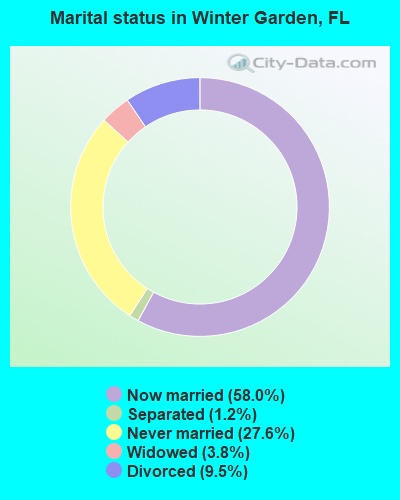
- Never married: 27.6%
- Now married: 58.0%
- Separated: 1.2%
- Widowed: 3.8%
- Divorced: 9.5%
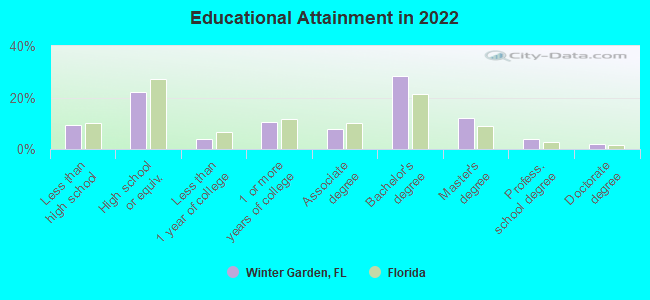
For population 25 years and over in Winter Garden:
- High school or higher: 90.1%
- Bachelor's degree or higher: 42.4%
- Graduate or professional degree: 17.1%
- Unemployed: 4.5%
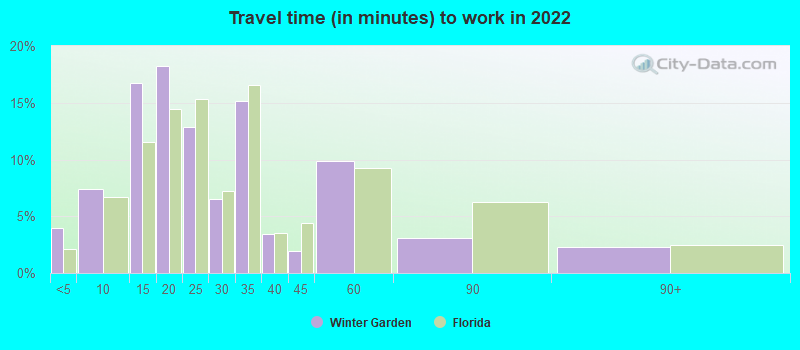
- Mean travel time to work (commute): 21.6 minutes
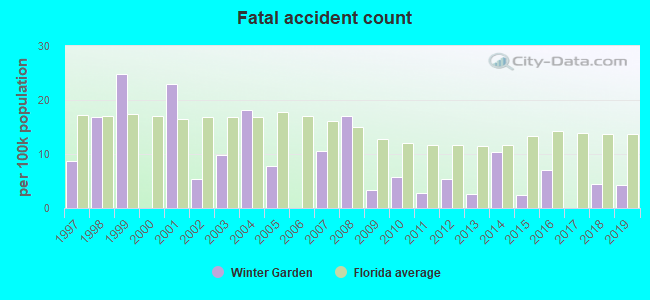
| Here: | 12.8 |
| Florida average: | 12.2 |
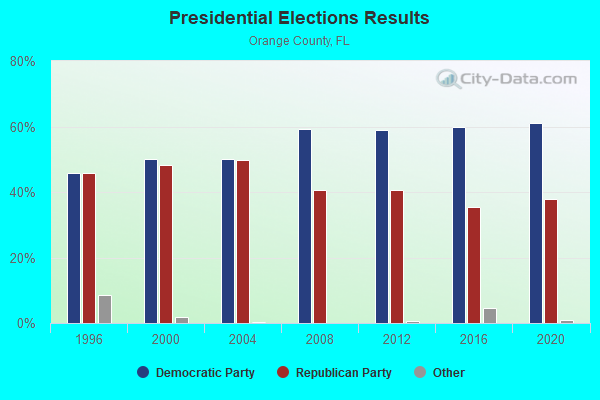
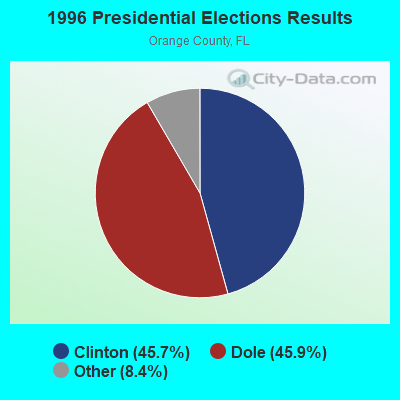
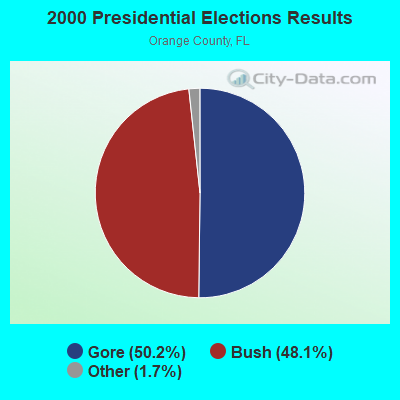
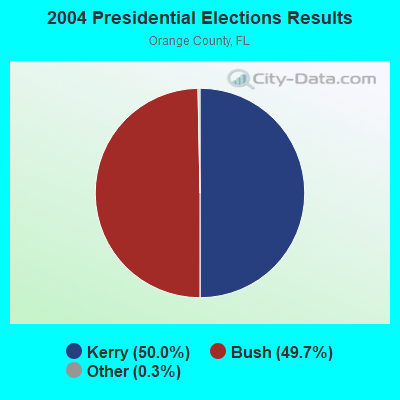
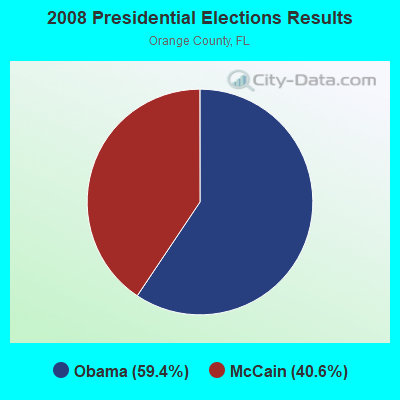
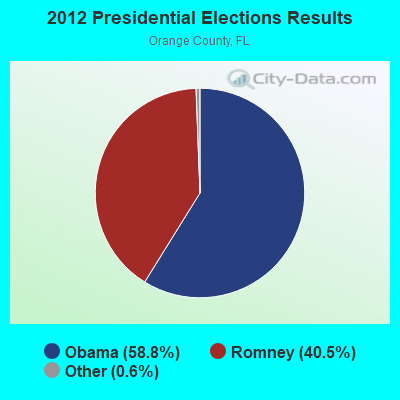
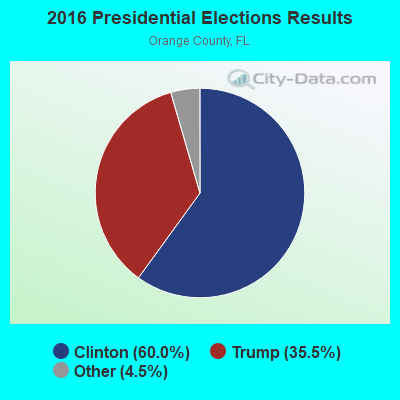
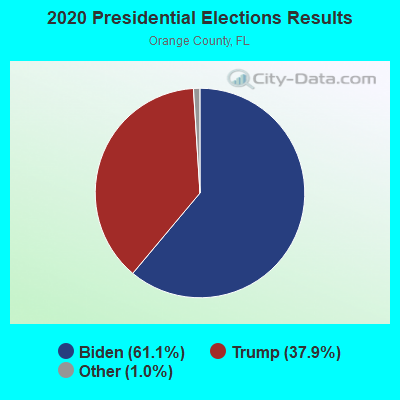
Graphs represent county-level data. Detailed 2008 Election Results
Neighborhoods in Winter Garden:
(Winter Garden, Florida Neighborhood Map)Religion statistics for Winter Garden, FL (based on Orange County data)
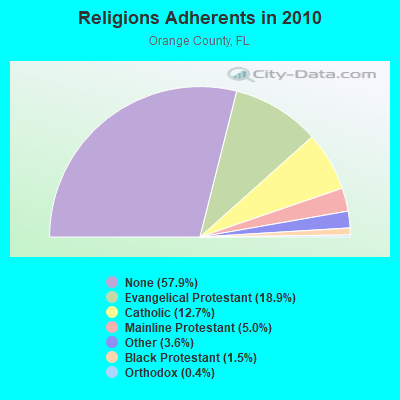
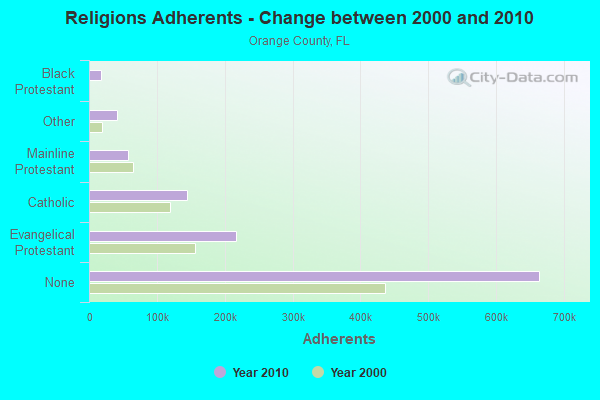
| Religion | Adherents | Congregations |
|---|---|---|
| Evangelical Protestant | 216,980 | 575 |
| Catholic | 145,082 | 21 |
| Mainline Protestant | 57,086 | 93 |
| Other | 41,245 | 85 |
| Black Protestant | 17,240 | 41 |
| Orthodox | 4,620 | 9 |
| None | 663,703 | - |
Food Environment Statistics:
| This county: | 2.16 / 10,000 pop. |
| Florida: | 2.04 / 10,000 pop. |
| This county: | 0.15 / 10,000 pop. |
| Florida: | 0.11 / 10,000 pop. |
| Orange County: | 1.15 / 10,000 pop. |
| Florida: | 1.28 / 10,000 pop. |
| This county: | 3.43 / 10,000 pop. |
| State: | 3.04 / 10,000 pop. |
| Orange County: | 8.28 / 10,000 pop. |
| Florida: | 7.45 / 10,000 pop. |
| This county: | 9.1% |
| State: | 9.2% |
| Orange County: | 23.0% |
| Florida: | 23.7% |
| Here: | 13.7% |
| Florida: | 14.0% |
Health and Nutrition:
| This city: | 52.5% |
| Florida: | 51.4% |
| Winter Garden: | 51.9% |
| Florida: | 49.4% |
| This city: | 28.2 |
| Florida: | 28.6 |
| Here: | 18.4% |
| Florida: | 19.5% |
| Here: | 9.6% |
| Florida: | 10.7% |
| This city: | 6.9 |
| Florida: | 6.9 |
| Winter Garden: | 33.2% |
| State: | 34.7% |
| Winter Garden: | 59.4% |
| Florida: | 57.0% |
| This city: | 81.0% |
| Florida: | 79.2% |
More about Health and Nutrition of Winter Garden, FL Residents
| Local government employment and payroll (March 2022) | |||||
| Function | Full-time employees | Monthly full-time payroll | Average yearly full-time wage | Part-time employees | Monthly part-time payroll |
|---|---|---|---|---|---|
| Police Protection - Officers | 80 | $478,834 | $71,825 | 0 | $0 |
| Firefighters | 59 | $385,964 | $78,501 | 0 | $0 |
| Other and Unallocable | 34 | $171,440 | $60,508 | 5 | $8,215 |
| Police - Other | 27 | $120,597 | $53,599 | 24 | $9,809 |
| Other Government Administration | 24 | $145,377 | $72,689 | 1 | $797 |
| Solid Waste Management | 17 | $95,786 | $67,614 | 0 | $0 |
| Parks and Recreation | 16 | $71,547 | $53,660 | 21 | $14,678 |
| Sewerage | 14 | $64,484 | $55,272 | 0 | $0 |
| Financial Administration | 13 | $81,686 | $75,402 | 0 | $0 |
| Water Supply | 10 | $53,672 | $64,406 | 0 | $0 |
| Streets and Highways | 4 | $30,286 | $90,858 | 0 | $0 |
| Natural Resources | 2 | $8,086 | $48,516 | 0 | $0 |
| Fire - Other | 1 | $4,712 | $56,544 | 0 | $0 |
| Totals for Government | 301 | $1,712,471 | $68,271 | 51 | $33,499 |
Winter Garden government finances - Expenditure in 2021 (per resident):
- Construction - Regular Highways: $4,029,000 ($85.63)
General - Other: $30,000 ($0.64)
- Current Operations - Police Protection: $11,523,000 ($244.91)
Sewerage: $11,024,000 ($234.31)
Local Fire Protection: $7,318,000 ($155.54)
Solid Waste Management: $6,361,000 ($135.20)
Natural Resources - Other: $3,951,000 ($83.98)
Parks and Recreation: $3,731,000 ($79.30)
Financial Administration: $3,380,000 ($71.84)
Water Utilities: $3,152,000 ($66.99)
Regular Highways: $2,172,000 ($46.16)
Central Staff Services: $1,852,000 ($39.36)
Protective Inspection and Regulation - Other: $1,357,000 ($28.84)
Judicial and Legal Services: $419,000 ($8.91)
General - Other: $360,000 ($7.65)
Public Welfare - Other: $69,000 ($1.47)
Parking Facilities: $4,000 ($0.09)
- General - Interest on Debt: $436,000 ($9.27)
- Other Capital Outlay - Parks and Recreation: $1,176,000 ($25.00)
Police Protection: $737,000 ($15.66)
Local Fire Protection: $547,000 ($11.63)
Financial Administration: $229,000 ($4.87)
Natural Resources - Other: $227,000 ($4.82)
Housing and Community Development: $182,000 ($3.87)
Central Staff Services: $3,000 ($0.06)
- Water Utilities - Interest on Debt: $163,000 ($3.46)
Winter Garden government finances - Revenue in 2021 (per resident):
- Charges - Sewerage: $5,946,000 ($126.38)
Solid Waste Management: $5,550,000 ($117.96)
Other: $3,924,000 ($83.40)
Miscellaneous Commercial Activities: $384,000 ($8.16)
Parks and Recreation: $309,000 ($6.57)
- Federal Intergovernmental - Other: $758,000 ($16.11)
Highways: $11,000 ($0.23)
- Local Intergovernmental - Other: $3,852,000 ($81.87)
General Local Government Support: $773,000 ($16.43)
- Miscellaneous - Special Assessments: $4,483,000 ($95.28)
Interest Earnings: $2,081,000 ($44.23)
Rents: $496,000 ($10.54)
Sale of Property: $442,000 ($9.39)
General Revenue - Other: $165,000 ($3.51)
Fines and Forfeits: $88,000 ($1.87)
Donations From Private Sources: $2,000 ($0.04)
- Revenue - Water Utilities: $6,121,000 ($130.10)
- State Intergovernmental - General Local Government Support: $8,164,000 ($173.52)
Highways: $41,000 ($0.87)
Other: $38,000 ($0.81)
- Tax - Property: $16,170,000 ($343.68)
Public Utilities Sales: $6,112,000 ($129.91)
Other License: $4,994,000 ($106.14)
Occupation and Business License - Other: $3,203,000 ($68.08)
Insurance Premiums Sales: $1,510,000 ($32.09)
Motor Fuels Sales: $1,341,000 ($28.50)
Winter Garden government finances - Debt in 2021 (per resident):
- Long Term Debt - Beginning Outstanding - Unspecified Public Purpose: $20,108,000 ($427.38)
Outstanding Unspecified Public Purpose: $18,404,000 ($391.17)
Retired Unspecified Public Purpose: $1,438,000 ($30.56)
Winter Garden government finances - Cash and Securities in 2021 (per resident):
- Other Funds - Cash and Securities: $97,654,000 ($2075.58)
- Sinking Funds - Cash and Securities: $3,450,000 ($73.33)
9.30% of this county's 2021 resident taxpayers lived in other counties in 2020 ($65,230 average adjusted gross income)
| Here: | 9.30% |
| Florida average: | 8.80% |
0.07% of residents moved from foreign countries ($313 average AGI)
Orange County: 0.07% Florida average: 0.05%
Top counties from which taxpayers relocated into this county between 2020 and 2021:
| from Seminole County, FL | |
| from Osceola County, FL | |
| from Lake County, FL |
9.84% of this county's 2020 resident taxpayers moved to other counties in 2021 ($59,746 average adjusted gross income)
| Here: | 9.84% |
| Florida average: | 7.45% |
0.07% of residents moved to foreign countries ($244 average AGI)
Orange County: 0.07% Florida average: 0.04%
Top counties to which taxpayers relocated from this county between 2020 and 2021:
| to Osceola County, FL | |
| to Seminole County, FL | |
| to Polk County, FL |
| Businesses in Winter Garden, FL | ||||
| Name | Count | Name | Count | |
|---|---|---|---|---|
| 7-Eleven | 4 | Kmart | 1 | |
| ALDI | 1 | Lane Bryant | 1 | |
| AT&T | 1 | Lane Furniture | 1 | |
| Ace Hardware | 1 | LensCrafters | 1 | |
| Advance Auto Parts | 1 | Lowe's | 1 | |
| American Eagle Outfitters | 1 | Marshalls | 1 | |
| Barnes & Noble | 1 | MasterBrand Cabinets | 2 | |
| Bath & Body Works | 1 | McDonald's | 2 | |
| Bed Bath & Beyond | 1 | Men's Wearhouse | 2 | |
| Blockbuster | 1 | New Balance | 1 | |
| Burger King | 1 | New York & Co | 1 | |
| CVS | 1 | Nike | 1 | |
| Chick-Fil-A | 1 | Old Navy | 1 | |
| Chico's | 1 | Pac Sun | 1 | |
| Chipotle | 1 | Panda Express | 1 | |
| Circle K | 2 | Panera Bread | 1 | |
| Cold Stone Creamery | 1 | Payless | 1 | |
| Coldwater Creek | 1 | Penske | 1 | |
| Cracker Barrel | 1 | PetSmart | 1 | |
| Curves | 1 | Pizza Hut | 1 | |
| DressBarn | 1 | Publix Super Markets | 2 | |
| Dressbarn | 1 | Quiznos | 1 | |
| Dunkin Donuts | 1 | Sprint Nextel | 1 | |
| Famous Footwear | 1 | Staples | 1 | |
| FedEx | 6 | Starbucks | 2 | |
| GNC | 1 | Taco Bell | 2 | |
| GameStop | 1 | Target | 1 | |
| Goodwill | 3 | Toys"R"Us | 1 | |
| H&R Block | 1 | U-Haul | 3 | |
| Havertys Furniture | 1 | UPS | 7 | |
| IHOP | 1 | Verizon Wireless | 2 | |
| JoS. A. Bank | 1 | Victoria's Secret | 1 | |
| Jones New York | 1 | Walgreens | 3 | |
| Justice | 1 | YMCA | 1 | |
| KFC | 2 | |||
Strongest AM radio stations in Winter Garden:
- WQTM (740 AM; 50 kW; ORLANDO, FL; Owner: CLEAR CHANNEL BROADCASTING LICENSES, INC.)
- WDYZ (990 AM; 50 kW; ORLANDO, FL; Owner: ABC, INC.)
- WLAA (1680 AM; 10 kW; WINTER GARDEN, FL; Owner: RAMA COMMUNICATIONS, INC.)
- WFLF (540 AM; 50 kW; PINE HILLS, FL; Owner: CLEAR CHANNEL BROADCASTING LICENSES, INC.)
- WOKB (1600 AM; 5 kW; WINTER GARDEN, FL)
- WTLN (950 AM; 12 kW; ORLANDO, FL; Owner: TM2, INC.)
- WUNA (1480 AM; 1 kW; OCOEE, FL; Owner: WAY BROADCASTING, INC.)
- WHOO (1080 AM; daytime; 35 kW; KISSIMMEE, FL; Owner: GENESIS COMMUNICATIONS I, INC.)
- WDBO (580 AM; 5 kW; ORLANDO, FL; Owner: COX RADIO, INC.)
- WONQ (1030 AM; 45 kW; OVIEDO, FL; Owner: FLORIDA BROADCASTERS)
- WHIM (1520 AM; 5 kW; APOPKA, FL; Owner: ALTON RAINBOW CORPORATION)
- WRLZ (1270 AM; 5 kW; EATONVILLE, FL; Owner: RADIO LUZ, INC.)
- WRMQ (1140 AM; 5 kW; ORLANDO, FL; Owner: FLORIDA BROADCASTERS)
Strongest FM radio stations in Winter Garden:
- WXXL (106.7 FM; TAVARES, FL; Owner: AMFM RADIO LICENSES, L.L.C.)
- WPYO (95.3 FM; APOPKA, FL; Owner: CXR HOLDINGS, INC.)
- WLOQ (103.1 FM; WINTER PARK, FL; Owner: GROSS COMMUNICATIONS CORPORATION)
- WWKQ (88.7 FM; CLERMONT, FL; Owner: HISPANIC BROADCAST SYSTEM, INC.)
- WMMO (98.9 FM; ORLANDO, FL; Owner: COX RADIO, INC.)
- WMGF (107.7 FM; MOUNT DORA, FL; Owner: CLEAR CHANNEL BROADCASTING LICENSES, INC.)
- WOMX-FM (105.1 FM; ORLANDO, FL; Owner: INFINITY RADIO OPERATIONS INC.)
- WJRR (101.1 FM; COCOA BEACH, FL; Owner: CLEAR CHANNEL BROADCASTING LICENSES, INC.)
- WSHE (100.3 FM; ORLANDO, FL; Owner: CLEAR CHANNEL BROADCASTING LICENSES, INC.)
- WTKS-FM (104.1 FM; COCOA BEACH, FL; Owner: CLEAR CHANNEL BROADCASTING LICENSES, INC.)
- WPCV (97.5 FM; WINTER HAVEN, FL; Owner: HALL COMMUNICATIONS, INC.)
- WCFB (94.5 FM; DAYTONA BEACH, FL; Owner: COX RADIO, INC.)
- WHTQ (96.5 FM; ORLANDO, FL; Owner: COX RADIO, INC.)
- WOCL (105.9 FM; DELAND, FL; Owner: INFINITY RADIO OPERATIONS INC.)
- WWKA (92.3 FM; ORLANDO, FL; Owner: COX RADIO, INC.)
- WPOZ (88.3 FM; UNION PARK, FL; Owner: CENTRAL FLORIDA EDUCATIONAL FOUNDATION, INC.)
- WJHM (101.9 FM; DAYTONA BEACH, FL; Owner: INFINITY RADIO OPERATIONS INC.)
- WMFE-FM (90.7 FM; ORLANDO, FL; Owner: COMMUNITY COMMUNICATIONS, INC.)
- WUCF-FM (89.9 FM; ORLANDO, FL; Owner: UNIVERSITY OF CENTRAL FLORIDA)
- WLAZ (89.1 FM; KISSIMMEE, FL; Owner: CAGUAS EDUCATIONAL TV, INC.)
TV broadcast stations around Winter Garden:
- WZXZ-CA (Channel 11; ORLANDO, ETC., FL; Owner: THE BOX WORLDWIDE LLC)
- W21AU (Channel 21; ORLANDO, FL; Owner: CENTRAL BROADCAST COMPANY)
- W47AL (Channel 47; ORLANDO, FL; Owner: CONCILIO MISSION CRISTIANA FUENTE)
- WPXG-LP (Channel 31; ORLANDO, FL; Owner: TIGER EYE BROADCASTING CORPORATION)
- WESH (Channel 2; DAYTONA BEACH, FL; Owner: ORLANDO HEARST-ARGYLE TELEVISION, INC.)
- WFTV (Channel 9; ORLANDO, FL; Owner: WFTV-TV HOLDINGS, INC.)
- WOKB-LP (Channel 7; ORLANDO, FL; Owner: RAMA COMMUNICATIONS)
- WKMG-TV (Channel 6; ORLANDO, FL; Owner: POST-NEWSWEEK STATIONS ORLANDO, INC.)
- WACX (Channel 55; LEESBURG, FL; Owner: ASSOCIATED CHRISTIAN TELEVISION SYSTEM, INC.)
- WRBW (Channel 65; ORLANDO, FL; Owner: FOX TELEVISION STATIONS, INC.)
- WKCF (Channel 18; CLERMONT, FL; Owner: EMMIS TELEVISION LICENSE CORPORATION)
- WLCB-TV (Channel 45; LEESBURG, FL; Owner: GOOD LIFE BROADCASTING, INC.)
- WXXU-LP (Channel 12; ALTAMONTE SPRINGS, FL; Owner: RAMA COMMUNICATIONS)
- WVCI-LP (Channel 16; ORLANDO, FL; Owner: ENTRAVISION HOLDINGS, LLC)
- WVEN-TV (Channel 26; DAYTONA BEACH, FL; Owner: ENTRAVISION HOLDINGS, LLC)
- WOFL (Channel 35; ORLANDO, FL; Owner: FOX TELEVISION STATIONS, INC.)
- WRCF-LP (Channel 29; ORLANDO, FL; Owner: CHARLES S. NAMEY)
- WRDQ (Channel 27; ORLANDO, FL; Owner: WFTV-TV HOLDINGS, INC.)
- WMFE-TV (Channel 24; ORLANDO, FL; Owner: COMMUNITY COMMUNICATIONS, INC.)
- WFOL-LP (Channel 4; ORLANDO, FL; Owner: NATIVE COUNTRY B/CING. CORPORATION)
- WTGL-TV (Channel 52; COCOA, FL; Owner: GOOD LIFE BROADCASTING, INC.)
- WTOF-LP (Channel 22; ORLANDO, FL; Owner: CHARLES S. NAMEY)
- WOPX (Channel 56; MELBOURNE, FL; Owner: PAXSON ORLANDO LICENSE, INC.)
- WBCC (Channel 68; COCOA, FL; Owner: BREVARD COMMUNITY COLLEGE)
- WTMO-LP (Channel 40; KISSIMMEE, FL; Owner: ZGS BROADCASTING OF ORLANDO, INC.)
- National Bridge Inventory (NBI) Statistics
- 39Number of bridges
- 541ft / 165mTotal length
- 1,022,202Total average daily traffic
- 130,789Total average daily truck traffic
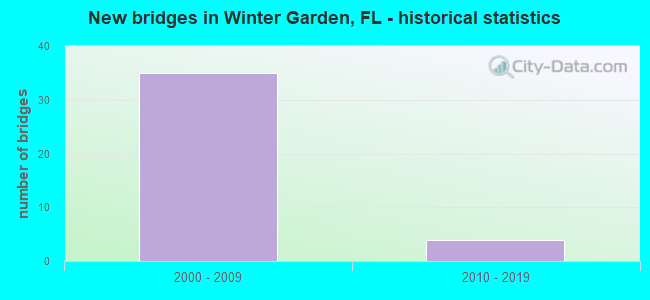
- New bridges - historical statistics
- 352000-2009
- 42010-2019
FCC Registered Commercial Land Mobile Towers: 1 (See the full list of FCC Registered Commercial Land Mobile Towers in Winter Garden, FL)
FCC Registered Private Land Mobile Towers: 3 (See the full list of FCC Registered Private Land Mobile Towers)
FCC Registered Broadcast Land Mobile Towers: 21 (See the full list of FCC Registered Broadcast Land Mobile Towers)
FCC Registered Microwave Towers: 33 (See the full list of FCC Registered Microwave Towers in this town)
FCC Registered Paging Towers: 7 (See the full list of FCC Registered Paging Towers)
FCC Registered Maritime Coast & Aviation Ground Towers: 1 (See the full list of FCC Registered Maritime Coast & Aviation Ground Towers)
FCC Registered Amateur Radio Licenses: 204 (See the full list of FCC Registered Amateur Radio Licenses in Winter Garden)
FAA Registered Aircraft Manufacturers and Dealers: 4 (See the full list of FAA Registered Manufacturers and Dealers in Winter Garden)
FAA Registered Aircraft: 55 (See the full list of FAA Registered Aircraft)
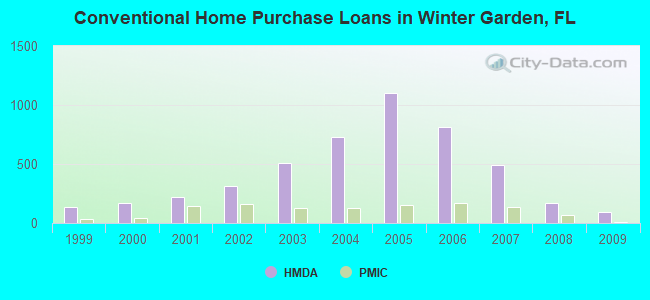
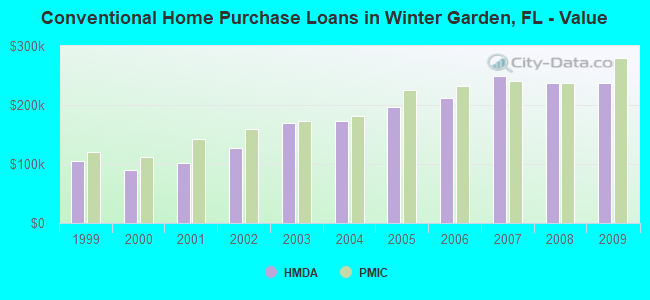
| Home Mortgage Disclosure Act Aggregated Statistics For Year 2009 (Based on 15 partial tracts) | ||||||||||||||
| A) FHA, FSA/RHS & VA Home Purchase Loans | B) Conventional Home Purchase Loans | C) Refinancings | D) Home Improvement Loans | E) Loans on Dwellings For 5+ Families | F) Non-occupant Loans on < 5 Family Dwellings (A B C & D) | G) Loans On Manufactured Home Dwelling (A B C & D) | ||||||||
|---|---|---|---|---|---|---|---|---|---|---|---|---|---|---|
| Number | Average Value | Number | Average Value | Number | Average Value | Number | Average Value | Number | Average Value | Number | Average Value | Number | Average Value | |
| LOANS ORIGINATED | 151 | $180,812 | 89 | $237,811 | 159 | $217,123 | 6 | $105,488 | 1 | $182,480 | 27 | $197,015 | 2 | $27,790 |
| APPLICATIONS APPROVED, NOT ACCEPTED | 7 | $191,446 | 8 | $229,645 | 18 | $198,927 | 1 | $41,680 | 0 | $0 | 2 | $158,320 | 1 | $84,750 |
| APPLICATIONS DENIED | 48 | $172,436 | 25 | $183,694 | 110 | $234,907 | 8 | $135,594 | 0 | $0 | 16 | $137,244 | 2 | $27,495 |
| APPLICATIONS WITHDRAWN | 14 | $182,143 | 13 | $254,208 | 55 | $221,266 | 3 | $65,417 | 0 | $0 | 7 | $137,117 | 0 | $0 |
| FILES CLOSED FOR INCOMPLETENESS | 9 | $182,857 | 3 | $378,233 | 18 | $220,289 | 1 | $88,470 | 0 | $0 | 1 | $211,500 | 0 | $0 |
Detailed HMDA statistics for the following Tracts: 0150.01 , 0171.04, 0171.05, 0172.00, 0173.00, 0174.00
| Private Mortgage Insurance Companies Aggregated Statistics For Year 2009 (Based on 14 partial tracts) | ||||||
| A) Conventional Home Purchase Loans | B) Refinancings | C) Non-occupant Loans on < 5 Family Dwellings (A & B) | ||||
|---|---|---|---|---|---|---|
| Number | Average Value | Number | Average Value | Number | Average Value | |
| LOANS ORIGINATED | 8 | $278,921 | 3 | $202,083 | 1 | $230,820 |
| APPLICATIONS APPROVED, NOT ACCEPTED | 5 | $249,144 | 1 | $416,890 | 1 | $263,310 |
| APPLICATIONS DENIED | 1 | $340,010 | 0 | $0 | 0 | $0 |
| APPLICATIONS WITHDRAWN | 2 | $184,405 | 0 | $0 | 0 | $0 |
| FILES CLOSED FOR INCOMPLETENESS | 1 | $124,810 | 0 | $0 | 1 | $124,810 |
Detailed PMIC statistics for the following Tracts: 0150.01 , 0171.04, 0171.05, 0172.00, 0173.00, 0174.00
2003 - 2018 National Fire Incident Reporting System (NFIRS) incidents
- Fire incident types reported to NFIRS in Winter Garden, FL
- 95645.3%Structure Fires
- 67932.2%Outside Fires
- 35416.8%Mobile Property/Vehicle Fires
- 1225.8%Other
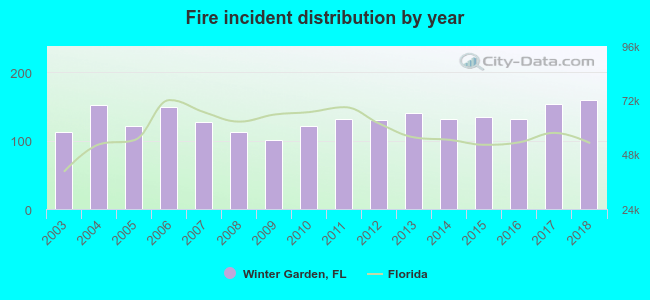 Based on the data from the years 2003 - 2018 the average number of fires per year is 132. The highest number of fire incidents - 159 took place in 2018, and the least - 101 in 2009. The data has a rising trend.
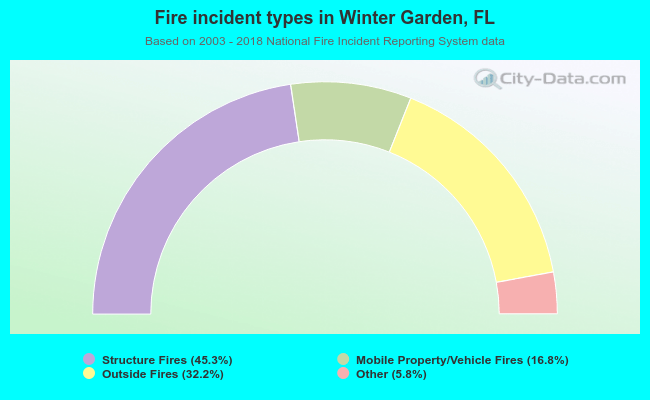 When looking into fire subcategories, the most incidents belonged to: Structure Fires (45.3%), and Outside Fires (32.2%).
Fire-safe hotels and motels in Winter Garden, Florida:
- Americas Best Value Inn, 13603 W Colonial Dr, Winter Garden, Florida 34787 , Phone: (407) 654-1188, Fax: (407) 654-0140
- Meadow Marsh Bed And Breakfast, 940 Tildenville School Rd, Winter Garden, Florida 34787
- SpringHill Suites Orlando at Flamingo Crossings Western Entrance, 13279 Flamingo Crossings Blvd Winter Garden Fl, Winter garden, Florida 34787 , Phone: (888) 236-2427, Fax: (407) 507-1201
- TownePlace Suites at Flamingo Crossings, 13295 Flamingo Crossings Blvd, Winter Garden, Florida 34787 , Phone: (888) 236-2427, Fax: (401) 507-1301
| Most common first names in Winter Garden, FL among deceased individuals | ||
| Name | Count | Lived (average) |
|---|---|---|
| Mary | 91 | 80.7 years |
| John | 80 | 75.1 years |
| James | 69 | 74.8 years |
| William | 61 | 75.7 years |
| Robert | 52 | 71.1 years |
| Charles | 39 | 73.9 years |
| George | 39 | 76.7 years |
| Joseph | 37 | 76.2 years |
| Richard | 33 | 71.9 years |
| Ruth | 33 | 80.4 years |
| Most common last names in Winter Garden, FL among deceased individuals | ||
| Last name | Count | Lived (average) |
|---|---|---|
| Smith | 44 | 77.0 years |
| Brown | 36 | 79.9 years |
| Johnson | 34 | 77.0 years |
| Williams | 29 | 73.9 years |
| Davis | 21 | 76.1 years |
| Jackson | 20 | 68.8 years |
| Wright | 19 | 72.5 years |
| Jones | 19 | 77.2 years |
| Thompson | 17 | 80.1 years |
| Walker | 16 | 76.5 years |
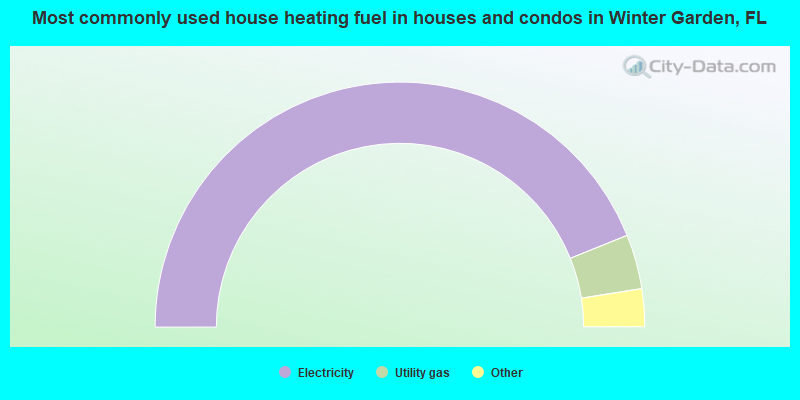
- 87.8%Electricity
- 7.2%Utility gas
- 2.0%Solar energy
- 2.0%No fuel used
- 1.1%Wood
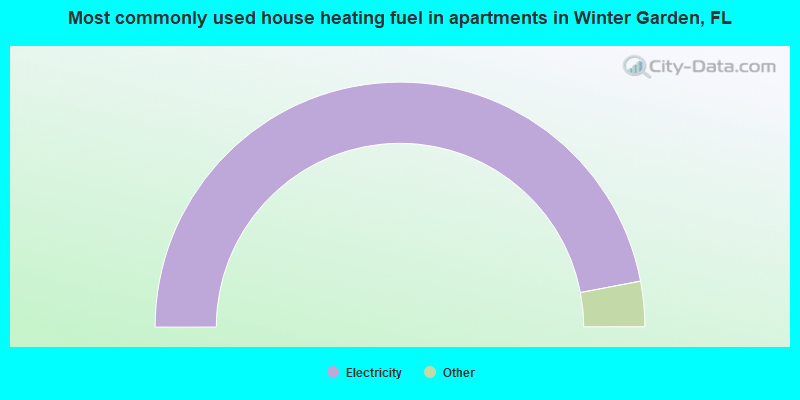
- 94.0%Electricity
- 2.5%Utility gas
- 2.1%No fuel used
- 1.4%Bottled, tank, or LP gas
Winter Garden compared to Florida state average:
- Unemployed percentage significantly below state average.
- Black race population percentage above state average.
- Hispanic race population percentage significantly above state average.
- Median age below state average.
- Foreign-born population percentage significantly above state average.
- Length of stay since moving in above state average.
- Number of rooms per house above state average.
- House age below state average.
- Number of college students above state average.
- Percentage of population with a bachelor's degree or higher above state average.
Winter Garden on our top lists:
- #47 on the list of "Top 101 cities with the largest percentage population increase from 2000 (population 5,000+)"
- #63 on the list of "Top 101 cities with the most residents born in Guyana (population 500+)"
- #82 on the list of "Top 101 cities with largest percentage of males in industries: arts, entertainment, and recreation (population 5,000+)"
- #93 on the list of "Top 100 cities with strongest arts, entertainment, recreation, accommodation and food services industries (pop. 5,000+)"
- #9 on the list of "Top 101 counties with the highest ground withdrawal of fresh water for public supply"
- #19 on the list of "Top 101 counties with the most Evangelical Protestant adherents"
- #20 on the list of "Top 101 counties with the most Evangelical Protestant congregations"
- #21 on the list of "Top 101 counties with the largest decrease in the number of deaths per 1000 residents 2000-2006 to 2007-2013 (pop. 50,000+)"
- #30 on the list of "Top 101 counties with the highest total withdrawal of fresh water for public supply (pop. 50,000+)"

|
|
Total of 222 patent applications in 2008-2024.