Austin, Texas, and Scottsdale, Arizona, are two prominent U.S. cities that draw both residents and tourists alike for different reasons. Each city has unique advantages - Austin is known for its vibrant music scene and booming tech industry, while Scottsdale is famous for its sunshine-filled climate, upscale lifestyle, and rich Western history. When considering factors such as crime and safety, weather, cost of living, and more, individuals will find distinctive differences and similarities between these two cities that could potentially influence the decision to relocate or visit.
Distance between
Austin, TX and
Scottsdale, AZ : 859.3 miles
Austin's population is larger by 297%. Its population has grown by 307,615 people (46.9%) since 2000. The population of Scottsdale has grown by 40,048 people (19.8%) during that time.
The crime rates in Austin and Scottsdale are different, with Scottsdale appearing safer overall. Based on FBI data, Scottsdale has a lower crime rate compared to national averages and significantly lower than Austin. While no city is free from crime, residents and tourists in Scottsdale can generally expect a safer environment than in Austin. Furthermore, both cities have robust local law enforcement agencies that work continuously to ensure public safety.
City-data.com crime index counts serious crimes and violent crime more heavily. It adjusts for the number of visitors and daily workers commuting into cities. (higher means more crime, U.S. average = 301.1)
City-data.com crime index counts serious crimes and violent crime more heavily. It adjusts for the number of visitors and daily workers commuting into cities. (higher means more crime, U.S. average = 301.1)
Sex Offenders
According to our data, there are 1,411 registered sex offenders living in Austin and 59 registered sex offenders living in . The ratio of residents to sex offenders in Austin is 672 to 1; the ratio in Scottsdale is 4,180 to 1. The number of registered sex offenders compared to the number of residents is much larger in Austin than that in Scottsdale.
Cost of Living
The cost of living in Scottsdale is relatively high compared to the national average, primarily due to housing costs. Austin, while still above the national average, is more affordable than Scottsdale. Groceries, health services, and utilities are also generally less expensive in Austin than in Scottsdale.
Income Tax
Texas, including Austin, does not impose a state income tax. Arizona imposes a state income tax, ranging from 2.59% to 4.50% based on income levels.
Property Tax
Property tax rates are considerably higher in Texas than in Arizona. The average effective property tax rate in Travis County (where Austin is located) is 1.81%, compared to just 0.63% in Maricopa County (where Scottsdale is situated).
Sales Tax
The total sales tax rate in Austin is 8.25%, made up of the Texas state rate of 6.25% plus Austin’s city tax of 2%. Scottsdale has a significantly higher total sales tax rate of 7.95%, with the Arizona state rate being 5.6% and Scottsdale's city tax being 1.75%.
Income
Type
Austin
Scottsdale
Estimated median household income
$79,542
$99,097
Estimated per capita income
$53,937
$74,952
Cost of living index (U.S. average is 100)
96.4
105
If you make $50,000 in Austin, you will have to make $54,461 in Scottsdale to maintain the same standard of living.
Geographical Conditions
Austin is hill country with many outdoor spaces for hiking, biking, and water-related activities with numerous lakes and rivers. Scottsdale is located in the Sonoran Desert and offers picturesque landscapes, desert trails, and golf courses.
Both Austin and Scottsdale have excellent education systems. Austin is home to the University of Texas, one of the largest universities in the U.S, and prides itself on a strong public school system. Scottsdale is also well-regarded for its highly-rated public schools and is home to a significant number of charter and private schools. Both cities value education and offer various opportunities for learning and development.
Austin leads as a hub for the tech industry, with large tech companies like Oracle, Dell, and Indeed headquartered there. Scottsdale is known for its tourism, healthcare, and financial services sectors. Both cities have a strong economy and offer diverse job opportunities. Interestingly, Austin's job growth rate is higher than Scottsdale's, making it an attractive destination for job seekers.
Biggest Employers
In Austin, the biggest employers are the state of Texas, the University of Texas at Austin, Dell Technologies, among others. Meanwhile, in Scottsdale, the largest employers include HonorHealth, Vanguard Group, and the city of Scottsdale itself.
There were 4,180 building permits issued in Austin in 2012 (2467 more than in 2011) compared to 553 building permits issued in Scottsdale in 2012 (405 more than in 2011).
In Austin (Travis County), 60.2% voted for Democrats and 36.2% for Republicans in 2012 Presidential Election. In Scottsdale (Maricopa County), 43.6% voted for Democrats and 54.3% for Republicans.
Elections
Type
Democrats
Republicans
Other
Year
Austin
Scottsdale
Austin
Scottsdale
Austin
Scottsdale
2020
71.7%
50.2%
26.5%
48.0%
1.8%
1.8%
2016
65.8%
44.9%
27.2%
47.7%
7.0%
7.5%
2012
60.2%
43.6%
36.2%
54.3%
3.6%
2.1%
2008
63.8%
44.0%
34.4%
54.5%
1.8%
1.5%
2004
56.1%
42.4%
42.1%
57.0%
1.8%
0.6%
2000
41.7%
43.0%
47.0%
53.4%
11.3%
3.6%
1996
52.4%
44.5%
40.0%
47.2%
7.7%
8.2%
Breakdown of population affiliated with a religious congregation
Type
Adherents
Congregations
Religion
Austin
Scottsdale
Austin
Scottsdale
CATHOLIC CHURCH
17.3%
13.6%
4.5%
4.3%
SOUTHERN BAPTIST CONVENTION
8.0%
1.9%
22.8%
6.5%
EPISCOPAL CHURCH
1.4%
0.3%
2.8%
1.3%
MUSLIM ESTIMATE
1.2%
0.2%
0.7%
1.0%
EVANGELICAL LUTHERAN CHURCH IN AMERICA
1.0%
0.8%
2.5%
2.0%
LUTHERAN CHURCH
0.9%
0.5%
2.1%
1.5%
SEVENTH DAY ADVENTIST CHURCH
0.2%
0.4%
1.0%
2.0%
VINEYARD USA
0.0%
0.3%
0.3%
0.6%
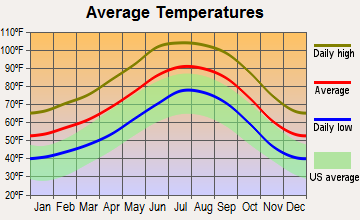
Weather
The weather significantly differs between Austin and Scottsdale. Austin has a humid subtropical climate with hot summers and mild winters, while Scottsdale experiences a desert climate characterized by hot summers and mild to cool winters. Scottsdale is also one of the sunniest cities in the world, offering year-round sun and heat, which contrasts with Austin's more humid and rainy warm seasons.
Weather and climate
Type
Austin
Scottsdale
Temperature - Average
68.5°F
71.6°F
Humidity - Average morning or afternoon humidity
75.2%
37.5%
Humidity - Differences between morning and afternoon humidity
40%
48%
Humidity - Maximum monthly morning or afternoon humidity
89%
60%
Humidity - Minimum monthly morning or afternoon humidity
49%
12%
Precipitation - Yearly average
33.7 in
9.9 in
Snowfall - Yearly average
1.4 in
0 in
Clouds - Number of days clear of clouds
19.3%
35.3%
Sunshine amount - Average
63.3%
92.8%
Sunshine amount - Differences during a year
22%
16%
Sunshine amount - Maximum monthly
72%
95%
Sunshine amount - Minimum monthly
50%
79%
Wind speed - Average
7.2 mph
6.6 mph
Average climate in Austin, Texas
Average climate in Scottsdale, Arizona
Air pollution
Type
AQI
CO
NO2
OZONE
PM10
PM25
SO2
Year
Austin
Scottsdale
Austin
Scottsdale
Austin
Scottsdale
Austin
Scottsdale
Scottsdale
Austin
Scottsdale
Austin
Scottsdale
2018
76
150
N/A
0.35
4.9
15.0
26.7
31.7
35.6
N/A
8.7
7.8
0.2
0.6
2017
76
116
N/A
0.37
4.6
15.7
29.7
31.9
33.1
N/A
8.3
7.4
0.3
1.4
2016
71
106
N/A
0.35
4.2
15.4
29.5
31.2
32.1
N/A
8.2
7.1
0.2
0.4
2015
78
101
N/A
0.35
4.4
17.2
28.9
29.7
27.1
N/A
8.6
7.3
0.3
0.9
2014
74
116
N/A
0.39
5.2
19.2
28.3
29.8
35.1
N/A
8.7
8.3
0.5
1.1
2013
78
127
0.09
0.35
5.5
19.5
29.5
31.2
32.0
N/A
8.6
7.8
0.5
0.9
2012
86
157
0.13
0.37
5.5
20.8
30.1
31.2
36.9
N/A
8.6
8.8
N/A
1.3
2011
83
204
0.11
0.38
2.6
17.2
33.0
31.3
38.7
N/A
9.1
9.5
N/A
0.9
2010
77
100
0.05
0.38
3.2
13.7
29.4
30.8
28.6
N/A
8.8
8.3
N/A
1.3
2009
76
109
0.05
0.40
2.6
13.9
29.7
30.3
36.5
N/A
9.0
N/A
N/A
0.8
2008
81
106
0.12
0.36
3.2
14.5
30.7
30.6
38.3
N/A
9.7
N/A
N/A
0.8
2007
82
134
0.12
0.42
3.1
16.1
27.1
28.3
46.5
N/A
9.8
N/A
N/A
1.7
2006
89
138
0.14
0.46
3.8
19.3
31.3
29.1
49.6
N/A
10.0
N/A
0.2
1.7
2005
92
109
0.15
0.61
4.4
19.7
29.0
26.6
42.0
N/A
10.7
N/A
0.2
1.5
2004
74
98
0.16
0.62
3.3
19.5
26.8
24.3
32.9
N/A
N/A
N/A
N/A
1.4
2003
85
101
0.26
0.65
4.2
22.1
28.9
25.2
42.6
N/A
N/A
N/A
0.1
1.4
2002
83
111
0.33
0.73
3.9
23.4
27.2
23.4
41.8
N/A
N/A
N/A
N/A
1.6
2001
83
106
0.31
0.73
4.2
21.4
25.5
23.5
37.8
N/A
N/A
N/A
N/A
1.5
2000
86
117
0.28
0.82
4.7
30.2
27.8
26.1
45.6
N/A
N/A
N/A
N/A
1.7
Natural disasters
Type
Austin
Scottsdale
Tornado activity compared to U.S. average
137.9%
18%
Earthquake activity compared to U.S. average
80.4%
2,492.5%
Natural disasters compared to U.S. average
29%
16%
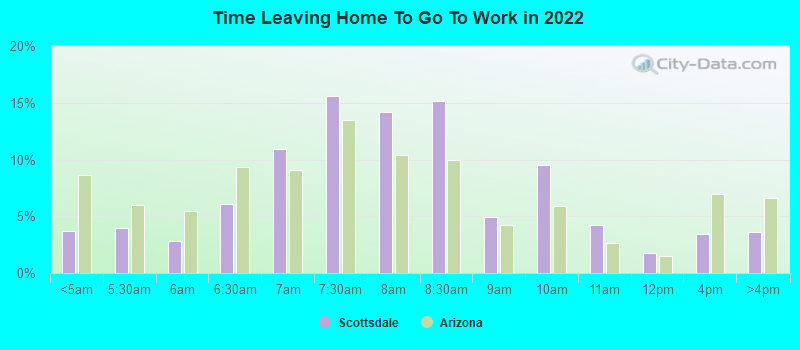
Transportation
Both Austin and Scottsdale have effective public transit systems. Austin's Capital Metro system includes buses, trains, and paratransit services, while Scottsdale's public transportation consists of buses and trolley services. Precisely, Austin has a higher reliance on public transit, while Scottsdale residents lean more on private vehicles.
Transport
Type
Austin
Scottsdale
Amtrak stations
1
0
Amtrak stations nearby
1
3
FAA registered aircraft
911
726
FAA registered aircraft manufacturers and dealers
21
44
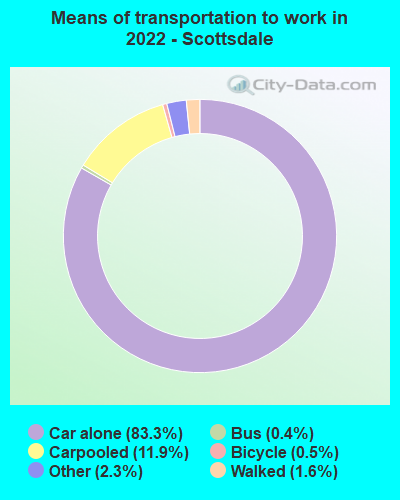
Means of transportation to work
Type
Austin
Scottsdale
Bicycle
0.8%
0.6%
Bus
1.5%
0.8%
Carpooled
7.9%
9.8%
Car alone
85.9%
85%
Motorcycle
0.3%
0.3%
Taxicab
0.1%
0.1%
Walked
2%
2.1%
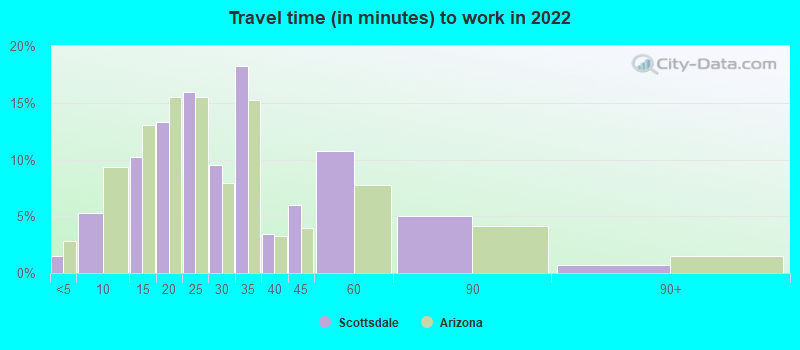
Average travel time to work
Type
Austin
Scottsdale
Average
29.9 min
27.8 min
Other means
22.7 min
24.9 min
Public transportation
37.9 min
39.7 min
Private vehicle occupancy
Type
Austin
Scottsdale
Average
1.1
1.1
Drove alone
91.2%
94%
In 2 person carpool
6.3%
4.9%
In 3 person carpool
1.7%
0.3%
In 4 person carpool
0.6%
0.3%
In 5-6 person carpool
0.1%
0.5%
In 7+ person carpool
0.2%
0.1%
How many people usually rode to work in the car, truck or van.
Real Estate
The real estate market in Austin and Scottsdale is thriving. However, the cost of housing in Scottsdale is higher than Austin, which offers a bit more affordability for home buyers. Both cities have a mix of contemporary and traditional-style homes appealing to a variety of tastes.
Neighborhoods
Austin has a neighborhood for practically every lifestyle, from dynamic downtown living to quieter suburban life. Similarly, Scottsdale offers a range of neighborhoods from luxurious, golf-centric communities to more modest and affordable areas.
Houses and residents
Type
Austin
Scottsdale
Houses
469,156
138,984
Average household size (people)
2.4
2.1
Median year apartment built
1997
1990
Median year house/condo built
1988
1990
Length of stay in the house since moving in
12.1 years
11.5 years
Houses occupied
449,399 (95.8%)
119,122 (85.7%)
Houses occupied by owners
196,458 (43.7%)
80,132 (67.3%)
Houses occupied by renters
252,941 (56.3%)
38,990 (32.7%)
Median rent asked for vacant for-rent units
$1,286
$2,198
Median monthly housing costs
$1,521
$1,623
Median price asked for vacant for-sale houses and condos
$549,769
$300,483
Estimated median house or condo value
$482,900
$674,900
Median numbers of rooms
4.4
5.6
Median number of rooms in apartments
3.4
4
Median number of rooms in houses and condos
6
6.5
Median house price - detached houses
$595,996
Over $1,000,000
Median house price - in 2-unit structures
$393,984
$590,277
Median house price - in 3-to-4-unit structures
$262,826
$378,674
Median house price - in 5 or more unit structures
$576,111
$394,962
Median house price - mobile homes
$56,102
$86,054
Median house price - Townhouses or other attached units
$459,657
$530,134
Median house price - All housing units
$571,154
$872,565
Median house age
28
31
Renting percentage
54.9%
31.9%
Housing density (houses/condos per square mile)
1,865.3
754.5
House value disparities
28.4%
27.3%
Household income disparities
44.8%
41.8%
Median household income for houses/condes with a mortgage
$141,177
$137,177
Median household income for apartments without a mortgage
$86,430
$87,918
Housing units without a mortgage
1,799 (1.3%)
658 (1.3%)
Housing units with both a second mortgage and home equity loan
6,421 (4.8%)
6,221 (12.5%)
Housing units with a mortgage
132,628 (98.7%)
49,289 (98.7%)
Housing units with a home equity loan
206 (0.2%)
188 (0.4%)
Housing units with a second mortgage
8,515 (6.3%)
7,674 (15.4%)
House/condo owner moved in on average (years ago)
9
8
House/condo renter moved in on average (years ago)
1
1
Housing units lacking complete kitchen facilities
0.9%
1.4%
Housing units lacking complete plumbing facilities
0.6%
0.4%
Housing units in structures
Housing units in structures
Austin
Scottsdale
One, detached
43.1%
53.1%
One, attached
5.2%
13.7%
Two
2.4%
0.6%
3 or 4
4.1%
3.9%
5 to 9
7.2%
5.1%
10 to 19
11.0%
5.6%
20 to 49
8.9%
3.7%
50 or more
17.2%
13.4%
Mobile homes
1.0%
1.0%
Median real estate property taxes paid for housing units
Self-employed workers in own not incorporated business
38,777
8,963
State government workers
46,229
4,079
Unpaid family workers
102
171
Industries and Occupations
Tech and music industries dominate in Austin, whereas tourism, retail, health services, and finance are Scottsdale's mainstays. The bulk of Austin's workforce is in office and administrative support, while Scottsdale's significant workforce is in management, business, science, and arts occupations.
Both cities have access to first-rate healthcare. Austin has top-rated hospital systems, including Seton Medical Center and St. David's Medical Center. Scottsdale is home to Mayo Clinic and HonorHealth Scottsdale Shea Medical Center, recognized top-quality healthcare institutes.
Health (county statistics)
Type
Austin
Scottsdale
General health status score of residents in this county from 1 (poor) to 5 (excellent)
HMDA - Conventional home purchase loans - Applications denied
Year
Austin
Scottsdale
1999
4,733
1,109
2000
2,950
730
2001
2,038
530
2002
1,772
532
2003
2,213
1,056
2004
2,458
1,561
2005
3,121
2,094
2006
3,367
2,107
2007
2,560
1,334
2008
1,747
696
2009
1,067
476
Culture and Food
Austin celebrates a vibrant mix of Hispanic and Southern cultures, famous for its live music scene and food trucks. Barbecue and Tex-Mex food rule the roost here. Scottsdale's culture leans towards the Old West with a love for outdoor festivals, and the culinary scene is prominent with Southwestern cuisine.
Sports Teams
Austin hosts one major league sports team, Austin FC in Major League Soccer and numerous collegiate sports teams from the University of Texas. Scottsdale does not host any major league teams but is home to the spring training facilities for the MLB’s San Francisco Giants and has proximity to Phoenix's sports teams.


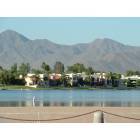
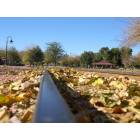
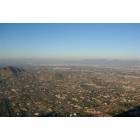
 Austin, TX
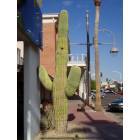
 Scottsdale, AZ