Boston, MA, and Staten Island, NY, are both northeastern American cities with rich cultural history and diverse offerings. Boston, known for its significance in American history, is a city of higher education, innovation, and sports enthusiasm. Staten Island, one of the five NYC boroughs, provides a suburban feel within the most populous city in America. Each city has its unique ambiance, quality of life, and cost of living. When considering factors such as crime and safety, weather, cost of living, and more, both cities have their pros and cons.
Both cities place significant emphasis on public safety. According to FBI data, Boston has a slightly higher crime rate compared to Staten Island. However, both cities remain safer than many parts of the United States, thanks to heavy investment in policing and community-building efforts. That said, like any major city, there are safer and less safe neighborhoods in both areas, and visitors should always stay vigilant and be informed about their surroundings.
Cost of Living
Although both cities are located in the northeastern US, Boston generally has a higher cost of living compared to Staten Island. This is particularly true in areas like housing, where median home prices in Boston significantly outpace those in Staten Island. However, it is worth noting that Staten Island is part of New York City, and expenses tend to be higher in many categories compared to cities of similar size nationwide.
Income Tax
Both Massachusetts and New York have progressive income tax systems, but rates vary. Massachusetts has a flat rate of 5.05% while New York’s rate ranges from 4% to 8.82% depending on income, with an additional 3.876% for New York City residents, including Staten Island.
Property Tax
Boston's residential property tax rate is significantly lower than that of Staten Island. However, due to the high real estate prices in Boston, homeowners may still end up paying a sizable amount in property taxes.
Sales Tax
Massachusetts has a state sales tax rate of 6.25%, while New York has a state sales tax of 4%. However, thanks to New York City's additional local sales tax, Staten Island residents end up paying a total sales tax of 8.875%.
Income
Type
Boston
Staten Island
Estimated median household income
$79,283
$86,054
Estimated per capita income
$50,337
$38,678
Cost of living index (U.S. average is 100)
143.8
164.1
If you make $50,000 in Boston, you will have to make $57,058 in Staten Island to maintain the same standard of living.
Geographical Conditions
Boston's geographical setting is in a gently rolling, hilly peninsula offering beautiful waterfront views, while Staten Island features a mix of beaches, parkland, and suburban areas. Staten Island is the least densely populated of the NYC boroughs, providing more open spaces and less of an urban feel than Boston.
Geographical information
Type
Boston
Staten Island
Land area
48.4 sq. miles
58.5 sq. miles
Population density
13,521 people per sq. mile
8,225.7 people per sq. mile
Relative area comparison
Boston, MA Staten Island, NY
Education
Both Boston and Staten Island offer high-quality education systems. Boston, particularly, is renowned globally for its universities, including Harvard University and Massachusetts Institute of Technology (MIT). Staten Island, while lacking the university presence of Boston, is part of the New York City Department of Education system, the largest public school system in the US.
Boston's economy is robust, heavily influenced by industries like education, health care, finance, and technology, while Staten Island’s economy is largely driven by sectors like health care, retail trade, and education. Due to the size and diversity of their respective economies, both areas provide ample job opportunities for relocation and significant options for career growth.
Biggest Employers
Boston's biggest employers are primarily in education and healthcare sectors with the likes of Massachusetts General Hospital and Boston University. Staten Island, being a part of New York City, also lists healthcare as a significant employer, with Staten Island University Hospital and Richmond University Medical Center being key contributors.
In Boston (Suffolk County), 77.4% voted for Democrats and 20.8% for Republicans in 2012 Presidential Election. In Staten Island (Richmond County), 50.8% voted for Democrats and 48.3% for Republicans.
Elections
Type
Democrats
Republicans
Other
Year
Boston
Staten Island
Boston
Staten Island
Boston
Staten Island
2020
80.6%
42.2%
17.5%
57.1%
1.9%
0.7%
2016
78.5%
41.0%
16.1%
56.1%
5.4%
2.9%
2012
77.4%
50.8%
20.8%
48.3%
1.8%
0.9%
2008
76.9%
47.8%
21.2%
51.9%
1.8%
0.4%
2004
75.9%
42.8%
22.8%
56.5%
1.3%
0.7%
2000
71.5%
52.1%
20.5%
45.1%
8.0%
2.9%
1996
73.0%
50.5%
19.9%
40.8%
7.0%
8.7%
Breakdown of population affiliated with a religious congregation
Type
Adherents
Congregations
Religion
Boston
Staten Island
Boston
Staten Island
CATHOLIC CHURCH
46.1%
54.2%
12.4%
20.6%
AMERICAN BAPTIST CHURCHES IN THE USA
1.2%
0.6%
8.9%
1.0%
MUSLIM ESTIMATE
1.1%
1.7%
2.4%
3.0%
EPISCOPAL CHURCH
1.0%
0.4%
4.7%
5.0%
SEVENTH DAY ADVENTIST CHURCH
0.7%
0.1%
4.0%
2.5%
SOUTHERN BAPTIST CONVENTION
0.6%
0.2%
6.9%
3.5%
EVANGELICAL LUTHERAN CHURCH IN AMERICA
0.0%
0.6%
0.7%
4.0%
Weather
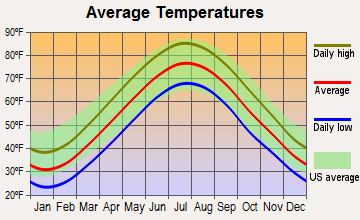
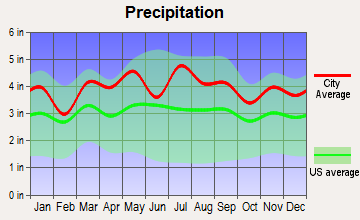
Boston and Staten Island share a similar climate—humid continental—with cold winters and warm, often humid summers. Boston tends to be windier due to its coastal location, and can experience slightly more severe winter conditions compared to Staten Island. Both cities, however, deal with Nor’easter storms, which can bring heavy rain, snow, and high winds.
Weather and climate
Type
Boston
Staten Island
Temperature - Average
50.6°F
54.1°F
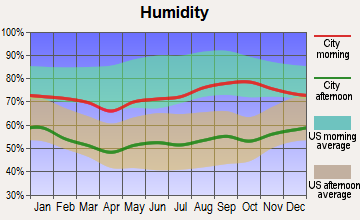
Humidity - Average morning or afternoon humidity
69.9%
67.4%
Humidity - Differences between morning and afternoon humidity
23.1%
29.9%
Humidity - Maximum monthly morning or afternoon humidity
78%
77%
Humidity - Minimum monthly morning or afternoon humidity
55%
47.2%
Precipitation - Yearly average
46.3 in
47.4 in
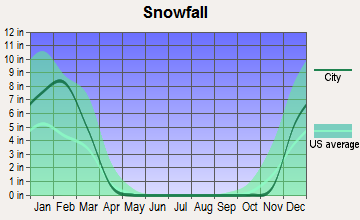
Snowfall - Yearly average
88.3 in
60 in
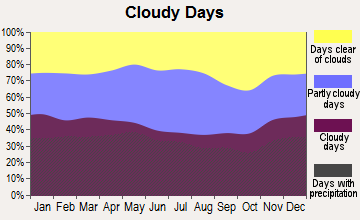
Clouds - Number of days clear of clouds
16.4%
15.8%
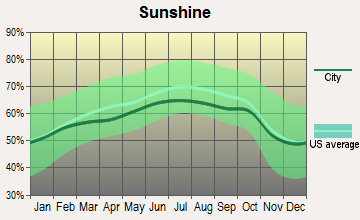
Sunshine amount - Average
63.7%
60.2%
Sunshine amount - Differences during a year
20%
20%
Sunshine amount - Maximum monthly
68%
64%
Sunshine amount - Minimum monthly
48%
44%
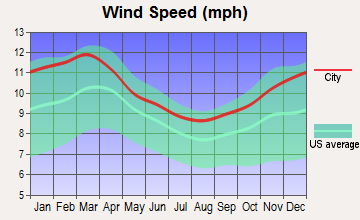
Wind speed - Average
12.5 mph
10.5 mph
Average climate in Boston, Massachusetts
Average climate in Staten Island, New York
Air pollution
Type
AQI
CO
NO2
OZONE
PB
PM10
PM25
SO2
Year
Boston
Staten Island
Boston
Staten Island
Boston
Staten Island
Boston
Staten Island
Staten Island
Staten Island
Boston
Staten Island
Boston
Staten Island
2018
76
94
0.24
0.35
12.3
17.1
26.1
24.1
N/A
N/A
N/A
N/A
9.2
7.9
0.5
0.4
2017
83
98
0.26
0.32
12.5
17.0
26.4
27.0
N/A
N/A
N/A
N/A
8.9
7.6
0.6
0.2
2016
75
94
0.27
0.37
14.1
17.9
24.4
28.5
N/A
N/A
N/A
N/A
7.4
7.7
0.5
0.2
2015
81
102
0.30
0.39
15.7
18.9
23.4
27.3
N/A
N/A
N/A
N/A
8.9
8.6
0.8
0.4
2014
76
97
0.30
0.38
14.0
19.2
24.5
25.6
N/A
N/A
N/A
N/A
9.3
8.3
1.2
0.7
2013
86
99
0.30
0.39
13.5
19.6
26.2
27.8
N/A
N/A
N/A
N/A
9.8
8.5
1.3
0.8
2012
89
102
0.29
0.42
11.8
19.3
23.5
26.9
N/A
N/A
N/A
N/A
9.5
9.2
1.4
1.4
2011
87
108
0.30
0.42
14.8
21.4
24.2
28.1
N/A
N/A
N/A
N/A
10.5
10.2
1.6
2.0
2010
92
114
0.26
0.40
13.8
19.9
25.0
28.7
N/A
N/A
N/A
N/A
10.0
9.4
2.3
1.8
2009
86
105
0.32
0.39
15.3
22.5
23.5
25.3
N/A
N/A
N/A
N/A
9.7
9.5
2.4
2.4
2008
96
111
0.26
0.39
16.6
23.0
22.9
24.3
0.013
N/A
N/A
N/A
12.4
11.3
3.8
3.4
2007
124
123
0.28
0.44
18.5
24.2
19.9
23.3
0.016
N/A
N/A
N/A
13.9
12.0
4.0
4.3
2006
103
117
0.38
0.55
15.8
25.6
20.9
24.7
0.018
N/A
N/A
N/A
12.5
13.1
3.5
5.3
2005
115
112
0.28
0.69
17.0
27.3
22.1
23.3
N/A
N/A
N/A
N/A
12.7
N/A
4.3
7.3
2004
104
109
0.26
0.68
15.6
26.4
22.5
22.2
0.030
N/A
N/A
N/A
13.7
N/A
4.6
6.9
2003
116
112
0.55
0.76
20.1
28.0
22.4
22.1
0.006
N/A
26.9
N/A
14.5
N/A
5.2
7.1
2002
130
125
0.35
0.74
19.8
30.6
21.8
24.7
0.008
N/A
26.1
N/A
13.5
N/A
5.0
6.6
2001
112
124
0.44
0.81
19.9
32.4
20.7
24.9
0.020
N/A
26.9
N/A
13.6
N/A
5.9
7.2
2000
88
116
0.57
0.93
18.8
33.0
19.2
23.1
0.022
N/A
22.2
N/A
10.0
N/A
5.6
7.2
Natural disasters
Type
Boston
Staten Island
Tornado activity compared to U.S. average
55.3%
61.3%
Earthquake activity compared to U.S. average
26.6%
31.2%
Natural disasters compared to U.S. average
33%
19%
Transportation
Boston has a well-developed public transit system, the "T," which includes subway, bus, and ferry lines. Staten Island relies primarily on buses and the Staten Island Ferry for public transit. Commuting times can be high in both cities, with Boston having the added challenge of often difficult winter conditions.
Transport
Type
Boston
Staten Island
Amtrak stations
3
0
Amtrak stations nearby
3
3
FAA registered aircraft
224
39
FAA registered aircraft manufacturers and dealers
4
2
Means of transportation to work
Type
Boston
Staten Island
Bicycle
1.7%
0.2%
Bus
7.1%
19.2%
Carpooled
6.8%
12.1%
Car alone
54.7%
54.3%
Ferryboat
0.2%
5.3%
Railroad
0.5%
0.9%
Streetcar
13.5%
0%
Subway
3.2%
2.6%
Taxicab
0.4%
0.4%
Walked
10%
2.9%
Average travel time to work
Type
Boston
Staten Island
Average
38.6 min
45.3 min
Real Estate
Boston’s real estate is highly priced, reflecting its desirability, economic strength, and limited space. In contrast, Staten Island offers more affordable options compared to its NYC counterparts. However, it is still part of the costly New York City market and is more expensive than the national median.
Neighborhoods
Both Boston and Staten Island offer diverse neighborhoods, each with their unique culture and charm. Boston is known for neighborhoods like Back Bay and Beacon Hill, both offering a mix of historic and modern living. Staten Island is renowned for its low-density, suburban-style neighborhoods, providing somewhat of an escape from the typical high-rise-dominated skyline of NYC.
Houses and residents
Type
Boston
Staten Island
Houses
307,025
163,993
Average household size (people)
2.3
2.8
Houses occupied
271,941 (88.6%)
156,341 (95.3%)
Houses occupied by owners
94,497 (34.7%)
99,732 (63.8%)
Houses occupied by renters
177,444 (65.3%)
56,609 (36.2%)
Median rent asked for vacant for-rent units
$2,632
$1,320
Median price asked for vacant for-sale houses and condos
$1,040,328
$369,853
Estimated median house or condo value
$659,700
$605,500
Median number of rooms in apartments
3.9
3.9
Median number of rooms in houses and condos
5.4
6.1
Renting percentage
66.1%
35.9%
Housing density (houses/condos per square mile)
6,340.1
2,804.3
Household income disparities
48.2%
43.8%
Housing units without a mortgage
1,250 (1.8%)
19,289 (25%)
Housing units with both a second mortgage and home equity loan
7,686 (11.2%)
160 (0.2%)
Housing units with a mortgage
67,144 (98.2%)
57,986 (75%)
Housing units with a home equity loan
218 (0.3%)
5,623 (7.3%)
Housing units with a second mortgage
9,540 (13.9%)
4,499 (5.8%)
Housing units lacking complete kitchen facilities
1.4%
0.6%
Housing units lacking complete plumbing facilities
Self-employed workers in own not incorporated business
11,605
7,611
State government workers
12,810
6,285
Unpaid family workers
303
394
Industries and Occupations
Boston is a hub for education, health care, and technology companies, while Staten Island features healthcare, retail, and education as its key sectors. Both cities offer a multitude of job opportunities across a variety of occupations, though Boston's concentration of universities and hospitals creates a distinctively heavy focus on these areas.
Boston is a national leader in healthcare, with world-class institutions like Massachusetts General Hospital. Staten Island also offers good healthcare provision and access, with two primary hospitals: Richmond University Medical Center and Staten Island University Hospital.
As historic cities, both Boston and Staten Island have made significant investments in infrastructure development. While Boston’s infrastructure includes everything from historic sites to cutting-edge technology centers, Staten Island is known for its bridges and ferry service connecting it to the rest of New York City.
Infrastructure
Type
Boston
Staten Island
Hospitals
22
25
TV stations
22
30
Bank branches located here
146
104
Bank institutions located here
37
19
Main business address for public companies
60
1
Drinking water stations with no reported violations in the past
2
1
Drinking water stations with reported violations in the past
5
3
Schools
School facilities
Type
Boston
Staten Island
Private elementary/middle schools
8
22
Private high schools
8
13
Public elementary/middle schools
9
63
Public high schools
11
16
Colleges/Universities
34
5
Culture and Food
Boston is renowned for its New England culture, thriving arts scene, and seafood-focused local cuisine, encapsulated by the famous clam chowder and lobster rolls. Staten Island, while smaller and less globally famous, has its own vibrant culture, closely tied to New York City. It is well known for its Italian influences, including an array of authentic pizzerias and Italian eateries.
Sports Teams
Boston is notoriously passionate about sports, home to famous teams such as the Red Sox (MLB), Celtics (NBA), Bruins (NHL), and Patriots (NFL). Staten Island doesn't have big-league teams but shares in the rich sports culture of New York City, rooting for teams like the Yankees (MLB), Giants (NFL), and Knicks (NBA).


 Boston, MA
 Staten Island, NY