03-30-2011, 09:12 AM
99 posts, read
277,705 times
Reputation: 76
Weather is an important concern for many prospective residents, so it's only natural that it comes up in these forums repeatedly. The purpose of this thread is to answer those inquiries with facts and informational resources (rather than opinion).
If you are going to post, please provide statistical summaries (weekly data, monthly data, yearly data), weather videos, timelapse videos, photos, and other links that serve to educate newcomers and give a
fact-based glimpse into the full spectrum of Portland weather (this includes both mild weather and severe weather). No single post is expected to represent "the average year" or "the average month," but rather, a snapshot in time.
This is meant to be a neutral thread that is based in documented fact. Please refrain from posting subjective opinions. There are numerous old threads that provide subjective descriptions of what people have personally experienced in terms of the weather. Please refer to those threads for that type of discussion.
Take some time to peruse the
National Weather Service (NWS) links – the documented averages provided in those links are useful for comparison purposes. They will help to provide a more balanced view in regard to what the weather norms are over a long period of time. In contrast, many of the posts in this thread will include short-term data that varies widely from the norm. This is to be expected because the weather fluctuates outside of the norm much of the time, and we are simply documenting the weather as it occurs.
Dr. Greg Forbes, a severe weather expert at The Weather Channel, offers a discussion about averages and about how the only "normal" for the weather is that it varies from day to day (see his blog and other links below). That said, please keep in mind that some of the severe weather days shown in this thread may be anomalies in the sense that they show record-breaking weather. Consult the NWS data before drawing any conclusions from a single post.
Average vs. "Normal" Weather: Weatherman Glenn Schwartz Breaks it Down (Video)
Average vs. "Normal" Weather: Dr. Greg Forbes' Weather Channel Blog
Misconceptions About What Is "Normal" for the Atmosphere: Chuck Doswell, Research Scientist
FOR OPINION-BASED POSTS PLEASE REFER TO THE THREADS BELOW (or start a new thread):
SEARCH TOOL
Search the Portland Forum for More Weather Threads
Search the Weather Forum for More Weather Threads
SPECIFIC QUESTIONS
Humidity
Cold Snaps
Severe Weather
MONTH BY MONTH DESCRIPTION
Month-by-Month Weather Description
What Does a Year Look Like?
October Weather
November Weather
PORTLAND RAIN
How Often Does it Rain in Portland?
Does it Really Rain All the Time in Portland?
Does it Really Rain Ten Months Out of the Year?
No, It Doesn't Rain for Nine Months Straight
Left Portland Because of the Rain
Love the City, Hate the Rain
Five Days of Rain in Portland
Do Your Kids Play in the Rain?
Can You Hear the Rain Hitting Your Roof?
I Love the Rain – It's a Pacific Northwest Thing
DOWNSIDES OF PORTLAND WEATHER
"Gloomy Season" Pictures
Seasonal Affective Disorder (SAD) – Moving to Salem
Seasonal Affective Disorder (SAD) – Moving to Oregon from Arizona
Brutal Assessment of How Most People Are Affected by the Rainy Season
The Clouds Are So Constant, Dark, and Heavy – I Find Them Depressing
One Resident's Description of "Portland Gloom"
Just How Gloomy is Gloomy?
BENEFITS OF PORTLAND WEATHER
"Gloomy Season" Pictures
Portland Has the Best Weather
Ten-Day Forecast with Sunshine
If the "Gloom" is so bad, then why do so many people live there?
Is There Anyone Out There Who Enjoys Rain and Clouds?
HELPFUL HINTS FOR PORTLAND WEATHER
Staying Active in Portland Weather
Tips on Adjusting to Portland Weather
How to Keep Your Spirits Up in Portland Weather
When to Visit to Experience the "Worst" Weather
GENERAL WEATHER FORUM
Current Threads
Overcast Weather
I Hate Sunny Days
Poll: Which is Worse, Zero and Sunny or 45 and Rain?
Poll: Do You Prefer Sunny & Mild or Overcast & Mild?
Poll: Do You Prefer Rain or Snow?
Poll: Which City Has Better Weather – Seattle or Chicago?
CITY VS. CITY
Portland vs. Ireland
Portland vs. Seattle (Is the Weather the Same?)
Portland vs. Seattle (More Rain and Fog in Portland?)
Portland vs. Seattle (More Rain in Seattle?)
Portland vs. New York
Portland vs. New York (short)
Portland vs. Michigan
Portland vs. Wisconsin
Portland vs. Wisconsin (short)
Portland vs. Chicago
Portland vs. Chicago vs. Phoenix
Portland vs. Colorado vs. California
Portland vs. Tucson
Portland vs. Texas
Last edited by sunscribble; 03-30-2011 at 10:27 AM ..
03-30-2011, 09:13 AM
99 posts, read
277,705 times
Reputation: 76
Portland Rain
Portland does not make the Top 100 list in terms of average annual precipitation (
City-Data ). The average annual precipitation for downtown Portland was 42 inches per year for years 1871-2008 (
National Weather Service – Annual Precipitation ). That was 10 inches below #101 on the city-data list (Waterbury, CT at 52 inches).
However, Portland does have streaks that consist of many consecutive days with measurable rain (mostly light rain). An extreme example of such a streak would be Febrary 28 to May 8 of 2003, when 66 of 70 days showed measurable rain (
Johnson ). According to Weather Underground, half of those days had <0.10 inches of rain, and the other half had 0.10 to 0.94 inches of measurable rain each day. A total of 10 inches of rain fell during these two months (March and April 2003). The top ten wettest days that occurred during this time are listed below (
Weather Underground – March 7, 2003 ):
March 07 - 0.94 inches
March 08 - 0.40 inches
March 09 - 0.43 inches
March 12 - 0.45 inches
March 21 - 0.45 inches
March 22 - 0.45 inches
--------------------------
March Total = 5.75 inches (vs. the normal 4.51 inches for March)*
April 12 - 0.42 inches
April 13 - 0.57 inches
April 17 - 0.36 inches
April 23 - 0.60 inches
--------------------------
April Total = 4.24 inches (vs. the normal 2.91 inches for April)*
*Portland Normals for March and April:
National Weather Service - Precipitation Normals
03-30-2011, 09:14 AM
99 posts, read
277,705 times
Reputation: 76
03-30-2011, 09:15 AM
99 posts, read
277,705 times
Reputation: 76
Overcast Skies
Portland is ranked #6 for cloudy weather in the contiguous United States (
Weather Today ). January, March, November, and December are the cloudiest months. The average number of cloudy days, partly cloudy days, and clear days for January has been 24, 4, and 2, respectively:
Cloudy, Partly Cloudy, & Clear Days
227 cloudy days per year--------(where clouds cover 80% to 100% of the sky)
71 partly cloudy days per year---(where clouds cover 40% to 70% of the sky)
67 clear days per year-----------(where clouds cover 0% to 30% of the sky)
The National Weather Service also provides information on the percentage of overcast hours in each month. For example, in January, 90-100% of the sky was covered with clouds 68% of the time, and 60-100% of the sky was covered with clouds 81% of the time:
Sky Cover Frequency (January through June)
Sky Cover Frequency (July through December)
03-30-2011, 09:16 AM
99 posts, read
277,705 times
Reputation: 76
A Cloudy Day in November...
AVERAGE NUMBER OF CLOUDY DAYS IN NOVEMBER
(Source:
National Weather Service – Cloudy Days )
Cloudy Days (clouds cover 80-100% of sky)
24 cloudy days in January
22 cloudy days in February
23 cloudy days in March
21 cloudy days in April
19 cloudy days in May
16 cloudy days in June
11 cloudy days in July
10 cloudy days in August
11 cloudy days in September
17 cloudy days in October
24 cloudy days in November
23 cloudy days in December
-------------------------------
227 total cloudy days per year
Partly Cloudy Days (clouds cover 40-70% of sky)
4 partly cloudy days in January
4 partly cloudy days in February
5 partly cloudy days in March
6 partly cloudy days in April
7 partly cloudy days in May
8 partly cloudy days in June
8 partly cloudy days in July
9 partly cloudy days in August
8 partly cloudy days in September
8 partly cloudy days in October
4 partly cloudy days in November
5 partly cloudy days in December
------------------------------------
71 total partly cloudy days per year
Clear Days (clouds cover 0-30% of sky)
3 clear days in January
2 clear days in February
3 clear days in March
3 clear days in April
5 clear days in May
6 clear days in June
12 clear days in July
12 clear days in August
11 clear days in September
6 clear days in October
2 clear days in November
3 clear days in December
--------------------------------
67 total clear days per year
Here is a quick video that shows one of the
24 cloudy days that might occur in November:
Video #1 – A Cloudy Day in November
03-30-2011, 09:17 AM
99 posts, read
277,705 times
Reputation: 76
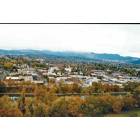
A Clear Day in November...
AVERAGE NUMBER OF CLEAR DAYS IN NOVEMBER
(Source:
National Weather Service – Clear Days )
Cloudy Days (clouds cover 80-100% of sky)
24 cloudy days in January
22 cloudy days in February
23 cloudy days in March
21 cloudy days in April
19 cloudy days in May
16 cloudy days in June
11 cloudy days in July
10 cloudy days in August
11 cloudy days in September
17 cloudy days in October
24 cloudy days in November
23 cloudy days in December
-------------------------------
227 total cloudy days per year
Partly Cloudy Days (clouds cover 40-70% of sky)
4 partly cloudy days in January
4 partly cloudy days in February
5 partly cloudy days in March
6 partly cloudy days in April
7 partly cloudy days in May
8 partly cloudy days in June
8 partly cloudy days in July
9 partly cloudy days in August
8 partly cloudy days in September
8 partly cloudy days in October
4 partly cloudy days in November
5 partly cloudy days in December
------------------------------------
71 total partly cloudy days per year
Clear Days (clouds cover 0-30% of sky)
3 clear days in January
2 clear days in February
3 clear days in March
3 clear days in April
5 clear days in May
6 clear days in June
12 clear days in July
12 clear days in August
11 clear days in September
6 clear days in October
2 clear days in November
3 clear days in December
--------------------------------
67 total clear days per year
Here is a quick video that shows one of the
2 clear days that might occur in November:
Video #2 – A Clear Day in November
03-30-2011, 09:18 AM
99 posts, read
277,705 times
Reputation: 76
A Partly Cloudy Day in October...
AVERAGE NUMBER OF PARTLY CLOUDY DAYS IN OCTOBER
(Source:
National Weather Service – Partly Cloudy Days )
Cloudy Days (clouds cover 80-100% of sky)
24 cloudy days in January
22 cloudy days in February
23 cloudy days in March
21 cloudy days in April
19 cloudy days in May
16 cloudy days in June
11 cloudy days in July
10 cloudy days in August
11 cloudy days in September
17 cloudy days in October
24 cloudy days in November
23 cloudy days in December
-------------------------------
227 total cloudy days per year
Partly Cloudy Days (clouds cover 40-70% of sky)
4 partly cloudy days in January
4 partly cloudy days in February
5 partly cloudy days in March
6 partly cloudy days in April
7 partly cloudy days in May
8 partly cloudy days in June
8 partly cloudy days in July
9 partly cloudy days in August
8 partly cloudy days in September
8 partly cloudy days in October
4 partly cloudy days in November
5 partly cloudy days in December
------------------------------------
71 total partly cloudy days per year
Clear Days (clouds cover 0-30% of sky)
3 clear days in January
2 clear days in February
3 clear days in March
3 clear days in April
5 clear days in May
6 clear days in June
12 clear days in July
12 clear days in August
11 clear days in September
6 clear days in October
2 clear days in November
3 clear days in December
--------------------------------
67 total clear days per year
Someone asked me how the day is rated if it's cloudy in the morning and then partly cloudy in the evening (a good question). My guess is that they take an hourly scan of the sky. This would give a cloud percentage for each hour of the day. Then you could add all of the readings together to calculate the average cloud percentage for the day. For example, if your morning percentage was 100% clouds, and your noon percentage was 70% clouds, with an evening percentage of 40% clouds, the average percentage would come out to be 70%. In this case, the day would be labeled as "partly cloudy" (with clouds covering 40-70% of the sky). (Of course, in reality they would do more than just three readings per day).
Here is a timelapse video that shows one of the
8 partly cloudy days that might occur in October:
Video #3 – A Partly Cloudy Day in October
03-30-2011, 09:19 AM
99 posts, read
277,705 times
Reputation: 76
Foggy Commute
I hope the last three videos helped folks understand what the cloudy day statistics really mean.
Now moving on to fog...
The number of days with dense fog in Portland is shown below:
DAYS WITH DENSE FOG
4.3 days in January
3.7 days in February
2.4 days in March
1.1 days in April
0.2 days in May
0.1 days in June
0.1 days in July
0.2 days in August
2.7 days in September
7.2 days in October
6.1 days in November
4.9 days in December
--------------------------------
32.9 days with dense fog per year
Here is a timelapse video that shows a foggy motorcycle commute in
Corvallis :
Video #4 – Foggy Motorcycle Commute
03-30-2011, 09:20 AM
99 posts, read
277,705 times
Reputation: 76
Grey Blanket Overcast
Portland has many different types of clouds. For example, the bulbous, rainstorm type of clouds that were shown in Video #3 are quite often seen on partly cloudy days. In contrast, the widespread, grey blanket type of clouds that are typical of heavily overcast days in Portland are shown in Video #5 below. This type of overcast is more monotonous than the rainstorm clouds of the Rocky Mountains or the Great Plains. It is characterized by a flat shape, relatively monotone color, and persistent, blanket-like formation. If you look at the video, you can see how effective this type of overcast can be in regard to filtering out sunlight. It's not uncommon to see the entire Portland sky covered with a blanket of clouds like this, but you are more likely to see this type of overcast in winter, late fall, and early spring than in summer.
Video #5 – Grey Blanket Overcast
03-30-2011, 09:25 AM
99 posts, read
277,705 times
Reputation: 76
Steel Bridge Timelapse Videos
I stumbled upon a YouTube channel that offers
19 months of 24-hour timelapse videos of the
Steel Bridge . These videos are all shot from the same location, looking east from downtown Portland towards the Steel Bridge. They mostly show the bridge and a nearby parking lot, but they also show the edge of the sky at the horizon, so it's possible to see a portion of the sky.
The only time the videos really vary is when the weather changes (for example, you can tell when the sun is shining, when the sky is overcast, and when it is raining). The videos are also helpful for showing the dimness of overcast days as compared with the brightness of sunny days. Please note that the videos are time-lapsed, meaning that clouds, rain, and sun all appear to pass through much more quickly than they do in real life.
I would recommend going to
Weather Underground – History for Portland to view the highs, lows, precipitation, and cloud log for the day that you are viewing. Simply select the month, day, and year that you wish to view, and then click the "View" button (located below the blue bar). Scroll to the bottom of the page for hourly observations. You can also click on the "Monthly" tab and scroll down to see a monthly calendar that shows the highs, lows, and precipitation for each day of the month.
Overall, the year of 2010 saw 4.23 inches more of rain than the average (Total = 46.33 inches , Average = 42.10 inches). Compared with the average, February saw quite a bit less rain, but May, June, September, and December made up for that with significantly more rain than the average. The precipitation details for 2010 are shown below:
Normal vs. Actual inches 2010
-------------------------------
5.07 vs. 4.94 inches for January 4.18 vs. 2.80 inches for February 3.71 vs. 3.58 inches for March 2.64 vs. 2.92 inches for April 2.38 vs. 4.75 inches for May 1.59 vs. 4.28 inches for June 0.72 vs. 0.60 inches for July 0.93 vs. 0.25 inches for August 1.65 vs. 3.36 inches for September 2.88 vs. 3.87 inches for October 5.61 vs. 6.63 inches for November
5.71 vs. 8.35 inches for December 42.10 vs. 46.33 inches for 2010
24-HOUR TIMELAPSE – 2010
List of Daily Videos for January
List of Daily Videos for February
List of Daily Videos for March
List of Daily Videos for April
List of Daily Videos for May
List of Daily Videos for June
List of Daily Videos for July
List of Daily Videos for August
List of Daily Videos for September
List of Daily Videos for October
FULL MONTH TIMELAPSE – 2010
Full Month of April
Full Month of May
Full Month of June
Full Month of July
Full Month of August
Full Month of September
Full Month of October
Full Month of November
24-HOUR TIMELAPSE – NOVEMBER
November 1, 2010
November 2, 2010
November 3, 2010
November 4, 2010
November 5, 2010
November 6, 2010
November 7, 2010
November 8, 2010
November 9, 2010
November 10, 2010
November 11, 2010
November 12, 2010
November 13, 2010
November 14, 2010
November 15, 2010
November 16, 2010
November 17, 2010
November 18, 2010
November 19, 2010
November 20, 2010
November 21, 2010
November 22, 2010
November 23, 2010
November 24, 2010
November 29, 2010
November 30, 2010
24-HOUR TIMELAPSE – 2009
List of Daily Videos for April
List of Daily Videos for May
List of Daily Videos for June
List of Daily Videos for July
The YouTube Video for August 28
The YouTube Video for August 30
The YouTube Video for August 31
List of Daily Videos for September
List of Daily Videos for October
List of Daily Videos for November
List of Daily Videos for December
Please register City-data.com
Data:
Median household income ($)
Median household income (% change since 2000)
Household income diversity
Ratio of average income to average house value (%)
Ratio of average income to average rent
Median household income ($) - White
Median household income ($) - Black or African American
Median household income ($) - Asian
Median household income ($) - Hispanic or Latino
Median household income ($) - American Indian and Alaska Native
Median household income ($) - Multirace
Median household income ($) - Other Race
Median household income for houses/condos with a mortgage ($)
Median household income for apartments without a mortgage ($)
Races - White alone (%)
Races - White alone (% change since 2000)
Races - Black alone (%)
Races - Black alone (% change since 2000)
Races - American Indian alone (%)
Races - American Indian alone (% change since 2000)
Races - Asian alone (%)
Races - Asian alone (% change since 2000)
Races - Hispanic (%)
Races - Hispanic (% change since 2000)
Races - Native Hawaiian and Other Pacific Islander alone (%)
Races - Native Hawaiian and Other Pacific Islander alone (% change since 2000)
Races - Two or more races (%)
Races - Two or more races (% change since 2000)
Races - Other race alone (%)
Races - Other race alone (% change since 2000)
Racial diversity
Unemployment (%)
Unemployment (% change since 2000)
Unemployment (%) - White
Unemployment (%) - Black or African American
Unemployment (%) - Asian
Unemployment (%) - Hispanic or Latino
Unemployment (%) - American Indian and Alaska Native
Unemployment (%) - Multirace
Unemployment (%) - Other Race
Population density (people per square mile)
Population - Males (%)
Population - Females (%)
Population - Males (%) - White
Population - Males (%) - Black or African American
Population - Males (%) - Asian
Population - Males (%) - Hispanic or Latino
Population - Males (%) - American Indian and Alaska Native
Population - Males (%) - Multirace
Population - Males (%) - Other Race
Population - Females (%) - White
Population - Females (%) - Black or African American
Population - Females (%) - Asian
Population - Females (%) - Hispanic or Latino
Population - Females (%) - American Indian and Alaska Native
Population - Females (%) - Multirace
Population - Females (%) - Other Race
Coronavirus confirmed cases (Apr 21, 2024)
Deaths caused by coronavirus (Apr 21, 2024)
Coronavirus confirmed cases (per 100k population) (Apr 21, 2024)
Deaths caused by coronavirus (per 100k population) (Apr 21, 2024)
Daily increase in number of cases (Apr 21, 2024)
Weekly increase in number of cases (Apr 21, 2024)
Cases doubled (in days) (Apr 21, 2024)
Hospitalized patients (Apr 18, 2022)
Negative test results (Apr 18, 2022)
Total test results (Apr 18, 2022)
COVID Vaccine doses distributed (per 100k population) (Sep 19, 2023)
COVID Vaccine doses administered (per 100k population) (Sep 19, 2023)
COVID Vaccine doses distributed (Sep 19, 2023)
COVID Vaccine doses administered (Sep 19, 2023)
Likely homosexual households (%)
Likely homosexual households (% change since 2000)
Likely homosexual households - Lesbian couples (%)
Likely homosexual households - Lesbian couples (% change since 2000)
Likely homosexual households - Gay men (%)
Likely homosexual households - Gay men (% change since 2000)
Cost of living index
Median gross rent ($)
Median contract rent ($)
Median monthly housing costs ($)
Median house or condo value ($)
Median house or condo value ($ change since 2000)
Mean house or condo value by units in structure - 1, detached ($)
Mean house or condo value by units in structure - 1, attached ($)
Mean house or condo value by units in structure - 2 ($)
Mean house or condo value by units in structure by units in structure - 3 or 4 ($)
Mean house or condo value by units in structure - 5 or more ($)
Mean house or condo value by units in structure - Boat, RV, van, etc. ($)
Mean house or condo value by units in structure - Mobile home ($)
Median house or condo value ($) - White
Median house or condo value ($) - Black or African American
Median house or condo value ($) - Asian
Median house or condo value ($) - Hispanic or Latino
Median house or condo value ($) - American Indian and Alaska Native
Median house or condo value ($) - Multirace
Median house or condo value ($) - Other Race
Median resident age
Resident age diversity
Median resident age - Males
Median resident age - Females
Median resident age - White
Median resident age - Black or African American
Median resident age - Asian
Median resident age - Hispanic or Latino
Median resident age - American Indian and Alaska Native
Median resident age - Multirace
Median resident age - Other Race
Median resident age - Males - White
Median resident age - Males - Black or African American
Median resident age - Males - Asian
Median resident age - Males - Hispanic or Latino
Median resident age - Males - American Indian and Alaska Native
Median resident age - Males - Multirace
Median resident age - Males - Other Race
Median resident age - Females - White
Median resident age - Females - Black or African American
Median resident age - Females - Asian
Median resident age - Females - Hispanic or Latino
Median resident age - Females - American Indian and Alaska Native
Median resident age - Females - Multirace
Median resident age - Females - Other Race
Commute - mean travel time to work (minutes)
Travel time to work - Less than 5 minutes (%)
Travel time to work - Less than 5 minutes (% change since 2000)
Travel time to work - 5 to 9 minutes (%)
Travel time to work - 5 to 9 minutes (% change since 2000)
Travel time to work - 10 to 19 minutes (%)
Travel time to work - 10 to 19 minutes (% change since 2000)
Travel time to work - 20 to 29 minutes (%)
Travel time to work - 20 to 29 minutes (% change since 2000)
Travel time to work - 30 to 39 minutes (%)
Travel time to work - 30 to 39 minutes (% change since 2000)
Travel time to work - 40 to 59 minutes (%)
Travel time to work - 40 to 59 minutes (% change since 2000)
Travel time to work - 60 to 89 minutes (%)
Travel time to work - 60 to 89 minutes (% change since 2000)
Travel time to work - 90 or more minutes (%)
Travel time to work - 90 or more minutes (% change since 2000)
Marital status - Never married (%)
Marital status - Now married (%)
Marital status - Separated (%)
Marital status - Widowed (%)
Marital status - Divorced (%)
Median family income ($)
Median family income (% change since 2000)
Median non-family income ($)
Median non-family income (% change since 2000)
Median per capita income ($)
Median per capita income (% change since 2000)
Median family income ($) - White
Median family income ($) - Black or African American
Median family income ($) - Asian
Median family income ($) - Hispanic or Latino
Median family income ($) - American Indian and Alaska Native
Median family income ($) - Multirace
Median family income ($) - Other Race
Median year house/condo built
Median year apartment built
Year house built - Built 2005 or later (%)
Year house built - Built 2000 to 2004 (%)
Year house built - Built 1990 to 1999 (%)
Year house built - Built 1980 to 1989 (%)
Year house built - Built 1970 to 1979 (%)
Year house built - Built 1960 to 1969 (%)
Year house built - Built 1950 to 1959 (%)
Year house built - Built 1940 to 1949 (%)
Year house built - Built 1939 or earlier (%)
Average household size
Household density (households per square mile)
Average household size - White
Average household size - Black or African American
Average household size - Asian
Average household size - Hispanic or Latino
Average household size - American Indian and Alaska Native
Average household size - Multirace
Average household size - Other Race
Occupied housing units (%)
Vacant housing units (%)
Owner occupied housing units (%)
Renter occupied housing units (%)
Vacancy status - For rent (%)
Vacancy status - For sale only (%)
Vacancy status - Rented or sold, not occupied (%)
Vacancy status - For seasonal, recreational, or occasional use (%)
Vacancy status - For migrant workers (%)
Vacancy status - Other vacant (%)
Residents with income below the poverty level (%)
Residents with income below 50% of the poverty level (%)
Children below poverty level (%)
Poor families by family type - Married-couple family (%)
Poor families by family type - Male, no wife present (%)
Poor families by family type - Female, no husband present (%)
Poverty status for native-born residents (%)
Poverty status for foreign-born residents (%)
Poverty among high school graduates not in families (%)
Poverty among people who did not graduate high school not in families (%)
Residents with income below the poverty level (%) - White
Residents with income below the poverty level (%) - Black or African American
Residents with income below the poverty level (%) - Asian
Residents with income below the poverty level (%) - Hispanic or Latino
Residents with income below the poverty level (%) - American Indian and Alaska Native
Residents with income below the poverty level (%) - Multirace
Residents with income below the poverty level (%) - Other Race
Air pollution - Air Quality Index (AQI)
Air pollution - CO
Air pollution - NO2
Air pollution - SO2
Air pollution - Ozone
Air pollution - PM10
Air pollution - PM25
Air pollution - Pb
Crime - Murders per 100,000 population
Crime - Rapes per 100,000 population
Crime - Robberies per 100,000 population
Crime - Assaults per 100,000 population
Crime - Burglaries per 100,000 population
Crime - Thefts per 100,000 population
Crime - Auto thefts per 100,000 population
Crime - Arson per 100,000 population
Crime - City-data.com crime index
Crime - Violent crime index
Crime - Property crime index
Crime - Murders per 100,000 population (5 year average)
Crime - Rapes per 100,000 population (5 year average)
Crime - Robberies per 100,000 population (5 year average)
Crime - Assaults per 100,000 population (5 year average)
Crime - Burglaries per 100,000 population (5 year average)
Crime - Thefts per 100,000 population (5 year average)
Crime - Auto thefts per 100,000 population (5 year average)
Crime - Arson per 100,000 population (5 year average)
Crime - City-data.com crime index (5 year average)
Crime - Violent crime index (5 year average)
Crime - Property crime index (5 year average)
1996 Presidential Elections Results (%) - Democratic Party (Clinton)
1996 Presidential Elections Results (%) - Republican Party (Dole)
1996 Presidential Elections Results (%) - Other
2000 Presidential Elections Results (%) - Democratic Party (Gore)
2000 Presidential Elections Results (%) - Republican Party (Bush)
2000 Presidential Elections Results (%) - Other
2004 Presidential Elections Results (%) - Democratic Party (Kerry)
2004 Presidential Elections Results (%) - Republican Party (Bush)
2004 Presidential Elections Results (%) - Other
2008 Presidential Elections Results (%) - Democratic Party (Obama)
2008 Presidential Elections Results (%) - Republican Party (McCain)
2008 Presidential Elections Results (%) - Other
2012 Presidential Elections Results (%) - Democratic Party (Obama)
2012 Presidential Elections Results (%) - Republican Party (Romney)
2012 Presidential Elections Results (%) - Other
2016 Presidential Elections Results (%) - Democratic Party (Clinton)
2016 Presidential Elections Results (%) - Republican Party (Trump)
2016 Presidential Elections Results (%) - Other
2020 Presidential Elections Results (%) - Democratic Party (Biden)
2020 Presidential Elections Results (%) - Republican Party (Trump)
2020 Presidential Elections Results (%) - Other
Ancestries Reported - Arab (%)
Ancestries Reported - Czech (%)
Ancestries Reported - Danish (%)
Ancestries Reported - Dutch (%)
Ancestries Reported - English (%)
Ancestries Reported - French (%)
Ancestries Reported - French Canadian (%)
Ancestries Reported - German (%)
Ancestries Reported - Greek (%)
Ancestries Reported - Hungarian (%)
Ancestries Reported - Irish (%)
Ancestries Reported - Italian (%)
Ancestries Reported - Lithuanian (%)
Ancestries Reported - Norwegian (%)
Ancestries Reported - Polish (%)
Ancestries Reported - Portuguese (%)
Ancestries Reported - Russian (%)
Ancestries Reported - Scotch-Irish (%)
Ancestries Reported - Scottish (%)
Ancestries Reported - Slovak (%)
Ancestries Reported - Subsaharan African (%)
Ancestries Reported - Swedish (%)
Ancestries Reported - Swiss (%)
Ancestries Reported - Ukrainian (%)
Ancestries Reported - United States (%)
Ancestries Reported - Welsh (%)
Ancestries Reported - West Indian (%)
Ancestries Reported - Other (%)
Educational Attainment - No schooling completed (%)
Educational Attainment - Less than high school (%)
Educational Attainment - High school or equivalent (%)
Educational Attainment - Less than 1 year of college (%)
Educational Attainment - 1 or more years of college (%)
Educational Attainment - Associate degree (%)
Educational Attainment - Bachelor's degree (%)
Educational Attainment - Master's degree (%)
Educational Attainment - Professional school degree (%)
Educational Attainment - Doctorate degree (%)
School Enrollment - Nursery, preschool (%)
School Enrollment - Kindergarten (%)
School Enrollment - Grade 1 to 4 (%)
School Enrollment - Grade 5 to 8 (%)
School Enrollment - Grade 9 to 12 (%)
School Enrollment - College undergrad (%)
School Enrollment - Graduate or professional (%)
School Enrollment - Not enrolled in school (%)
School enrollment - Public schools (%)
School enrollment - Private schools (%)
School enrollment - Not enrolled (%)
Median number of rooms in houses and condos
Median number of rooms in apartments
Housing units lacking complete plumbing facilities (%)
Housing units lacking complete kitchen facilities (%)
Density of houses
Urban houses (%)
Rural houses (%)
Households with people 60 years and over (%)
Households with people 65 years and over (%)
Households with people 75 years and over (%)
Households with one or more nonrelatives (%)
Households with no nonrelatives (%)
Population in households (%)
Family households (%)
Nonfamily households (%)
Population in families (%)
Family households with own children (%)
Median number of bedrooms in owner occupied houses
Mean number of bedrooms in owner occupied houses
Median number of bedrooms in renter occupied houses
Mean number of bedrooms in renter occupied houses
Median number of vehichles in owner occupied houses
Mean number of vehichles in owner occupied houses
Median number of vehichles in renter occupied houses
Mean number of vehichles in renter occupied houses
Mortgage status - with mortgage (%)
Mortgage status - with second mortgage (%)
Mortgage status - with home equity loan (%)
Mortgage status - with both second mortgage and home equity loan (%)
Mortgage status - without a mortgage (%)
Average family size
Average family size - White
Average family size - Black or African American
Average family size - Asian
Average family size - Hispanic or Latino
Average family size - American Indian and Alaska Native
Average family size - Multirace
Average family size - Other Race
Geographical mobility - Same house 1 year ago (%)
Geographical mobility - Moved within same county (%)
Geographical mobility - Moved from different county within same state (%)
Geographical mobility - Moved from different state (%)
Geographical mobility - Moved from abroad (%)
Place of birth - Born in state of residence (%)
Place of birth - Born in other state (%)
Place of birth - Native, outside of US (%)
Place of birth - Foreign born (%)
Housing units in structures - 1, detached (%)
Housing units in structures - 1, attached (%)
Housing units in structures - 2 (%)
Housing units in structures - 3 or 4 (%)
Housing units in structures - 5 to 9 (%)
Housing units in structures - 10 to 19 (%)
Housing units in structures - 20 to 49 (%)
Housing units in structures - 50 or more (%)
Housing units in structures - Mobile home (%)
Housing units in structures - Boat, RV, van, etc. (%)
House/condo owner moved in on average (years ago)
Renter moved in on average (years ago)
Year householder moved into unit - Moved in 1999 to March 2000 (%)
Year householder moved into unit - Moved in 1995 to 1998 (%)
Year householder moved into unit - Moved in 1990 to 1994 (%)
Year householder moved into unit - Moved in 1980 to 1989 (%)
Year householder moved into unit - Moved in 1970 to 1979 (%)
Year householder moved into unit - Moved in 1969 or earlier (%)
Means of transportation to work - Drove car alone (%)
Means of transportation to work - Carpooled (%)
Means of transportation to work - Public transportation (%)
Means of transportation to work - Bus or trolley bus (%)
Means of transportation to work - Streetcar or trolley car (%)
Means of transportation to work - Subway or elevated (%)
Means of transportation to work - Railroad (%)
Means of transportation to work - Ferryboat (%)
Means of transportation to work - Taxicab (%)
Means of transportation to work - Motorcycle (%)
Means of transportation to work - Bicycle (%)
Means of transportation to work - Walked (%)
Means of transportation to work - Other means (%)
Working at home (%)
Industry diversity
Most Common Industries - Agriculture, forestry, fishing and hunting, and mining (%)
Most Common Industries - Agriculture, forestry, fishing and hunting (%)
Most Common Industries - Mining, quarrying, and oil and gas extraction (%)
Most Common Industries - Construction (%)
Most Common Industries - Manufacturing (%)
Most Common Industries - Wholesale trade (%)
Most Common Industries - Retail trade (%)
Most Common Industries - Transportation and warehousing, and utilities (%)
Most Common Industries - Transportation and warehousing (%)
Most Common Industries - Utilities (%)
Most Common Industries - Information (%)
Most Common Industries - Finance and insurance, and real estate and rental and leasing (%)
Most Common Industries - Finance and insurance (%)
Most Common Industries - Real estate and rental and leasing (%)
Most Common Industries - Professional, scientific, and management, and administrative and waste management services (%)
Most Common Industries - Professional, scientific, and technical services (%)
Most Common Industries - Management of companies and enterprises (%)
Most Common Industries - Administrative and support and waste management services (%)
Most Common Industries - Educational services, and health care and social assistance (%)
Most Common Industries - Educational services (%)
Most Common Industries - Health care and social assistance (%)
Most Common Industries - Arts, entertainment, and recreation, and accommodation and food services (%)
Most Common Industries - Arts, entertainment, and recreation (%)
Most Common Industries - Accommodation and food services (%)
Most Common Industries - Other services, except public administration (%)
Most Common Industries - Public administration (%)
Occupation diversity
Most Common Occupations - Management, business, science, and arts occupations (%)
Most Common Occupations - Management, business, and financial occupations (%)
Most Common Occupations - Management occupations (%)
Most Common Occupations - Business and financial operations occupations (%)
Most Common Occupations - Computer, engineering, and science occupations (%)
Most Common Occupations - Computer and mathematical occupations (%)
Most Common Occupations - Architecture and engineering occupations (%)
Most Common Occupations - Life, physical, and social science occupations (%)
Most Common Occupations - Education, legal, community service, arts, and media occupations (%)
Most Common Occupations - Community and social service occupations (%)
Most Common Occupations - Legal occupations (%)
Most Common Occupations - Education, training, and library occupations (%)
Most Common Occupations - Arts, design, entertainment, sports, and media occupations (%)
Most Common Occupations - Healthcare practitioners and technical occupations (%)
Most Common Occupations - Health diagnosing and treating practitioners and other technical occupations (%)
Most Common Occupations - Health technologists and technicians (%)
Most Common Occupations - Service occupations (%)
Most Common Occupations - Healthcare support occupations (%)
Most Common Occupations - Protective service occupations (%)
Most Common Occupations - Fire fighting and prevention, and other protective service workers including supervisors (%)
Most Common Occupations - Law enforcement workers including supervisors (%)
Most Common Occupations - Food preparation and serving related occupations (%)
Most Common Occupations - Building and grounds cleaning and maintenance occupations (%)
Most Common Occupations - Personal care and service occupations (%)
Most Common Occupations - Sales and office occupations (%)
Most Common Occupations - Sales and related occupations (%)
Most Common Occupations - Office and administrative support occupations (%)
Most Common Occupations - Natural resources, construction, and maintenance occupations (%)
Most Common Occupations - Farming, fishing, and forestry occupations (%)
Most Common Occupations - Construction and extraction occupations (%)
Most Common Occupations - Installation, maintenance, and repair occupations (%)
Most Common Occupations - Production, transportation, and material moving occupations (%)
Most Common Occupations - Production occupations (%)
Most Common Occupations - Transportation occupations (%)
Most Common Occupations - Material moving occupations (%)
People in Group quarters - Institutionalized population (%)
People in Group quarters - Correctional institutions (%)
People in Group quarters - Federal prisons and detention centers (%)
People in Group quarters - Halfway houses (%)
People in Group quarters - Local jails and other confinement facilities (including police lockups) (%)
People in Group quarters - Military disciplinary barracks (%)
People in Group quarters - State prisons (%)
People in Group quarters - Other types of correctional institutions (%)
People in Group quarters - Nursing homes (%)
People in Group quarters - Hospitals/wards, hospices, and schools for the handicapped (%)
People in Group quarters - Hospitals/wards and hospices for chronically ill (%)
People in Group quarters - Hospices or homes for chronically ill (%)
People in Group quarters - Military hospitals or wards for chronically ill (%)
People in Group quarters - Other hospitals or wards for chronically ill (%)
People in Group quarters - Hospitals or wards for drug/alcohol abuse (%)
People in Group quarters - Mental (Psychiatric) hospitals or wards (%)
People in Group quarters - Schools, hospitals, or wards for the mentally retarded (%)
People in Group quarters - Schools, hospitals, or wards for the physically handicapped (%)
People in Group quarters - Institutions for the deaf (%)
People in Group quarters - Institutions for the blind (%)
People in Group quarters - Orthopedic wards and institutions for the physically handicapped (%)
People in Group quarters - Wards in general hospitals for patients who have no usual home elsewhere (%)
People in Group quarters - Wards in military hospitals for patients who have no usual home elsewhere (%)
People in Group quarters - Juvenile institutions (%)
People in Group quarters - Long-term care (%)
People in Group quarters - Homes for abused, dependent, and neglected children (%)
People in Group quarters - Residential treatment centers for emotionally disturbed children (%)
People in Group quarters - Training schools for juvenile delinquents (%)
People in Group quarters - Short-term care, detention or diagnostic centers for delinquent children (%)
People in Group quarters - Type of juvenile institution unknown (%)
People in Group quarters - Noninstitutionalized population (%)
People in Group quarters - College dormitories (includes college quarters off campus) (%)
People in Group quarters - Military quarters (%)
People in Group quarters - On base (%)
People in Group quarters - Barracks, unaccompanied personnel housing (UPH), (Enlisted/Officer), ;and similar group living quarters for military personnel (%)
People in Group quarters - Transient quarters for temporary residents (%)
People in Group quarters - Military ships (%)
People in Group quarters - Group homes (%)
People in Group quarters - Homes or halfway houses for drug/alcohol abuse (%)
People in Group quarters - Homes for the mentally ill (%)
People in Group quarters - Homes for the mentally retarded (%)
People in Group quarters - Homes for the physically handicapped (%)
People in Group quarters - Other group homes (%)
People in Group quarters - Religious group quarters (%)
People in Group quarters - Dormitories (%)
People in Group quarters - Agriculture workers' dormitories on farms (%)
People in Group quarters - Job Corps and vocational training facilities (%)
People in Group quarters - Other workers' dormitories (%)
People in Group quarters - Crews of maritime vessels (%)
People in Group quarters - Other nonhousehold living situations (%)
People in Group quarters - Other noninstitutional group quarters (%)
Residents speaking English at home (%)
Residents speaking English at home - Born in the United States (%)
Residents speaking English at home - Native, born elsewhere (%)
Residents speaking English at home - Foreign born (%)
Residents speaking Spanish at home (%)
Residents speaking Spanish at home - Born in the United States (%)
Residents speaking Spanish at home - Native, born elsewhere (%)
Residents speaking Spanish at home - Foreign born (%)
Residents speaking other language at home (%)
Residents speaking other language at home - Born in the United States (%)
Residents speaking other language at home - Native, born elsewhere (%)
Residents speaking other language at home - Foreign born (%)
Class of Workers - Employee of private company (%)
Class of Workers - Self-employed in own incorporated business (%)
Class of Workers - Private not-for-profit wage and salary workers (%)
Class of Workers - Local government workers (%)
Class of Workers - State government workers (%)
Class of Workers - Federal government workers (%)
Class of Workers - Self-employed workers in own not incorporated business and Unpaid family workers (%)
House heating fuel used in houses and condos - Utility gas (%)
House heating fuel used in houses and condos - Bottled, tank, or LP gas (%)
House heating fuel used in houses and condos - Electricity (%)
House heating fuel used in houses and condos - Fuel oil, kerosene, etc. (%)
House heating fuel used in houses and condos - Coal or coke (%)
House heating fuel used in houses and condos - Wood (%)
House heating fuel used in houses and condos - Solar energy (%)
House heating fuel used in houses and condos - Other fuel (%)
House heating fuel used in houses and condos - No fuel used (%)
House heating fuel used in apartments - Utility gas (%)
House heating fuel used in apartments - Bottled, tank, or LP gas (%)
House heating fuel used in apartments - Electricity (%)
House heating fuel used in apartments - Fuel oil, kerosene, etc. (%)
House heating fuel used in apartments - Coal or coke (%)
House heating fuel used in apartments - Wood (%)
House heating fuel used in apartments - Solar energy (%)
House heating fuel used in apartments - Other fuel (%)
House heating fuel used in apartments - No fuel used (%)
Armed forces status - In Armed Forces (%)
Armed forces status - Civilian (%)
Armed forces status - Civilian - Veteran (%)
Armed forces status - Civilian - Nonveteran (%)
Fatal accidents locations in years 2005-2021
Fatal accidents locations in 2005
Fatal accidents locations in 2006
Fatal accidents locations in 2007
Fatal accidents locations in 2008
Fatal accidents locations in 2009
Fatal accidents locations in 2010
Fatal accidents locations in 2011
Fatal accidents locations in 2012
Fatal accidents locations in 2013
Fatal accidents locations in 2014
Fatal accidents locations in 2015
Fatal accidents locations in 2016
Fatal accidents locations in 2017
Fatal accidents locations in 2018
Fatal accidents locations in 2019
Fatal accidents locations in 2020
Fatal accidents locations in 2021
Alcohol use - People drinking some alcohol every month (%)
Alcohol use - People not drinking at all (%)
Alcohol use - Average days/month drinking alcohol
Alcohol use - Average drinks/week
Alcohol use - Average days/year people drink much
Audiometry - Average condition of hearing (%)
Audiometry - People that can hear a whisper from across a quiet room (%)
Audiometry - People that can hear normal voice from across a quiet room (%)
Audiometry - Ears ringing, roaring, buzzing (%)
Audiometry - Had a job exposure to loud noise (%)
Audiometry - Had off-work exposure to loud noise (%)
Blood Pressure & Cholesterol - Has high blood pressure (%)
Blood Pressure & Cholesterol - Checking blood pressure at home (%)
Blood Pressure & Cholesterol - Frequently checking blood cholesterol (%)
Blood Pressure & Cholesterol - Has high cholesterol level (%)
Consumer Behavior - Money monthly spent on food at supermarket/grocery store
Consumer Behavior - Money monthly spent on food at other stores
Consumer Behavior - Money monthly spent on eating out
Consumer Behavior - Money monthly spent on carryout/delivered foods
Consumer Behavior - Income spent on food at supermarket/grocery store (%)
Consumer Behavior - Income spent on food at other stores (%)
Consumer Behavior - Income spent on eating out (%)
Consumer Behavior - Income spent on carryout/delivered foods (%)
Current Health Status - General health condition (%)
Current Health Status - Blood donors (%)
Current Health Status - Has blood ever tested for HIV virus (%)
Current Health Status - Left-handed people (%)
Dermatology - People using sunscreen (%)
Diabetes - Diabetics (%)
Diabetes - Had a blood test for high blood sugar (%)
Diabetes - People taking insulin (%)
Diet Behavior & Nutrition - Diet health (%)
Diet Behavior & Nutrition - Milk product consumption (# of products/month)
Diet Behavior & Nutrition - Meals not home prepared (#/week)
Diet Behavior & Nutrition - Meals from fast food or pizza place (#/week)
Diet Behavior & Nutrition - Ready-to-eat foods (#/month)
Diet Behavior & Nutrition - Frozen meals/pizza (#/month)
Drug Use - People that ever used marijuana or hashish (%)
Drug Use - Ever used hard drugs (%)
Drug Use - Ever used any form of cocaine (%)
Drug Use - Ever used heroin (%)
Drug Use - Ever used methamphetamine (%)
Health Insurance - People covered by health insurance (%)
Kidney Conditions-Urology - Avg. # of times urinating at night
Medical Conditions - People with asthma (%)
Medical Conditions - People with anemia (%)
Medical Conditions - People with psoriasis (%)
Medical Conditions - People with overweight (%)
Medical Conditions - Elderly people having difficulties in thinking or remembering (%)
Medical Conditions - People who ever received blood transfusion (%)
Medical Conditions - People having trouble seeing even with glass/contacts (%)
Medical Conditions - People with arthritis (%)
Medical Conditions - People with gout (%)
Medical Conditions - People with congestive heart failure (%)
Medical Conditions - People with coronary heart disease (%)
Medical Conditions - People with angina pectoris (%)
Medical Conditions - People who ever had heart attack (%)
Medical Conditions - People who ever had stroke (%)
Medical Conditions - People with emphysema (%)
Medical Conditions - People with thyroid problem (%)
Medical Conditions - People with chronic bronchitis (%)
Medical Conditions - People with any liver condition (%)
Medical Conditions - People who ever had cancer or malignancy (%)
Mental Health - People who have little interest in doing things (%)
Mental Health - People feeling down, depressed, or hopeless (%)
Mental Health - People who have trouble sleeping or sleeping too much (%)
Mental Health - People feeling tired or having little energy (%)
Mental Health - People with poor appetite or overeating (%)
Mental Health - People feeling bad about themself (%)
Mental Health - People who have trouble concentrating on things (%)
Mental Health - People moving or speaking slowly or too fast (%)
Mental Health - People having thoughts they would be better off dead (%)
Oral Health - Average years since last visit a dentist
Oral Health - People embarrassed because of mouth (%)
Oral Health - People with gum disease (%)
Oral Health - General health of teeth and gums (%)
Oral Health - Average days a week using dental floss/device
Oral Health - Average days a week using mouthwash for dental problem
Oral Health - Average number of teeth
Pesticide Use - Households using pesticides to control insects (%)
Pesticide Use - Households using pesticides to kill weeds (%)
Physical Activity - People doing vigorous-intensity work activities (%)
Physical Activity - People doing moderate-intensity work activities (%)
Physical Activity - People walking or bicycling (%)
Physical Activity - People doing vigorous-intensity recreational activities (%)
Physical Activity - People doing moderate-intensity recreational activities (%)
Physical Activity - Average hours a day doing sedentary activities
Physical Activity - Average hours a day watching TV or videos
Physical Activity - Average hours a day using computer
Physical Functioning - People having limitations keeping them from working (%)
Physical Functioning - People limited in amount of work they can do (%)
Physical Functioning - People that need special equipment to walk (%)
Physical Functioning - People experiencing confusion/memory problems (%)
Physical Functioning - People requiring special healthcare equipment (%)
Prescription Medications - Average number of prescription medicines taking
Preventive Aspirin Use - Adults 40+ taking low-dose aspirin (%)
Reproductive Health - Vaginal deliveries (%)
Reproductive Health - Cesarean deliveries (%)
Reproductive Health - Deliveries resulted in a live birth (%)
Reproductive Health - Pregnancies resulted in a delivery (%)
Reproductive Health - Women breastfeeding newborns (%)
Reproductive Health - Women that had a hysterectomy (%)
Reproductive Health - Women that had both ovaries removed (%)
Reproductive Health - Women that have ever taken birth control pills (%)
Reproductive Health - Women taking birth control pills (%)
Reproductive Health - Women that have ever used Depo-Provera or injectables (%)
Reproductive Health - Women that have ever used female hormones (%)
Sexual Behavior - People 18+ that ever had sex (vaginal, anal, or oral) (%)
Sexual Behavior - Males 18+ that ever had vaginal sex with a woman (%)
Sexual Behavior - Males 18+ that ever performed oral sex on a woman (%)
Sexual Behavior - Males 18+ that ever had anal sex with a woman (%)
Sexual Behavior - Males 18+ that ever had any sex with a man (%)
Sexual Behavior - Females 18+ that ever had vaginal sex with a man (%)
Sexual Behavior - Females 18+ that ever performed oral sex on a man (%)
Sexual Behavior - Females 18+ that ever had anal sex with a man (%)
Sexual Behavior - Females 18+ that ever had any kind of sex with a woman (%)
Sexual Behavior - Average age people first had sex
Sexual Behavior - Average number of female sex partners in lifetime (males 18+)
Sexual Behavior - Average number of female vaginal sex partners in lifetime (males 18+)
Sexual Behavior - Average age people first performed oral sex on a woman (18+)
Sexual Behavior - Average number of woman performed oral sex on in lifetime (18+)
Sexual Behavior - Average number of male sex partners in lifetime (males 18+)
Sexual Behavior - Average number of male anal sex partners in lifetime (males 18+)
Sexual Behavior - Average age people first performed oral sex on a man (18+)
Sexual Behavior - Average number of male oral sex partners in lifetime (18+)
Sexual Behavior - People using protection when performing oral sex (%)
Sexual Behavior - Average number of times people have vaginal or anal sex a year
Sexual Behavior - People having sex without condom (%)
Sexual Behavior - Average number of male sex partners in lifetime (females 18+)
Sexual Behavior - Average number of male vaginal sex partners in lifetime (females 18+)
Sexual Behavior - Average number of female sex partners in lifetime (females 18+)
Sexual Behavior - Circumcised males 18+ (%)
Sleep Disorders - Average hours sleeping at night
Sleep Disorders - People that has trouble sleeping (%)
Smoking-Cigarette Use - People smoking cigarettes (%)
Taste & Smell - People 40+ having problems with smell (%)
Taste & Smell - People 40+ having problems with taste (%)
Taste & Smell - People 40+ that ever had wisdom teeth removed (%)
Taste & Smell - People 40+ that ever had tonsils teeth removed (%)
Taste & Smell - People 40+ that ever had a loss of consciousness because of a head injury (%)
Taste & Smell - People 40+ that ever had a broken nose or other serious injury to face or skull (%)
Taste & Smell - People 40+ that ever had two or more sinus infections (%)
Weight - Average height (inches)
Weight - Average weight (pounds)
Weight - Average BMI
Weight - People that are obese (%)
Weight - People that ever were obese (%)
Weight - People trying to lose weight (%)

 Please register to participate in our discussions with 2 million other members - it's free and quick! Some forums can only be seen by registered members. After you create your account, you'll be able to customize options and access all our 15,000 new posts/day with fewer ads.