Please register to participate in our discussions with 2 million other members - it's free and quick! Some forums can only be seen by registered members. After you create your account, you'll be able to customize options and access all our 15,000 new posts/day with fewer ads.
Australia was 22.5% Catholic in 1891 (falling to 19.7% in 1947), so it seems reasonable to assume that the country was just under one fifth Irish Catholic in the late 19th/early 20th century, much higher than the US and Canada, which were both probably about a tenth of the population.
So in terms of the "old stock" groups, Australia is the most Anglo Saxon and Irish and the least German of the three countries. Canada is the most Scottish. The US is the most German. Australians of Irish ancestry are obviously less likely to report it than Americans and Canadians.
So it appears that "Australian ancestry" is most English, Scottish and Irish, "American ancestry" mostly English and Scots-Irish, and "Canadian ancestry" French and British Isles.
Canada has a higher percentage of immigrants, america has the most but i think the ones with the most money are in australia.
Quote:
Originally Posted by danielsa1775
Australia’s immigrant population is of course the lowest in total numbers but proportionately is actually the highest of the three. The countries/area of birth of Australia's population in 2011 were.
Australia 73.5%
North West Europe 7%
Southern Europe 3.5%
South East Asia 3.5%
North East Asia 3%
New Zealand and The Pacific Islands 3%
Central and South Asia 2.5%
Middle East and Northern Africa 1.5%
Sub-Saharan Africa 1.5%
North and South America 1%
Of course up until the end of WW2 , the Australian government did its very best to keep its population as white and British as possible, to that time the population came almost exclusively came from the British isles ( with a few German’s thrown in). Hence the reason why European Australians lack the big diversity in ancestries that European Canadians and Americans do.
Asians did not really start immigrating to Australia in large numbers until the Vietnamese Refugee Crises in early 1980’s.
I don't really have any startling facts for you really, I might be able to dig something up
I think it would be better to compare Australia (23 million people) and Canada (35 million people) to a U.S. state like California (38 million people). So, although the U.S. only has 13 percent foreign born, California (2011) had a foreign born population at a little more than 27%, which makes it both higher in real numbers and per capita than that of Australia (26.5%) or Canada (20.6%).
In certain counties in California, it is above 30% (Orange, Los Angeles, Imperial, Alameda, San Francisco, Santa Clara, San Mateo). Immigrants in California (PPIC Publication) . The province of Ontario, with the largest in both numbers and percentage of foreign born (within Canada), and a population of 3.6 million (less than the city of LA at 3.88 million, and way below LA county at 10 million) has a 28.5% foreign born population, so still not as much as what you would find in those California counties, though not that far off.
Also, unlike Australia which has a much higher European component, California's immigrant population is largely made up of Latin Americans and Asians (Mexico, Philippines and China are the primary countries of origin.) Asians are quickly outpacing all groups with 53% of incoming immigrants between 2007 and 2011 being from Asia, compared to 31% from Latin America. In Canada, within a similar time period (2006-2011), 56.9% of immigrants were from Asia (they include the Middle East as well), with the most common origin countries being the Philippines, China and India.
It would be interesting to compare the three at similar periods in their history. Free immigration to Australia really only began on the 1830s; the U.S. was a large and mature nation by that time. Today Australia still is very much a nation of immigrants and children of immigrants; while the U.S. isn't much different to the "old world" nations of Europe.
Although I have been lurking around these forums for quite some time now I haev just decided to sign up and join the conversations I am quite a number geek, and have keen interest in a number of topics that are often discussed here. Geography, culture, cities, architecture... etc.
Anyway I thought I'd share my thought on one of the topics that I have always been interested in, the diveresity in "traditional immigrant countries" such as the United States, Canada and Australia and are there any differences between immigrantion and cultural history. Do they have specific ties to certain European countries that generate greater interests? Questions like these have driven me to do some simple research of my own. I have put together statistics from US Census Bureau, Statistics Canada and Australian Bureau of Statistics trying to compile their data on reported ancestry/ethnicity.
In Australia for example, Malta and Macedonia are the only two European countries that sent more immigrants to the country than either USA and Canada, based on their 2006 census statistics. Australia also has sizable Serbians, Greek, Crotian, and English relative to its overall population (in that order). People from the British Isles still dominates the overall European population in Australia, with Italians, Germans being the next major ancestry groups.
In Canada, the only two countries that sent more immigrants to the country are Iceland and Ukraine. Scotland, Estonia and France is not far behind. The country has sizable Belgium, Romanian, Autraian, Dutch, Finnish, Swiss, Danish communities relative to its overall population. People of French and British/Irish ancestries comprises the majority of the population, but we start to see sizable communities of people of Dutch, German, Scandinavian and Ukrainian ancestry.
I'm sorry, but I'm not following. Are you saying we have a lot of Icelanders in Canada?
I think it would be better to compare Australia (23 million people) and Canada (35 million people) to a U.S. state like California (38 million people). So, although the U.S. only has 13 percent foreign born, California (2011) had a foreign born population at a little more than 27%, which makes it both higher in real numbers and per capita than that of Australia (26.5%) or Canada (20.6%).
In certain counties in California, it is above 30% (Orange, Los Angeles, Imperial, Alameda, San Francisco, Santa Clara, San Mateo). Immigrants in California (PPIC Publication) . The province of Ontario, with the largest in both numbers and percentage of foreign born (within Canada), and a population of 3.6 million (less than the city of LA at 3.88 million, and way below LA county at 10 million) has a 28.5% foreign born population, so still not as much as what you would find in those California counties, though not that far off.
Also, unlike Australia which has a much higher European component, California's immigrant population is largely made up of Latin Americans and Asians (Mexico, Philippines and China are the primary countries of origin.) Asians are quickly outpacing all groups with 53% of incoming immigrants between 2007 and 2011 being from Asia, compared to 31% from Latin America. In Canada, within a similar time period (2006-2011), 56.9% of immigrants were from Asia (they include the Middle East as well), with the most common origin countries being the Philippines, China and India.
Of course Most of Australia's current immigrants come form Asia as well, I suppose the biggest surprise to most would be that the biggest single source of immigrants arriving in Australia these days is India and not China.
I'm sorry, but I'm not following. Are you saying we have a lot of Icelanders in Canada?
Only in relative terms. The population of Iceland today is only around 320,000. But Iceland is one of the few countries who sent more immigrants, in absolute numbers, to Canada than to the United States. But it was only estimated that there were 10,000 in total and according to the census in 2011, there is about 95,000 Icelandic-Canadians. A small faction of the population. But I am guessing in some area, like Manitoba, one will be more likely to bumped into one. For comparison, there are around 52,000 Icelandic-Americans and about 1,000 Icelandic-Australians.
Only in relative terms. The population of Iceland today is only around 320,000. But Iceland is one of the few countries who sent more immigrants, in absolute numbers, to Canada than to the United States. But it was only estimated that there were 10,000 in total and according to the census in 2011, there is about 95,000 Icelandic-Canadians. A small faction of the population. But I am guessing in some area, like Manitoba, one will be more likely to bumped into one. For comparison, there are around 52,000 Icelandic-Americans and about 1,000 Icelandic-Australians.
One interesting thing I have found is that the reported % of people who speak English at home or (English and French in the case of Canada) is almost identical across all three Countries at 80% of total.
"In Canada, 4.7 million persons (14.2% of the population) reported speaking a language other than English or French most often at home and 1.9 million persons (5.8%) reported speaking such a language on a regular basis as a second language (in addition to their main home language, English or French).Footnote 1 In all, 20.0% of Canada's population reported speaking a language other than English or French at home".
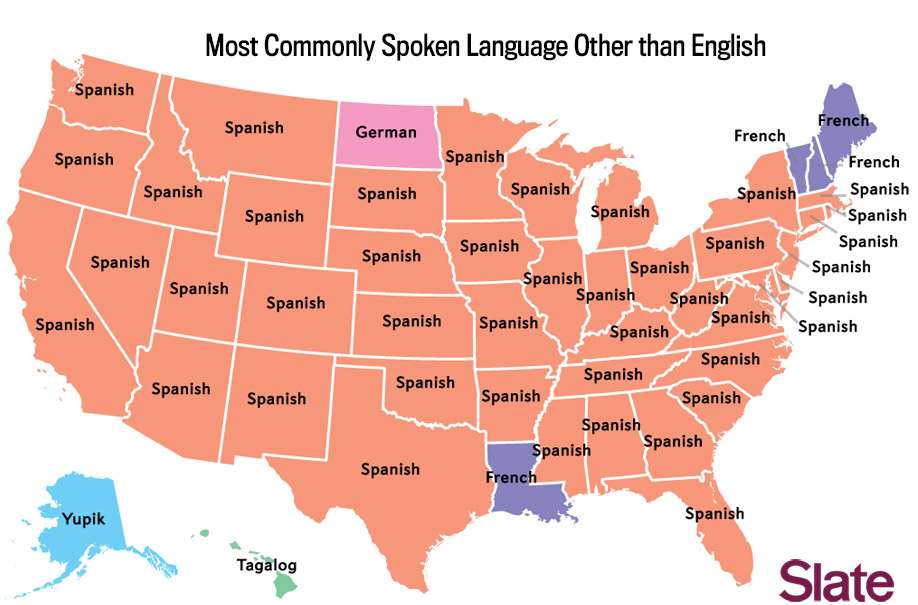
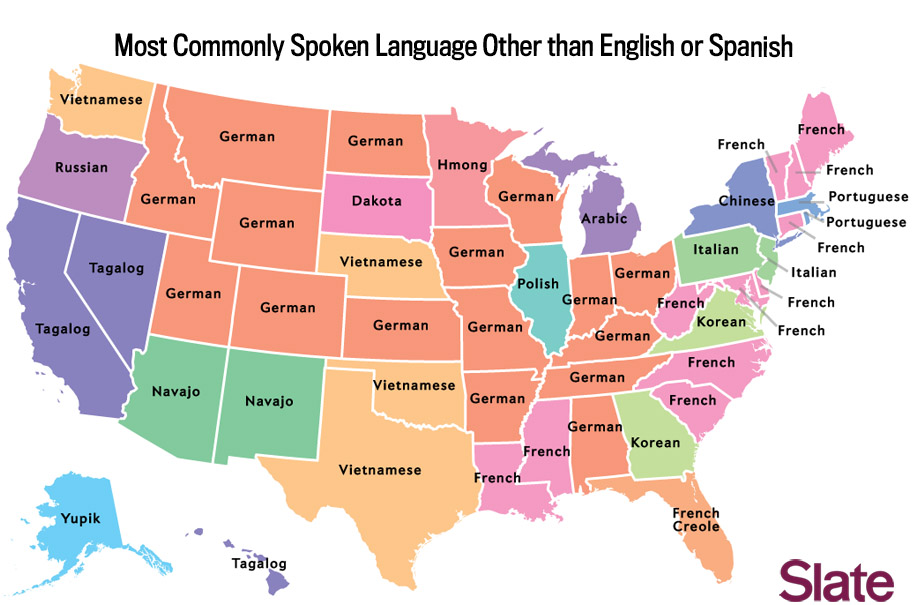
The next most spoken however are all different in Canada is Punjabi, In Australia it is Mandarin, and The USA of course is Spanish
I knew Punjabi was high in Canada, but did not expect it to be first. This is likely a reflection of more recent immigration, and of linguistic assimilation of other groups that are larger but of longer establishment in Canada.
One interesting thing I have found is that the reported % of people who speak English at home or (English and French in the case of Canada) is almost identical across all three Countries at 80% of total.
"In Canada, 4.7 million persons (14.2% of the population) reported speaking a language other than English or French most often at home and 1.9 million persons (5.8%) reported speaking such a language on a regular basis as a second language (in addition to their main home language, English or French).Footnote 1 In all, 20.0% of Canada's population reported speaking a language other than English or French at home".
The next most spoken however are all different in Canada is Punjabi, In Australia it is Mandarin, and The USA of course is Spanish
Quote:
Originally Posted by Acajack
I knew Punjabi was high in Canada, but did not expect it to be first. This is likely a reflection of more recent immigration, and of linguistic assimilation of other groups that are larger but of longer establishment in Canada.
Please register to post and access all features of our very popular forum. It is free and quick. Over $68,000 in prizes has already been given out to active posters on our forum. Additional giveaways are planned.
Detailed information about all U.S. cities, counties, and zip codes on our site: City-data.com.

 Please register to participate in our discussions with 2 million other members - it's free and quick! Some forums can only be seen by registered members. After you create your account, you'll be able to customize options and access all our 15,000 new posts/day with fewer ads.


 I am quite a number geek, and have keen interest in a number of topics that are often discussed here. Geography, culture, cities, architecture... etc.