Bostonia, California Submit your own pictures of this place and show them to the world
OSM Map
General Map
Google Map
MSN Map
OSM Map
General Map
Google Map
MSN Map
OSM Map
General Map
Google Map
MSN Map
OSM Map
General Map
Google Map
MSN Map
Please wait while loading the map...
Population in 2010: 15,379. Population change since 2000: +1.4%Males: 7,321 Females: 8,058
March 2022 cost of living index in Bostonia: 121.6 (high, U.S. average is 100) Percentage of residents living in poverty in 2022: 14.4%for White Non-Hispanic residents , 19.4% for Black residents , 14.8% for Hispanic or Latino residents , 6.4% for American Indian residents , 26.8% for other race residents , 3.5% for two or more races residents )Business Search - 14 Million verified businesses
Data:
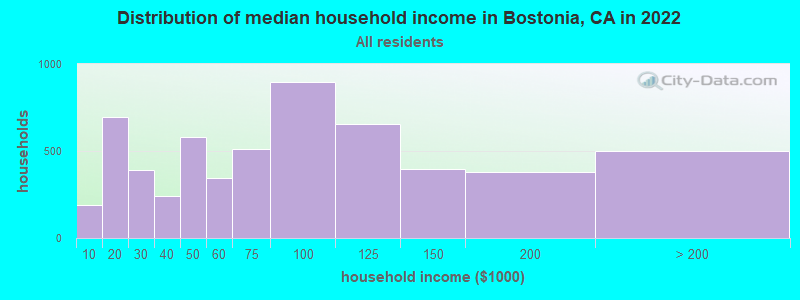
Median household income ($)
Median household income (% change since 2000)
Household income diversity
Ratio of average income to average house value (%)
Ratio of average income to average rent
Median household income ($) - White
Median household income ($) - Black or African American
Median household income ($) - Asian
Median household income ($) - Hispanic or Latino
Median household income ($) - American Indian and Alaska Native
Median household income ($) - Multirace
Median household income ($) - Other Race
Median household income for houses/condos with a mortgage ($)
Median household income for apartments without a mortgage ($)
Races - White alone (%)
Races - White alone (% change since 2000)
Races - Black alone (%)
Races - Black alone (% change since 2000)
Races - American Indian alone (%)
Races - American Indian alone (% change since 2000)
Races - Asian alone (%)
Races - Asian alone (% change since 2000)
Races - Hispanic (%)
Races - Hispanic (% change since 2000)
Races - Native Hawaiian and Other Pacific Islander alone (%)
Races - Native Hawaiian and Other Pacific Islander alone (% change since 2000)
Races - Two or more races (%)
Races - Two or more races (% change since 2000)
Races - Other race alone (%)
Races - Other race alone (% change since 2000)
Racial diversity
Unemployment (%)
Unemployment (% change since 2000)
Unemployment (%) - White
Unemployment (%) - Black or African American
Unemployment (%) - Asian
Unemployment (%) - Hispanic or Latino
Unemployment (%) - American Indian and Alaska Native
Unemployment (%) - Multirace
Unemployment (%) - Other Race
Population density (people per square mile)
Population - Males (%)
Population - Females (%)
Population - Males (%) - White
Population - Males (%) - Black or African American
Population - Males (%) - Asian
Population - Males (%) - Hispanic or Latino
Population - Males (%) - American Indian and Alaska Native
Population - Males (%) - Multirace
Population - Males (%) - Other Race
Population - Females (%) - White
Population - Females (%) - Black or African American
Population - Females (%) - Asian
Population - Females (%) - Hispanic or Latino
Population - Females (%) - American Indian and Alaska Native
Population - Females (%) - Multirace
Population - Females (%) - Other Race
Coronavirus confirmed cases (Apr 26, 2024)
Deaths caused by coronavirus (Apr 26, 2024)
Coronavirus confirmed cases (per 100k population) (Apr 26, 2024)
Deaths caused by coronavirus (per 100k population) (Apr 26, 2024)
Daily increase in number of cases (Apr 26, 2024)
Weekly increase in number of cases (Apr 26, 2024)
Cases doubled (in days) (Apr 26, 2024)
Hospitalized patients (Apr 18, 2022)
Negative test results (Apr 18, 2022)
Total test results (Apr 18, 2022)
COVID Vaccine doses distributed (per 100k population) (Sep 19, 2023)
COVID Vaccine doses administered (per 100k population) (Sep 19, 2023)
COVID Vaccine doses distributed (Sep 19, 2023)
COVID Vaccine doses administered (Sep 19, 2023)
Likely homosexual households (%)
Likely homosexual households (% change since 2000)
Likely homosexual households - Lesbian couples (%)
Likely homosexual households - Lesbian couples (% change since 2000)
Likely homosexual households - Gay men (%)
Likely homosexual households - Gay men (% change since 2000)
Cost of living index
Median gross rent ($)
Median contract rent ($)
Median monthly housing costs ($)
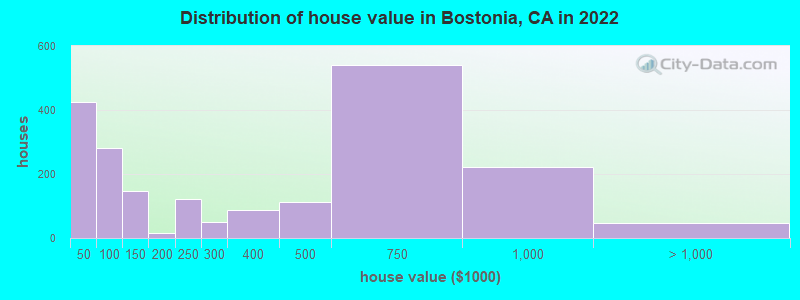
Median house or condo value ($)
Median house or condo value ($ change since 2000)
Mean house or condo value by units in structure - 1, detached ($)
Mean house or condo value by units in structure - 1, attached ($)
Mean house or condo value by units in structure - 2 ($)
Mean house or condo value by units in structure by units in structure - 3 or 4 ($)
Mean house or condo value by units in structure - 5 or more ($)
Mean house or condo value by units in structure - Boat, RV, van, etc. ($)
Mean house or condo value by units in structure - Mobile home ($)
Median house or condo value ($) - White
Median house or condo value ($) - Black or African American
Median house or condo value ($) - Asian
Median house or condo value ($) - Hispanic or Latino
Median house or condo value ($) - American Indian and Alaska Native
Median house or condo value ($) - Multirace
Median house or condo value ($) - Other Race
Median resident age
Resident age diversity
Median resident age - Males
Median resident age - Females
Median resident age - White
Median resident age - Black or African American
Median resident age - Asian
Median resident age - Hispanic or Latino
Median resident age - American Indian and Alaska Native
Median resident age - Multirace
Median resident age - Other Race
Median resident age - Males - White
Median resident age - Males - Black or African American
Median resident age - Males - Asian
Median resident age - Males - Hispanic or Latino
Median resident age - Males - American Indian and Alaska Native
Median resident age - Males - Multirace
Median resident age - Males - Other Race
Median resident age - Females - White
Median resident age - Females - Black or African American
Median resident age - Females - Asian
Median resident age - Females - Hispanic or Latino
Median resident age - Females - American Indian and Alaska Native
Median resident age - Females - Multirace
Median resident age - Females - Other Race
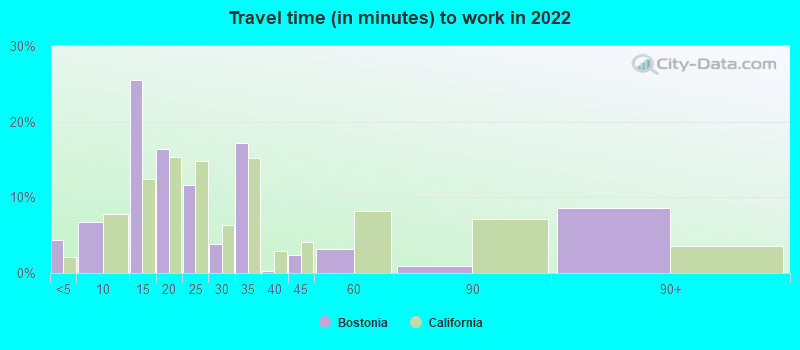
Commute - mean travel time to work (minutes)
Travel time to work - Less than 5 minutes (%)
Travel time to work - Less than 5 minutes (% change since 2000)
Travel time to work - 5 to 9 minutes (%)
Travel time to work - 5 to 9 minutes (% change since 2000)
Travel time to work - 10 to 19 minutes (%)
Travel time to work - 10 to 19 minutes (% change since 2000)
Travel time to work - 20 to 29 minutes (%)
Travel time to work - 20 to 29 minutes (% change since 2000)
Travel time to work - 30 to 39 minutes (%)
Travel time to work - 30 to 39 minutes (% change since 2000)
Travel time to work - 40 to 59 minutes (%)
Travel time to work - 40 to 59 minutes (% change since 2000)
Travel time to work - 60 to 89 minutes (%)
Travel time to work - 60 to 89 minutes (% change since 2000)
Travel time to work - 90 or more minutes (%)
Travel time to work - 90 or more minutes (% change since 2000)
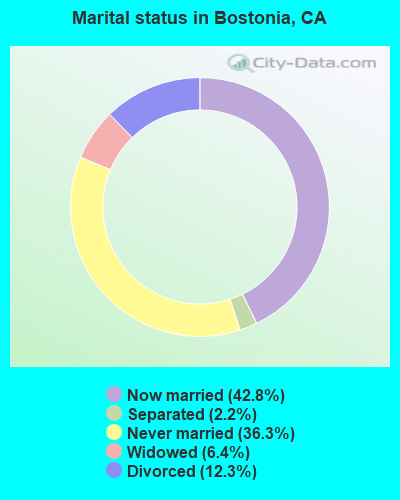
Marital status - Never married (%)
Marital status - Now married (%)
Marital status - Separated (%)
Marital status - Widowed (%)
Marital status - Divorced (%)
Median family income ($)
Median family income (% change since 2000)
Median non-family income ($)
Median non-family income (% change since 2000)
Median per capita income ($)
Median per capita income (% change since 2000)
Median family income ($) - White
Median family income ($) - Black or African American
Median family income ($) - Asian
Median family income ($) - Hispanic or Latino
Median family income ($) - American Indian and Alaska Native
Median family income ($) - Multirace
Median family income ($) - Other Race
Median year house/condo built
Median year apartment built
Year house built - Built 2005 or later (%)
Year house built - Built 2000 to 2004 (%)
Year house built - Built 1990 to 1999 (%)
Year house built - Built 1980 to 1989 (%)
Year house built - Built 1970 to 1979 (%)
Year house built - Built 1960 to 1969 (%)
Year house built - Built 1950 to 1959 (%)
Year house built - Built 1940 to 1949 (%)
Year house built - Built 1939 or earlier (%)
Average household size
Household density (households per square mile)
Average household size - White
Average household size - Black or African American
Average household size - Asian
Average household size - Hispanic or Latino
Average household size - American Indian and Alaska Native
Average household size - Multirace
Average household size - Other Race
Occupied housing units (%)
Vacant housing units (%)
Owner occupied housing units (%)
Renter occupied housing units (%)
Vacancy status - For rent (%)
Vacancy status - For sale only (%)
Vacancy status - Rented or sold, not occupied (%)
Vacancy status - For seasonal, recreational, or occasional use (%)
Vacancy status - For migrant workers (%)
Vacancy status - Other vacant (%)
Residents with income below the poverty level (%)
Residents with income below 50% of the poverty level (%)
Children below poverty level (%)
Poor families by family type - Married-couple family (%)
Poor families by family type - Male, no wife present (%)
Poor families by family type - Female, no husband present (%)
Poverty status for native-born residents (%)
Poverty status for foreign-born residents (%)
Poverty among high school graduates not in families (%)
Poverty among people who did not graduate high school not in families (%)
Residents with income below the poverty level (%) - White
Residents with income below the poverty level (%) - Black or African American
Residents with income below the poverty level (%) - Asian
Residents with income below the poverty level (%) - Hispanic or Latino
Residents with income below the poverty level (%) - American Indian and Alaska Native
Residents with income below the poverty level (%) - Multirace
Residents with income below the poverty level (%) - Other Race
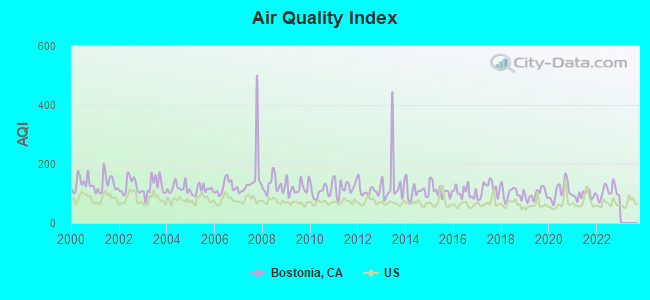
Air pollution - Air Quality Index (AQI)
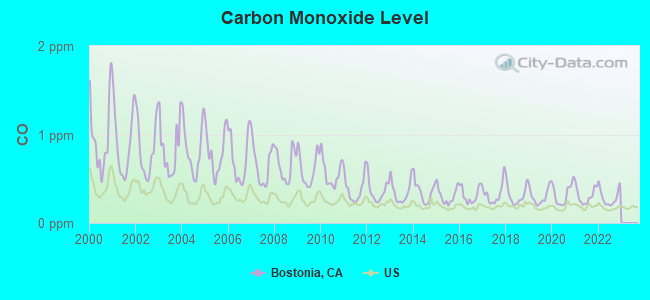
Air pollution - CO
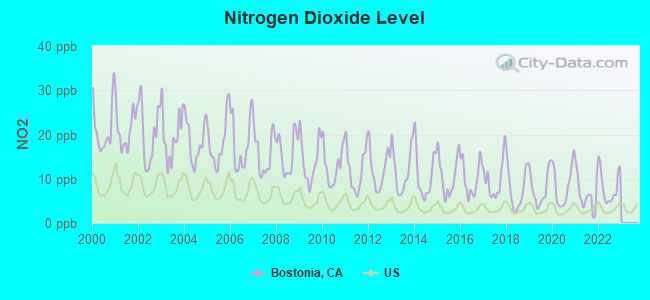
Air pollution - NO2
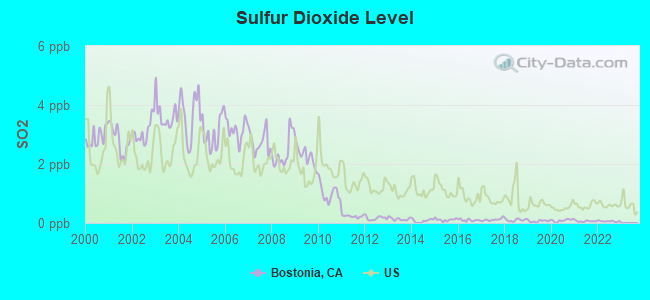
Air pollution - SO2
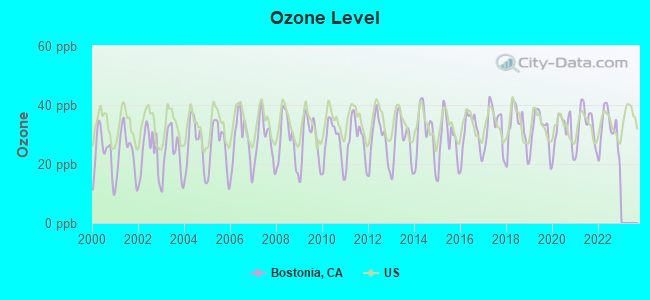
Air pollution - Ozone
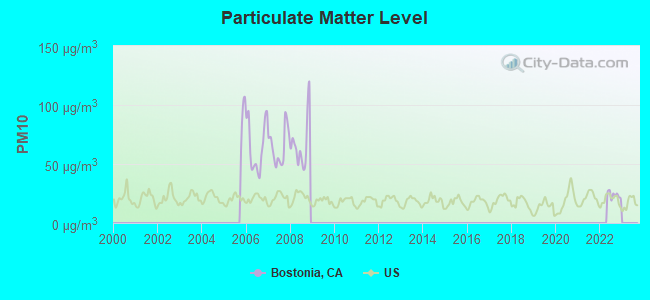
Air pollution - PM10
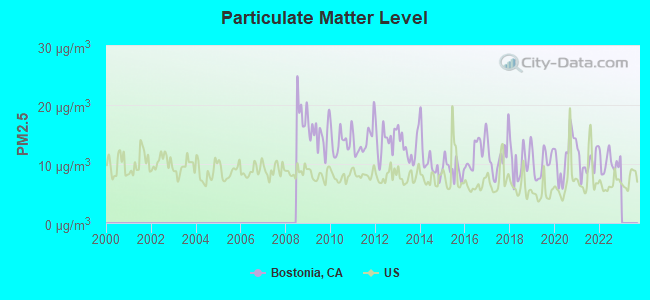
Air pollution - PM25
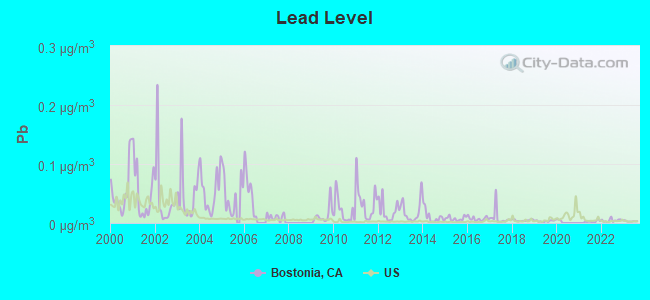
Air pollution - Pb
Crime - Murders per 100,000 population
Crime - Rapes per 100,000 population
Crime - Robberies per 100,000 population
Crime - Assaults per 100,000 population
Crime - Burglaries per 100,000 population
Crime - Thefts per 100,000 population
Crime - Auto thefts per 100,000 population
Crime - Arson per 100,000 population
Crime - City-data.com crime index
Crime - Violent crime index
Crime - Property crime index
Crime - Murders per 100,000 population (5 year average)
Crime - Rapes per 100,000 population (5 year average)
Crime - Robberies per 100,000 population (5 year average)
Crime - Assaults per 100,000 population (5 year average)
Crime - Burglaries per 100,000 population (5 year average)
Crime - Thefts per 100,000 population (5 year average)
Crime - Auto thefts per 100,000 population (5 year average)
Crime - Arson per 100,000 population (5 year average)
Crime - City-data.com crime index (5 year average)
Crime - Violent crime index (5 year average)
Crime - Property crime index (5 year average)
1996 Presidential Elections Results (%) - Democratic Party (Clinton)
1996 Presidential Elections Results (%) - Republican Party (Dole)
1996 Presidential Elections Results (%) - Other
2000 Presidential Elections Results (%) - Democratic Party (Gore)
2000 Presidential Elections Results (%) - Republican Party (Bush)
2000 Presidential Elections Results (%) - Other
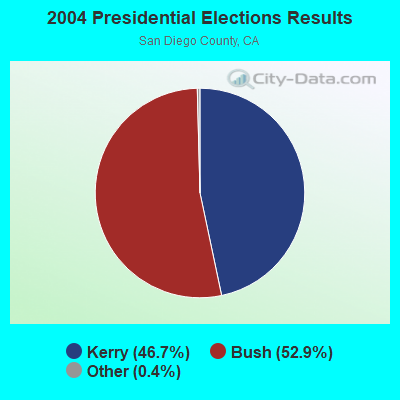
2004 Presidential Elections Results (%) - Democratic Party (Kerry)
2004 Presidential Elections Results (%) - Republican Party (Bush)
2004 Presidential Elections Results (%) - Other
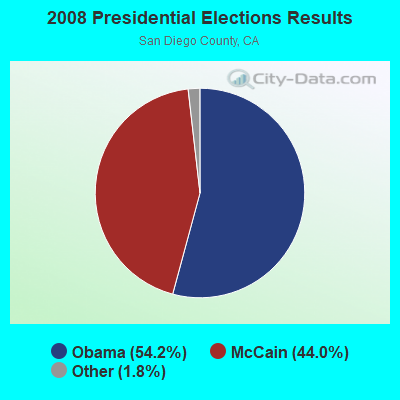
2008 Presidential Elections Results (%) - Democratic Party (Obama)
2008 Presidential Elections Results (%) - Republican Party (McCain)
2008 Presidential Elections Results (%) - Other
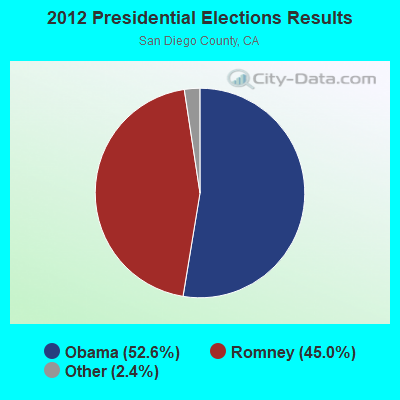
2012 Presidential Elections Results (%) - Democratic Party (Obama)
2012 Presidential Elections Results (%) - Republican Party (Romney)
2012 Presidential Elections Results (%) - Other
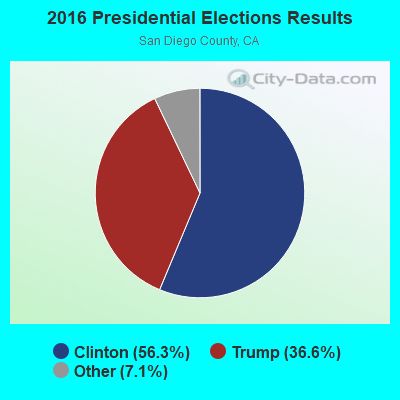
2016 Presidential Elections Results (%) - Democratic Party (Clinton)
2016 Presidential Elections Results (%) - Republican Party (Trump)
2016 Presidential Elections Results (%) - Other
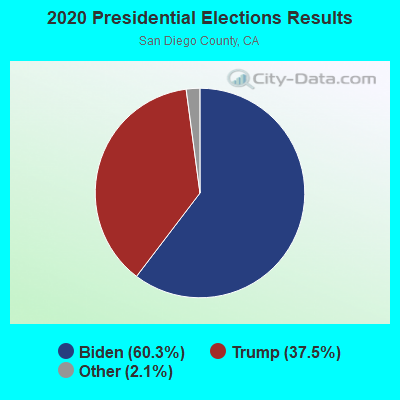
2020 Presidential Elections Results (%) - Democratic Party (Biden)
2020 Presidential Elections Results (%) - Republican Party (Trump)
2020 Presidential Elections Results (%) - Other
Ancestries Reported - Arab (%)
Ancestries Reported - Czech (%)
Ancestries Reported - Danish (%)
Ancestries Reported - Dutch (%)
Ancestries Reported - English (%)
Ancestries Reported - French (%)
Ancestries Reported - French Canadian (%)
Ancestries Reported - German (%)
Ancestries Reported - Greek (%)
Ancestries Reported - Hungarian (%)
Ancestries Reported - Irish (%)
Ancestries Reported - Italian (%)
Ancestries Reported - Lithuanian (%)
Ancestries Reported - Norwegian (%)
Ancestries Reported - Polish (%)
Ancestries Reported - Portuguese (%)
Ancestries Reported - Russian (%)
Ancestries Reported - Scotch-Irish (%)
Ancestries Reported - Scottish (%)
Ancestries Reported - Slovak (%)
Ancestries Reported - Subsaharan African (%)
Ancestries Reported - Swedish (%)
Ancestries Reported - Swiss (%)
Ancestries Reported - Ukrainian (%)
Ancestries Reported - United States (%)
Ancestries Reported - Welsh (%)
Ancestries Reported - West Indian (%)
Ancestries Reported - Other (%)
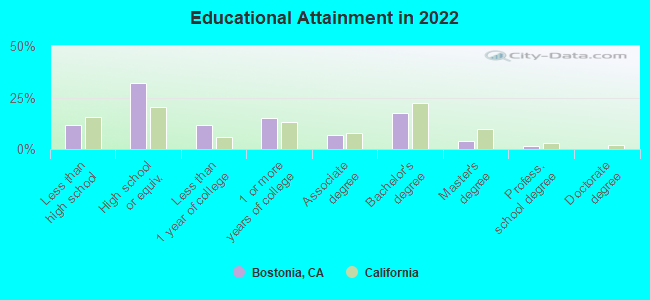
Educational Attainment - No schooling completed (%)
Educational Attainment - Less than high school (%)
Educational Attainment - High school or equivalent (%)
Educational Attainment - Less than 1 year of college (%)
Educational Attainment - 1 or more years of college (%)
Educational Attainment - Associate degree (%)
Educational Attainment - Bachelor's degree (%)
Educational Attainment - Master's degree (%)
Educational Attainment - Professional school degree (%)
Educational Attainment - Doctorate degree (%)
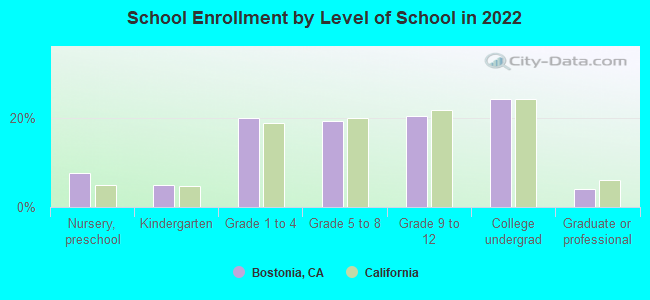
School Enrollment - Nursery, preschool (%)
School Enrollment - Kindergarten (%)
School Enrollment - Grade 1 to 4 (%)
School Enrollment - Grade 5 to 8 (%)
School Enrollment - Grade 9 to 12 (%)
School Enrollment - College undergrad (%)
School Enrollment - Graduate or professional (%)
School Enrollment - Not enrolled in school (%)
School enrollment - Public schools (%)
School enrollment - Private schools (%)
School enrollment - Not enrolled (%)
Median number of rooms in houses and condos
Median number of rooms in apartments
Housing units lacking complete plumbing facilities (%)
Housing units lacking complete kitchen facilities (%)
Density of houses
Urban houses (%)
Rural houses (%)
Households with people 60 years and over (%)
Households with people 65 years and over (%)
Households with people 75 years and over (%)
Households with one or more nonrelatives (%)
Households with no nonrelatives (%)
Population in households (%)
Family households (%)
Nonfamily households (%)
Population in families (%)
Family households with own children (%)
Median number of bedrooms in owner occupied houses
Mean number of bedrooms in owner occupied houses
Median number of bedrooms in renter occupied houses
Mean number of bedrooms in renter occupied houses
Median number of vehichles in owner occupied houses
Mean number of vehichles in owner occupied houses
Median number of vehichles in renter occupied houses
Mean number of vehichles in renter occupied houses
Mortgage status - with mortgage (%)
Mortgage status - with second mortgage (%)
Mortgage status - with home equity loan (%)
Mortgage status - with both second mortgage and home equity loan (%)
Mortgage status - without a mortgage (%)
Average family size
Average family size - White
Average family size - Black or African American
Average family size - Asian
Average family size - Hispanic or Latino
Average family size - American Indian and Alaska Native
Average family size - Multirace
Average family size - Other Race
Geographical mobility - Same house 1 year ago (%)
Geographical mobility - Moved within same county (%)
Geographical mobility - Moved from different county within same state (%)
Geographical mobility - Moved from different state (%)
Geographical mobility - Moved from abroad (%)
Place of birth - Born in state of residence (%)
Place of birth - Born in other state (%)
Place of birth - Native, outside of US (%)
Place of birth - Foreign born (%)
Housing units in structures - 1, detached (%)
Housing units in structures - 1, attached (%)
Housing units in structures - 2 (%)
Housing units in structures - 3 or 4 (%)
Housing units in structures - 5 to 9 (%)
Housing units in structures - 10 to 19 (%)
Housing units in structures - 20 to 49 (%)
Housing units in structures - 50 or more (%)
Housing units in structures - Mobile home (%)
Housing units in structures - Boat, RV, van, etc. (%)
House/condo owner moved in on average (years ago)
Renter moved in on average (years ago)
Year householder moved into unit - Moved in 1999 to March 2000 (%)
Year householder moved into unit - Moved in 1995 to 1998 (%)
Year householder moved into unit - Moved in 1990 to 1994 (%)
Year householder moved into unit - Moved in 1980 to 1989 (%)
Year householder moved into unit - Moved in 1970 to 1979 (%)
Year householder moved into unit - Moved in 1969 or earlier (%)
Means of transportation to work - Drove car alone (%)
Means of transportation to work - Carpooled (%)
Means of transportation to work - Public transportation (%)
Means of transportation to work - Bus or trolley bus (%)
Means of transportation to work - Streetcar or trolley car (%)
Means of transportation to work - Subway or elevated (%)
Means of transportation to work - Railroad (%)
Means of transportation to work - Ferryboat (%)
Means of transportation to work - Taxicab (%)
Means of transportation to work - Motorcycle (%)
Means of transportation to work - Bicycle (%)
Means of transportation to work - Walked (%)
Means of transportation to work - Other means (%)
Working at home (%)
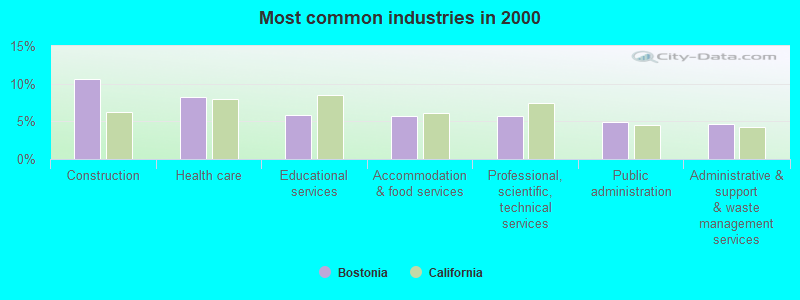
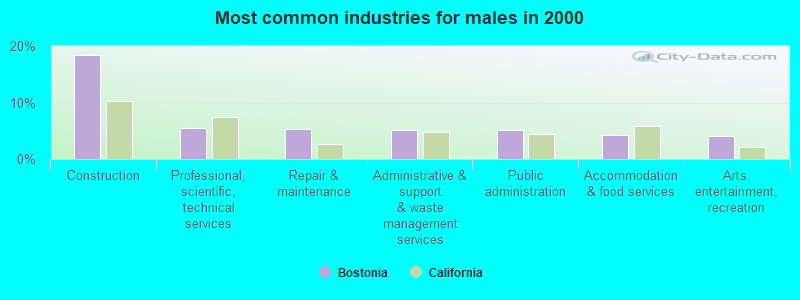
Industry diversity
Most Common Industries - Agriculture, forestry, fishing and hunting, and mining (%)
Most Common Industries - Agriculture, forestry, fishing and hunting (%)
Most Common Industries - Mining, quarrying, and oil and gas extraction (%)
Most Common Industries - Construction (%)
Most Common Industries - Manufacturing (%)
Most Common Industries - Wholesale trade (%)
Most Common Industries - Retail trade (%)
Most Common Industries - Transportation and warehousing, and utilities (%)
Most Common Industries - Transportation and warehousing (%)
Most Common Industries - Utilities (%)
Most Common Industries - Information (%)
Most Common Industries - Finance and insurance, and real estate and rental and leasing (%)
Most Common Industries - Finance and insurance (%)
Most Common Industries - Real estate and rental and leasing (%)
Most Common Industries - Professional, scientific, and management, and administrative and waste management services (%)
Most Common Industries - Professional, scientific, and technical services (%)
Most Common Industries - Management of companies and enterprises (%)
Most Common Industries - Administrative and support and waste management services (%)
Most Common Industries - Educational services, and health care and social assistance (%)
Most Common Industries - Educational services (%)
Most Common Industries - Health care and social assistance (%)
Most Common Industries - Arts, entertainment, and recreation, and accommodation and food services (%)
Most Common Industries - Arts, entertainment, and recreation (%)
Most Common Industries - Accommodation and food services (%)
Most Common Industries - Other services, except public administration (%)
Most Common Industries - Public administration (%)
Occupation diversity
Most Common Occupations - Management, business, science, and arts occupations (%)
Most Common Occupations - Management, business, and financial occupations (%)
Most Common Occupations - Management occupations (%)
Most Common Occupations - Business and financial operations occupations (%)
Most Common Occupations - Computer, engineering, and science occupations (%)
Most Common Occupations - Computer and mathematical occupations (%)
Most Common Occupations - Architecture and engineering occupations (%)
Most Common Occupations - Life, physical, and social science occupations (%)
Most Common Occupations - Education, legal, community service, arts, and media occupations (%)
Most Common Occupations - Community and social service occupations (%)
Most Common Occupations - Legal occupations (%)
Most Common Occupations - Education, training, and library occupations (%)
Most Common Occupations - Arts, design, entertainment, sports, and media occupations (%)
Most Common Occupations - Healthcare practitioners and technical occupations (%)
Most Common Occupations - Health diagnosing and treating practitioners and other technical occupations (%)
Most Common Occupations - Health technologists and technicians (%)
Most Common Occupations - Service occupations (%)
Most Common Occupations - Healthcare support occupations (%)
Most Common Occupations - Protective service occupations (%)
Most Common Occupations - Fire fighting and prevention, and other protective service workers including supervisors (%)
Most Common Occupations - Law enforcement workers including supervisors (%)
Most Common Occupations - Food preparation and serving related occupations (%)
Most Common Occupations - Building and grounds cleaning and maintenance occupations (%)
Most Common Occupations - Personal care and service occupations (%)
Most Common Occupations - Sales and office occupations (%)
Most Common Occupations - Sales and related occupations (%)
Most Common Occupations - Office and administrative support occupations (%)
Most Common Occupations - Natural resources, construction, and maintenance occupations (%)
Most Common Occupations - Farming, fishing, and forestry occupations (%)
Most Common Occupations - Construction and extraction occupations (%)
Most Common Occupations - Installation, maintenance, and repair occupations (%)
Most Common Occupations - Production, transportation, and material moving occupations (%)
Most Common Occupations - Production occupations (%)
Most Common Occupations - Transportation occupations (%)
Most Common Occupations - Material moving occupations (%)
People in Group quarters - Institutionalized population (%)
People in Group quarters - Correctional institutions (%)
People in Group quarters - Federal prisons and detention centers (%)
People in Group quarters - Halfway houses (%)
People in Group quarters - Local jails and other confinement facilities (including police lockups) (%)
People in Group quarters - Military disciplinary barracks (%)
People in Group quarters - State prisons (%)
People in Group quarters - Other types of correctional institutions (%)
People in Group quarters - Nursing homes (%)
People in Group quarters - Hospitals/wards, hospices, and schools for the handicapped (%)
People in Group quarters - Hospitals/wards and hospices for chronically ill (%)
People in Group quarters - Hospices or homes for chronically ill (%)
People in Group quarters - Military hospitals or wards for chronically ill (%)
People in Group quarters - Other hospitals or wards for chronically ill (%)
People in Group quarters - Hospitals or wards for drug/alcohol abuse (%)
People in Group quarters - Mental (Psychiatric) hospitals or wards (%)
People in Group quarters - Schools, hospitals, or wards for the mentally retarded (%)
People in Group quarters - Schools, hospitals, or wards for the physically handicapped (%)
People in Group quarters - Institutions for the deaf (%)
People in Group quarters - Institutions for the blind (%)
People in Group quarters - Orthopedic wards and institutions for the physically handicapped (%)
People in Group quarters - Wards in general hospitals for patients who have no usual home elsewhere (%)
People in Group quarters - Wards in military hospitals for patients who have no usual home elsewhere (%)
People in Group quarters - Juvenile institutions (%)
People in Group quarters - Long-term care (%)
People in Group quarters - Homes for abused, dependent, and neglected children (%)
People in Group quarters - Residential treatment centers for emotionally disturbed children (%)
People in Group quarters - Training schools for juvenile delinquents (%)
People in Group quarters - Short-term care, detention or diagnostic centers for delinquent children (%)
People in Group quarters - Type of juvenile institution unknown (%)
People in Group quarters - Noninstitutionalized population (%)
People in Group quarters - College dormitories (includes college quarters off campus) (%)
People in Group quarters - Military quarters (%)
People in Group quarters - On base (%)
People in Group quarters - Barracks, unaccompanied personnel housing (UPH), (Enlisted/Officer), ;and similar group living quarters for military personnel (%)
People in Group quarters - Transient quarters for temporary residents (%)
People in Group quarters - Military ships (%)
People in Group quarters - Group homes (%)
People in Group quarters - Homes or halfway houses for drug/alcohol abuse (%)
People in Group quarters - Homes for the mentally ill (%)
People in Group quarters - Homes for the mentally retarded (%)
People in Group quarters - Homes for the physically handicapped (%)
People in Group quarters - Other group homes (%)
People in Group quarters - Religious group quarters (%)
People in Group quarters - Dormitories (%)
People in Group quarters - Agriculture workers' dormitories on farms (%)
People in Group quarters - Job Corps and vocational training facilities (%)
People in Group quarters - Other workers' dormitories (%)
People in Group quarters - Crews of maritime vessels (%)
People in Group quarters - Other nonhousehold living situations (%)
People in Group quarters - Other noninstitutional group quarters (%)
Residents speaking English at home (%)
Residents speaking English at home - Born in the United States (%)
Residents speaking English at home - Native, born elsewhere (%)
Residents speaking English at home - Foreign born (%)
Residents speaking Spanish at home (%)
Residents speaking Spanish at home - Born in the United States (%)
Residents speaking Spanish at home - Native, born elsewhere (%)
Residents speaking Spanish at home - Foreign born (%)
Residents speaking other language at home (%)
Residents speaking other language at home - Born in the United States (%)
Residents speaking other language at home - Native, born elsewhere (%)
Residents speaking other language at home - Foreign born (%)
Class of Workers - Employee of private company (%)
Class of Workers - Self-employed in own incorporated business (%)
Class of Workers - Private not-for-profit wage and salary workers (%)
Class of Workers - Local government workers (%)
Class of Workers - State government workers (%)
Class of Workers - Federal government workers (%)
Class of Workers - Self-employed workers in own not incorporated business and Unpaid family workers (%)
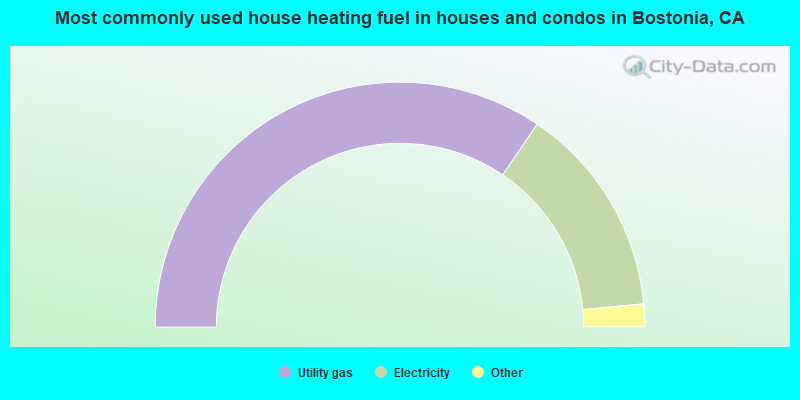
House heating fuel used in houses and condos - Utility gas (%)
House heating fuel used in houses and condos - Bottled, tank, or LP gas (%)
House heating fuel used in houses and condos - Electricity (%)
House heating fuel used in houses and condos - Fuel oil, kerosene, etc. (%)
House heating fuel used in houses and condos - Coal or coke (%)
House heating fuel used in houses and condos - Wood (%)
House heating fuel used in houses and condos - Solar energy (%)
House heating fuel used in houses and condos - Other fuel (%)
House heating fuel used in houses and condos - No fuel used (%)
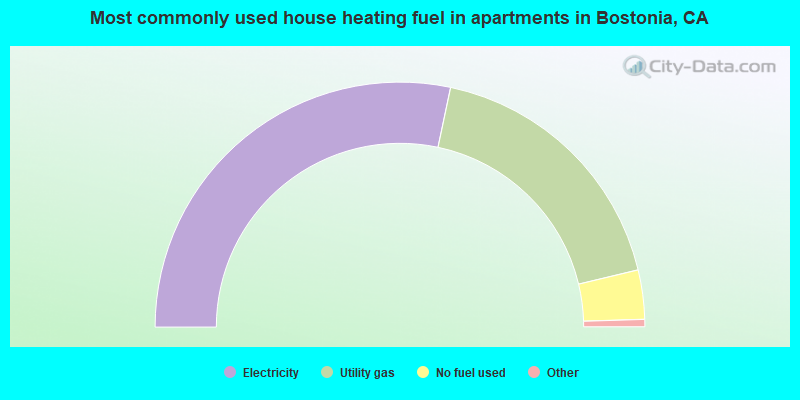
House heating fuel used in apartments - Utility gas (%)
House heating fuel used in apartments - Bottled, tank, or LP gas (%)
House heating fuel used in apartments - Electricity (%)
House heating fuel used in apartments - Fuel oil, kerosene, etc. (%)
House heating fuel used in apartments - Coal or coke (%)
House heating fuel used in apartments - Wood (%)
House heating fuel used in apartments - Solar energy (%)
House heating fuel used in apartments - Other fuel (%)
House heating fuel used in apartments - No fuel used (%)
Armed forces status - In Armed Forces (%)
Armed forces status - Civilian (%)
Armed forces status - Civilian - Veteran (%)
Armed forces status - Civilian - Nonveteran (%)
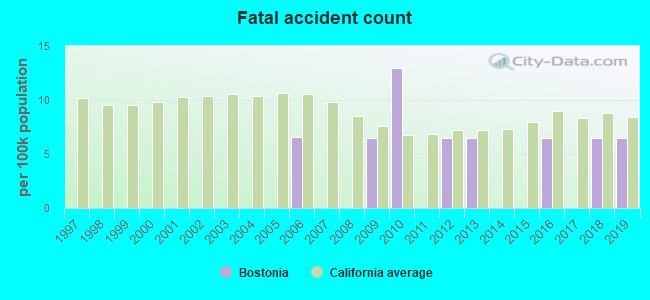
Fatal accidents locations in years 2005-2021
Fatal accidents locations in 2005
Fatal accidents locations in 2006
Fatal accidents locations in 2007
Fatal accidents locations in 2008
Fatal accidents locations in 2009
Fatal accidents locations in 2010
Fatal accidents locations in 2011
Fatal accidents locations in 2012
Fatal accidents locations in 2013
Fatal accidents locations in 2014
Fatal accidents locations in 2015
Fatal accidents locations in 2016
Fatal accidents locations in 2017
Fatal accidents locations in 2018
Fatal accidents locations in 2019
Fatal accidents locations in 2020
Fatal accidents locations in 2021
Alcohol use - People drinking some alcohol every month (%)
Alcohol use - People not drinking at all (%)
Alcohol use - Average days/month drinking alcohol
Alcohol use - Average drinks/week
Alcohol use - Average days/year people drink much
Audiometry - Average condition of hearing (%)
Audiometry - People that can hear a whisper from across a quiet room (%)
Audiometry - People that can hear normal voice from across a quiet room (%)
Audiometry - Ears ringing, roaring, buzzing (%)
Audiometry - Had a job exposure to loud noise (%)
Audiometry - Had off-work exposure to loud noise (%)
Blood Pressure & Cholesterol - Has high blood pressure (%)
Blood Pressure & Cholesterol - Checking blood pressure at home (%)
Blood Pressure & Cholesterol - Frequently checking blood cholesterol (%)
Blood Pressure & Cholesterol - Has high cholesterol level (%)
Consumer Behavior - Money monthly spent on food at supermarket/grocery store
Consumer Behavior - Money monthly spent on food at other stores
Consumer Behavior - Money monthly spent on eating out
Consumer Behavior - Money monthly spent on carryout/delivered foods
Consumer Behavior - Income spent on food at supermarket/grocery store (%)
Consumer Behavior - Income spent on food at other stores (%)
Consumer Behavior - Income spent on eating out (%)
Consumer Behavior - Income spent on carryout/delivered foods (%)
Current Health Status - General health condition (%)
Current Health Status - Blood donors (%)
Current Health Status - Has blood ever tested for HIV virus (%)
Current Health Status - Left-handed people (%)
Dermatology - People using sunscreen (%)
Diabetes - Diabetics (%)
Diabetes - Had a blood test for high blood sugar (%)
Diabetes - People taking insulin (%)
Diet Behavior & Nutrition - Diet health (%)
Diet Behavior & Nutrition - Milk product consumption (# of products/month)
Diet Behavior & Nutrition - Meals not home prepared (#/week)
Diet Behavior & Nutrition - Meals from fast food or pizza place (#/week)
Diet Behavior & Nutrition - Ready-to-eat foods (#/month)
Diet Behavior & Nutrition - Frozen meals/pizza (#/month)
Drug Use - People that ever used marijuana or hashish (%)
Drug Use - Ever used hard drugs (%)
Drug Use - Ever used any form of cocaine (%)
Drug Use - Ever used heroin (%)
Drug Use - Ever used methamphetamine (%)
Health Insurance - People covered by health insurance (%)
Kidney Conditions-Urology - Avg. # of times urinating at night
Medical Conditions - People with asthma (%)
Medical Conditions - People with anemia (%)
Medical Conditions - People with psoriasis (%)
Medical Conditions - People with overweight (%)
Medical Conditions - Elderly people having difficulties in thinking or remembering (%)
Medical Conditions - People who ever received blood transfusion (%)
Medical Conditions - People having trouble seeing even with glass/contacts (%)
Medical Conditions - People with arthritis (%)
Medical Conditions - People with gout (%)
Medical Conditions - People with congestive heart failure (%)
Medical Conditions - People with coronary heart disease (%)
Medical Conditions - People with angina pectoris (%)
Medical Conditions - People who ever had heart attack (%)
Medical Conditions - People who ever had stroke (%)
Medical Conditions - People with emphysema (%)
Medical Conditions - People with thyroid problem (%)
Medical Conditions - People with chronic bronchitis (%)
Medical Conditions - People with any liver condition (%)
Medical Conditions - People who ever had cancer or malignancy (%)
Mental Health - People who have little interest in doing things (%)
Mental Health - People feeling down, depressed, or hopeless (%)
Mental Health - People who have trouble sleeping or sleeping too much (%)
Mental Health - People feeling tired or having little energy (%)
Mental Health - People with poor appetite or overeating (%)
Mental Health - People feeling bad about themself (%)
Mental Health - People who have trouble concentrating on things (%)
Mental Health - People moving or speaking slowly or too fast (%)
Mental Health - People having thoughts they would be better off dead (%)
Oral Health - Average years since last visit a dentist
Oral Health - People embarrassed because of mouth (%)
Oral Health - People with gum disease (%)
Oral Health - General health of teeth and gums (%)
Oral Health - Average days a week using dental floss/device
Oral Health - Average days a week using mouthwash for dental problem
Oral Health - Average number of teeth
Pesticide Use - Households using pesticides to control insects (%)
Pesticide Use - Households using pesticides to kill weeds (%)
Physical Activity - People doing vigorous-intensity work activities (%)
Physical Activity - People doing moderate-intensity work activities (%)
Physical Activity - People walking or bicycling (%)
Physical Activity - People doing vigorous-intensity recreational activities (%)
Physical Activity - People doing moderate-intensity recreational activities (%)
Physical Activity - Average hours a day doing sedentary activities
Physical Activity - Average hours a day watching TV or videos
Physical Activity - Average hours a day using computer
Physical Functioning - People having limitations keeping them from working (%)
Physical Functioning - People limited in amount of work they can do (%)
Physical Functioning - People that need special equipment to walk (%)
Physical Functioning - People experiencing confusion/memory problems (%)
Physical Functioning - People requiring special healthcare equipment (%)
Prescription Medications - Average number of prescription medicines taking
Preventive Aspirin Use - Adults 40+ taking low-dose aspirin (%)
Reproductive Health - Vaginal deliveries (%)
Reproductive Health - Cesarean deliveries (%)
Reproductive Health - Deliveries resulted in a live birth (%)
Reproductive Health - Pregnancies resulted in a delivery (%)
Reproductive Health - Women breastfeeding newborns (%)
Reproductive Health - Women that had a hysterectomy (%)
Reproductive Health - Women that had both ovaries removed (%)
Reproductive Health - Women that have ever taken birth control pills (%)
Reproductive Health - Women taking birth control pills (%)
Reproductive Health - Women that have ever used Depo-Provera or injectables (%)
Reproductive Health - Women that have ever used female hormones (%)
Sexual Behavior - People 18+ that ever had sex (vaginal, anal, or oral) (%)
Sexual Behavior - Males 18+ that ever had vaginal sex with a woman (%)
Sexual Behavior - Males 18+ that ever performed oral sex on a woman (%)
Sexual Behavior - Males 18+ that ever had anal sex with a woman (%)
Sexual Behavior - Males 18+ that ever had any sex with a man (%)
Sexual Behavior - Females 18+ that ever had vaginal sex with a man (%)
Sexual Behavior - Females 18+ that ever performed oral sex on a man (%)
Sexual Behavior - Females 18+ that ever had anal sex with a man (%)
Sexual Behavior - Females 18+ that ever had any kind of sex with a woman (%)
Sexual Behavior - Average age people first had sex
Sexual Behavior - Average number of female sex partners in lifetime (males 18+)
Sexual Behavior - Average number of female vaginal sex partners in lifetime (males 18+)
Sexual Behavior - Average age people first performed oral sex on a woman (18+)
Sexual Behavior - Average number of woman performed oral sex on in lifetime (18+)
Sexual Behavior - Average number of male sex partners in lifetime (males 18+)
Sexual Behavior - Average number of male anal sex partners in lifetime (males 18+)
Sexual Behavior - Average age people first performed oral sex on a man (18+)
Sexual Behavior - Average number of male oral sex partners in lifetime (18+)
Sexual Behavior - People using protection when performing oral sex (%)
Sexual Behavior - Average number of times people have vaginal or anal sex a year
Sexual Behavior - People having sex without condom (%)
Sexual Behavior - Average number of male sex partners in lifetime (females 18+)
Sexual Behavior - Average number of male vaginal sex partners in lifetime (females 18+)
Sexual Behavior - Average number of female sex partners in lifetime (females 18+)
Sexual Behavior - Circumcised males 18+ (%)
Sleep Disorders - Average hours sleeping at night
Sleep Disorders - People that has trouble sleeping (%)
Smoking-Cigarette Use - People smoking cigarettes (%)
Taste & Smell - People 40+ having problems with smell (%)
Taste & Smell - People 40+ having problems with taste (%)
Taste & Smell - People 40+ that ever had wisdom teeth removed (%)
Taste & Smell - People 40+ that ever had tonsils teeth removed (%)
Taste & Smell - People 40+ that ever had a loss of consciousness because of a head injury (%)
Taste & Smell - People 40+ that ever had a broken nose or other serious injury to face or skull (%)
Taste & Smell - People 40+ that ever had two or more sinus infections (%)
Weight - Average height (inches)
Weight - Average weight (pounds)
Weight - Average BMI
Weight - People that are obese (%)
Weight - People that ever were obese (%)
Weight - People trying to lose weight (%)
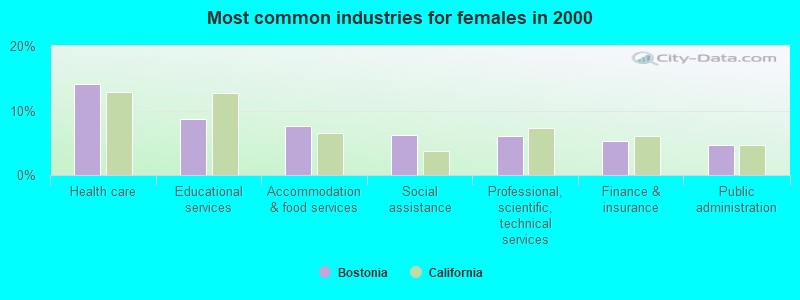
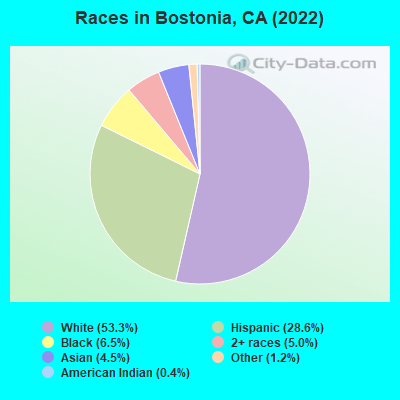
8,940 53.3% White alone 4,805 28.6% Hispanic 1,083 6.5% Black alone 835 5.0% Two or more races 751 4.5% Asian alone 198 1.2% Other race alone 60 0.4% American Indian alone
Latest news from Bostonia, CA collected exclusively by city-data.com from local newspapers, TV, and radio stations
Ancestries: American (9.4%), German (5.5%), Iraqi (5.0%), Italian (4.1%), European (3.9%), Irish (3.4%).
Current Local Time:
Land area: 1.94 square miles.
Population density: 7,918 people per square mile (high).
3,270 residents are foreign born (9.3% Latin America , 7.4% Asia , 2.4% Europe ).
This place:
19.5%California:
26.5%
Median real estate property taxes paid for housing units with mortgages in 2022: $3,576 (0.5%)Median real estate property taxes paid for housing units with no mortgage in 2022: $1,478 (0.9%)
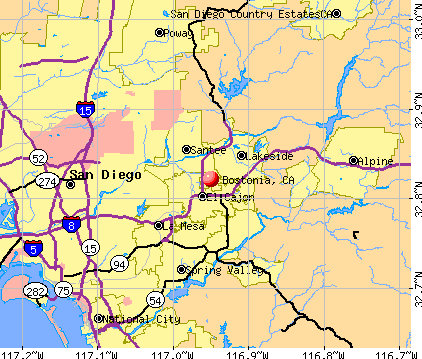
Nearest city with pop. 50,000+: El Cajon, CA
Nearest city with pop. 200,000+: San Diego, CA
Nearest cities:
Latitude: 32.82 N, Longitude: 116.95 W
Daytime population change due to commuting: -5,403 (-32.2%)Workers who live and work in this place: 1,037 (12.9%)
Area code commonly used in this area: 619
Unemployment in December 2023:
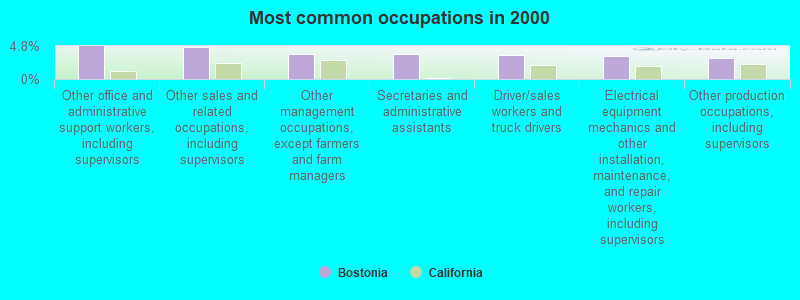
Most common occupations in Bostonia, CA (%)
Both Males Females
Other office and administrative support workers, including supervisors (4.7%)
Other sales and related occupations, including supervisors (4.7%)
Other management occupations, except farmers and farm managers (3.7%)
Secretaries and administrative assistants (3.6%)
Driver/sales workers and truck drivers (3.4%)
Electrical equipment mechanics and other installation, maintenance, and repair workers, including supervisors (3.4%)
Other production occupations, including supervisors (3.1%)
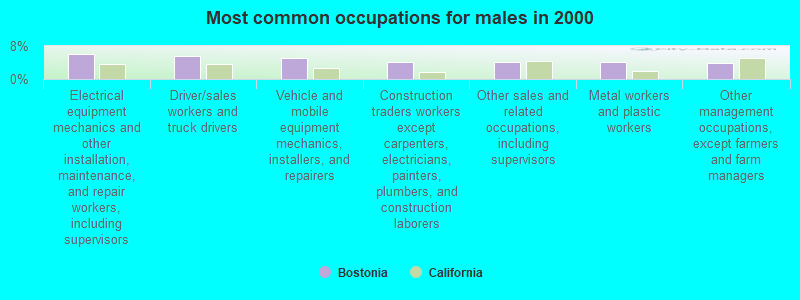
Electrical equipment mechanics and other installation, maintenance, and repair workers, including supervisors (6.2%)
Driver/sales workers and truck drivers (5.6%)
Vehicle and mobile equipment mechanics, installers, and repairers (5.0%)
Construction traders workers except carpenters, electricians, painters, plumbers, and construction laborers (4.2%)
Other sales and related occupations, including supervisors (4.1%)
Metal workers and plastic workers (4.0%)
Other management occupations, except farmers and farm managers (3.9%)
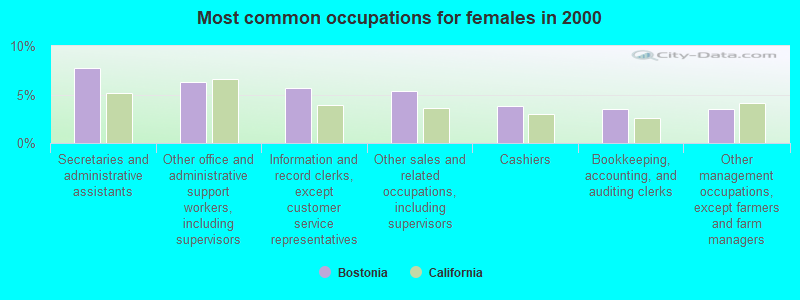
Secretaries and administrative assistants (7.8%)
Other office and administrative support workers, including supervisors (6.2%)
Information and record clerks, except customer service representatives (5.6%)
Other sales and related occupations, including supervisors (5.4%)
Cashiers (3.8%)
Bookkeeping, accounting, and auditing clerks (3.5%)
Other management occupations, except farmers and farm managers (3.5%)
Earthquake activity:
Bostonia-area historical earthquake activity is significantly above California state average. It is 5828% greater than the overall U.S. average. On 6/28/1992 at 11:57:34, a magnitude 7.6 (6.2 MB, 7.6 MS, 7.3 MW, Depth: 0.7 mi, Class: Major, Intensity: VIII - XII) earthquake occurred 97.3 miles away from the city center, causing 3 deaths ( 1 shaking deaths, 2 other deaths) and 400 injuries, causing $100,000,000 total damage and $40,000,000 insured lossesOn 7/21/1952 at 11:52:14, a magnitude 7.7 (7.7 UK) earthquake occurred 191.2 miles away from Bostonia center, causing $50,000,000 total damage On 10/16/1999 at 09:46:44, a magnitude 7.4 (6.3 MB, 7.4 MS, 7.2 MW, 7.3 ML) earthquake occurred 120.8 miles away from the city center On 5/19/1940 at 04:36:40, a magnitude 7.2 (7.2 UK) earthquake occurred 77.8 miles away from the city center, causing $33,000,000 total damage On 12/31/1934 at 18:45:56, a magnitude 7.1 (7.1 UK) earthquake occurred 69.8 miles away from Bostonia center On 10/15/1979 at 23:16:54, a magnitude 7.0 (5.7 MB, 6.9 MS, 7.0 ML, 6.4 MW) earthquake occurred 76.2 miles away from the city center Magnitude types: body-wave magnitude (MB), local magnitude (ML), surface-wave magnitude (MS), moment magnitude (MW) Natural disasters: The number of natural disasters in San Diego County (39) is a lot greater than the US average (15).Major Disasters (Presidential) Declared: 21Emergencies Declared: 2Fires: 21, Floods: 17, Storms: 9, Winter Storms: 6, Landslides: 5, Mudslides: 4, Freeze: 1, Heavy Rain: 1, Hurricane: 1, Tornado: 1, Other: 1 (Note: some incidents may be assigned to more than one category). Hospitals and medical centers near Bostonia: THE BRADLEY COURT (Nursing Home, about 1 miles away; EL CAJON, CA)
THE ROYAL HOME (Nursing Home, about 2 miles away; EL CAJON, CA)
PROFESSIONAL SURGICAL CTR (Hospital, about 2 miles away; EL CAJON, CA)
GRANITE HILLS HEALTHCARE AND WELLNESS CENTRE, LLC (Nursing Home, about 2 miles away; EL CAJON, CA)
COUNTRY HILLS HEALTH CARE (Nursing Home, about 2 miles away; EL CAJON, CA)
COTTONWOOD CANYON HEALTHCARE CENTER (Nursing Home, about 2 miles away; EL CAJON, CA)
SCRIPPS HOSPITAL-EAST COUNTY SNF/DP (Nursing Home, about 2 miles away; EL CAJON, CA)
Amtrak station near Bostonia: 15 miles: SAN DIEGO (1050 KETTNER BLVD.) Services: ticket office, fully wheelchair accessible, enclosed waiting area, public restrooms, public payphones, full-service food facilities, paid short-term parking, paid long-term parking, call for car rental service, taxi stand, public transit connection.
Colleges/universities with over 2000 students nearest to Bostonia:
Grossmont College (about 4 miles; El Cajon, CA ; Full-time enrollment: 10,461)
Cuyamaca College (about 6 miles; El Cajon, CA ; FT enrollment: 4,270)
San Diego State University (about 8 miles; San Diego, CA ; FT enrollment: 27,516)
Alliant International University (about 10 miles; San Diego, CA ; FT enrollment: 3,155)
University of Phoenix-San Diego Campus (about 10 miles; San Diego, CA ; FT enrollment: 5,159)
San Diego Miramar College (about 12 miles; San Diego, CA ; FT enrollment: 5,128)
The Art Institute of California-Argosy University San Diego (about 13 miles; San Diego, CA ; FT enrollment: 2,180)
San Diego County has a predicted average indoor radon screening level less than 2 pCi/L (pico curies per liter) - Low Potential Average household size: This place:
2.7 peopleCalifornia:
2.9 people
Percentage of family households: This place:
67.5%Whole state:
68.7%
Percentage of households with unmarried partners: This place:
8.3%Whole state:
7.2%
Likely homosexual households (counted as self-reported same-sex unmarried-partner households)
Lesbian couples: 0.6% of all households Gay men: 0.3% of all households
People in group quarters in Bostonia in 2010:
52 people in nursing facilities/skilled-nursing facilities
45 people in group homes intended for adults
10 people in workers' group living quarters and job corps centers
People in group quarters in Bostonia in 2000:
53 people in nursing homes
19 people in homes for the mentally retarded
15 people in other noninstitutional group quarters
8 people in other group homes
6 people in homes for the mentally ill
For population 15 years and over in Bostonia:
Never married: 36.3%Now married: 42.8%Separated: 2.2%Widowed: 6.4%Divorced: 12.3% For population 25 years and over in Bostonia:
High school or higher: 87.8%Bachelor's degree or higher: 21.6%Graduate or professional degree: 5.2%Unemployed: 7.6%Mean travel time to work (commute): 21.6 minutes
Education Gini index (Inequality in education) Here:
12.4California average:
15.5
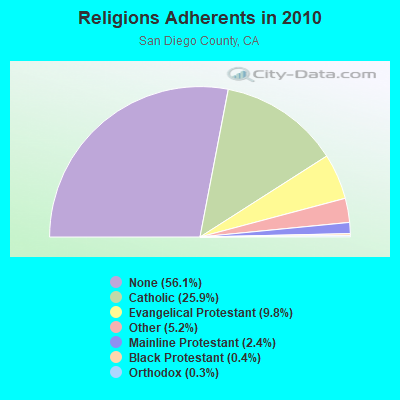
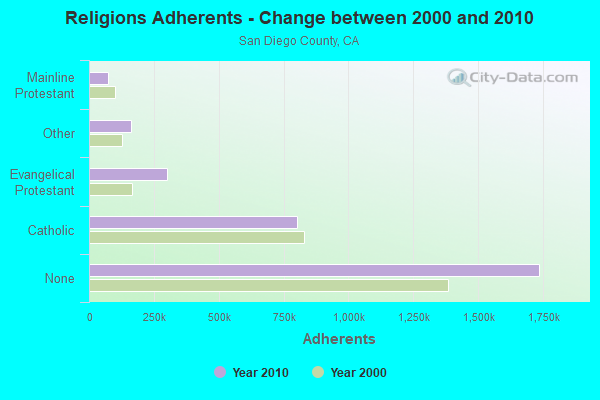
Religion statistics for Bostonia, CA (based on San Diego County data)
Religion Adherents Congregations Catholic 801,850 115 Evangelical Protestant 302,320 974 Other 161,530 349 Mainline Protestant 74,992 211 Black Protestant 10,857 52 Orthodox 7,828 19 None 1,735,936 -
Source: Clifford Grammich, Kirk Hadaway, Richard Houseal, Dale E.Jones, Alexei Krindatch, Richie Stanley and Richard H.Taylor. 2012. 2010 U.S.Religion Census: Religious Congregations & Membership Study. Association of Statisticians of American Religious Bodies. Jones, Dale E., et al. 2002. Congregations and Membership in the United States 2000. Nashville, TN: Glenmary Research Center. Graphs represent county-level data
Food Environment Statistics: Number of grocery stores : 574San Diego County :
1.94 / 10,000 pop.California :
2.14 / 10,000 pop.
Number of supercenters and club stores : 17This county :
0.06 / 10,000 pop.California :
0.04 / 10,000 pop.
Number of convenience stores (no gas) : 227Here :
0.77 / 10,000 pop.California :
0.62 / 10,000 pop.
Number of convenience stores (with gas) : 487San Diego County :
1.65 / 10,000 pop.California :
1.49 / 10,000 pop.
Number of full-service restaurants : 2,238San Diego County :
7.56 / 10,000 pop.California :
7.42 / 10,000 pop.
Adult diabetes rate : This county :
6.5%California :
7.3%
Adult obesity rate : This county :
22.2%California :
21.3%
Low-income preschool obesity rate : San Diego County :
16.0%California :
17.9%
Health and Nutrition: Healthy diet rate : This city:
47.9%State:
49.4%
Average overall health of teeth and gums : This city:
45.2%California:
48.0%
Average BMI : Bostonia:
28.6California:
28.1
People feeling badly about themselves : Bostonia:
21.7%State:
20.2%
People not drinking alcohol at all : Bostonia:
11.3%State:
11.2%
Average hours sleeping at night : This city:
6.8California:
6.8
Overweight people : This city:
32.2%State:
31.5%
General health condition : Bostonia:
55.4%California:
56.4%
Average condition of hearing : Bostonia:
79.1%California:
80.9%
More about Health and Nutrition of Bostonia, CA Residents
5.18% of this county's 2021 resident taxpayers lived in other counties in 2020 ($90,734 average adjusted gross income )
Here:
5.18%California average:
5.19%
0.14% of residents moved from foreign countries ($1,493 average AGI )San Diego County:
0.14%California average:
0.03%
Top counties from which taxpayers relocated into this county between 2020 and 2021:
5.71% of this county's 2020 resident taxpayers moved to other counties in 2021 ($83,556 average adjusted gross income )
Here:
5.71%California average:
6.14%
0.09% of residents moved to foreign countries ($1,067 average AGI )San Diego County:
0.09%California average:
0.02%
Top counties to which taxpayers relocated from this county between 2020 and 2021: Strongest AM radio stations in Bostonia:
KCBQ (1170 AM; 50 kW; SAN DIEGO, CA; Owner: RADIO 1210, INC.)
KFMB (760 AM; 50 kW; SAN DIEGO, CA; Owner: MIDWEST TELEVISION, INC.)
KSDO (1130 AM; 10 kW; SAN DIEGO, CA; Owner: HI-FAVOR BROADCASTING, LLC)
KECR (910 AM; 5 kW; EL CAJON, CA; Owner: FAMILY STATIONS, INC.)
KOGO (600 AM; 5 kW; SAN DIEGO, CA; Owner: CITICASTERS LICENSES, L.P.)
KPOP (1360 AM; 5 kW; SAN DIEGO, CA; Owner: CITICASTERS LICENSES, L.P.)
KPRZ (1210 AM; 20 kW; SAN MARCOS, CA; Owner: RADIO 1210, INC.)
KURS (1040 AM; 5 kW; SAN DIEGO, CA; Owner: QUETZAL BILINGUAL COMMUNICATIONS INC)
KFI (640 AM; 50 kW; LOS ANGELES, CA; Owner: CAPSTAR TX LIMITED PARTNERSHIP)
KPLS (830 AM; 50 kW; ORANGE, CA; Owner: CRN LICENSES, LLC)
KLAC (570 AM; 50 kW; LOS ANGELES, CA; Owner: AMFM RADIO LICENSES, L.L.C.)
KSON (1240 AM; 1 kW; SAN DIEGO, CA; Owner: JEFFERSON-PILOT COMMUNICATIONS COMPANY OF CALIFORNIA)
KTNQ (1020 AM; 50 kW; LOS ANGELES, CA; Owner: KTNQ-AM LICENSE CORP.)
Strongest FM radio stations in Bostonia:
KPBS-FM (89.5 FM; SAN DIEGO, CA; Owner: THE BD. OF TRUSTEES, CALIFORNIA STATE UNIVERSITY)
KGB-FM (101.5 FM; SAN DIEGO, CA; Owner: CITICASTERS LICENSES, L.P.)
KSON-FM (97.3 FM; SAN DIEGO, CA; Owner: JEFFERSON-PILOT COMMUNICATIONS COMPANY OF CALIFORNIA)
KHTS-FM (93.3 FM; EL CAJON, CA; Owner: CITICASTERS LICENSES, L.P.)
K210CL (89.9 FM; LEMON GROVE, CA; Owner: SANTA MONICA COMMUNITY COLLEGE DISTRICT)
KLNV (106.5 FM; SAN DIEGO, CA; Owner: HBC LICENSE CORPORATION)
KLQV (102.9 FM; SAN DIEGO, CA; Owner: HBC LICENSE CORPORATION)
KIOZ (105.3 FM; SAN DIEGO, CA; Owner: CITICASTERS LICENSES, L.P.)
KLVJ (100.1 FM; JULIAN, CA; Owner: EDUCATIONAL MEDIA FOUNDATION)
KWVE (107.9 FM; SAN CLEMENTE, CA; Owner: CALVARY CHAPEL OF COSTA MESA)
KRTM (88.9 FM; TEMECULA, CA; Owner: PENFOLD COMMUNICATIONS, INC.)
KBZT (94.9 FM; SAN DIEGO, CA; Owner: JEFFERSON-PILOT COMMUNICATIONS COMPANY OF CALIFORNIA)
KFSD-FM (92.1 FM; ESCONDIDO, CA; Owner: NORTH COUNTY BROADCASTING CORP.)
KIFM (98.1 FM; SAN DIEGO, CA; Owner: JEFFERSON-PILOT COMMUNICATIONS COMPANY OF CALIFORNIA)
KYXY (96.5 FM; SAN DIEGO, CA; Owner: INFINITY RADIO OPERATIONS INC.)
KOCL (95.7 FM; CARLSBAD, CA; Owner: CITICASTERS LICENSES, L.P.)
KFMB-FM (100.7 FM; SAN DIEGO, CA; Owner: MIDWEST TELEVISION, INC.)
KMYI (94.1 FM; SAN DIEGO, CA; Owner: CITICASTERS LICENSES, L.P.)
KPLN (103.7 FM; SAN DIEGO, CA; Owner: INFINITY RADIO OPERATIONS INC.)
KPRI (102.1 FM; ENCINITAS, CA; Owner: COMPASS RADIO OF SAN DIEGO, INC.)
TV broadcast stations around Bostonia:
KBOP-LP (Channel 25; SAN DIEGO, CA; Owner: COMMERCIAL BROADCASTING CORP.)
K63EN (Channel 63; SAN DIEGO, CA; Owner: CIVIC LIGHT, INC.)
KBNT-CA (Channel 17; SAN DIEGO, CA; Owner: ENTRAVISION HOLDINGS, L.L.C.)
K61GH (Channel 61; NATIONAL CITY, CA; Owner: TV-61 SAN DIEGO, INC.)
KSWB-TV (Channel 69; SAN DIEGO, CA; Owner: KSWB INC.)
KPBS (Channel 15; SAN DIEGO, CA; Owner: BOARD OF TRUSTEES FOR SAN DIEGO UNIV.)
KUSI-TV (Channel 51; SAN DIEGO, CA; Owner: CHANNEL 51 OF SAN DIEGO, INC.)
KNSD (Channel 39; SAN DIEGO, CA; Owner: STATION VENTURE OPERATIONS, LP)
KFMB-TV (Channel 8; SAN DIEGO, CA; Owner: MIDWEST TELEVISION, INC.)
KGTV (Channel 10; SAN DIEGO, CA; Owner: MCGRAW-HILL BROADCASTING COMPANY, INC.)
K59AL (Channel 59; LA JOLLA, CA; Owner: BOARD OF TRUSTEES FOR SAN DIEGO UNIVERSITY)
KZDF-LP (Channel 41; SAN DIEGO, CA; Owner: LAURIE MINTZ)
KSDX-LP (Channel 29; SAN DIEGO, CA; Owner: KRCA LICENSE CORP.)
KSKT-CA (Channel 43; SAN MARCOS, CA; Owner: BLUE SKIES BROADCASTING CORPORATION)
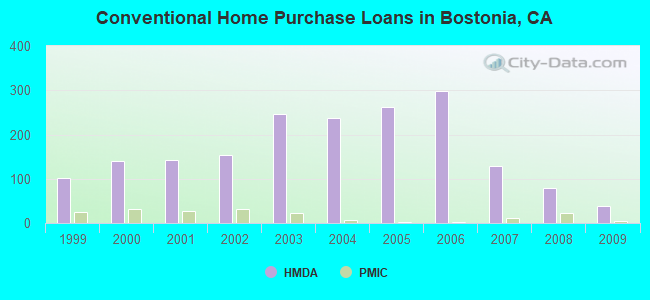
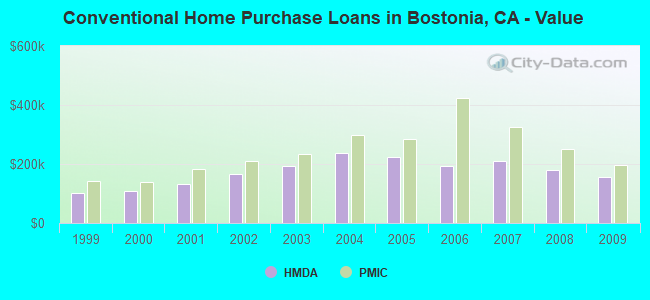
Home Mortgage Disclosure Act Aggregated Statistics For Year 2009(Based on 4 partial tracts) A) FHA, FSA/RHS & VA B) Conventional C) Refinancings D) Home Improvement Loans F) Non-occupant Loans on G) Loans On Manufactured Number Average Value Number Average Value Number Average Value Number Average Value Number Average Value Number Average Value
LOANS ORIGINATED 64 $246,912 39 $155,064 89 $236,015 4 $199,518 20 $149,160 2 $45,250 APPLICATIONS APPROVED, NOT ACCEPTED 12 $241,860 9 $129,340 10 $272,329 1 $8,580 3 $83,780 1 $43,040 APPLICATIONS DENIED 10 $257,679 16 $110,461 44 $265,223 5 $106,792 9 $135,466 5 $64,548 APPLICATIONS WITHDRAWN 8 $256,616 7 $165,476 22 $249,159 2 $110,325 4 $159,332 0 $0 FILES CLOSED FOR INCOMPLETENESS 2 $200,550 0 $0 7 $238,201 2 $57,945 1 $144,710 1 $11,880
Aggregated Statistics For Year 2008(Based on 4 partial tracts) A) FHA, FSA/RHS & VA B) Conventional C) Refinancings D) Home Improvement Loans E) Loans on Dwellings For 5+ Families F) Non-occupant Loans on G) Loans On Manufactured Number Average Value Number Average Value Number Average Value Number Average Value Number Average Value Number Average Value Number Average Value
LOANS ORIGINATED 46 $279,028 78 $178,643 55 $337,354 3 $133,550 7 $4,716,623 22 $182,970 3 $1,920,280 APPLICATIONS APPROVED, NOT ACCEPTED 7 $249,996 18 $188,058 18 $258,013 0 $0 0 $0 9 $261,720 6 $77,582 APPLICATIONS DENIED 13 $303,165 36 $200,379 73 $316,919 11 $63,997 0 $0 10 $204,446 10 $62,802 APPLICATIONS WITHDRAWN 7 $260,580 10 $140,606 20 $262,730 3 $111,943 0 $0 3 $151,400 0 $0 FILES CLOSED FOR INCOMPLETENESS 2 $240,160 1 $273,230 8 $328,802 3 $141,153 0 $0 1 $408,850 0 $0
Aggregated Statistics For Year 2007(Based on 4 partial tracts) A) FHA, FSA/RHS & VA B) Conventional C) Refinancings D) Home Improvement Loans E) Loans on Dwellings For 5+ Families F) Non-occupant Loans on G) Loans On Manufactured Number Average Value Number Average Value Number Average Value Number Average Value Number Average Value Number Average Value Number Average Value
LOANS ORIGINATED 8 $284,279 129 $211,281 167 $272,538 19 $158,333 5 $1,507,688 32 $257,964 8 $62,382 APPLICATIONS APPROVED, NOT ACCEPTED 0 $0 33 $213,401 45 $278,884 4 $114,600 0 $0 5 $243,728 6 $59,043 APPLICATIONS DENIED 2 $245,305 55 $284,191 172 $297,278 17 $178,965 0 $0 19 $337,772 11 $112,401 APPLICATIONS WITHDRAWN 1 $346,610 26 $216,434 61 $313,308 5 $199,472 0 $0 5 $258,720 2 $222,485 FILES CLOSED FOR INCOMPLETENESS 0 $0 7 $217,397 16 $280,005 2 $198,235 0 $0 4 $255,392 0 $0
Aggregated Statistics For Year 2006(Based on 4 partial tracts) A) FHA, FSA/RHS & VA B) Conventional C) Refinancings D) Home Improvement Loans E) Loans on Dwellings For 5+ Families F) Non-occupant Loans on G) Loans On Manufactured Number Average Value Number Average Value Number Average Value Number Average Value Number Average Value Number Average Value Number Average Value
LOANS ORIGINATED 11 $218,646 298 $192,804 282 $274,542 27 $177,014 7 $1,934,483 55 $273,380 4 $70,288 APPLICATIONS APPROVED, NOT ACCEPTED 0 $0 57 $200,766 59 $291,829 6 $243,343 0 $0 7 $317,263 13 $82,942 APPLICATIONS DENIED 0 $0 77 $257,387 175 $298,612 22 $193,448 0 $0 22 $318,412 9 $82,472 APPLICATIONS WITHDRAWN 1 $176,930 38 $245,511 125 $301,562 6 $164,312 0 $0 12 $261,794 0 $0 FILES CLOSED FOR INCOMPLETENESS 0 $0 12 $276,878 20 $307,882 2 $90,460 0 $0 2 $493,900 0 $0
Aggregated Statistics For Year 2005(Based on 4 partial tracts) A) FHA, FSA/RHS & VA B) Conventional C) Refinancings D) Home Improvement Loans E) Loans on Dwellings For 5+ Families F) Non-occupant Loans on G) Loans On Manufactured Number Average Value Number Average Value Number Average Value Number Average Value Number Average Value Number Average Value Number Average Value
LOANS ORIGINATED 1 $238,670 262 $222,810 360 $268,513 32 $169,848 6 $2,057,603 55 $244,652 6 $66,005 APPLICATIONS APPROVED, NOT ACCEPTED 0 $0 63 $203,957 78 $270,856 5 $179,338 0 $0 11 $254,850 17 $68,596 APPLICATIONS DENIED 0 $0 76 $211,532 164 $294,416 28 $168,787 0 $0 13 $321,099 18 $65,553 APPLICATIONS WITHDRAWN 1 $221,830 39 $226,591 128 $290,960 14 $221,946 0 $0 11 $285,716 1 $273,530 FILES CLOSED FOR INCOMPLETENESS 0 $0 10 $337,982 35 $328,081 5 $142,560 0 $0 4 $267,608 0 $0
Aggregated Statistics For Year 2004(Based on 4 partial tracts) A) FHA, FSA/RHS & VA B) Conventional C) Refinancings D) Home Improvement Loans E) Loans on Dwellings For 5+ Families F) Non-occupant Loans on G) Loans On Manufactured Number Average Value Number Average Value Number Average Value Number Average Value Number Average Value Number Average Value Number Average Value
LOANS ORIGINATED 1 $216,610 238 $236,391 411 $238,740 32 $138,084 9 $1,908,096 62 $244,228 9 $56,616 APPLICATIONS APPROVED, NOT ACCEPTED 1 $110,910 46 $200,587 81 $217,587 5 $77,000 0 $0 9 $255,026 17 $72,701 APPLICATIONS DENIED 1 $93,750 59 $216,762 113 $233,484 27 $111,484 0 $0 12 $220,290 26 $87,268 APPLICATIONS WITHDRAWN 1 $68,000 35 $223,274 119 $234,926 8 $142,050 0 $0 9 $179,588 3 $60,057 FILES CLOSED FOR INCOMPLETENESS 0 $0 8 $250,402 35 $258,554 1 $10,190 0 $0 1 $459,250 0 $0
Aggregated Statistics For Year 2003(Based on 4 partial tracts) A) FHA, FSA/RHS & VA B) Conventional C) Refinancings D) Home Improvement Loans E) Loans on Dwellings For 5+ Families F) Non-occupant Loans on Number Average Value Number Average Value Number Average Value Number Average Value Number Average Value Number Average Value
LOANS ORIGINATED 8 $185,661 247 $192,020 679 $185,580 15 $56,625 13 $1,565,370 95 $184,376 APPLICATIONS APPROVED, NOT ACCEPTED 0 $0 38 $190,838 96 $180,122 5 $79,314 0 $0 8 $191,085 APPLICATIONS DENIED 4 $171,712 63 $154,358 167 $190,656 16 $68,746 1 $759,230 19 $196,307 APPLICATIONS WITHDRAWN 0 $0 35 $163,476 136 $194,933 7 $59,026 1 $927,380 7 $132,363 FILES CLOSED FOR INCOMPLETENESS 0 $0 12 $206,551 19 $183,733 2 $68,115 0 $0 5 $152,486
Aggregated Statistics For Year 2002(Based on 4 partial tracts) A) FHA, FSA/RHS & VA B) Conventional C) Refinancings D) Home Improvement Loans E) Loans on Dwellings For 5+ Families F) Non-occupant Loans on Number Average Value Number Average Value Number Average Value Number Average Value Number Average Value Number Average Value
LOANS ORIGINATED 27 $203,000 153 $167,345 502 $163,938 19 $49,099 8 $982,254 60 $156,230 APPLICATIONS APPROVED, NOT ACCEPTED 0 $0 30 $143,102 72 $167,783 6 $49,373 0 $0 7 $172,627 APPLICATIONS DENIED 2 $221,390 55 $149,175 131 $151,787 12 $46,864 1 $2,456,030 12 $140,886 APPLICATIONS WITHDRAWN 3 $148,987 23 $150,887 111 $182,022 7 $57,990 0 $0 7 $140,774 FILES CLOSED FOR INCOMPLETENESS 1 $283,590 8 $130,128 34 $166,513 1 $35,160 0 $0 3 $124,637
Aggregated Statistics For Year 2001(Based on 4 partial tracts) A) FHA, FSA/RHS & VA B) Conventional C) Refinancings D) Home Improvement Loans E) Loans on Dwellings For 5+ Families F) Non-occupant Loans on Number Average Value Number Average Value Number Average Value Number Average Value Number Average Value Number Average Value
LOANS ORIGINATED 31 $188,768 143 $133,583 345 $148,012 15 $37,229 7 $1,876,816 43 $140,016 APPLICATIONS APPROVED, NOT ACCEPTED 1 $215,930 28 $108,906 52 $147,325 4 $28,900 0 $0 6 $140,552 APPLICATIONS DENIED 6 $125,307 71 $102,649 124 $129,485 13 $31,606 1 $437,480 13 $119,333 APPLICATIONS WITHDRAWN 0 $0 25 $132,862 92 $146,047 7 $42,530 1 $4,115,260 12 $128,762 FILES CLOSED FOR INCOMPLETENESS 1 $146,560 1 $135,250 24 $133,442 1 $16,500 1 $2,246,970 3 $124,413
Aggregated Statistics For Year 2000(Based on 4 partial tracts) A) FHA, FSA/RHS & VA B) Conventional C) Refinancings D) Home Improvement Loans E) Loans on Dwellings For 5+ Families F) Non-occupant Loans on Number Average Value Number Average Value Number Average Value Number Average Value Number Average Value Number Average Value
LOANS ORIGINATED 41 $148,560 141 $106,952 87 $104,731 19 $29,823 3 $1,245,190 18 $130,411 APPLICATIONS APPROVED, NOT ACCEPTED 2 $173,875 29 $90,404 17 $114,027 7 $51,866 0 $0 7 $113,384 APPLICATIONS DENIED 6 $154,517 117 $73,147 70 $114,127 16 $41,634 1 $551,340 2 $118,235 APPLICATIONS WITHDRAWN 7 $126,167 24 $110,195 29 $99,510 5 $36,898 2 $2,324,480 1 $126,820 FILES CLOSED FOR INCOMPLETENESS 1 $124,330 6 $156,952 13 $101,871 1 $42,630 0 $0 1 $91,040
Aggregated Statistics For Year 1999(Based on 4 partial tracts) A) FHA, FSA/RHS & VA B) Conventional C) Refinancings D) Home Improvement Loans E) Loans on Dwellings For 5+ Families F) Non-occupant Loans on Number Average Value Number Average Value Number Average Value Number Average Value Number Average Value Number Average Value
LOANS ORIGINATED 45 $144,550 101 $101,694 162 $104,894 18 $25,044 3 $1,241,247 26 $115,443 APPLICATIONS APPROVED, NOT ACCEPTED 1 $140,760 15 $84,899 30 $113,172 8 $18,549 0 $0 3 $76,413 APPLICATIONS DENIED 6 $152,327 72 $69,028 71 $99,757 12 $32,171 1 $54,520 11 $120,931 APPLICATIONS WITHDRAWN 5 $148,032 17 $93,799 32 $91,114 0 $0 1 $48,170 4 $98,025 FILES CLOSED FOR INCOMPLETENESS 2 $105,010 2 $124,475 19 $133,613 0 $0 2 $1,034,440 1 $137,510
Detailed HMDA statistics for the following Tracts:
0164.01
, 0165.01 , 0165.02 , 0167.01
Private Mortgage Insurance Companies Aggregated Statistics For Year 2009(Based on 4 partial tracts) A) Conventional B) Refinancings Number Average Value Number Average Value
LOANS ORIGINATED 4 $196,332 1 $548,460 APPLICATIONS APPROVED, NOT ACCEPTED 1 $184,340 1 $283,990 APPLICATIONS DENIED 2 $155,820 0 $0 APPLICATIONS WITHDRAWN 1 $70,640 0 $0 FILES CLOSED FOR INCOMPLETENESS 1 $175,610 0 $0
Aggregated Statistics For Year 2008(Based on 4 partial tracts) A) Conventional B) Refinancings C) Non-occupant Loans on Number Average Value Number Average Value Number Average Value
LOANS ORIGINATED 23 $250,220 4 $336,540 0 $0 APPLICATIONS APPROVED, NOT ACCEPTED 12 $319,121 5 $366,176 0 $0 APPLICATIONS DENIED 7 $242,791 1 $196,210 3 $217,173 APPLICATIONS WITHDRAWN 3 $338,803 0 $0 0 $0 FILES CLOSED FOR INCOMPLETENESS 0 $0 0 $0 0 $0
Aggregated Statistics For Year 2007(Based on 4 partial tracts) A) Conventional B) Refinancings C) Non-occupant Loans on Number Average Value Number Average Value Number Average Value
LOANS ORIGINATED 12 $325,396 7 $323,769 1 $166,370 APPLICATIONS APPROVED, NOT ACCEPTED 5 $311,748 3 $416,687 0 $0 APPLICATIONS DENIED 0 $0 2 $361,190 0 $0 APPLICATIONS WITHDRAWN 1 $301,650 3 $327,933 1 $245,590 FILES CLOSED FOR INCOMPLETENESS 0 $0 0 $0 0 $0
Aggregated Statistics For Year 2006(Based on 4 partial tracts) A) Conventional B) Refinancings Number Average Value Number Average Value
LOANS ORIGINATED 2 $424,325 6 $378,813 APPLICATIONS APPROVED, NOT ACCEPTED 2 $260,610 1 $399,590 APPLICATIONS DENIED 0 $0 5 $800,062 APPLICATIONS WITHDRAWN 0 $0 1 $260,210 FILES CLOSED FOR INCOMPLETENESS 0 $0 0 $0
Aggregated Statistics For Year 2005(Based on 4 partial tracts) A) Conventional B) Refinancings C) Non-occupant Loans on D) Loans On Manufactured Number Average Value Number Average Value Number Average Value Number Average Value
LOANS ORIGINATED 2 $283,860 2 $328,535 1 $104,690 1 $195,670 APPLICATIONS APPROVED, NOT ACCEPTED 0 $0 1 $254,370 0 $0 0 $0 APPLICATIONS DENIED 0 $0 0 $0 0 $0 0 $0 APPLICATIONS WITHDRAWN 0 $0 2 $365,460 0 $0 0 $0 FILES CLOSED FOR INCOMPLETENESS 0 $0 0 $0 0 $0 0 $0
Aggregated Statistics For Year 2004(Based on 4 partial tracts) A) Conventional B) Refinancings C) Non-occupant Loans on Number Average Value Number Average Value Number Average Value
LOANS ORIGINATED 7 $298,357 5 $343,988 2 $356,710 APPLICATIONS APPROVED, NOT ACCEPTED 3 $240,257 2 $262,640 1 $248,240 APPLICATIONS DENIED 1 $283,990 0 $0 0 $0 APPLICATIONS WITHDRAWN 1 $394,240 0 $0 0 $0 FILES CLOSED FOR INCOMPLETENESS 0 $0 0 $0 0 $0
Aggregated Statistics For Year 2003(Based on 4 partial tracts) A) Conventional B) Refinancings C) Non-occupant Loans on Number Average Value Number Average Value Number Average Value
LOANS ORIGINATED 23 $233,978 18 $237,044 3 $238,977 APPLICATIONS APPROVED, NOT ACCEPTED 3 $267,797 4 $263,860 0 $0 APPLICATIONS DENIED 0 $0 0 $0 0 $0 APPLICATIONS WITHDRAWN 1 $174,650 1 $62,720 1 $62,720 FILES CLOSED FOR INCOMPLETENESS 0 $0 0 $0 0 $0
Aggregated Statistics For Year 2002(Based on 4 partial tracts) A) Conventional B) Refinancings C) Non-occupant Loans on Number Average Value Number Average Value Number Average Value
LOANS ORIGINATED 31 $210,875 27 $212,813 2 $246,510 APPLICATIONS APPROVED, NOT ACCEPTED 7 $177,787 6 $202,608 4 $150,348 APPLICATIONS DENIED 2 $105,630 1 $157,130 1 $116,200 APPLICATIONS WITHDRAWN 1 $94,410 2 $287,560 0 $0 FILES CLOSED FOR INCOMPLETENESS 0 $0 0 $0 0 $0
Aggregated Statistics For Year 2001(Based on 4 partial tracts) A) Conventional B) Refinancings C) Non-occupant Loans on Number Average Value Number Average Value Number Average Value
LOANS ORIGINATED 28 $182,935 23 $191,212 2 $224,055 APPLICATIONS APPROVED, NOT ACCEPTED 3 $207,957 7 $186,306 1 $133,160 APPLICATIONS DENIED 1 $118,220 3 $163,070 1 $208,620 APPLICATIONS WITHDRAWN 1 $129,670 1 $223,680 0 $0 FILES CLOSED FOR INCOMPLETENESS 0 $0 0 $0 0 $0
Aggregated Statistics For Year 2000(Based on 4 partial tracts) A) Conventional B) Refinancings C) Non-occupant Loans on Number Average Value Number Average Value Number Average Value
LOANS ORIGINATED 32 $137,889 9 $161,230 1 $174,190 APPLICATIONS APPROVED, NOT ACCEPTED 4 $128,275 2 $155,165 0 $0 APPLICATIONS DENIED 1 $144,270 1 $68,620 0 $0 APPLICATIONS WITHDRAWN 0 $0 0 $0 0 $0 FILES CLOSED FOR INCOMPLETENESS 0 $0 0 $0 0 $0
Aggregated Statistics For Year 1999(Based on 4 partial tracts) A) Conventional B) Refinancings C) Non-occupant Loans on Number Average Value Number Average Value Number Average Value
LOANS ORIGINATED 25 $143,465 14 $144,593 3 $147,047 APPLICATIONS APPROVED, NOT ACCEPTED 3 $156,397 2 $144,660 1 $151,010 APPLICATIONS DENIED 5 $120,802 0 $0 1 $113,250 APPLICATIONS WITHDRAWN 0 $0 1 $85,460 0 $0 FILES CLOSED FOR INCOMPLETENESS 0 $0 0 $0 0 $0
Detailed PMIC statistics for the following Tracts:
0164.01
, 0165.01 , 0165.02 , 0167.01 Bostonia compared to California state average:
Median house value below state average. Unemployed percentage below state average.
#9 on the list of "Top 101 cities with the most residents born in Iraq (population 500+)"
#52 on the list of "Top 101 cities with the most residents born in Western Asia (population 500+)"
#58 (92020) on the list of "Top 101 zip codes with the largest percentage of Arab first ancestries"
#4 on the list of "Top 101 counties with the most Catholic adherents"
#4 on the list of "Top 101 counties with the highest lead air pollution readings in 2012 (µg/m3 )"
#7 on the list of "Top 101 counties with the most Evangelical Protestant congregations"
#7 on the list of "Top 101 counties with the most Catholic congregations"
#7 on the list of "Top 101 counties with the highest surface withdrawal of fresh water for public supply (pop. 50,000+)"


 Recent articles from our blog. Our writers, many of them Ph.D. graduates or candidates, create easy-to-read articles on a wide variety of topics.


 (1.7 miles