Bremerton, Washington Submit your own pictures of this city and show them to the world
OSM Map
General Map
Google Map
MSN Map
OSM Map
General Map
Google Map
MSN Map
OSM Map
General Map
Google Map
MSN Map
OSM Map
General Map
Google Map
MSN Map
Please wait while loading the map...
Population in 2022: 45,415 (99% urban, 1% rural). Population change since 2000: +21.9%Males: 24,571 Females: 20,844
March 2022 cost of living index in Bremerton: 109.5 (more than average, U.S. average is 100) Percentage of residents living in poverty in 2022: 14.3%for White Non-Hispanic residents , 20.9% for Black residents , 20.2% for Hispanic or Latino residents , 9.3% for American Indian residents , 15.3% for Native Hawaiian and other Pacific Islander residents , 23.8% for other race residents , 14.0% for two or more races residents )
Profiles of local businesses
Business Search - 14 Million verified businesses
Data:
Median household income ($)
Median household income (% change since 2000)
Household income diversity
Ratio of average income to average house value (%)
Ratio of average income to average rent
Median household income ($) - White
Median household income ($) - Black or African American
Median household income ($) - Asian
Median household income ($) - Hispanic or Latino
Median household income ($) - American Indian and Alaska Native
Median household income ($) - Multirace
Median household income ($) - Other Race
Median household income for houses/condos with a mortgage ($)
Median household income for apartments without a mortgage ($)
Races - White alone (%)
Races - White alone (% change since 2000)
Races - Black alone (%)
Races - Black alone (% change since 2000)
Races - American Indian alone (%)
Races - American Indian alone (% change since 2000)
Races - Asian alone (%)
Races - Asian alone (% change since 2000)
Races - Hispanic (%)
Races - Hispanic (% change since 2000)
Races - Native Hawaiian and Other Pacific Islander alone (%)
Races - Native Hawaiian and Other Pacific Islander alone (% change since 2000)
Races - Two or more races (%)
Races - Two or more races (% change since 2000)
Races - Other race alone (%)
Races - Other race alone (% change since 2000)
Racial diversity
Unemployment (%)
Unemployment (% change since 2000)
Unemployment (%) - White
Unemployment (%) - Black or African American
Unemployment (%) - Asian
Unemployment (%) - Hispanic or Latino
Unemployment (%) - American Indian and Alaska Native
Unemployment (%) - Multirace
Unemployment (%) - Other Race
Population density (people per square mile)
Population - Males (%)
Population - Females (%)
Population - Males (%) - White
Population - Males (%) - Black or African American
Population - Males (%) - Asian
Population - Males (%) - Hispanic or Latino
Population - Males (%) - American Indian and Alaska Native
Population - Males (%) - Multirace
Population - Males (%) - Other Race
Population - Females (%) - White
Population - Females (%) - Black or African American
Population - Females (%) - Asian
Population - Females (%) - Hispanic or Latino
Population - Females (%) - American Indian and Alaska Native
Population - Females (%) - Multirace
Population - Females (%) - Other Race
Coronavirus confirmed cases (Jun 19, 2024)
Deaths caused by coronavirus (Jun 19, 2024)
Coronavirus confirmed cases (per 100k population) (Jun 19, 2024)
Deaths caused by coronavirus (per 100k population) (Jun 19, 2024)
Daily increase in number of cases (Jun 19, 2024)
Weekly increase in number of cases (Jun 19, 2024)
Cases doubled (in days) (Jun 19, 2024)
Hospitalized patients (Apr 18, 2022)
Negative test results (Apr 18, 2022)
Total test results (Apr 18, 2022)
COVID Vaccine doses distributed (per 100k population) (Sep 19, 2023)
COVID Vaccine doses administered (per 100k population) (Sep 19, 2023)
COVID Vaccine doses distributed (Sep 19, 2023)
COVID Vaccine doses administered (Sep 19, 2023)
Likely homosexual households (%)
Likely homosexual households (% change since 2000)
Likely homosexual households - Lesbian couples (%)
Likely homosexual households - Lesbian couples (% change since 2000)
Likely homosexual households - Gay men (%)
Likely homosexual households - Gay men (% change since 2000)
Cost of living index
Median gross rent ($)
Median contract rent ($)
Median monthly housing costs ($)
Median house or condo value ($)
Median house or condo value ($ change since 2000)
Mean house or condo value by units in structure - 1, detached ($)
Mean house or condo value by units in structure - 1, attached ($)
Mean house or condo value by units in structure - 2 ($)
Mean house or condo value by units in structure by units in structure - 3 or 4 ($)
Mean house or condo value by units in structure - 5 or more ($)
Mean house or condo value by units in structure - Boat, RV, van, etc. ($)
Mean house or condo value by units in structure - Mobile home ($)
Median house or condo value ($) - White
Median house or condo value ($) - Black or African American
Median house or condo value ($) - Asian
Median house or condo value ($) - Hispanic or Latino
Median house or condo value ($) - American Indian and Alaska Native
Median house or condo value ($) - Multirace
Median house or condo value ($) - Other Race
Median resident age
Resident age diversity
Median resident age - Males
Median resident age - Females
Median resident age - White
Median resident age - Black or African American
Median resident age - Asian
Median resident age - Hispanic or Latino
Median resident age - American Indian and Alaska Native
Median resident age - Multirace
Median resident age - Other Race
Median resident age - Males - White
Median resident age - Males - Black or African American
Median resident age - Males - Asian
Median resident age - Males - Hispanic or Latino
Median resident age - Males - American Indian and Alaska Native
Median resident age - Males - Multirace
Median resident age - Males - Other Race
Median resident age - Females - White
Median resident age - Females - Black or African American
Median resident age - Females - Asian
Median resident age - Females - Hispanic or Latino
Median resident age - Females - American Indian and Alaska Native
Median resident age - Females - Multirace
Median resident age - Females - Other Race
Commute - mean travel time to work (minutes)
Travel time to work - Less than 5 minutes (%)
Travel time to work - Less than 5 minutes (% change since 2000)
Travel time to work - 5 to 9 minutes (%)
Travel time to work - 5 to 9 minutes (% change since 2000)
Travel time to work - 10 to 19 minutes (%)
Travel time to work - 10 to 19 minutes (% change since 2000)
Travel time to work - 20 to 29 minutes (%)
Travel time to work - 20 to 29 minutes (% change since 2000)
Travel time to work - 30 to 39 minutes (%)
Travel time to work - 30 to 39 minutes (% change since 2000)
Travel time to work - 40 to 59 minutes (%)
Travel time to work - 40 to 59 minutes (% change since 2000)
Travel time to work - 60 to 89 minutes (%)
Travel time to work - 60 to 89 minutes (% change since 2000)
Travel time to work - 90 or more minutes (%)
Travel time to work - 90 or more minutes (% change since 2000)
Marital status - Never married (%)
Marital status - Now married (%)
Marital status - Separated (%)
Marital status - Widowed (%)
Marital status - Divorced (%)
Median family income ($)
Median family income (% change since 2000)
Median non-family income ($)
Median non-family income (% change since 2000)
Median per capita income ($)
Median per capita income (% change since 2000)
Median family income ($) - White
Median family income ($) - Black or African American
Median family income ($) - Asian
Median family income ($) - Hispanic or Latino
Median family income ($) - American Indian and Alaska Native
Median family income ($) - Multirace
Median family income ($) - Other Race
Median year house/condo built
Median year apartment built
Year house built - Built 2005 or later (%)
Year house built - Built 2000 to 2004 (%)
Year house built - Built 1990 to 1999 (%)
Year house built - Built 1980 to 1989 (%)
Year house built - Built 1970 to 1979 (%)
Year house built - Built 1960 to 1969 (%)
Year house built - Built 1950 to 1959 (%)
Year house built - Built 1940 to 1949 (%)
Year house built - Built 1939 or earlier (%)
Average household size
Household density (households per square mile)
Average household size - White
Average household size - Black or African American
Average household size - Asian
Average household size - Hispanic or Latino
Average household size - American Indian and Alaska Native
Average household size - Multirace
Average household size - Other Race
Occupied housing units (%)
Vacant housing units (%)
Owner occupied housing units (%)
Renter occupied housing units (%)
Vacancy status - For rent (%)
Vacancy status - For sale only (%)
Vacancy status - Rented or sold, not occupied (%)
Vacancy status - For seasonal, recreational, or occasional use (%)
Vacancy status - For migrant workers (%)
Vacancy status - Other vacant (%)
Residents with income below the poverty level (%)
Residents with income below 50% of the poverty level (%)
Children below poverty level (%)
Poor families by family type - Married-couple family (%)
Poor families by family type - Male, no wife present (%)
Poor families by family type - Female, no husband present (%)
Poverty status for native-born residents (%)
Poverty status for foreign-born residents (%)
Poverty among high school graduates not in families (%)
Poverty among people who did not graduate high school not in families (%)
Residents with income below the poverty level (%) - White
Residents with income below the poverty level (%) - Black or African American
Residents with income below the poverty level (%) - Asian
Residents with income below the poverty level (%) - Hispanic or Latino
Residents with income below the poverty level (%) - American Indian and Alaska Native
Residents with income below the poverty level (%) - Multirace
Residents with income below the poverty level (%) - Other Race
Air pollution - Air Quality Index (AQI)
Air pollution - CO
Air pollution - NO2
Air pollution - SO2
Air pollution - Ozone
Air pollution - PM10
Air pollution - PM25
Air pollution - Pb
Crime - Murders per 100,000 population
Crime - Rapes per 100,000 population
Crime - Robberies per 100,000 population
Crime - Assaults per 100,000 population
Crime - Burglaries per 100,000 population
Crime - Thefts per 100,000 population
Crime - Auto thefts per 100,000 population
Crime - Arson per 100,000 population
Crime - City-data.com crime index
Crime - Violent crime index
Crime - Property crime index
Crime - Murders per 100,000 population (5 year average)
Crime - Rapes per 100,000 population (5 year average)
Crime - Robberies per 100,000 population (5 year average)
Crime - Assaults per 100,000 population (5 year average)
Crime - Burglaries per 100,000 population (5 year average)
Crime - Thefts per 100,000 population (5 year average)
Crime - Auto thefts per 100,000 population (5 year average)
Crime - Arson per 100,000 population (5 year average)
Crime - City-data.com crime index (5 year average)
Crime - Violent crime index (5 year average)
Crime - Property crime index (5 year average)
1996 Presidential Elections Results (%) - Democratic Party (Clinton)
1996 Presidential Elections Results (%) - Republican Party (Dole)
1996 Presidential Elections Results (%) - Other
2000 Presidential Elections Results (%) - Democratic Party (Gore)
2000 Presidential Elections Results (%) - Republican Party (Bush)
2000 Presidential Elections Results (%) - Other
2004 Presidential Elections Results (%) - Democratic Party (Kerry)
2004 Presidential Elections Results (%) - Republican Party (Bush)
2004 Presidential Elections Results (%) - Other
2008 Presidential Elections Results (%) - Democratic Party (Obama)
2008 Presidential Elections Results (%) - Republican Party (McCain)
2008 Presidential Elections Results (%) - Other
2012 Presidential Elections Results (%) - Democratic Party (Obama)
2012 Presidential Elections Results (%) - Republican Party (Romney)
2012 Presidential Elections Results (%) - Other
2016 Presidential Elections Results (%) - Democratic Party (Clinton)
2016 Presidential Elections Results (%) - Republican Party (Trump)
2016 Presidential Elections Results (%) - Other
2020 Presidential Elections Results (%) - Democratic Party (Biden)
2020 Presidential Elections Results (%) - Republican Party (Trump)
2020 Presidential Elections Results (%) - Other
Ancestries Reported - Arab (%)
Ancestries Reported - Czech (%)
Ancestries Reported - Danish (%)
Ancestries Reported - Dutch (%)
Ancestries Reported - English (%)
Ancestries Reported - French (%)
Ancestries Reported - French Canadian (%)
Ancestries Reported - German (%)
Ancestries Reported - Greek (%)
Ancestries Reported - Hungarian (%)
Ancestries Reported - Irish (%)
Ancestries Reported - Italian (%)
Ancestries Reported - Lithuanian (%)
Ancestries Reported - Norwegian (%)
Ancestries Reported - Polish (%)
Ancestries Reported - Portuguese (%)
Ancestries Reported - Russian (%)
Ancestries Reported - Scotch-Irish (%)
Ancestries Reported - Scottish (%)
Ancestries Reported - Slovak (%)
Ancestries Reported - Subsaharan African (%)
Ancestries Reported - Swedish (%)
Ancestries Reported - Swiss (%)
Ancestries Reported - Ukrainian (%)
Ancestries Reported - United States (%)
Ancestries Reported - Welsh (%)
Ancestries Reported - West Indian (%)
Ancestries Reported - Other (%)
Educational Attainment - No schooling completed (%)
Educational Attainment - Less than high school (%)
Educational Attainment - High school or equivalent (%)
Educational Attainment - Less than 1 year of college (%)
Educational Attainment - 1 or more years of college (%)
Educational Attainment - Associate degree (%)
Educational Attainment - Bachelor's degree (%)
Educational Attainment - Master's degree (%)
Educational Attainment - Professional school degree (%)
Educational Attainment - Doctorate degree (%)
School Enrollment - Nursery, preschool (%)
School Enrollment - Kindergarten (%)
School Enrollment - Grade 1 to 4 (%)
School Enrollment - Grade 5 to 8 (%)
School Enrollment - Grade 9 to 12 (%)
School Enrollment - College undergrad (%)
School Enrollment - Graduate or professional (%)
School Enrollment - Not enrolled in school (%)
School enrollment - Public schools (%)
School enrollment - Private schools (%)
School enrollment - Not enrolled (%)
Median number of rooms in houses and condos
Median number of rooms in apartments
Housing units lacking complete plumbing facilities (%)
Housing units lacking complete kitchen facilities (%)
Density of houses
Urban houses (%)
Rural houses (%)
Households with people 60 years and over (%)
Households with people 65 years and over (%)
Households with people 75 years and over (%)
Households with one or more nonrelatives (%)
Households with no nonrelatives (%)
Population in households (%)
Family households (%)
Nonfamily households (%)
Population in families (%)
Family households with own children (%)
Median number of bedrooms in owner occupied houses
Mean number of bedrooms in owner occupied houses
Median number of bedrooms in renter occupied houses
Mean number of bedrooms in renter occupied houses
Median number of vehichles in owner occupied houses
Mean number of vehichles in owner occupied houses
Median number of vehichles in renter occupied houses
Mean number of vehichles in renter occupied houses
Mortgage status - with mortgage (%)
Mortgage status - with second mortgage (%)
Mortgage status - with home equity loan (%)
Mortgage status - with both second mortgage and home equity loan (%)
Mortgage status - without a mortgage (%)
Average family size
Average family size - White
Average family size - Black or African American
Average family size - Asian
Average family size - Hispanic or Latino
Average family size - American Indian and Alaska Native
Average family size - Multirace
Average family size - Other Race
Geographical mobility - Same house 1 year ago (%)
Geographical mobility - Moved within same county (%)
Geographical mobility - Moved from different county within same state (%)
Geographical mobility - Moved from different state (%)
Geographical mobility - Moved from abroad (%)
Place of birth - Born in state of residence (%)
Place of birth - Born in other state (%)
Place of birth - Native, outside of US (%)
Place of birth - Foreign born (%)
Housing units in structures - 1, detached (%)
Housing units in structures - 1, attached (%)
Housing units in structures - 2 (%)
Housing units in structures - 3 or 4 (%)
Housing units in structures - 5 to 9 (%)
Housing units in structures - 10 to 19 (%)
Housing units in structures - 20 to 49 (%)
Housing units in structures - 50 or more (%)
Housing units in structures - Mobile home (%)
Housing units in structures - Boat, RV, van, etc. (%)
House/condo owner moved in on average (years ago)
Renter moved in on average (years ago)
Year householder moved into unit - Moved in 1999 to March 2000 (%)
Year householder moved into unit - Moved in 1995 to 1998 (%)
Year householder moved into unit - Moved in 1990 to 1994 (%)
Year householder moved into unit - Moved in 1980 to 1989 (%)
Year householder moved into unit - Moved in 1970 to 1979 (%)
Year householder moved into unit - Moved in 1969 or earlier (%)
Means of transportation to work - Drove car alone (%)
Means of transportation to work - Carpooled (%)
Means of transportation to work - Public transportation (%)
Means of transportation to work - Bus or trolley bus (%)
Means of transportation to work - Streetcar or trolley car (%)
Means of transportation to work - Subway or elevated (%)
Means of transportation to work - Railroad (%)
Means of transportation to work - Ferryboat (%)
Means of transportation to work - Taxicab (%)
Means of transportation to work - Motorcycle (%)
Means of transportation to work - Bicycle (%)
Means of transportation to work - Walked (%)
Means of transportation to work - Other means (%)
Working at home (%)
Industry diversity
Most Common Industries - Agriculture, forestry, fishing and hunting, and mining (%)
Most Common Industries - Agriculture, forestry, fishing and hunting (%)
Most Common Industries - Mining, quarrying, and oil and gas extraction (%)
Most Common Industries - Construction (%)
Most Common Industries - Manufacturing (%)
Most Common Industries - Wholesale trade (%)
Most Common Industries - Retail trade (%)
Most Common Industries - Transportation and warehousing, and utilities (%)
Most Common Industries - Transportation and warehousing (%)
Most Common Industries - Utilities (%)
Most Common Industries - Information (%)
Most Common Industries - Finance and insurance, and real estate and rental and leasing (%)
Most Common Industries - Finance and insurance (%)
Most Common Industries - Real estate and rental and leasing (%)
Most Common Industries - Professional, scientific, and management, and administrative and waste management services (%)
Most Common Industries - Professional, scientific, and technical services (%)
Most Common Industries - Management of companies and enterprises (%)
Most Common Industries - Administrative and support and waste management services (%)
Most Common Industries - Educational services, and health care and social assistance (%)
Most Common Industries - Educational services (%)
Most Common Industries - Health care and social assistance (%)
Most Common Industries - Arts, entertainment, and recreation, and accommodation and food services (%)
Most Common Industries - Arts, entertainment, and recreation (%)
Most Common Industries - Accommodation and food services (%)
Most Common Industries - Other services, except public administration (%)
Most Common Industries - Public administration (%)
Occupation diversity
Most Common Occupations - Management, business, science, and arts occupations (%)
Most Common Occupations - Management, business, and financial occupations (%)
Most Common Occupations - Management occupations (%)
Most Common Occupations - Business and financial operations occupations (%)
Most Common Occupations - Computer, engineering, and science occupations (%)
Most Common Occupations - Computer and mathematical occupations (%)
Most Common Occupations - Architecture and engineering occupations (%)
Most Common Occupations - Life, physical, and social science occupations (%)
Most Common Occupations - Education, legal, community service, arts, and media occupations (%)
Most Common Occupations - Community and social service occupations (%)
Most Common Occupations - Legal occupations (%)
Most Common Occupations - Education, training, and library occupations (%)
Most Common Occupations - Arts, design, entertainment, sports, and media occupations (%)
Most Common Occupations - Healthcare practitioners and technical occupations (%)
Most Common Occupations - Health diagnosing and treating practitioners and other technical occupations (%)
Most Common Occupations - Health technologists and technicians (%)
Most Common Occupations - Service occupations (%)
Most Common Occupations - Healthcare support occupations (%)
Most Common Occupations - Protective service occupations (%)
Most Common Occupations - Fire fighting and prevention, and other protective service workers including supervisors (%)
Most Common Occupations - Law enforcement workers including supervisors (%)
Most Common Occupations - Food preparation and serving related occupations (%)
Most Common Occupations - Building and grounds cleaning and maintenance occupations (%)
Most Common Occupations - Personal care and service occupations (%)
Most Common Occupations - Sales and office occupations (%)
Most Common Occupations - Sales and related occupations (%)
Most Common Occupations - Office and administrative support occupations (%)
Most Common Occupations - Natural resources, construction, and maintenance occupations (%)
Most Common Occupations - Farming, fishing, and forestry occupations (%)
Most Common Occupations - Construction and extraction occupations (%)
Most Common Occupations - Installation, maintenance, and repair occupations (%)
Most Common Occupations - Production, transportation, and material moving occupations (%)
Most Common Occupations - Production occupations (%)
Most Common Occupations - Transportation occupations (%)
Most Common Occupations - Material moving occupations (%)
People in Group quarters - Institutionalized population (%)
People in Group quarters - Correctional institutions (%)
People in Group quarters - Federal prisons and detention centers (%)
People in Group quarters - Halfway houses (%)
People in Group quarters - Local jails and other confinement facilities (including police lockups) (%)
People in Group quarters - Military disciplinary barracks (%)
People in Group quarters - State prisons (%)
People in Group quarters - Other types of correctional institutions (%)
People in Group quarters - Nursing homes (%)
People in Group quarters - Hospitals/wards, hospices, and schools for the handicapped (%)
People in Group quarters - Hospitals/wards and hospices for chronically ill (%)
People in Group quarters - Hospices or homes for chronically ill (%)
People in Group quarters - Military hospitals or wards for chronically ill (%)
People in Group quarters - Other hospitals or wards for chronically ill (%)
People in Group quarters - Hospitals or wards for drug/alcohol abuse (%)
People in Group quarters - Mental (Psychiatric) hospitals or wards (%)
People in Group quarters - Schools, hospitals, or wards for the mentally retarded (%)
People in Group quarters - Schools, hospitals, or wards for the physically handicapped (%)
People in Group quarters - Institutions for the deaf (%)
People in Group quarters - Institutions for the blind (%)
People in Group quarters - Orthopedic wards and institutions for the physically handicapped (%)
People in Group quarters - Wards in general hospitals for patients who have no usual home elsewhere (%)
People in Group quarters - Wards in military hospitals for patients who have no usual home elsewhere (%)
People in Group quarters - Juvenile institutions (%)
People in Group quarters - Long-term care (%)
People in Group quarters - Homes for abused, dependent, and neglected children (%)
People in Group quarters - Residential treatment centers for emotionally disturbed children (%)
People in Group quarters - Training schools for juvenile delinquents (%)
People in Group quarters - Short-term care, detention or diagnostic centers for delinquent children (%)
People in Group quarters - Type of juvenile institution unknown (%)
People in Group quarters - Noninstitutionalized population (%)
People in Group quarters - College dormitories (includes college quarters off campus) (%)
People in Group quarters - Military quarters (%)
People in Group quarters - On base (%)
People in Group quarters - Barracks, unaccompanied personnel housing (UPH), (Enlisted/Officer), ;and similar group living quarters for military personnel (%)
People in Group quarters - Transient quarters for temporary residents (%)
People in Group quarters - Military ships (%)
People in Group quarters - Group homes (%)
People in Group quarters - Homes or halfway houses for drug/alcohol abuse (%)
People in Group quarters - Homes for the mentally ill (%)
People in Group quarters - Homes for the mentally retarded (%)
People in Group quarters - Homes for the physically handicapped (%)
People in Group quarters - Other group homes (%)
People in Group quarters - Religious group quarters (%)
People in Group quarters - Dormitories (%)
People in Group quarters - Agriculture workers' dormitories on farms (%)
People in Group quarters - Job Corps and vocational training facilities (%)
People in Group quarters - Other workers' dormitories (%)
People in Group quarters - Crews of maritime vessels (%)
People in Group quarters - Other nonhousehold living situations (%)
People in Group quarters - Other noninstitutional group quarters (%)
Residents speaking English at home (%)
Residents speaking English at home - Born in the United States (%)
Residents speaking English at home - Native, born elsewhere (%)
Residents speaking English at home - Foreign born (%)
Residents speaking Spanish at home (%)
Residents speaking Spanish at home - Born in the United States (%)
Residents speaking Spanish at home - Native, born elsewhere (%)
Residents speaking Spanish at home - Foreign born (%)
Residents speaking other language at home (%)
Residents speaking other language at home - Born in the United States (%)
Residents speaking other language at home - Native, born elsewhere (%)
Residents speaking other language at home - Foreign born (%)
Class of Workers - Employee of private company (%)
Class of Workers - Self-employed in own incorporated business (%)
Class of Workers - Private not-for-profit wage and salary workers (%)
Class of Workers - Local government workers (%)
Class of Workers - State government workers (%)
Class of Workers - Federal government workers (%)
Class of Workers - Self-employed workers in own not incorporated business and Unpaid family workers (%)
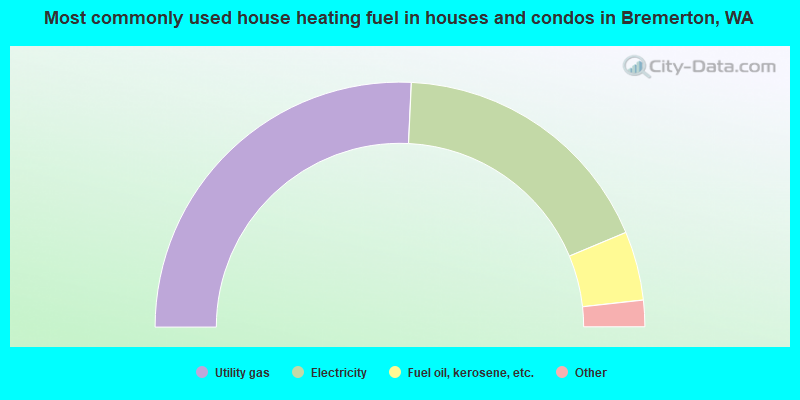
House heating fuel used in houses and condos - Utility gas (%)
House heating fuel used in houses and condos - Bottled, tank, or LP gas (%)
House heating fuel used in houses and condos - Electricity (%)
House heating fuel used in houses and condos - Fuel oil, kerosene, etc. (%)
House heating fuel used in houses and condos - Coal or coke (%)
House heating fuel used in houses and condos - Wood (%)
House heating fuel used in houses and condos - Solar energy (%)
House heating fuel used in houses and condos - Other fuel (%)
House heating fuel used in houses and condos - No fuel used (%)
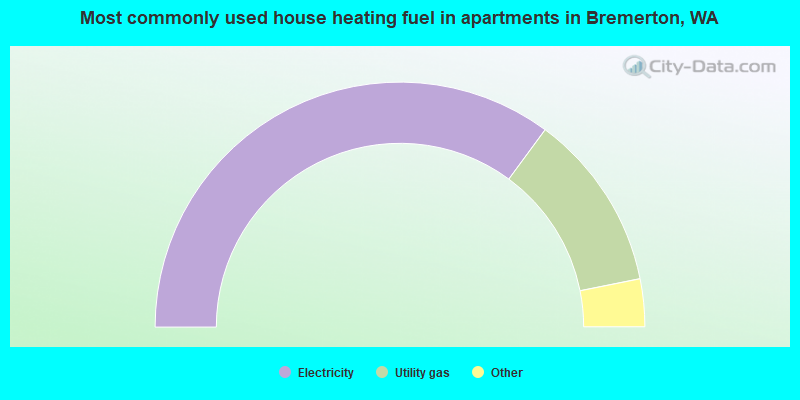
House heating fuel used in apartments - Utility gas (%)
House heating fuel used in apartments - Bottled, tank, or LP gas (%)
House heating fuel used in apartments - Electricity (%)
House heating fuel used in apartments - Fuel oil, kerosene, etc. (%)
House heating fuel used in apartments - Coal or coke (%)
House heating fuel used in apartments - Wood (%)
House heating fuel used in apartments - Solar energy (%)
House heating fuel used in apartments - Other fuel (%)
House heating fuel used in apartments - No fuel used (%)
Armed forces status - In Armed Forces (%)
Armed forces status - Civilian (%)
Armed forces status - Civilian - Veteran (%)
Armed forces status - Civilian - Nonveteran (%)
Fatal accidents locations in years 2005-2021
Fatal accidents locations in 2005
Fatal accidents locations in 2006
Fatal accidents locations in 2007
Fatal accidents locations in 2008
Fatal accidents locations in 2009
Fatal accidents locations in 2010
Fatal accidents locations in 2011
Fatal accidents locations in 2012
Fatal accidents locations in 2013
Fatal accidents locations in 2014
Fatal accidents locations in 2015
Fatal accidents locations in 2016
Fatal accidents locations in 2017
Fatal accidents locations in 2018
Fatal accidents locations in 2019
Fatal accidents locations in 2020
Fatal accidents locations in 2021
Alcohol use - People drinking some alcohol every month (%)
Alcohol use - People not drinking at all (%)
Alcohol use - Average days/month drinking alcohol
Alcohol use - Average drinks/week
Alcohol use - Average days/year people drink much
Audiometry - Average condition of hearing (%)
Audiometry - People that can hear a whisper from across a quiet room (%)
Audiometry - People that can hear normal voice from across a quiet room (%)
Audiometry - Ears ringing, roaring, buzzing (%)
Audiometry - Had a job exposure to loud noise (%)
Audiometry - Had off-work exposure to loud noise (%)
Blood Pressure & Cholesterol - Has high blood pressure (%)
Blood Pressure & Cholesterol - Checking blood pressure at home (%)
Blood Pressure & Cholesterol - Frequently checking blood cholesterol (%)
Blood Pressure & Cholesterol - Has high cholesterol level (%)
Consumer Behavior - Money monthly spent on food at supermarket/grocery store
Consumer Behavior - Money monthly spent on food at other stores
Consumer Behavior - Money monthly spent on eating out
Consumer Behavior - Money monthly spent on carryout/delivered foods
Consumer Behavior - Income spent on food at supermarket/grocery store (%)
Consumer Behavior - Income spent on food at other stores (%)
Consumer Behavior - Income spent on eating out (%)
Consumer Behavior - Income spent on carryout/delivered foods (%)
Current Health Status - General health condition (%)
Current Health Status - Blood donors (%)
Current Health Status - Has blood ever tested for HIV virus (%)
Current Health Status - Left-handed people (%)
Dermatology - People using sunscreen (%)
Diabetes - Diabetics (%)
Diabetes - Had a blood test for high blood sugar (%)
Diabetes - People taking insulin (%)
Diet Behavior & Nutrition - Diet health (%)
Diet Behavior & Nutrition - Milk product consumption (# of products/month)
Diet Behavior & Nutrition - Meals not home prepared (#/week)
Diet Behavior & Nutrition - Meals from fast food or pizza place (#/week)
Diet Behavior & Nutrition - Ready-to-eat foods (#/month)
Diet Behavior & Nutrition - Frozen meals/pizza (#/month)
Drug Use - People that ever used marijuana or hashish (%)
Drug Use - Ever used hard drugs (%)
Drug Use - Ever used any form of cocaine (%)
Drug Use - Ever used heroin (%)
Drug Use - Ever used methamphetamine (%)
Health Insurance - People covered by health insurance (%)
Kidney Conditions-Urology - Avg. # of times urinating at night
Medical Conditions - People with asthma (%)
Medical Conditions - People with anemia (%)
Medical Conditions - People with psoriasis (%)
Medical Conditions - People with overweight (%)
Medical Conditions - Elderly people having difficulties in thinking or remembering (%)
Medical Conditions - People who ever received blood transfusion (%)
Medical Conditions - People having trouble seeing even with glass/contacts (%)
Medical Conditions - People with arthritis (%)
Medical Conditions - People with gout (%)
Medical Conditions - People with congestive heart failure (%)
Medical Conditions - People with coronary heart disease (%)
Medical Conditions - People with angina pectoris (%)
Medical Conditions - People who ever had heart attack (%)
Medical Conditions - People who ever had stroke (%)
Medical Conditions - People with emphysema (%)
Medical Conditions - People with thyroid problem (%)
Medical Conditions - People with chronic bronchitis (%)
Medical Conditions - People with any liver condition (%)
Medical Conditions - People who ever had cancer or malignancy (%)
Mental Health - People who have little interest in doing things (%)
Mental Health - People feeling down, depressed, or hopeless (%)
Mental Health - People who have trouble sleeping or sleeping too much (%)
Mental Health - People feeling tired or having little energy (%)
Mental Health - People with poor appetite or overeating (%)
Mental Health - People feeling bad about themself (%)
Mental Health - People who have trouble concentrating on things (%)
Mental Health - People moving or speaking slowly or too fast (%)
Mental Health - People having thoughts they would be better off dead (%)
Oral Health - Average years since last visit a dentist
Oral Health - People embarrassed because of mouth (%)
Oral Health - People with gum disease (%)
Oral Health - General health of teeth and gums (%)
Oral Health - Average days a week using dental floss/device
Oral Health - Average days a week using mouthwash for dental problem
Oral Health - Average number of teeth
Pesticide Use - Households using pesticides to control insects (%)
Pesticide Use - Households using pesticides to kill weeds (%)
Physical Activity - People doing vigorous-intensity work activities (%)
Physical Activity - People doing moderate-intensity work activities (%)
Physical Activity - People walking or bicycling (%)
Physical Activity - People doing vigorous-intensity recreational activities (%)
Physical Activity - People doing moderate-intensity recreational activities (%)
Physical Activity - Average hours a day doing sedentary activities
Physical Activity - Average hours a day watching TV or videos
Physical Activity - Average hours a day using computer
Physical Functioning - People having limitations keeping them from working (%)
Physical Functioning - People limited in amount of work they can do (%)
Physical Functioning - People that need special equipment to walk (%)
Physical Functioning - People experiencing confusion/memory problems (%)
Physical Functioning - People requiring special healthcare equipment (%)
Prescription Medications - Average number of prescription medicines taking
Preventive Aspirin Use - Adults 40+ taking low-dose aspirin (%)
Reproductive Health - Vaginal deliveries (%)
Reproductive Health - Cesarean deliveries (%)
Reproductive Health - Deliveries resulted in a live birth (%)
Reproductive Health - Pregnancies resulted in a delivery (%)
Reproductive Health - Women breastfeeding newborns (%)
Reproductive Health - Women that had a hysterectomy (%)
Reproductive Health - Women that had both ovaries removed (%)
Reproductive Health - Women that have ever taken birth control pills (%)
Reproductive Health - Women taking birth control pills (%)
Reproductive Health - Women that have ever used Depo-Provera or injectables (%)
Reproductive Health - Women that have ever used female hormones (%)
Sexual Behavior - People 18+ that ever had sex (vaginal, anal, or oral) (%)
Sexual Behavior - Males 18+ that ever had vaginal sex with a woman (%)
Sexual Behavior - Males 18+ that ever performed oral sex on a woman (%)
Sexual Behavior - Males 18+ that ever had anal sex with a woman (%)
Sexual Behavior - Males 18+ that ever had any sex with a man (%)
Sexual Behavior - Females 18+ that ever had vaginal sex with a man (%)
Sexual Behavior - Females 18+ that ever performed oral sex on a man (%)
Sexual Behavior - Females 18+ that ever had anal sex with a man (%)
Sexual Behavior - Females 18+ that ever had any kind of sex with a woman (%)
Sexual Behavior - Average age people first had sex
Sexual Behavior - Average number of female sex partners in lifetime (males 18+)
Sexual Behavior - Average number of female vaginal sex partners in lifetime (males 18+)
Sexual Behavior - Average age people first performed oral sex on a woman (18+)
Sexual Behavior - Average number of woman performed oral sex on in lifetime (18+)
Sexual Behavior - Average number of male sex partners in lifetime (males 18+)
Sexual Behavior - Average number of male anal sex partners in lifetime (males 18+)
Sexual Behavior - Average age people first performed oral sex on a man (18+)
Sexual Behavior - Average number of male oral sex partners in lifetime (18+)
Sexual Behavior - People using protection when performing oral sex (%)
Sexual Behavior - Average number of times people have vaginal or anal sex a year
Sexual Behavior - People having sex without condom (%)
Sexual Behavior - Average number of male sex partners in lifetime (females 18+)
Sexual Behavior - Average number of male vaginal sex partners in lifetime (females 18+)
Sexual Behavior - Average number of female sex partners in lifetime (females 18+)
Sexual Behavior - Circumcised males 18+ (%)
Sleep Disorders - Average hours sleeping at night
Sleep Disorders - People that has trouble sleeping (%)
Smoking-Cigarette Use - People smoking cigarettes (%)
Taste & Smell - People 40+ having problems with smell (%)
Taste & Smell - People 40+ having problems with taste (%)
Taste & Smell - People 40+ that ever had wisdom teeth removed (%)
Taste & Smell - People 40+ that ever had tonsils teeth removed (%)
Taste & Smell - People 40+ that ever had a loss of consciousness because of a head injury (%)
Taste & Smell - People 40+ that ever had a broken nose or other serious injury to face or skull (%)
Taste & Smell - People 40+ that ever had two or more sinus infections (%)
Weight - Average height (inches)
Weight - Average weight (pounds)
Weight - Average BMI
Weight - People that are obese (%)
Weight - People that ever were obese (%)
Weight - People trying to lose weight (%)
Officers per 1,000 residents here:
1.26Washington average:
1.35
Latest news from Bremerton, WA collected exclusively by city-data.com from local newspapers, TV, and radio stations
Ancestries: German (9.5%), European (9.1%), English (7.1%), American (5.8%), Irish (5.7%), Norwegian (2.7%).
Current Local Time:
Land area: 22.7 square miles.
Population density: 2,004 people per square mile (low).
3,561 residents are foreign born (3.7% Asia , 2.1% Latin America ).
This city:
8.0%Washington:
14.9%
Median real estate property taxes paid for housing units with mortgages in 2022: $2,888 (0.7%)Median real estate property taxes paid for housing units with no mortgage in 2022: $3,159 (0.7%)
Nearest city with pop. 50,000+: Seattle, WA
Nearest city with pop. 1,000,000+: Los Angeles, CA
Nearest cities:
Latitude: 47.57 N, Longitude: 122.65 W
Daytime population change due to commuting: +19,318 (+43.6%)Workers who live and work in this city: 13,927 (59.4%)
Bremerton tourist attractions:
Single-family new house construction building permits:
2022: 134 buildings , average cost: $315,1002021: 310 buildings , average cost: $284,4002020: 176 buildings , average cost: $258,7002019: 185 buildings , average cost: $244,0002018: 128 buildings , average cost: $243,2002017: 112 buildings , average cost: $248,6002016: 96 buildings , average cost: $248,7002015: 89 buildings , average cost: $243,5002014: 65 buildings , average cost: $228,9002013: 106 buildings , average cost: $193,6002012: 43 buildings , average cost: $197,3002011: 29 buildings , average cost: $162,6002010: 37 buildings , average cost: $126,6002009: 56 buildings , average cost: $104,9002008: 39 buildings , average cost: $127,0002007: 76 buildings , average cost: $148,4002006: 39 buildings , average cost: $103,7002005: 50 buildings , average cost: $103,7002004: 48 buildings , average cost: $103,7002003: 42 buildings , average cost: $103,1002002: 42 buildings , average cost: $105,3002001: 33 buildings , average cost: $95,8002000: 33 buildings , average cost: $88,4001999: 33 buildings , average cost: $110,6001998: 28 buildings , average cost: $87,4001997: 48 buildings , average cost: $94,300Unemployment in December 2023:
Most common occupations in Bremerton, WA (%)
Both Males Females
Building and grounds cleaning and maintenance occupations (5.7%)
Retail sales workers, except cashiers (3.8%)
Cooks and food preparation workers (3.7%)
Material recording, scheduling, dispatching, and distributing workers (3.5%)
Other office and administrative support workers, including supervisors (3.5%)
Cashiers (3.3%)
Other sales and related occupations, including supervisors (3.1%)
Building and grounds cleaning and maintenance occupations (6.9%)
Electrical equipment mechanics and other installation, maintenance, and repair workers, including supervisors (5.2%)
Material recording, scheduling, dispatching, and distributing workers (4.5%)
Cooks and food preparation workers (3.7%)
Computer specialists (3.6%)
Other production occupations, including supervisors (3.6%)
Retail sales workers, except cashiers (3.3%)
Other office and administrative support workers, including supervisors (5.8%)
Cashiers (5.2%)
Building and grounds cleaning and maintenance occupations (4.5%)
Nursing, psychiatric, and home health aides (4.3%)
Retail sales workers, except cashiers (4.2%)
Secretaries and administrative assistants (4.1%)
Information and record clerks, except customer service representatives (4.0%)
Earthquake activity:
Bremerton-area historical earthquake activity is significantly above Washington state average. It is 1286% greater than the overall U.S. average. On 4/13/1949 at 19:55:42, a magnitude 7.0 (7.0 UK, Class: Major, Intensity: VIII - XII) earthquake occurred 23.3 miles away from Bremerton center, causing $80,000,000 total damage On 2/28/2001 at 18:54:32, a magnitude 6.8 (6.8 MD, Depth: 32.2 mi, Class: Strong, Intensity: VII - IX) earthquake occurred 29.3 miles away from Bremerton center On 2/28/2001 at 18:54:32, a magnitude 6.8 (6.5 MB, 6.6 MS, 6.8 MW) earthquake occurred 33.4 miles away from the city center, causing $2,000,000,000 total damage and $305,000,000 insured lossesOn 4/29/1965 at 15:28:43, a magnitude 6.6 (6.6 UK) earthquake occurred 23.0 miles away from the city center, causing $28,000,000 total damage On 7/3/1999 at 01:43:54, a magnitude 5.8 (5.4 MB, 5.5 MS, 5.8 MW, 5.3 ME, Depth: 25.2 mi, Class: Moderate, Intensity: VI - VII) earthquake occurred 44.6 miles away from Bremerton center On 5/3/1996 at 04:04:22, a magnitude 5.5 (5.2 MB, 5.3 MD, 5.5 ML, Depth: 2.5 mi) earthquake occurred 46.1 miles away from Bremerton center Magnitude types: body-wave magnitude (MB), duration magnitude (MD), energy magnitude (ME), local magnitude (ML), surface-wave magnitude (MS), moment magnitude (MW) Natural disasters: The number of natural disasters in Kitsap County (15) is near the US average (15).Major Disasters (Presidential) Declared: 14Emergencies Declared: 1Floods: 9, Storms: 9, Mudslides: 4, Landslides: 3, Earthquakes: 2, Hurricane: 1, Snow: 1, Volcanic Eruption: 1, Winter Storm: 1, Other: 1 (Note: some incidents may be assigned to more than one category). Hospitals in Bremerton: COMMUNITY HOSPICE OF THE NORTHWEST (5610 KITSAP WAY, #310) FRANCES HADDON MORGAN CENTER (3423 6TH STREET) HARRISON MEDICAL CENTER (Voluntary non-profit - Private, provides emergency services, 2520 CHERRY AVENUE) Nursing Homes in Bremerton: BREMERTON CONVALESCENT CENTER (2701 CLARE AVE) BREMERTON HEALTH AND REHABILITATION CENTER (2701 CLARE AVENUE) EVERGREEN BREMERTON HEALTH AND R (3517 ELEVENTH STREET) FOREST RIDGE HEALTH AND REHAB (140 SOUTH MARION AVENUE) RESTHAVEN NURSING HOME (3517 11TH ST) STAFFORD HEALTHCARE AT BELMONT (560 LEBO BOULEVARD) Dialysis Facilities in Bremerton: OLYMPIC PENINSULA KIDNEY CENTER (2613 WHEATON WAY) Home Health Centers in Bremerton: GENTIVA HEALTH SVS /BREMERTON (4060 WHEATON WAY BLDG A SUITE 2A) HARRISON HOME HEALTH (750 LEBO BOULEVARD) OLYMPIC PENINSULA HOME HEALTH (5610 KITSAP WAY SUITE 301/PO BOX 4250) Amtrak station near Bremerton: 16 miles: SEATTLE (303 S. JACKSON ST.) Services: ticket office, fully wheelchair accessible, enclosed waiting area, public restrooms, public payphones, vending machines, paid short-term parking, paid long-term parking, call for car rental service, taxi stand, intercity bus service, public transit connection.
Colleges/Universities in Bremerton: Olympic College Full-time enrollment: 6,158; Location: 1600 Chester Ave; Public; Website: www.olympic.edu)
Everest College-Bremerton Full-time enrollment: 487; Location: 155 Washington Ave. Ste. 200; Private, for-profit; Website: www.everest.edu/campus/bremerton)
Other colleges/universities with over 2000 students near Bremerton:
Seattle Community College-South Campus (about 15 miles; Seattle, WA ; Full-time enrollment: 3,986)
Seattle Pacific University (about 15 miles; Seattle, WA ; FT enrollment: 3,897)
Seattle University (about 16 miles; Seattle, WA ; FT enrollment: 5,808)
Seattle Central College (about 16 miles; Seattle, WA ; FT enrollment: 5,825)
University of Washington-Seattle Campus (about 17 miles; Seattle, WA ; FT enrollment: 39,445)
Seattle Community College-North Campus (about 18 miles; Seattle, WA ; FT enrollment: 4,220)
Shoreline Community College (about 19 miles; Shoreline, WA ; FT enrollment: 5,026)
Public high schools in Bremerton: WASHINGTON YOUTH ACADEMY Location: 1207 CARVER ST, Grades: 9-12)
BREMERTON HIGH SCHOOL Location: 1500 13TH STREET, Grades: 9-12)MORGAN CENTER SCHOOL Location: 1500 13TH STREET, Grades: 10-12)RENAISSANCE ALTERNATIVE HIGH SCHOOL Location: 3400 1ST STREET, Grades: 7-12)FAIRVIEW JUNIOR HIGH SCHOOL Location: 8107 CENTRAL VALLEY RD NW, Grades: 7-9)OLYMPIC HIGH SCHOOL Location: 7070 STAMPEDE BLVD NW, Grades: 9-12)
EAST SIDE ALT Location: 7050 TIBARDIS RDNW, Grades: 10-12)
CK ONLINE ACADEMY Location: 7050 TIBARDIS ROAD, Grades: 9-12)
Private high schools in Bremerton: CROSSPOINT ACADEMY Students: 232, Location: 4012 CHICO WAY NW, Grades: KG-12)
ALTA VISTA SCHOOL Students: 16, Location: 245 4TH ST # 303, Grades: 7-12)
Biggest public elementary/middle schools in Bremerton: ARMIN JAHR ELEMENTARY Location: 800 DIBB STREET, Grades: KG-5)CROWNHILL ELEMENTARY SCHOOL Location: 1500 ROCKY POINT RD, Grades: KG-5)NAVAL AVENUE ELEMENTARY SCHOOL Location: 900 OLYMPIC AVENUE, Grades: PK-5)WEST HILLS S.T.E.M. ACADEMY Location: 520 S NATIONAL AVE, Grades: KG-8)
VIEW RIDGE ELEMENTARY SCHOOL Location: 3250 SPRUCE AVENUE, Grades: KG-5)KITSAP LAKE ELEMENTARY Location: 1111 CARR BLVD., Grades: KG-5)MOUNTAIN VIEW MIDDLE SCHOOL Location: 2400 PERRY AVENUE, Grades: 6-8)BREMERTON HOME LINK PROGRAM Location: 800 DIBB STREET, Grades: KG-8)
ESQUIRE HILLS ELEMENTARY Location: 2650 NE JOHN CARLSON RD, Grades: PK-6)JOHN D. BUD HAWK ELEMENTARY AT JACKSON PARK Location: 2900 AUSTIN DR, Grades: KG-6)
Private elementary/middle schools in Bremerton: PEACE LUTHERAN SCHOOL Students: 221, Location: 1234 NE RIDDELL RD, Grades: PK-8)
DISCOVERY DEPOT MONTESSORI Students: 86, Location: 7333 TRACYTON BLVD, Grades: PK-3)
CHRIST THE KING LUTHERAN SCHOOL Students: 73, Location: 8065 CHICO WAY NW, Grades: PK-8)
KITSAP ADVENTIST CHRISTIAN SCHOOL Students: 30, Location: 5088 NW TAYLOR RD, Grades: PK-8)
See full list of schools located in Bremerton Library in Bremerton: KITSAP REGIONAL LIBRARY Operating income: $9,603,383; Location: 1301 SYLVAN WAY; 436,076 books ; 499 e-books ; 30,740 audio materials ; 22,688 video materials ; 12 local licensed databases ; 11 state licensed databases ; 787 print serial subscriptions )
Notable locations in Bremerton: (A) , Gorst Creek Pump Plant (B) , Camp McKean (C) , Port Washington Marina (D) , Bremerton Ferry Landing (E) , Gold Mountain Golf Club (F) , Oyster Bay Plaza (G) , Manette Plaza (H) , Sheridan Village (I) , Bremerton (J) , Bremerton Marina (K) , Bremerton Wastewater Treatment Plant (L) , Bremerton Fire Department Station 3 (M) , Bremerton Ambulance (N) , Olympic Ambulance Bremerton Branch (O) , Puget Sound Federal Fire Department Puget Sound Naval Shipyard (P) , F H Morgan Childrens Center (Q) , Bremerton Senior Center (R) , Glenn Jarstad Aquatic Center (S) , Bremerton Fire Station 2 (T) . Display/hide their locations on the map
Shopping Centers: (1) , Perry Avenue Mall (2) . Display/hide their locations on the map
Churches in Bremerton include: (A) , Manette Community Church (B) , Abundant Life Foursquare Church (C) , West Side Baptist Church (D) , Bremerton Church of Christ (E) , First Christian Church of Bremerton (F) , Sonshine Baptist Fellowship Church (G) , Spirit Song Church (H) , Saint Paul's Episcopal Church (I) . Display/hide their locations on the map
Cemeteries: (1) , Ivy Green Cemetery (2) , Woodlawn Memorial Park (3) . Display/hide their locations on the map
Lakes and reservoirs: (A) , Heins Lake (B) , Twin Lakes (C) , Jarstad Lake (D) , Union River Reservoir (E) , Alexander Lake (F) , Reservoir Number Three (G) , Reservoir Number Four (H) . Display/hide their locations on the map
Creeks: (A) , Parish Creek (B) . Display/hide their locations on the map
Parks in Bremerton include: (1) , Evergreen Park (2) , Forest Ridge Park (3) , Sinclair Park (4) , East Park (5) , Sheridan Park (6) , Kiwanis Field (7) , Lebo Recreation Area (8) , Roosevelt Field (9) . Display/hide their locations on the map
Tourist attractions: (1) , Kitsap County Historical Society Inc (Museums; 280 4th Street) (2) , Bremerton Historic Ships Association (Museums; 300 Washington Beach Avenue) (3) , Northwest Paintball Park (Amusement & Theme Parks; 368 Northeast Waaga Way) (4) , N W Golf Range Timber Falls Mini Golf (Amusement & Theme Parks; Northwest Paintball Park) (5) . Display/hide their approximate locations on the map
Hotels: (1) , Flagship Inn (4320 Kitsap Way) (2) , Howard Johnson Plaza Hotel & Conference Center (5640 Kitsap Way) (3) , Kitsap Hospitality Services (1301 Northeast Mount Constance Lane) (4) , Chieftain Motel (Kitsap Way) (5) , Best Western Bremerton Inn (4303 Kitsap Way) (6) , Illahee Manor Bed & Breakfast Inn (6680 Illahee Road Northeast) (7) , McKenzie James & Sandra (4303 Kitsap Way) (8) , Hampton Inn & Suites (150 Washington Avenue) (9) . Display/hide their approximate locations on the map
Court: (1) . Display/hide its approximate location on the map
Birthplace of: Floyd Brown - Political pundit, L. Ron Hubbard - (1911-1986), founder of scientology, Mike Enzi - Politician, Nathan Adrian - College swimmer, Norman D. Dicks - Representative, Chuck Broyles - Football player and coach, Andy Anderson (baseball) - Professional baseball player and Army personnel, Ben Gibbard - Singer-songwriter, Benji Olson - 2005 NFL player (Tennessee Titans, born : Jun 5, 1975), Marvin Williams - NBA player (Atlanta Hawks, born : Jun 19, 1986).
Kitsap County has a predicted average indoor radon screening level less than 2 pCi/L (pico curies per liter) - Low Potential Drinking water stations with addresses in Bremerton and their reported violations in the past:
GOLDENS MOBILE HOME PARK (Population served: 24, Groundwater):
Past monitoring violations:
One regular monitoring violation
Drinking water stations with addresses in Bremerton that have no violations reported:
BREMERTON, CITY OF (Population served: 59,152, Primary Water Source Type: Surface water)
BREMERTON WEST 517 ZONE, CITY OF (Population served: 1,158, Primary Water Source Type: Groundwater)
Average household size: This city:
2.2 peopleWashington:
2.5 people
Percentage of family households: This city:
52.6%Whole state:
64.4%
Percentage of households with unmarried partners: This city:
9.1%Whole state:
7.7%
Likely homosexual households (counted as self-reported same-sex unmarried-partner households)
Lesbian couples: 0.6% of all households Gay men: 0.5% of all households
People in group quarters in Bremerton in 2010:
2,265 people in military ships
1,105 people in military barracks and dormitories (nondisciplinary)
350 people in nursing facilities/skilled-nursing facilities
202 people in other noninstitutional facilities
116 people in emergency and transitional shelters (with sleeping facilities) for people experiencing homelessness
78 people in military treatment facilities with assigned patients
69 people in group homes intended for adults
63 people in residential treatment centers for adults
5 people in maritime/merchant vessels
2 people in workers' group living quarters and job corps centers
People in group quarters in Bremerton in 2000:
1,891 people in military ships
348 people in nursing homes
108 people in military barracks, etc.
103 people in other noninstitutional group quarters
60 people in other nonhousehold living situations
53 people in schools, hospitals, or wards for the intellectually disabled
13 people in homes for the mentally ill
5 people in military transient quarters for temporary residents
5 people in homes for the physically handicapped
Banks with most branches in Bremerton (2011 data):
Kitsap Bank: West Bremerton Branch, East Bremerton Branch, 6th And Pacific Branch-Bremerton, Central Kitsap Branch. Info updated 2009/05/11: Bank assets: $903.9 mil, Deposits: $775.3 mil, headquarters in Port Orchard, WA, positive income , Commercial Lending Specialization, 22 total offices , Holding Company: Olympic Bancorp, Inc.
Wells Fargo Bank, National Association: Bremerton Branch, Safeway East Bremerton Branch, Bremerton Mb Branch. Info updated 2011/04/05: Bank assets: $1,161,490.0 mil, Deposits: $905,653.0 mil, headquarters in Sioux Falls, SD, positive income , 6395 total offices , Holding Company: Wells Fargo & Company
KeyBank National Association: Bremerton Branch at 3651 Wheaton Way, branch established on 1988/03/28; Wheaton Way Branch at 3570 Wheaton Way, branch established on 1987/04/27. Info updated 2008/03/03: Bank assets: $86,198.8 mil, Deposits: $64,214.8 mil, headquarters in Cleveland, OH, positive income , Commercial Lending Specialization, 1067 total offices , Holding Company: Keycorp
Bank of America, National Association: Bremerton Branch at 1000 Sixth Street, branch established on 1937/06/30; East Bremerton at 1600 Riddell Road Ne, branch established on 1979/06/09. Info updated 2009/11/18: Bank assets: $1,451,969.3 mil, Deposits: $1,077,176.8 mil, headquarters in Charlotte, NC, positive income , 5782 total offices , Holding Company: Bank Of America Corporation
JPMorgan Chase Bank, National Association: Bremerton at 500 Pacific Avenue #100, branch established on 1916/01/01; Kitsap at 5050 State Highway 303 Northeast, branch established on 1994/04/04. Info updated 2011/11/10: Bank assets: $1,811,678.0 mil, Deposits: $1,190,738.0 mil, headquarters in Columbus, OH, positive income , International Specialization, 5577 total offices , Holding Company: Jpmorgan Chase & Co.
Union Bank, National Association: Bremerton - Wheaton Way Branch at 3651 Wheaton Way, branch established on 2007/09/10. Info updated 2011/09/01: Bank assets: $88,967.5 mil, Deposits: $65,286.4 mil, headquarters in San Francisco, CA, positive income , Commercial Lending Specialization, 403 total offices , Holding Company: Mitsubishi Ufj Financial Group, Inc.
Armed Forces Bank, National Association: Bremerton Naval Base Branch at 120 S. Dewey Bldg 863, branch established on 2005/02/01. Info updated 2010/12/16: Bank assets: $1,839.7 mil, Deposits: $1,387.5 mil, headquarters in Fort Leavenworth, KS, negative income in the last year , Commercial Lending Specialization, 78 total offices , Holding Company: Dickinson Financial Corporation Ii
Washington Federal: Bremerton Branch at 5265 State Hwy 303 Ne, branch established on 1917/01/01. Info updated 2011/12/19: Bank assets: $13,653.0 mil, Deposits: $8,905.8 mil, headquarters in Seattle, WA, positive income , Mortgage Lending Specialization, 174 total offices
U.S. Bank National Association: Bremerton Branch at 2020 6th Street, branch established on 1933/09/01. Info updated 2012/01/30: Bank assets: $330,470.8 mil, Deposits: $236,091.5 mil, headquarters in Cincinnati, OH, positive income , 3121 total offices , Holding Company: U.S. Bancorp
For population 15 years and over in Bremerton:
Never married: 40.7%Now married: 38.7%Separated: 2.3%Widowed: 5.4%Divorced: 12.9% For population 25 years and over in Bremerton:
High school or higher: 93.5%Bachelor's degree or higher: 25.9%Graduate or professional degree: 8.0%Unemployed: 9.7%Mean travel time to work (commute): 23.9 minutes
Education Gini index (Inequality in education) Here:
10.7Washington average:
11.6
Religion statistics for Bremerton, WA (based on Kitsap County data)
Religion Adherents Congregations Evangelical Protestant 33,373 118 Other 12,378 42 Mainline Protestant 11,484 39 Catholic 8,572 5 Orthodox 140 2 Black Protestant 84 1 None 185,102 -
Source: Clifford Grammich, Kirk Hadaway, Richard Houseal, Dale E.Jones, Alexei Krindatch, Richie Stanley and Richard H.Taylor. 2012. 2010 U.S.Religion Census: Religious Congregations & Membership Study. Association of Statisticians of American Religious Bodies. Jones, Dale E., et al. 2002. Congregations and Membership in the United States 2000. Nashville, TN: Glenmary Research Center. Graphs represent county-level data
Food Environment Statistics: Number of grocery stores : 43Kitsap County :
1.81 / 10,000 pop.Washington :
2.06 / 10,000 pop.
Number of supercenters and club stores : 3This county :
0.13 / 10,000 pop.Washington :
0.19 / 10,000 pop.
Number of convenience stores (no gas) : 33Kitsap County :
1.39 / 10,000 pop.Washington :
1.18 / 10,000 pop.
Number of convenience stores (with gas) : 53Kitsap County :
2.23 / 10,000 pop.Washington :
2.67 / 10,000 pop.
Number of full-service restaurants : 173This county :
7.26 / 10,000 pop.Washington :
8.26 / 10,000 pop.
Adult diabetes rate : This county :
7.9%Washington :
7.7%
Adult obesity rate : This county :
27.6%Washington :
25.7%
Low-income preschool obesity rate : Kitsap County :
11.4%Washington :
13.9%
Health and Nutrition: Healthy diet rate : Bremerton:
50.6%State:
49.9%
Average overall health of teeth and gums : Here:
49.4%Washington:
47.2%
People feeling badly about themselves : Bremerton:
19.7%State:
20.9%
People not drinking alcohol at all : Average hours sleeping at night : This city:
6.8Washington:
6.8
Overweight people : Bremerton:
31.2%Washington:
32.8%
General health condition : Bremerton:
58.4%Washington:
56.8%
Average condition of hearing : Bremerton:
80.9%Washington:
79.4%
More about Health and Nutrition of Bremerton, WA Residents
Local government employment and payroll (March 2022)
Function
Full-time employees
Monthly full-time payroll
Average yearly full-time wage
Part-time employees
Monthly part-time payroll
Firefighters
65 $691,030 $127,575 0 $0 Police Protection - Officers
58 $560,082 $115,879 0 $0 Streets and Highways
50 $355,283 $85,268 0 $0 Other and Unallocable
38 $261,504 $82,580 4 $3,124 Sewerage
25 $157,550 $75,624 0 $0 Financial Administration
20 $152,750 $91,650 0 $0 Parks and Recreation
19 $123,582 $78,052 2 $2,002 Other Government Administration
16 $83,714 $62,786 0 $0 Judicial and Legal
15 $129,196 $103,357 1 $2,210 Housing and Community Development (Local)
13 $98,428 $90,857 0 $0 Water Supply
13 $106,452 $98,263 0 $0 Police - Other
8 $48,562 $72,843 1 $283 Natural Resources
2 $13,996 $83,976 0 $0 Solid Waste Management
1 $6,984 $83,808 0 $0 Fire - Other
1 $5,896 $70,752 0 $0 Correction
1 $6,576 $78,912 0 $0
Totals for Government
345 $2,801,585 $97,446 8 $7,619
Bremerton government finances - Expenditure in 2021 (per resident):
Construction - Regular Highways: $5,352,000 ($117.85)
Parks and Recreation: $1,240,000 ($27.30)Natural Resources - Other: $501,000 ($11.03)Housing and Community Development: $100,000 ($2.20)Local Fire Protection: $77,000 ($1.70)Current Operations - Sewerage: $14,324,000 ($315.40)
Police Protection: $12,471,000 ($274.60)Local Fire Protection: $11,864,000 ($261.24)Water Utilities: $11,060,000 ($243.53)Parks and Recreation: $7,002,000 ($154.18)Regular Highways: $3,818,000 ($84.07)General - Other: $3,332,000 ($73.37)Central Staff Services: $1,834,000 ($40.38)Financial Administration: $1,592,000 ($35.05)Correctional Institutions: $1,355,000 ($29.84)Judicial and Legal Services: $1,350,000 ($29.73)Parking Facilities: $1,110,000 ($24.44)Housing and Community Development: $1,045,000 ($23.01)Natural Resources - Other: $838,000 ($18.45)General Public Buildings: $834,000 ($18.36)Health - Other: $375,000 ($8.26)Protective Inspection and Regulation - Other: $193,000 ($4.25)Corrections - Other: $116,000 ($2.55)Miscellaneous Commercial Activities - Other: $64,000 ($1.41)Libraries: $24,000 ($0.53)General - Interest on Debt: $3,431,000 ($75.55)
Other Capital Outlay - Water Utilities: $2,484,000 ($54.70)
Sewerage: $2,348,000 ($51.70)Natural Resources - Other: $370,000 ($8.15)General - Other: $99,000 ($2.18)Regular Highways: $49,000 ($1.08)Parks and Recreation: $46,000 ($1.01)Total Salaries and Wages: $29,800,000 ($656.17)
Water Utilities - Interest on Debt: $477,000 ($10.50)
Bremerton government finances - Revenue in 2021 (per resident):
Charges - Sewerage: $20,203,000 ($444.85)
Parks and Recreation: $4,028,000 ($88.69)Other: $3,102,000 ($68.30)Regular Highways: $144,000 ($3.17)Housing and Community Development: $34,000 ($0.75)Miscellaneous Commercial Activities: $22,000 ($0.48)Federal Intergovernmental - Housing and Community Development: $937,000 ($20.63)
Other: $277,000 ($6.10)Health and Hospitals: $49,000 ($1.08)Local Intergovernmental - Other: $93,000 ($2.05)
Miscellaneous - Rents: $1,812,000 ($39.90)
Fines and Forfeits: $1,375,000 ($30.28)Interest Earnings: $814,000 ($17.92)General Revenue - Other: $495,000 ($10.90)Donations From Private Sources: $31,000 ($0.68)Special Assessments: $20,000 ($0.44)Revenue - Water Utilities: $13,882,000 ($305.67)
State Intergovernmental - Other: $4,174,000 ($91.91)
Health and Hospitals: $1,899,000 ($41.81)Highways: $1,497,000 ($32.96)General Local Government Support: $718,000 ($15.81)Tax - Public Utilities Sales: $11,292,000 ($248.64)
Property: $11,240,000 ($247.50)General Sales and Gross Receipts: $11,124,000 ($244.94)Occupation and Business License - Other: $3,540,000 ($77.95)Documentary and Stock Transfer: $2,178,000 ($47.96)Other Selective Sales: $1,219,000 ($26.84)Other License: $897,000 ($19.75)Motor Vehicle License: $593,000 ($13.06)Amusements Sales: $32,000 ($0.70)
Bremerton government finances - Debt in 2021 (per resident):
Long Term Debt - Beginning Outstanding - Unspecified Public Purpose: $97,710,000 ($2151.49)
Outstanding Unspecified Public Purpose: $96,567,000 ($2126.32)Retired Unspecified Public Purpose: $6,131,000 ($135.00)Issue, Unspecified Public Purpose: $4,987,000 ($109.81)
8.72% of this county's 2021 resident taxpayers lived in other counties in 2020 ($89,569 average adjusted gross income )
Here:
8.72%Washington average:
7.53%
0.23% of residents moved from foreign countries ($1,775 average AGI )Kitsap County:
0.23%Washington average:
0.05%
Top counties from which taxpayers relocated into this county between 2020 and 2021:
8.34% of this county's 2020 resident taxpayers moved to other counties in 2021 ($88,661 average adjusted gross income )
Here:
8.34%Washington average:
7.40%
0.15% of residents moved to foreign countries ($1,281 average AGI )Kitsap County:
0.15%Washington average:
0.04%
Top counties to which taxpayers relocated from this county between 2020 and 2021:
Businesses in Bremerton, WA
Name Count Name Count
7-Eleven 2 Mazda 1 Albertsons 1 McDonald's 5 Arby's 1 New Balance 1 AutoZone 2 Nike 3 Baskin-Robbins 1 Nissan 1 Blockbuster 1 Outback 1 Budget Car Rental 1 Outback Steakhouse 1 Burger King 3 Papa John's Pizza 1 Chevrolet 1 Pizza Hut 2 Cold Stone Creamery 1 Quality 1 Curves 1 Quiznos 1 Dairy Queen 1 RadioShack 1 Dennys 1 Rite Aid 2 Discount Tire 1 Safeway 1 Domino's Pizza 2 Starbucks 5 FedEx 7 Subaru 1 Firestone Complete Auto Care 1 Subway 7 Ford 1 Super 8 1 GNC 1 T-Mobile 1 H&R Block 3 Taco Bell 2 Hilton 1 Toyota 1 Honda 1 True Value 1 Jack In The Box 2 U-Haul 3 KFC 1 UPS 7 Kroger 3 Volkswagen 1 Lane Furniture 1 Vons 2 Little Caesars Pizza 1 Walgreens 1 Lowe's 1 Walmart 1 Marriott 1 YMCA 1
Strongest AM radio stations in Bremerton:
KBRO (1490 AM; 1 kW; BREMERTON, WA; Owner: FTP CORPORATION)
KKOL (1300 AM; 50 kW; SEATTLE, WA; Owner: INSPIRATION MEDIA, INC.)
KGNW (820 AM; 50 kW; BURIEN-SEATTLE, WA; Owner: INSPIRATION MEDIA, INC.)
KOMO (1000 AM; 50 kW; SEATTLE, WA; Owner: FISHER BROADCASTING - SEATTLE RADIO, L.L.C.)
KIRO (710 AM; 50 kW; SEATTLE, WA; Owner: ENTERCOM SEATTLE LICENSE, LLC)
KTTH (770 AM; 50 kW; SEATTLE, WA; Owner: ENTERCOM SEATTLE LICENSE, LLC)
KYCW (1090 AM; 50 kW; SEATTLE, WA; Owner: INFINITY RADIO SUBSIDIARY OPERATIONS INC.)
KIXI (880 AM; 50 kW; MERCER ISLAND/SEATTL, WA; Owner: BELLEVUE RADIO, INC.)
KLFE (1590 AM; 10 kW; SEATTLE, WA; Owner: INSPIRATION MEDIA, INC.)
KJR (950 AM; 50 kW; SEATTLE, WA)
KITZ (1400 AM; 1 kW; SILVERDALE, WA; Owner: KITZ RADIO, INC.)
KVI (570 AM; 5 kW; SEATTLE, WA; Owner: FISHER BROADCASTING - SEATTLE RADIO, L.L.C.)
KNWX (1210 AM; 28 kW; AUBURN-FEDERAL WAY, WA; Owner: ENTERCOM SEATTLE LICENSE, LLC)
Strongest FM radio stations in Bremerton:
K205DD (88.9 FM; BREMERTON, WA; Owner: CALVARY CHAPEL OF TWIN FALLS, INC.)
KQBZ (100.7 FM; SEATTLE, WA; Owner: ENTERCOM SEATTLE LICENSE, LLC)
KISW (99.9 FM; SEATTLE, WA; Owner: ENTERCOM SEATTLE LICENSE, LLC)
KMTT (103.7 FM; TACOMA, WA; Owner: ENTERCOM SEATTLE LICENSE, LLC)
KNDD (107.7 FM; SEATTLE, WA; Owner: ENTERCOM SEATTLE LICENSE, LLC)
KRWM (106.9 FM; BREMERTON, WA; Owner: SEASCAPE RADIO, INC.)
KYPT (96.5 FM; SEATTLE, WA; Owner: INFINITY RADIO SUBSIDIARY OPERATIONS INC.)
KBSG-FM (97.3 FM; TACOMA, WA; Owner: ENTERCOM SEATTLE LICENSE, LLC)
KCMS (105.3 FM; EDMONDS, WA; Owner: CRISTA MINISTRIES, INC.)
KBKS (106.1 FM; TACOMA, WA; Owner: INFINITY RADIO SUBSIDIARY OPERATIONS INC.)
KING-FM (98.1 FM; SEATTLE, WA; Owner: CLASSIC RADIO, INC.)
KLSY-FM (92.5 FM; BELLEVUE, WA; Owner: BELLEVUE RADIO INC.)
KPLU-FM (88.5 FM; TACOMA, WA; Owner: PACIFIC LUTHERAN UNIVERSITY, INC.)
KWJZ (98.9 FM; SEATTLE, WA; Owner: ORCA RADIO, INC.)
KZOK-FM (102.5 FM; SEATTLE, WA; Owner: INFINITY RADIO SUBSIDIARY OPERATIONS INC.)
KMPS-FM (94.1 FM; SEATTLE, WA; Owner: INFINITY RADIO SUBSIDIARY OPERATIONS INC.)
KUOW (94.9 FM; SEATTLE, WA; Owner: THE UNIVERSITY OF WASHINGTON)
KJR-FM (95.7 FM; SEATTLE, WA; Owner: ACKERLEY MEDIA GROUP, INC.)
KUBE (93.3 FM; SEATTLE, WA; Owner: ACKERLEY MEDIA GROUP, INC.)
KPLZ-FM (101.5 FM; SEATTLE, WA; Owner: FISHER BROADCASTING - SEATTLE RADIO, L.L.C.)
TV broadcast stations around Bremerton:
KCPQ (Channel 13; TACOMA, WA; Owner: TRIBUNE TELEVISION NORTHWEST, INC.)
KING-TV (Channel 5; SEATTLE, WA; Owner: KING BROADCASTING COMPANY)
KSTW (Channel 11; TACOMA, WA; Owner: UPN TELEVISION STATIONS INC.)
K58DP (Channel 58; SEATTLE, WA; Owner: WORD OF GOD FELLOWSHIP, INC.)
KOMO-TV (Channel 4; SEATTLE, WA; Owner: FISHER BROADCASTING - SEATTLE TV, L.L.C.)
KTWB-TV (Channel 22; SEATTLE, WA; Owner: TRIBUNE TELEVISION HOLDINGS, INC.)
KIRO-TV (Channel 7; SEATTLE, WA; Owner: KIRO-TV HOLDINGS, INC.)
KTBW-TV (Channel 20; TACOMA, WA; Owner: TRINITY BROADCASTING OF WASHINGTON)
KCTS-TV (Channel 9; SEATTLE, WA; Owner: KCTS TELEVISION)
K57HB (Channel 57; EUREKA, CA; Owner: MS COMMUNICATIONS, LLC)
KONG-TV (Channel 16; EVERETT, WA; Owner: KONG-TV, INC.)
K68DL (Channel 68; SEATTLE, WA; Owner: THREE ANGELS BROADCASTING NETWORK)
KHCV (Channel 45; SEATTLE, WA; Owner: NORTH PACIFIC INTERNATIONAL TELEVISION, INC.)
KWPX (Channel 33; BELLEVUE, WA; Owner: PAXSON COMMUNICATIONS LICENSE COMPANY, LLC)
KBTC-TV (Channel 28; TACOMA, WA; Owner: BATES TECHNICAL COLLEGE)
K54AO (Channel 54; BREMERTON, WA; Owner: KIRO-TV HOLDINGS, INC.)
KWDK (Channel 56; TACOMA, WA; Owner: PUGET SOUND EDUCATIONAL TV, INC.)
National Bridge Inventory (NBI) Statistics 27 Number of bridges627ft / 191m Total length $98,909,000 Total costs540,814 Total average daily traffic30,411 Total average daily truck traffic
New bridges - historical statistics
5 1950-1959 5 1960-1969 5 1970-1979 2 1980-1989 5 1990-1999 3 2000-2009 1 2010-2019 1 2020-2022
See full National Bridge Inventory statistics for Bremerton, WA
Home Mortgage Disclosure Act Aggregated Statistics For Year 2009(Based on 6 full and 9 partial tracts) A) FHA, FSA/RHS & VA B) Conventional C) Refinancings D) Home Improvement Loans E) Loans on Dwellings For 5+ Families F) Non-occupant Loans on G) Loans On Manufactured Number Average Value Number Average Value Number Average Value Number Average Value Number Average Value Number Average Value Number Average Value
LOANS ORIGINATED 225 $183,572 114 $158,628 705 $182,998 33 $93,271 1 $4,176,090 90 $155,979 14 $167,261 APPLICATIONS APPROVED, NOT ACCEPTED 10 $192,341 16 $148,971 65 $183,350 10 $27,261 1 $8,917,810 10 $132,635 2 $135,775 APPLICATIONS DENIED 25 $180,926 32 $160,789 243 $190,924 29 $71,545 2 $305,365 35 $137,564 6 $113,645 APPLICATIONS WITHDRAWN 24 $186,055 20 $158,778 162 $198,704 10 $112,515 2 $277,500 19 $160,824 2 $201,620 FILES CLOSED FOR INCOMPLETENESS 4 $169,502 7 $127,803 43 $184,906 3 $95,983 0 $0 5 $145,532 2 $137,835
Aggregated Statistics For Year 2008(Based on 7 full and 9 partial tracts) A) FHA, FSA/RHS & VA B) Conventional C) Refinancings D) Home Improvement Loans E) Loans on Dwellings For 5+ Families F) Non-occupant Loans on G) Loans On Manufactured Number Average Value Number Average Value Number Average Value Number Average Value Number Average Value Number Average Value Number Average Value
LOANS ORIGINATED 136 $200,968 175 $181,482 525 $187,535 64 $77,998 10 $1,472,046 113 $154,355 25 $162,904 APPLICATIONS APPROVED, NOT ACCEPTED 16 $191,118 25 $236,011 77 $188,714 12 $106,458 1 $305,380 15 $195,885 4 $107,755 APPLICATIONS DENIED 20 $176,719 45 $198,556 344 $193,666 93 $96,036 3 $345,667 61 $183,431 18 $139,135 APPLICATIONS WITHDRAWN 17 $211,461 34 $192,905 159 $199,314 14 $120,301 0 $0 26 $161,957 7 $140,230 FILES CLOSED FOR INCOMPLETENESS 1 $157,670 6 $193,203 29 $191,577 3 $16,320 1 $605,000 6 $153,363 1 $97,730
Aggregated Statistics For Year 2007(Based on 7 full and 9 partial tracts) A) FHA, FSA/RHS & VA B) Conventional C) Refinancings D) Home Improvement Loans E) Loans on Dwellings For 5+ Families F) Non-occupant Loans on G) Loans On Manufactured Number Average Value Number Average Value Number Average Value Number Average Value Number Average Value Number Average Value Number Average Value
LOANS ORIGINATED 102 $217,793 551 $191,454 835 $167,667 111 $78,108 5 $1,784,242 299 $177,434 24 $162,499 APPLICATIONS APPROVED, NOT ACCEPTED 5 $260,354 84 $184,424 133 $190,154 19 $95,986 0 $0 30 $157,980 4 $153,212 APPLICATIONS DENIED 12 $188,301 147 $187,010 525 $189,544 116 $91,513 1 $501,960 108 $202,200 16 $99,473 APPLICATIONS WITHDRAWN 13 $194,542 90 $200,199 233 $179,023 30 $119,777 0 $0 49 $190,835 8 $153,131 FILES CLOSED FOR INCOMPLETENESS 0 $0 6 $263,462 74 $212,051 4 $193,272 0 $0 13 $214,875 2 $108,585
Aggregated Statistics For Year 2006(Based on 7 full and 9 partial tracts) A) FHA, FSA/RHS & VA B) Conventional C) Refinancings D) Home Improvement Loans E) Loans on Dwellings For 5+ Families F) Non-occupant Loans on G) Loans On Manufactured Number Average Value Number Average Value Number Average Value Number Average Value Number Average Value Number Average Value Number Average Value
LOANS ORIGINATED 98 $204,219 819 $144,055 965 $151,392 139 $83,382 10 $1,714,927 372 $149,021 30 $134,393 APPLICATIONS APPROVED, NOT ACCEPTED 8 $191,749 129 $133,319 159 $153,497 29 $99,268 0 $0 58 $130,423 4 $123,925 APPLICATIONS DENIED 8 $193,344 244 $153,344 451 $167,814 129 $75,556 2 $146,500 110 $174,441 14 $114,471 APPLICATIONS WITHDRAWN 11 $200,680 138 $137,431 395 $155,844 48 $99,710 4 $467,685 60 $152,620 7 $110,406 FILES CLOSED FOR INCOMPLETENESS 4 $181,395 11 $128,356 78 $167,866 6 $139,937 0 $0 8 $124,016 3 $186,727
Aggregated Statistics For Year 2005(Based on 6 full and 9 partial tracts) A) FHA, FSA/RHS & VA B) Conventional C) Refinancings D) Home Improvement Loans E) Loans on Dwellings For 5+ Families F) Non-occupant Loans on G) Loans On Manufactured Number Average Value Number Average Value Number Average Value Number Average Value Number Average Value Number Average Value Number Average Value
LOANS ORIGINATED 89 $179,373 892 $132,030 1,007 $137,732 119 $79,540 8 $1,420,345 453 $138,361 32 $133,285 APPLICATIONS APPROVED, NOT ACCEPTED 5 $164,268 97 $138,347 130 $131,607 16 $58,268 1 $375,000 42 $128,973 2 $148,540 APPLICATIONS DENIED 12 $171,084 140 $119,891 493 $130,569 104 $66,288 2 $406,360 97 $136,470 17 $118,215 APPLICATIONS WITHDRAWN 14 $180,481 132 $136,149 375 $141,986 57 $125,635 0 $0 71 $138,864 9 $132,518 FILES CLOSED FOR INCOMPLETENESS 0 $0 22 $103,462 110 $145,440 3 $68,447 0 $0 8 $107,558 3 $144,397
Aggregated Statistics For Year 2004(Based on 7 full and 9 partial tracts) A) FHA, FSA/RHS & VA B) Conventional C) Refinancings D) Home Improvement Loans E) Loans on Dwellings For 5+ Families F) Non-occupant Loans on G) Loans On Manufactured Number Average Value Number Average Value Number Average Value Number Average Value Number Average Value Number Average Value Number Average Value
LOANS ORIGINATED 127 $144,041 715 $117,099 953 $120,676 92 $52,817 12 $381,072 400 $111,463 33 $108,358 APPLICATIONS APPROVED, NOT ACCEPTED 12 $154,951 97 $110,369 176 $110,740 17 $45,348 2 $1,011,185 40 $112,834 5 $102,288 APPLICATIONS DENIED 18 $132,289 129 $105,288 536 $115,343 96 $39,619 7 $222,730 91 $108,059 20 $70,044 APPLICATIONS WITHDRAWN 11 $158,115 99 $112,418 394 $121,063 23 $66,863 1 $265,850 55 $96,767 10 $97,425 FILES CLOSED FOR INCOMPLETENESS 1 $98,000 11 $129,692 109 $132,291 8 $51,516 0 $0 8 $89,985 2 $99,075
Aggregated Statistics For Year 2003(Based on 7 full and 9 partial tracts) A) FHA, FSA/RHS & VA B) Conventional C) Refinancings D) Home Improvement Loans E) Loans on Dwellings For 5+ Families F) Non-occupant Loans on Number Average Value Number Average Value Number Average Value Number Average Value Number Average Value Number Average Value
LOANS ORIGINATED 196 $128,737 531 $111,613 1,644 $108,659 78 $19,921 14 $892,290 372 $93,747 APPLICATIONS APPROVED, NOT ACCEPTED 12 $125,413 73 $104,760 216 $111,378 20 $21,992 0 $0 56 $101,299 APPLICATIONS DENIED 28 $119,511 120 $95,348 484 $110,196 71 $26,285 2 $202,150 90 $103,662 APPLICATIONS WITHDRAWN 15 $119,583 65 $103,173 469 $111,763 14 $22,249 1 $863,340 65 $96,083 FILES CLOSED FOR INCOMPLETENESS 6 $107,993 5 $96,710 59 $133,097 3 $23,327 0 $0 9 $82,678
Aggregated Statistics For Year 2002(Based on 6 full and 8 partial tracts) A) FHA, FSA/RHS & VA B) Conventional C) Refinancings D) Home Improvement Loans E) Loans on Dwellings For 5+ Families F) Non-occupant Loans on Number Average Value Number Average Value Number Average Value Number Average Value Number Average Value Number Average Value
LOANS ORIGINATED 196 $110,710 386 $96,219 892 $98,814 83 $15,924 8 $579,351 249 $81,854 APPLICATIONS APPROVED, NOT ACCEPTED 17 $97,805 53 $94,318 143 $98,178 16 $16,637 0 $0 35 $81,375 APPLICATIONS DENIED 15 $109,898 68 $89,310 297 $98,079 72 $16,336 0 $0 48 $80,483 APPLICATIONS WITHDRAWN 20 $101,571 49 $93,707 252 $99,404 12 $24,073 0 $0 45 $79,210 FILES CLOSED FOR INCOMPLETENESS 6 $92,593 11 $91,191 70 $94,043 3 $38,733 0 $0 14 $76,850
Aggregated Statistics For Year 2001(Based on 6 full and 8 partial tracts) A) FHA, FSA/RHS & VA B) Conventional C) Refinancings D) Home Improvement Loans E) Loans on Dwellings For 5+ Families F) Non-occupant Loans on Number Average Value Number Average Value Number Average Value Number Average Value Number Average Value Number Average Value
LOANS ORIGINATED 214 $102,525 274 $94,350 716 $95,519 91 $14,409 6 $1,644,918 142 $81,892 APPLICATIONS APPROVED, NOT ACCEPTED 14 $100,476 41 $90,809 87 $85,162 17 $21,647 0 $0 21 $74,337 APPLICATIONS DENIED 12 $96,515 68 $80,740 311 $89,682 100 $14,973 0 $0 42 $74,276 APPLICATIONS WITHDRAWN 18 $111,534 70 $96,459 241 $98,204 17 $35,151 2 $3,159,245 32 $67,555 FILES CLOSED FOR INCOMPLETENESS 4 $92,215 12 $67,937 56 $101,985 0 $0 1 $1,823,070 14 $78,645
Aggregated Statistics For Year 2000(Based on 6 full and 8 partial tracts) A) FHA, FSA/RHS & VA B) Conventional C) Refinancings D) Home Improvement Loans E) Loans on Dwellings For 5+ Families F) Non-occupant Loans on Number Average Value Number Average Value Number Average Value Number Average Value Number Average Value Number Average Value
LOANS ORIGINATED 191 $93,503 276 $85,545 205 $76,913 122 $16,313 2 $114,385 86 $67,119 APPLICATIONS APPROVED, NOT ACCEPTED 16 $82,356 46 $73,416 62 $82,726 36 $17,029 0 $0 17 $72,477 APPLICATIONS DENIED 21 $97,143 99 $79,061 198 $71,499 97 $20,011 0 $0 37 $75,767 APPLICATIONS WITHDRAWN 21 $92,735 49 $75,161 98 $77,392 17 $40,272 1 $93,380 12 $57,084 FILES CLOSED FOR INCOMPLETENESS 3 $60,183 9 $103,053 75 $95,154 2 $15,170 0 $0 6 $76,988
Aggregated Statistics For Year 1999(Based on 6 full and 11 partial tracts) A) FHA, FSA/RHS & VA B) Conventional C) Refinancings D) Home Improvement Loans E) Loans on Dwellings For 5+ Families F) Non-occupant Loans on Number Average Value Number Average Value Number Average Value Number Average Value Number Average Value Number Average Value
LOANS ORIGINATED 204 $92,767 257 $88,623 404 $85,687 155 $15,772 3 $612,480 102 $69,767 APPLICATIONS APPROVED, NOT ACCEPTED 14 $92,736 44 $80,356 74 $87,943 38 $14,689 1 $328,700 15 $56,707 APPLICATIONS DENIED 23 $85,779 128 $84,507 213 $80,113 110 $18,915 0 $0 34 $66,406 APPLICATIONS WITHDRAWN 22 $87,844 55 $90,691 151 $80,060 24 $41,758 0 $0 18 $65,288 FILES CLOSED FOR INCOMPLETENESS 1 $119,520 11 $71,984 85 $90,004 0 $0 0 $0 7 $75,414
Detailed mortgage data for all 16 tracts in Bremerton, WA
Private Mortgage Insurance Companies Aggregated Statistics For Year 2009(Based on 5 full and 9 partial tracts) A) Conventional B) Refinancings C) Non-occupant Loans on Number Average Value Number Average Value Number Average Value
LOANS ORIGINATED 18 $200,896 8 $238,925 1 $102,780 APPLICATIONS APPROVED, NOT ACCEPTED 9 $202,290 8 $219,340 1 $227,530 APPLICATIONS DENIED 3 $219,557 7 $255,904 1 $237,190 APPLICATIONS WITHDRAWN 3 $230,333 1 $161,390 0 $0 FILES CLOSED FOR INCOMPLETENESS 0 $0 0 $0 0 $0
Aggregated Statistics For Year 2008(Based on 5 full and 9 partial tracts) A) Conventional B) Refinancings C) Non-occupant Loans on Number Average Value Number Average Value Number Average Value
LOANS ORIGINATED 72 $176,935 40 $204,663 18 $147,487 APPLICATIONS APPROVED, NOT ACCEPTED 27 $175,404 15 $224,994 7 $240,219 APPLICATIONS DENIED 7 $216,883 7 $164,033 5 $149,228 APPLICATIONS WITHDRAWN 4 $213,098 3 $189,590 1 $311,310 FILES CLOSED FOR INCOMPLETENESS 5 $204,158 1 $384,000 1 $252,000
Aggregated Statistics For Year 2007(Based on 6 full and 9 partial tracts) A) Conventional B) Refinancings C) Non-occupant Loans on Number Average Value Number Average Value Number Average Value
LOANS ORIGINATED 161 $199,254 50 $205,006 24 $186,471 APPLICATIONS APPROVED, NOT ACCEPTED 18 $207,258 10 $292,008 6 $208,055 APPLICATIONS DENIED 3 $162,660 2 $200,600 1 $219,480 APPLICATIONS WITHDRAWN 11 $202,836 4 $186,820 0 $0 FILES CLOSED FOR INCOMPLETENESS 1 $238,530 1 $565,540 0 $0
Aggregated Statistics For Year 2006(Based on 5 full and 9 partial tracts) A) Conventional B) Refinancings C) Non-occupant Loans on D) Loans On Manufactured Number Average Value Number Average Value Number Average Value Number Average Value
LOANS ORIGINATED 78 $184,180 36 $193,784 13 $174,818 1 $101,130 APPLICATIONS APPROVED, NOT ACCEPTED 8 $212,772 7 $175,163 1 $110,340 0 $0 APPLICATIONS DENIED 0 $0 0 $0 0 $0 0 $0 APPLICATIONS WITHDRAWN 4 $272,190 4 $215,345 1 $333,000 0 $0 FILES CLOSED FOR INCOMPLETENESS 2 $281,855 0 $0 0 $0 0 $0
Aggregated Statistics For Year 2005(Based on 5 full and 9 partial tracts) A) Conventional B) Refinancings C) Non-occupant Loans on D) Loans On Manufactured Number Average Value Number Average Value Number Average Value Number Average Value
LOANS ORIGINATED 116 $170,186 55 $162,834 44 $173,409 1 $183,850 APPLICATIONS APPROVED, NOT ACCEPTED 8 $135,390 7 $191,191 0 $0 1 $105,000 APPLICATIONS DENIED 1 $58,250 0 $0 0 $0 0 $0 APPLICATIONS WITHDRAWN 1 $161,170 1 $227,870 1 $186,110 0 $0 FILES CLOSED FOR INCOMPLETENESS 1 $67,330 0 $0 0 $0 0 $0
Aggregated Statistics For Year 2004(Based on 5 full and 9 partial tracts) A) Conventional B) Refinancings C) Non-occupant Loans on D) Loans On Manufactured Number Average Value Number Average Value Number Average Value Number Average Value
LOANS ORIGINATED 170 $134,509 57 $144,976 69 $136,163 3 $96,673 APPLICATIONS APPROVED, NOT ACCEPTED 25 $125,684 17 $138,337 13 $125,659 0 $0 APPLICATIONS DENIED 4 $161,750 1 $161,030 3 $177,343 0 $0 APPLICATIONS WITHDRAWN 5 $119,824 5 $153,124 3 $116,557 0 $0 FILES CLOSED FOR INCOMPLETENESS 1 $150,820 1 $93,690 0 $0 1 $110,000
Aggregated Statistics For Year 2003(Based on 5 full and 9 partial tracts) A) Conventional B) Refinancings C) Non-occupant Loans on Number Average Value Number Average Value Number Average Value
LOANS ORIGINATED 183 $124,085 132 $131,115 61 $117,273 APPLICATIONS APPROVED, NOT ACCEPTED 13 $121,347 32 $122,110 7 $93,973 APPLICATIONS DENIED 2 $114,670 6 $130,392 1 $123,000 APPLICATIONS WITHDRAWN 7 $123,353 8 $142,456 4 $147,250 FILES CLOSED FOR INCOMPLETENESS 0 $0 0 $0 0 $0
Aggregated Statistics For Year 2002(Based on 5 full and 8 partial tracts) A) Conventional B) Refinancings C) Non-occupant Loans on Number Average Value Number Average Value Number Average Value
LOANS ORIGINATED 131 $105,027 87 $117,501 44 $83,897 APPLICATIONS APPROVED, NOT ACCEPTED 13 $96,333 18 $121,753 4 $68,150 APPLICATIONS DENIED 4 $110,225 4 $116,990 2 $84,450 APPLICATIONS WITHDRAWN 2 $87,725 3 $129,853 1 $70,600 FILES CLOSED FOR INCOMPLETENESS 1 $66,000 0 $0 1 $66,000
Aggregated Statistics For Year 2001(Based on 5 full and 8 partial tracts) A) Conventional B) Refinancings C) Non-occupant Loans on Number Average Value Number Average Value Number Average Value
LOANS ORIGINATED 109 $100,367 74 $114,841 22 $79,826 APPLICATIONS APPROVED, NOT ACCEPTED 10 $94,307 13 $101,291 5 $75,646 APPLICATIONS DENIED 7 $92,027 9 $138,307 2 $75,465 APPLICATIONS WITHDRAWN 4 $80,525 0 $0 0 $0 FILES CLOSED FOR INCOMPLETENESS 1 $166,170 0 $0 0 $0
Aggregated Statistics For Year 2000(Based on 5 full and 8 partial tracts) A) Conventional B) Refinancings C) Non-occupant Loans on Number Average Value Number Average Value Number Average Value
LOANS ORIGINATED 100 $88,105 22 $110,633 13 $72,017 APPLICATIONS APPROVED, NOT ACCEPTED 5 $107,622 3 $107,473 1 $80,040 APPLICATIONS DENIED 1 $101,640 3 $107,167 2 $76,035 APPLICATIONS WITHDRAWN 0 $0 2 $89,460 2 $80,910 FILES CLOSED FOR INCOMPLETENESS 1 $105,000 0 $0 0 $0
Aggregated Statistics For Year 1999(Based on 4 full and 11 partial tracts) A) Conventional B) Refinancings C) Non-occupant Loans on Number Average Value Number Average Value Number Average Value
LOANS ORIGINATED 103 $97,055 28 $114,829 7 $86,807 APPLICATIONS APPROVED, NOT ACCEPTED 8 $80,232 8 $85,514 4 $72,032 APPLICATIONS DENIED 5 $92,066 2 $99,250 0 $0 APPLICATIONS WITHDRAWN 2 $63,720 1 $67,870 0 $0 FILES CLOSED FOR INCOMPLETENESS 1 $100,190 1 $172,450 0 $0
Fire-safe hotels and motels in Bremerton, Washington:
Quality Inn & Suites, 4303 Kitsap Way, Bremerton, Washington 98312 Phone: (360) 405-1111, Fax: (360) 377-0597
Baymont Inn & Suites Bremerton, 5640 Kitsap Way, Bremerton, Washington 98312 Phone: (360) 377-7666, Fax: (360) 479-5028
Midway Inn Corp., 2909 Wheaton Way, Bremerton, Washington 98310 Phone: (800) 231-0575, Fax: (360) 479-1576
Hampton Inn & Suites Bremerton Harborside, 150 Washington Ave, Bremerton, Washington 98337 Phone: (360) 405-0200, Fax: (360) 405-0618
Fairfield Inn & Suites Seattle Bremerton, 239 4th St, Bremerton, Washington 98337 Phone: (360) 377-2111, Fax: (360) 377-2777
Oyster Bay Inn & Restaurant, 4412 Kitsap Way, Bremerton, Washington 98312 Phone: (360) 377-5510, Fax: (360) 377-5549
All 6 fire-safe hotels and motels in Bremerton, Washington
Most common first names in Bremerton, WA among deceased individuals Name Count Lived (average)
John 434 75.3 years William 365 75.4 years Robert 341 70.8 years Mary 307 78.7 years James 288 71.4 years George 236 76.3 years Charles 213 74.8 years Helen 204 80.0 years Margaret 198 79.2 years Dorothy 167 77.2 years
Most common last names in Bremerton, WA among deceased individuals Last name Count Lived (average)
Johnson 184 77.4 years Smith 148 77.6 years Anderson 106 74.9 years Jones 91 76.5 years Brown 89 74.4 years Nelson 84 77.7 years Davis 75 75.2 years Peterson 72 77.4 years Miller 71 74.1 years Olson 70 77.0 years
Bremerton compared to Washington state average:
Foreign-born population percentage below state average. Renting percentage above state average. Length of stay since moving in significantly above state average. House age above state average.
#7 on the list of "Top 101 cities with the largest percentage of people in military ships (population 1,000+)"
#31 on the list of "Top 101 cities with the most people taking a ferryboat to work (population 5,000+)"
#42 on the list of "Top 101 cities with the most residents born in Other Western Europe (population 500+)"
#84 on the list of "Top 101 cities with the largest percentage of people in military transient quarters for temporary residents (population 1,000+)"
#39 (98337) on the list of "Top 101 zip codes with the smallest percentage of taxpayers using paid preparers for 2012 taxes (pop 5,000+)"
#17 on the list of "Top 101 counties with the lowest Particulate Matter (PM2.5 ) Annual air pollution readings in 2012 (µg/m3 )"
#26 on the list of "Top 101 counties with the highest percentage of residents relocating from foreign countries between 2010 and 2011"
#36 on the list of "Top 101 counties with the highest average weight of females"
#38 on the list of "Top 101 counties with the highest percentage of residents relocating to foreign countries in 2011 (pop. 50,000+)"
#42 on the list of "Top 101 counties with the highest percentage of residents that exercised in the past month"
Top Patent Applicants
Frank Gorgenyi (16)
Stephen Van De Walker Handy (8)
Mark J. Clemen, Jr. (7)
Steven M. Harrison (6)
Chal S. Davidson (4)
Vincent S. Peddle (4)
Steven Mark Harrison (4)
Joseph L. Donnelly (3)
Austin M. Given (3)
Martin Holladay (3)
Total of 132 patent applications in 2008-2024.


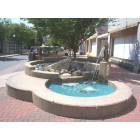

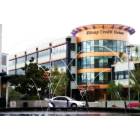


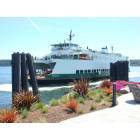
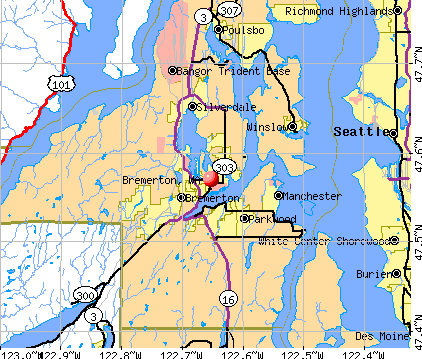


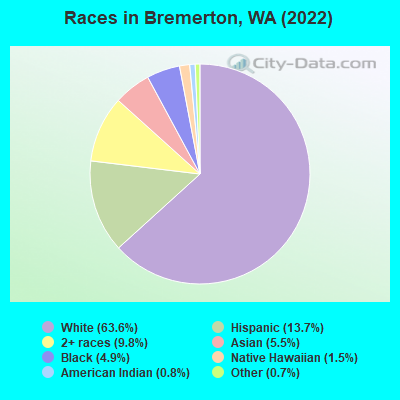
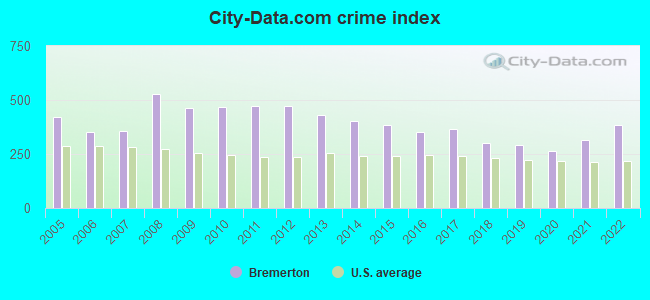
 Recent articles from our blog. Our writers, many of them Ph.D. graduates or candidates, create easy-to-read articles on a wide variety of topics.

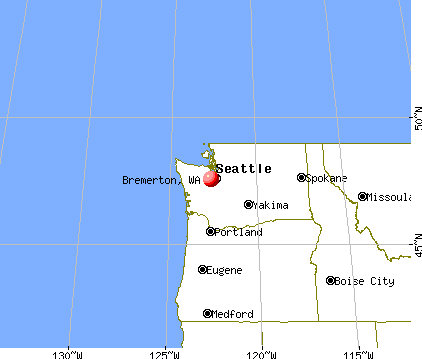
 (15.4 miles
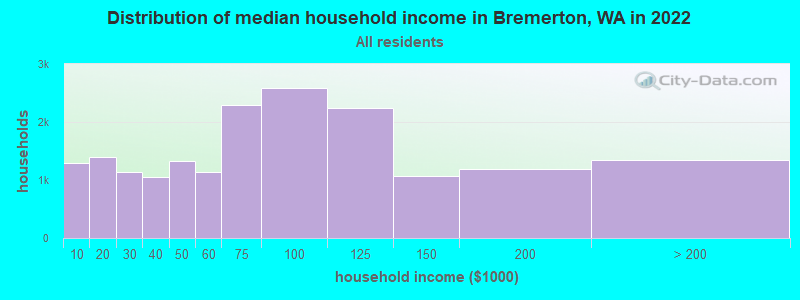
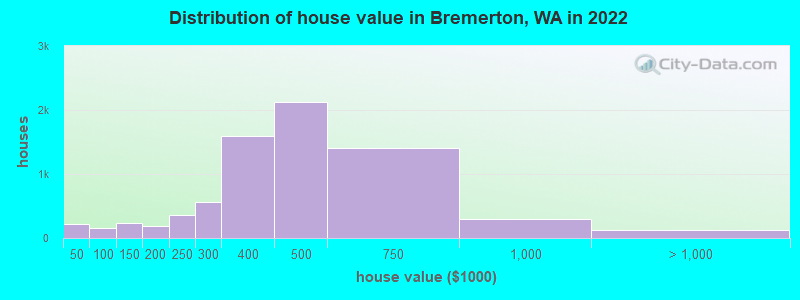

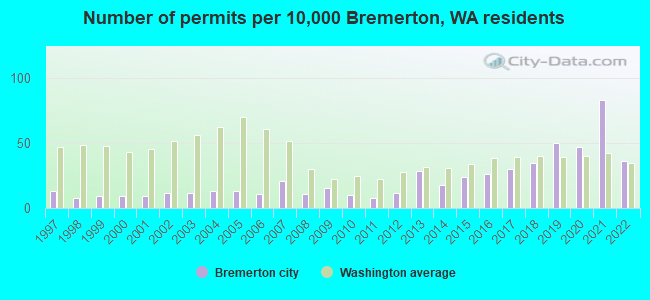
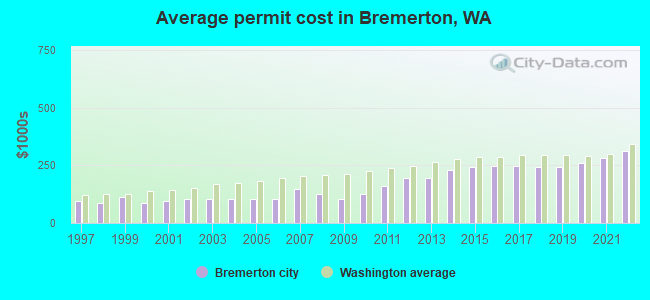
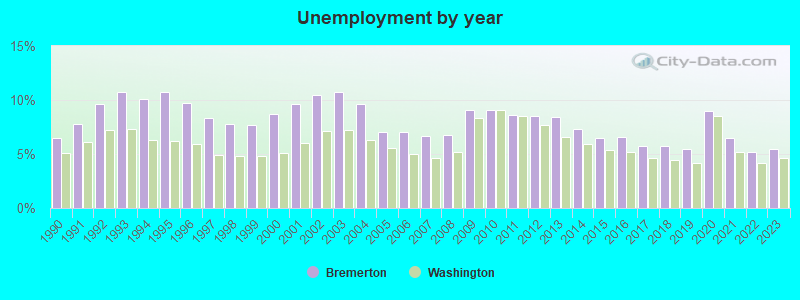
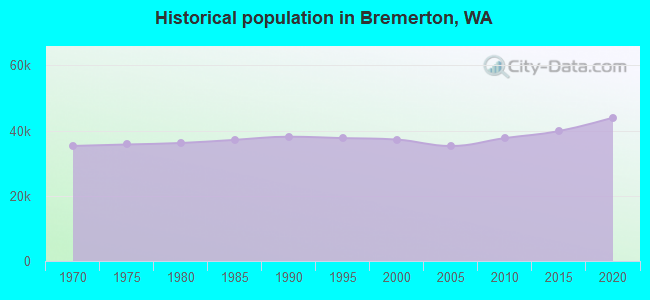
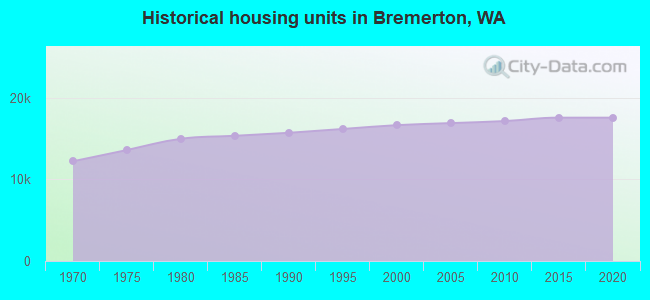
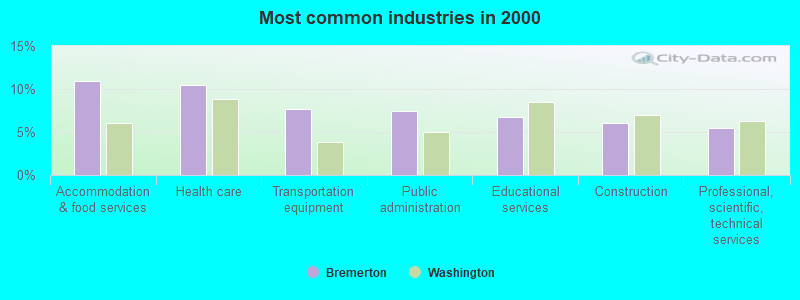
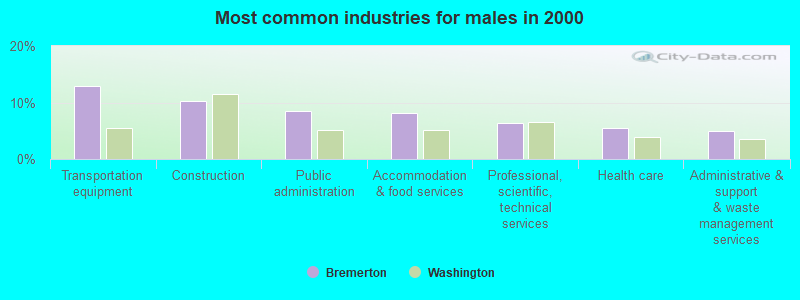
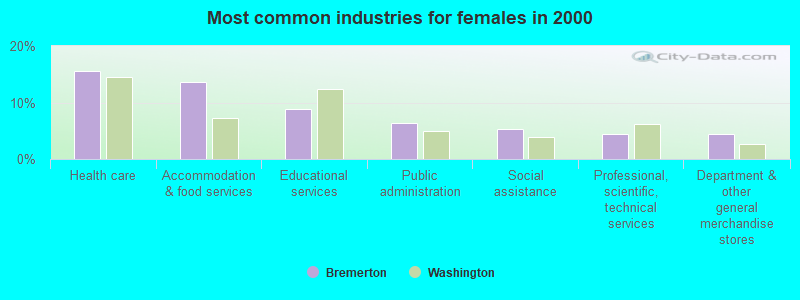
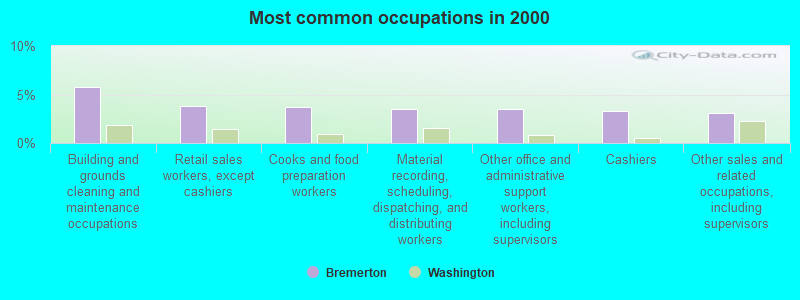
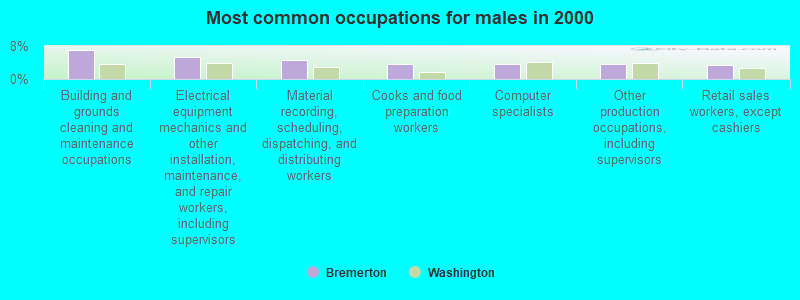
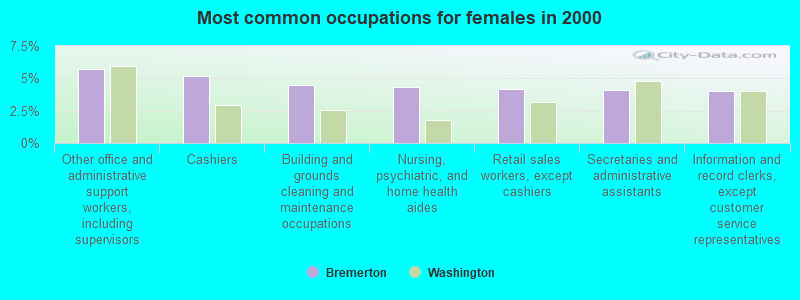

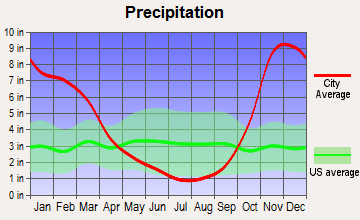


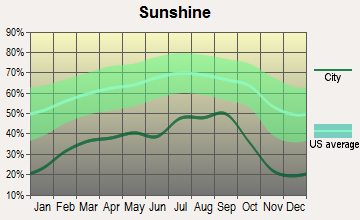
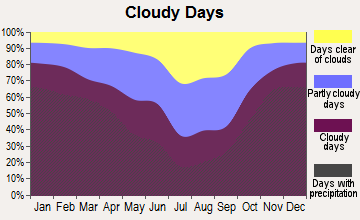


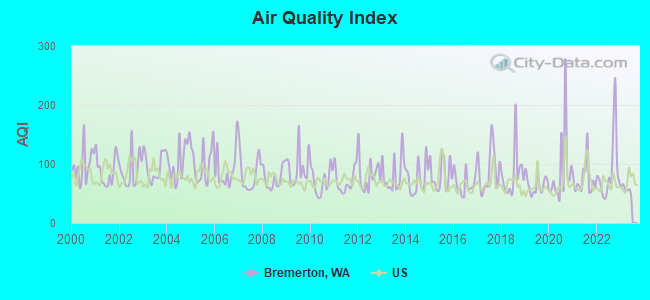
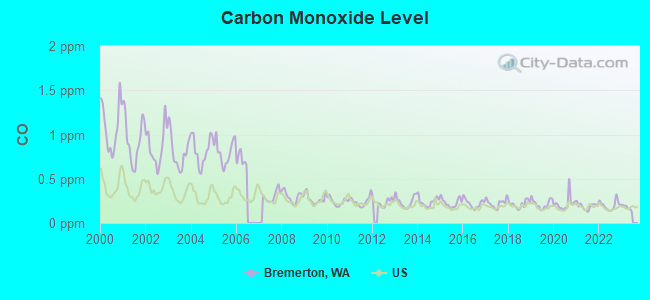
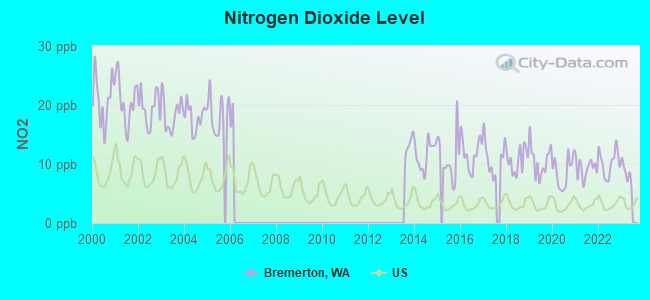
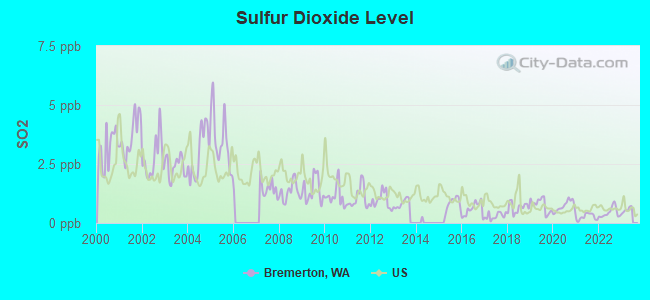
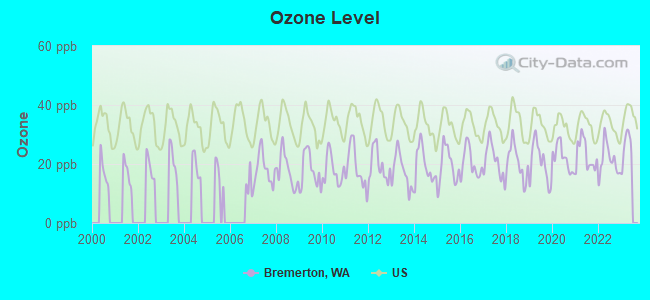
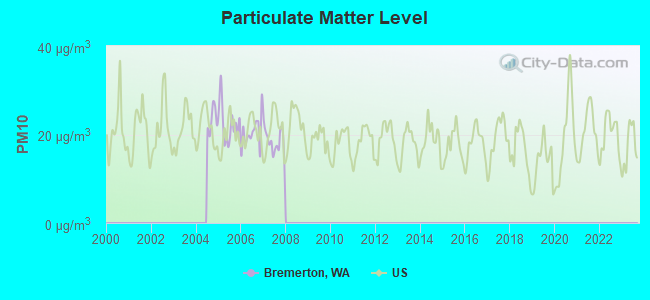
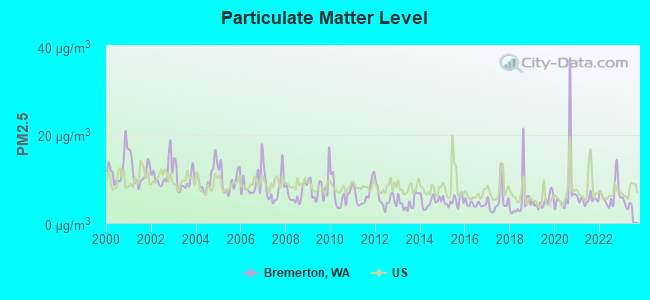
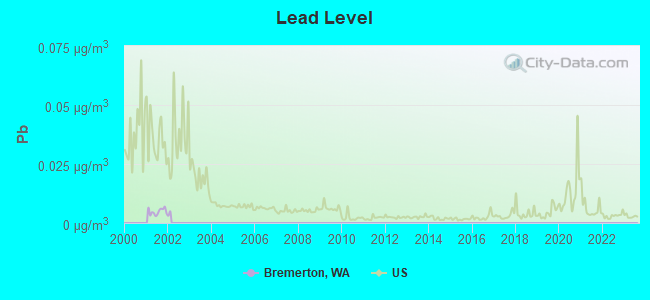
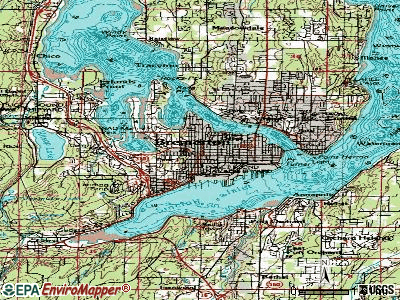
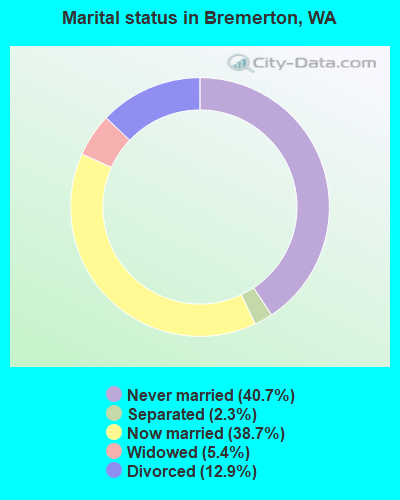
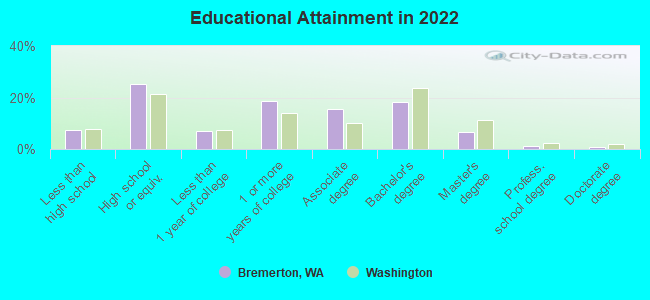
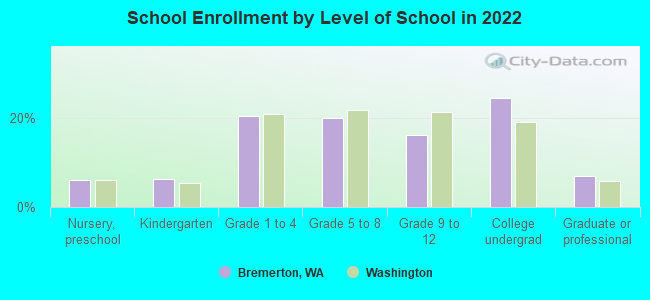
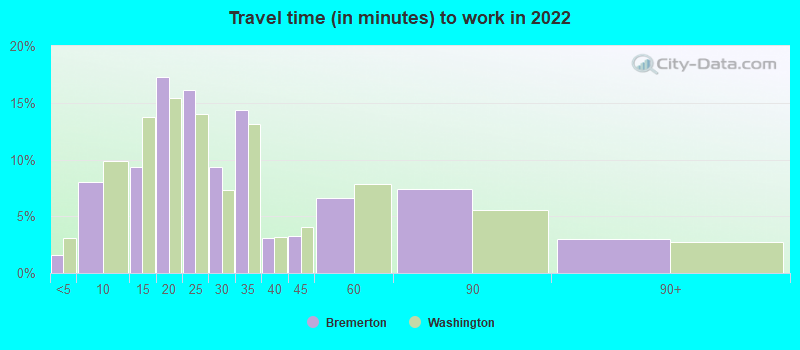
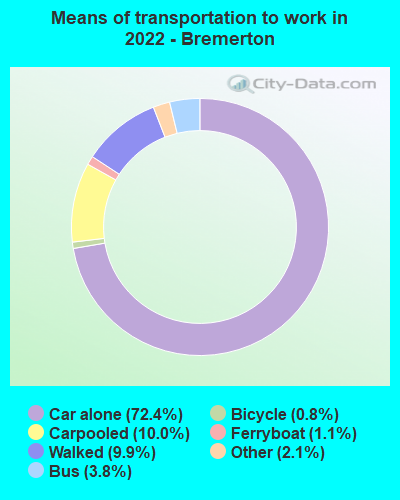
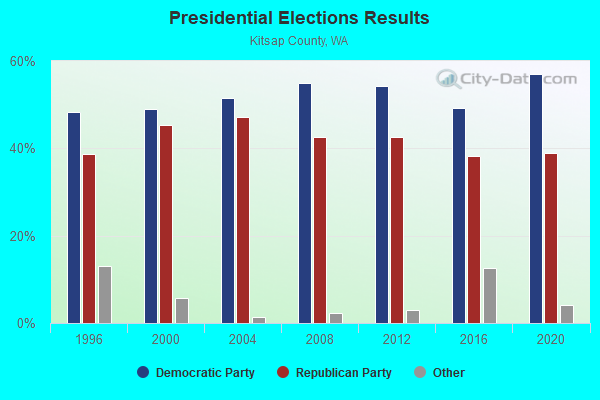
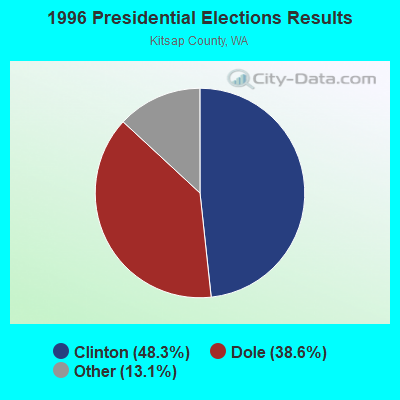
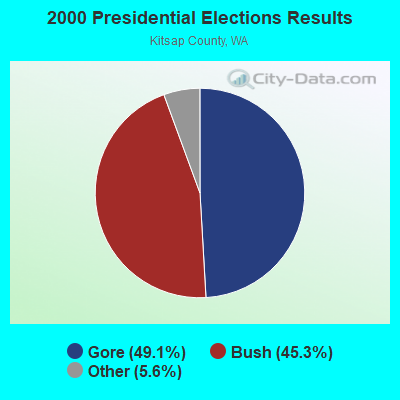
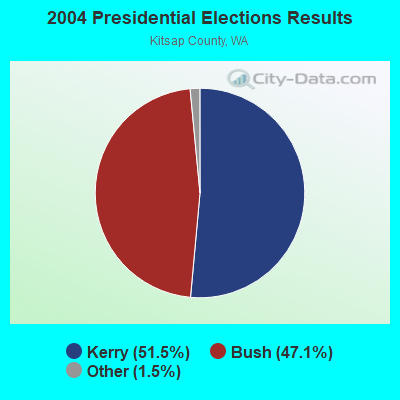
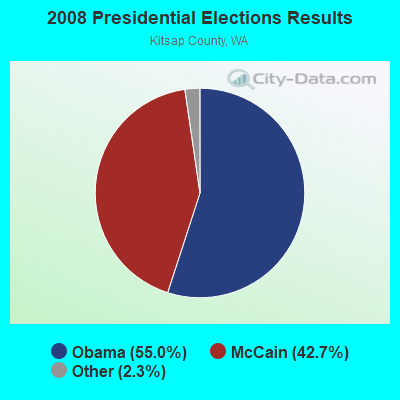
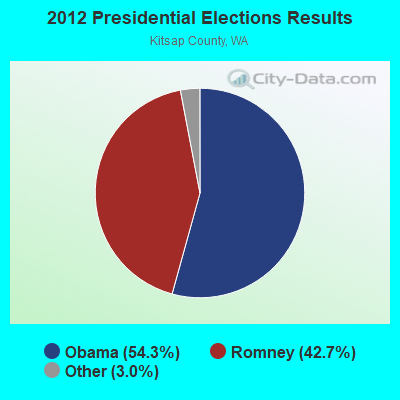

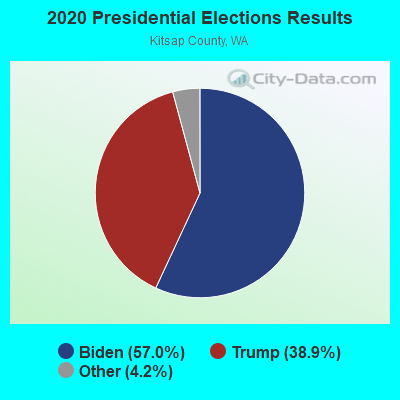
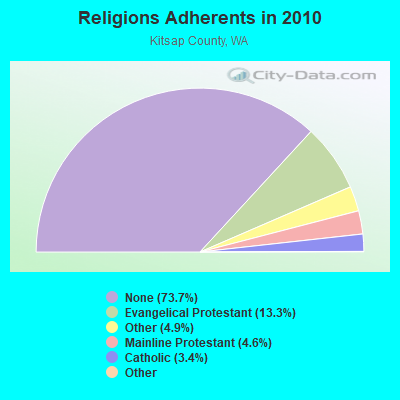
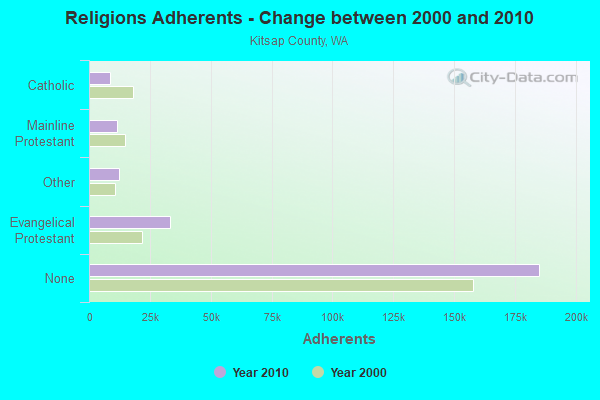
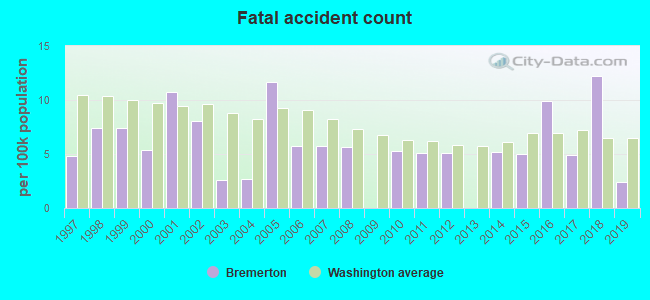
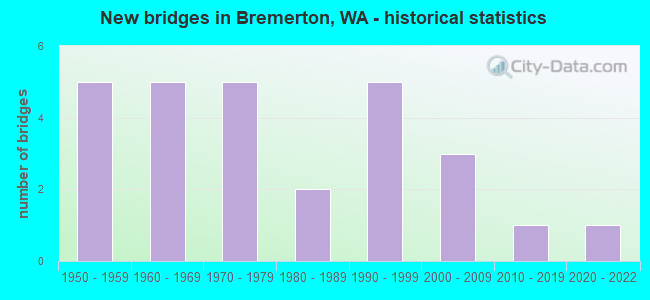
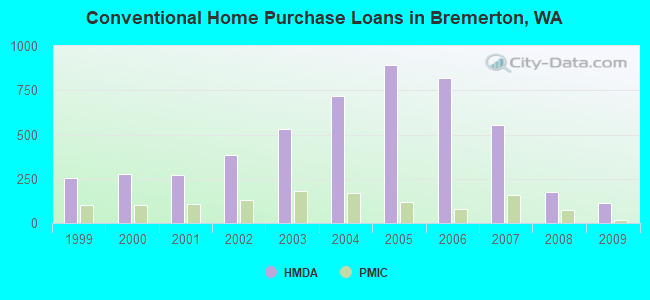
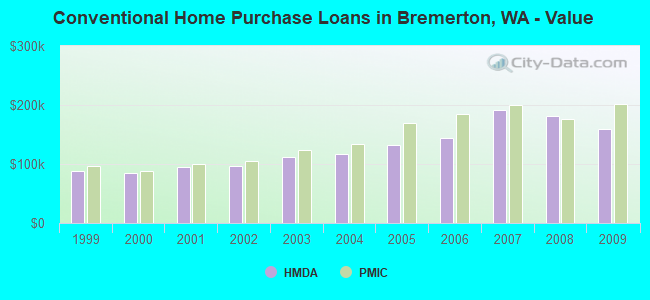
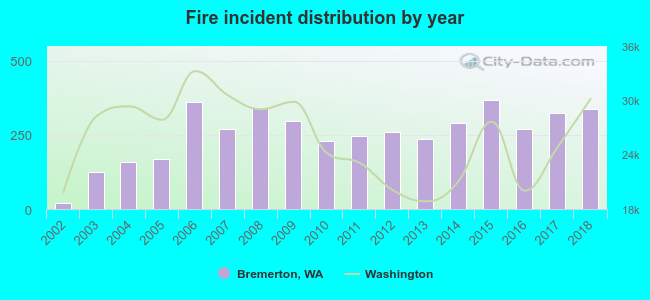 Based on the data from the years 2002 - 2018 the average number of fires per year is 252. The highest number of reported fire incidents - 366 took place in 2015, and the least - 21 in 2002. The data has a rising trend.
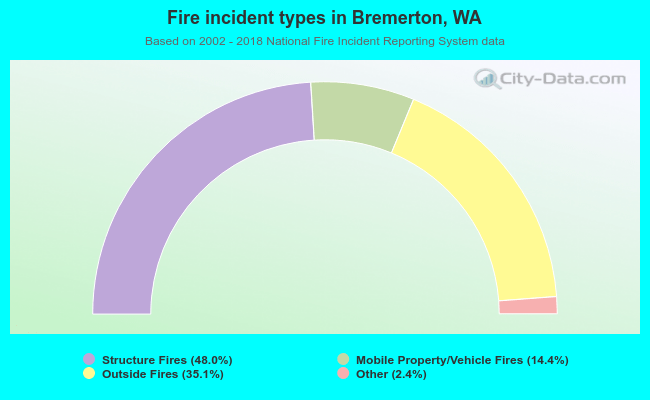 When looking into fire subcategories, the most incidents belonged to: Structure Fires (48.0%), and Outside Fires (35.1%).