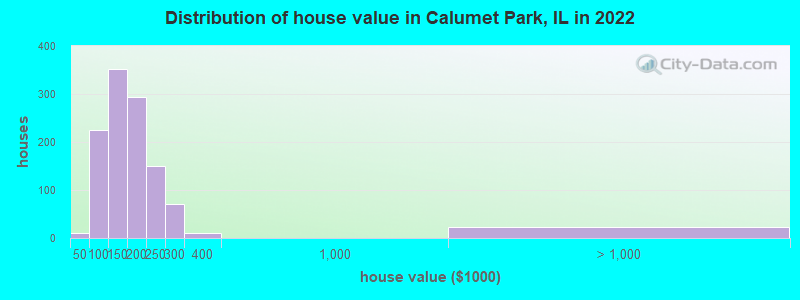
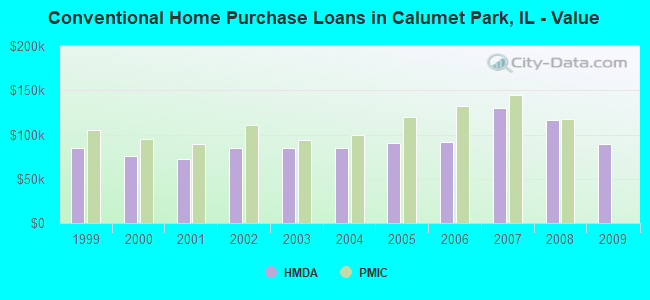
Estimated median house or condo value in 2022: $144,902 (it was $91,300 in 2000)
Calumet Park:
$144,902
IL:
$251,600
Mean prices in 2022:all housing units: $375,299; detached houses: $398,817; townhouses or other attached units: $348,645; in 2-unit structures: $310,273; in 3-to-4-unit structures: $366,192; in 5-or-more-unit structures: $341,015; mobile homes: $69,289; occupied boats, rvs, vans, etc.: $126,496
Median gross rent in 2022: $1,099.
March 2022 cost of living index in Calumet Park: 99.5 (near average, U.S. average is 100)
Percentage of residents living in poverty in 2022: 15.7%
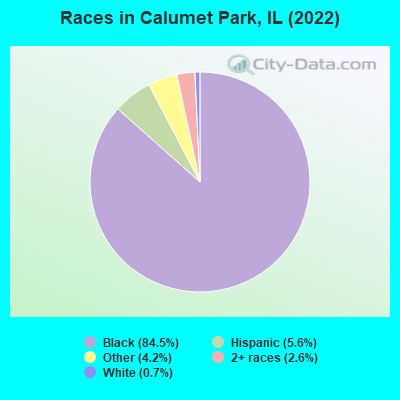
(35.8% for White Non-Hispanic residents, 16.3% for Black residents, 6.8% for Hispanic or Latino residents, 1.0% for other race residents, 49.8% for two or more races residents)
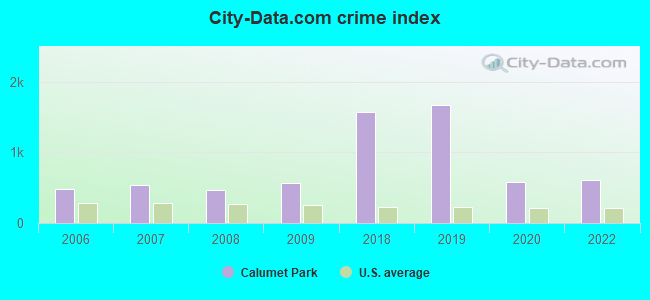
The City-Data.com crime index weighs serious crimes and violent crimes more heavily. Higher means more crime, U.S. average is 246.1. It adjusts for the number of visitors and daily workers commuting into cities.
Latest news from Calumet Park, IL collected exclusively by city-data.com from local newspapers, TV, and radio stations
Ancestries: African (2.8%).
Current Local Time: CST time zone
Incorporated on 12/02/1925
Elevation: 604 feet
Land area: 1.11 square miles.
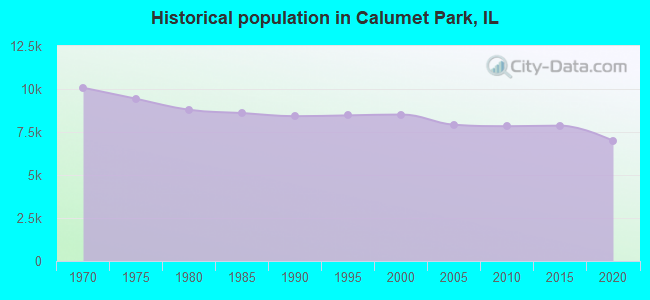
Population density: 6,104 people per square mile (high).
111 residents are foreign born
This village:
1.6%
Illinois:
14.1%
Median real estate property taxes paid for housing units with mortgages in 2022: $3,293 (2.2%) Median real estate property taxes paid for housing units with no mortgage in 2022: $2,651 (2.0%)
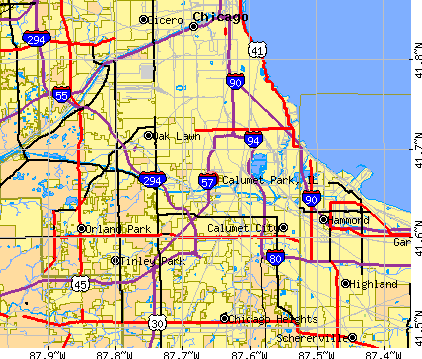
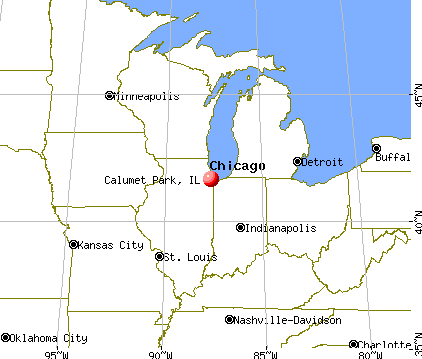
Nearest city with pop. 50,000+: Oak Lawn, IL (6.0 miles , pop. 55,245).
Nearest city with pop. 200,000+: Chicago, IL (12.2 miles , pop. 2,896,016).
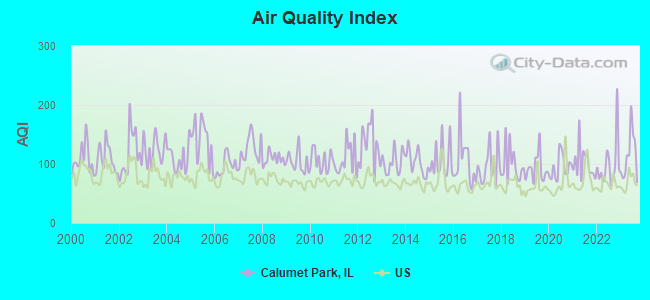
Air Quality Index (AQI) level in 2023 was 114. This is significantly worse than average.
City:
114
U.S.:
73
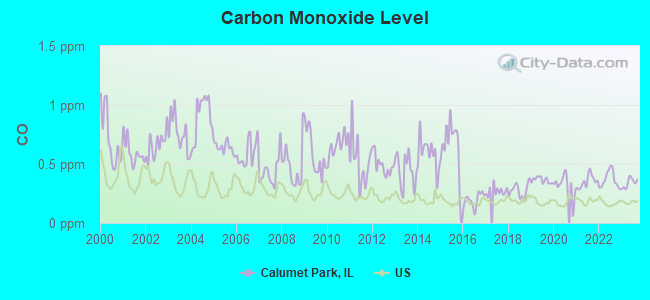
Carbon Monoxide (CO) [ppm] level in 2023 was 0.339. This is worse than average.Closest monitor was 2.0 miles away from the city center.
City:
0.339
U.S.:
0.251
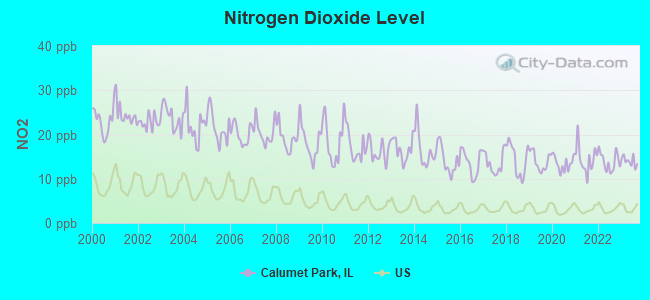
Nitrogen Dioxide (NO2) [ppb] level in 2023 was 14.0. This is significantly worse than average.Closest monitor was 2.0 miles away from the city center.
City:
14.0
U.S.:
5.1
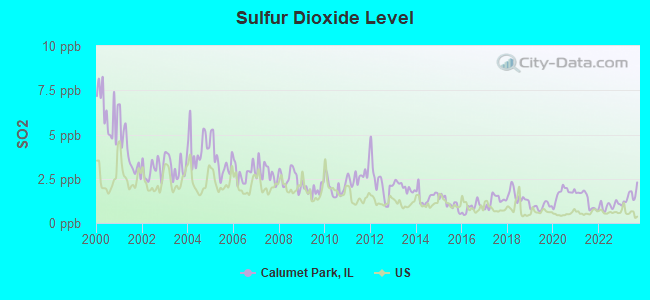
Sulfur Dioxide (SO2) [ppb] level in 2023 was 1.50. This is about average.Closest monitor was 2.0 miles away from the city center.
City:
1.50
U.S.:
1.51
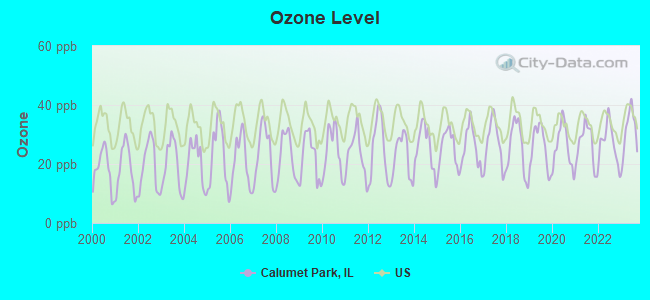
Ozone [ppb] level in 2023 was 31.2. This is about average.Closest monitor was 3.0 miles away from the city center.
City:
31.2
U.S.:
33.3
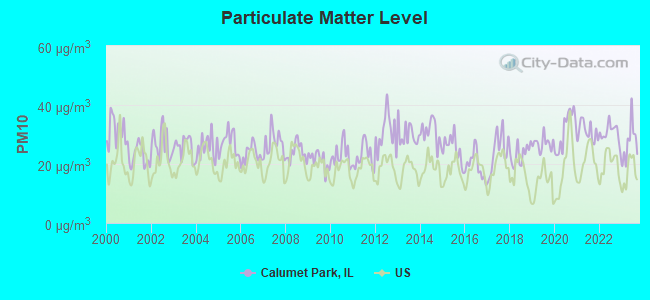
Particulate Matter (PM10) [µg/m3] level in 2023 was 27.2. This is significantly worse than average.Closest monitor was 2.0 miles away from the city center.
City:
27.2
U.S.:
19.2
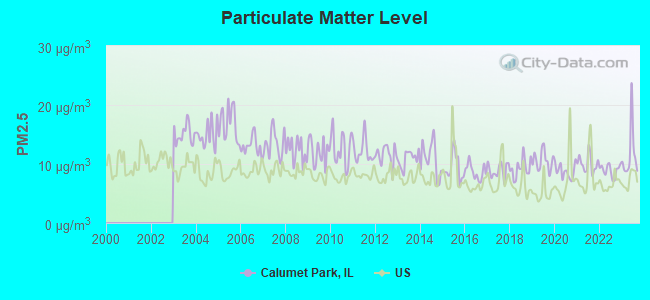
Particulate Matter (PM2.5) [µg/m3] level in 2023 was 11.6. This is significantly worse than average.Closest monitor was 2.0 miles away from the city center.
City:
11.6
U.S.:
8.1
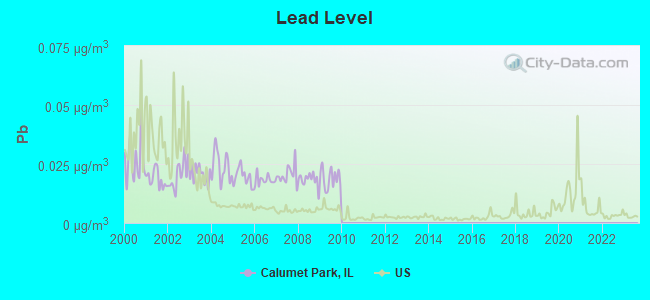
Lead (Pb) [µg/m3] level in 2009 was 0.0189. This is significantly worse than average.Closest monitor was 2.0 miles away from the city center.
City:
0.0189
U.S.:
0.0093
Tornado activity:
Calumet Park-area historical tornado activity is near Illinois state average. It is 55% greater than the overall U.S. average.
On 8/28/1990, a category F5 (max. wind speeds 261-318 mph) tornado 25.0 miles away from the Calumet Park village center killed 29 peopleand injured 350 peopleand causedbetween $50,000 and $500,000 in damages.
On 4/21/1967, a category F4 (max. wind speeds 207-260 mph) tornado 7.1 miles away from the village center killed 33 peopleand injured 500 peopleand causedbetween $5,000,000 and $50,000,000 in damages.
Earthquake activity:
Calumet Park-area historical earthquake activity is significantly above Illinois state average. It is 41% greater than the overall U.S. average.
On 4/18/2008 at 09:36:59, a magnitude 5.4 (5.1 MB, 4.8 MS, 5.4 MW, 5.2 MW, Class: Moderate, Intensity: VI - VII) earthquake occurred 222.6 miles away from Calumet Park center On 6/10/1987 at 23:48:54, a magnitude 5.1 (4.9 MB, 4.4 MS, 4.6 MS, 5.1 LG) earthquake occurred 197.1 miles away from Calumet Park center On 4/18/2008 at 09:36:59, a magnitude 5.2 (5.2 MW, Depth: 8.9 mi) earthquake occurred 222.6 miles away from the city center On 6/28/2004 at 06:10:52, a magnitude 4.2 (4.2 MW, Depth: 6.2 mi, Class: Light, Intensity: IV - V) earthquake occurred 65.8 miles away from Calumet Park center On 6/18/2002 at 17:37:15, a magnitude 5.0 (4.3 MB, 4.6 MW, 5.0 LG) earthquake occurred 254.5 miles away from Calumet Park center On 4/18/2008 at 15:14:16, a magnitude 4.8 (4.5 MB, 4.8 MW, 4.6 MW) earthquake occurred 220.8 miles away from the city center Magnitude types: regional Lg-wave magnitude (LG), body-wave magnitude (MB), surface-wave magnitude (MS), moment magnitude (MW)
Natural disasters:
The number of natural disasters in Cook County (20) is greater than the US average (15). Major Disasters (Presidential) Declared: 15 Emergencies Declared: 4
Causes of natural disasters: Floods: 13, Storms: 12, Tornadoes: 3, Snowstorms: 2, Winter Storms: 2, Blizzard: 1, Hurricane: 1, Snow: 1, Wind: 1, Other: 1 (Note: some incidents may be assigned to more than one category).
Hospitals and medical centers near Calumet Park:
BLUE ISLAND NURSING HOME (Nursing Home, about 1 miles away; BLUE ISLAND, IL)
MSMC HOME CARE, LLC (Home Health Center, about 2 miles away; BLUE ISLAND, IL)
METROSOUTH MEDICAL CENTER Acute Care Hospitals (about 2 miles away; BLUE ISLAND, IL)
SSM HOSPICE AT ST FRANCIS BLUE ISLAND (Hospital, about 2 miles away; BLUE ISLAND, IL)
FMC - BLUE ISLAND DIALYSIS CENTER (Dialysis Facility, about 2 miles away; BLUE ISLAND, IL)
NIGHTENGALE OF CHICAGO INC. (Home Health Center, about 2 miles away; CHICAGO, IL)
BELHAVEN NURSING AND REHAB CENTER (Nursing Home, about 2 miles away; CHICAGO, IL)
Amtrak stations near Calumet Park:
8 miles: HOMEWOOD (181 1ST ST. & PARK AVE.) . Services: ticket office, enclosed waiting area, public restrooms, public payphones, paid short-term parking, paid long-term parking, public transit connection.
CALUMET PARK PUBLIC LIBRARY (Operating income: $209,511; Location: 1500 WEST 127TH STREET; 31,063 books; 279 audio materials; 849 video materials; 5 state licensed databases; 253 print serial subscriptions)
Notable locations in Calumet Park: Calumet Park Public Library (A), Calumet Park Village Hall (B), Calumet Park Fire Department (C). Display/hide their locations on the map
Tourist attraction: Fix A Flat On Wheels (12048 S Marshfield Ave).
Hotel: Best Western (12800 S Ashland Ave).
Cook County has a predicted average indoor radon screening level between 2 and 4 pCi/L (pico curies per liter) - Moderate Potential
Drinking water stations with addresses in Calumet Park that have no violations reported:
CALUMET PARK (Population served: 8,613,Primary Water Source Type: Purch surface water)
Average household size:
This village:
2.7 people
Illinois:
2.6 people
Percentage of family households:
This village:
69.0%
Whole state:
65.8%
Percentage of households with unmarried partners:
This village:
6.6%
Whole state:
6.3%
Likely homosexual households (counted as self-reported same-sex unmarried-partner households)
Lesbian couples: 0.1% of all households
Gay men: 0.2% of all households
Banks with branches in Calumet Park (2011 data):
BankFinancial, FSB: Calumet Park Branch at 1333 West 127th Street, branch established on 1996/08/15. Info updated 2011/07/21: Bank assets: $1,586.4 mil, Deposits: $1,355.4 mil, headquarters in Olympia Fields, IL, negative income in the last year, Commercial Lending Specialization, 23 total offices
Fifth Third Bank: Calumet Park Mb Branch at 13001 S Ashland Ave, branch established on 2007/12/17. Info updated 2009/10/05: Bank assets: $114,540.4 mil, Deposits: $89,689.1 mil, headquarters in Cincinnati, OH, positive income, Commercial Lending Specialization, 1378 total offices, Holding Company: Fifth Third Bancorp
JPMorgan Chase Bank, National Association: Calumet Park - Raceway Park Branch at 13023 S Ashland Avenue, branch established on 2004/04/30. Info updated 2011/11/10: Bank assets: $1,811,678.0 mil, Deposits: $1,190,738.0 mil, headquarters in Columbus, OH, positive income, International Specialization, 5577 total offices, Holding Company: Jpmorgan Chase & Co.
Religion statistics for Calumet Park, IL (based on Cook County data)
Religion
Adherents
Congregations
Catholic
1,947,223
376
Evangelical Protestant
432,975
1,484
Other
312,636
403
Mainline Protestant
202,114
630
Black Protestant
148,895
395
Orthodox
53,276
66
None
2,097,556
-
Source: Clifford Grammich, Kirk Hadaway, Richard Houseal, Dale E.Jones, Alexei Krindatch, Richie Stanley and Richard H.Taylor. 2012. 2010 U.S.Religion Census: Religious Congregations & Membership Study. Association of Statisticians of American Religious Bodies. Jones, Dale E., et al. 2002. Congregations and Membership in the United States 2000. Nashville, TN: Glenmary Research Center. Graphs represent county-level data
Call Sign: KA9MRY, Licensee ID: L01282053, Grant Date: 05/09/2007, Expiration Date: 07/29/2017, Cancellation Date: 07/30/2019, Certifier: Paul M O Dell, Registrant: Paul M O Dell, 12333 S Morgan, Calumet Park, IL 60643
Call Sign: KA9ULV, Grant Date: 12/29/1987, Expiration Date: 12/29/1997, Cancellation Date: 12/30/1999, Registrant: Edwinna G Fitzhugh, 12357 S Ashland Lot 84, Calumet Park, IL 60643
Call Sign: N9SDT, Previous Call Sign: KA9RML, Licensee ID: L00193003, Grant Date: 02/11/2023, Expiration Date: 05/11/2033, Certifier: Everett Wilkins, Registrant: Everett Wilkins, 12440 S Morgan St, Calumet Park, IL 60827-6225
Call Sign: N9SUZ, Licensee ID: L00634564, Grant Date: 02/07/2003, Expiration Date: 03/16/2013, Cancellation Date: 03/17/2015, Registrant: Ross W Romine, 12748 May St, Calumet Park, IL 60643
Call Sign: NV9N, Licensee ID: L01313554, Grant Date: 08/13/2007, Expiration Date: 10/21/2017, Cancellation Date: 10/22/2019, Certifier: Nicholas Vlasvich, Registrant: Nicholas Vlasvich, 12634 S Paulina St, Calumet Park, IL 60827-5914
Call Sign: WB9LSI, Grant Date: 02/23/1988, Expiration Date: 02/23/1998, Cancellation Date: 02/24/2000, Registrant: James Chelikas, 12504 Honore St, Calumet Park, IL 60643
Home Mortgage Disclosure Act Aggregated Statistics For Year 2009 (Based on 1 full and 2 partial tracts)
A) FHA, FSA/RHS & VA Home Purchase Loans
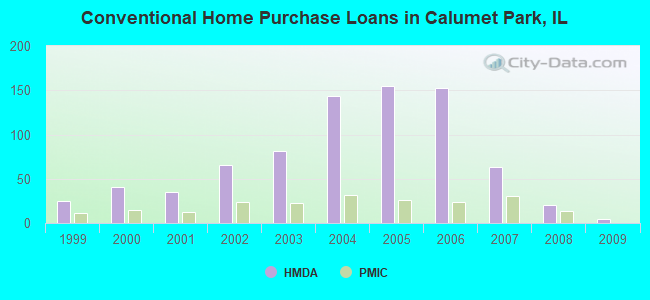
B) Conventional Home Purchase Loans
C) Refinancings
D) Home Improvement Loans
E) Loans on Dwellings For 5+ Families
F) Non-occupant Loans on < 5 Family Dwellings (A B C & D)
Number
Average Value
Number
Average Value
Number
Average Value
Number
Average Value
Number
Average Value
Number
Average Value
LOANS ORIGINATED
16
$111,737
5
$89,148
63
$114,151
8
$21,252
2
$177,805
10
$82,095
APPLICATIONS APPROVED, NOT ACCEPTED
3
$135,567
2
$51,725
17
$107,378
5
$15,844
0
$0
1
$42,000
APPLICATIONS DENIED
5
$123,288
13
$90,148
62
$114,079
17
$42,342
1
$5,470,590
4
$76,572
APPLICATIONS WITHDRAWN
5
$98,386
3
$102,227
23
$123,149
5
$85,498
0
$0
1
$100,000
FILES CLOSED FOR INCOMPLETENESS
3
$80,753
0
$0
10
$122,231
2
$15,510
0
$0
1
$83,000
Aggregated Statistics For Year 2008 (Based on 1 full and 2 partial tracts)
A) FHA, FSA/RHS & VA Home Purchase Loans
B) Conventional Home Purchase Loans
C) Refinancings
D) Home Improvement Loans
E) Loans on Dwellings For 5+ Families
F) Non-occupant Loans on < 5 Family Dwellings (A B C & D)
Number
Average Value
Number
Average Value
Number
Average Value
Number
Average Value
Number
Average Value
Number
Average Value
LOANS ORIGINATED
26
$150,887
20
$116,548
85
$129,182
10
$59,945
2
$930,760
12
$92,764
APPLICATIONS APPROVED, NOT ACCEPTED
1
$175,440
4
$118,435
22
$110,399
8
$15,985
0
$0
5
$82,494
APPLICATIONS DENIED
10
$113,091
12
$123,297
140
$132,029
47
$41,845
0
$0
16
$95,170
APPLICATIONS WITHDRAWN
4
$158,275
4
$124,335
28
$119,443
1
$111,180
0
$0
1
$134,160
FILES CLOSED FOR INCOMPLETENESS
3
$188,110
1
$162,000
14
$142,436
4
$78,862
0
$0
1
$211,210
Aggregated Statistics For Year 2007 (Based on 1 full and 2 partial tracts)
A) FHA, FSA/RHS & VA Home Purchase Loans
B) Conventional Home Purchase Loans
C) Refinancings
D) Home Improvement Loans
E) Loans on Dwellings For 5+ Families
F) Non-occupant Loans on < 5 Family Dwellings (A B C & D)
Number
Average Value
Number
Average Value
Number
Average Value
Number
Average Value
Number
Average Value
Number
Average Value
LOANS ORIGINATED
12
$129,734
63
$129,757
152
$112,558
32
$43,583
2
$447,260
25
$105,598
APPLICATIONS APPROVED, NOT ACCEPTED
0
$0
24
$102,537
38
$114,739
6
$54,660
0
$0
10
$80,938
APPLICATIONS DENIED
5
$157,690
51
$118,995
180
$126,413
47
$49,214
0
$0
29
$100,527
APPLICATIONS WITHDRAWN
3
$149,817
15
$126,379
62
$129,801
2
$38,050
6
$379,773
8
$103,968
FILES CLOSED FOR INCOMPLETENESS
0
$0
3
$81,547
42
$139,911
0
$0
0
$0
4
$135,340
Aggregated Statistics For Year 2006 (Based on 1 full and 2 partial tracts)
A) FHA, FSA/RHS & VA Home Purchase Loans
B) Conventional Home Purchase Loans
C) Refinancings
D) Home Improvement Loans
E) Loans on Dwellings For 5+ Families
F) Non-occupant Loans on < 5 Family Dwellings (A B C & D)
Number
Average Value
Number
Average Value
Number
Average Value
Number
Average Value
Number
Average Value
Number
Average Value
LOANS ORIGINATED
5
$146,216
152
$91,764
222
$107,455
32
$48,399
6
$1,057,543
48
$97,694
APPLICATIONS APPROVED, NOT ACCEPTED
0
$0
46
$97,425
39
$102,644
11
$50,555
0
$0
9
$108,261
APPLICATIONS DENIED
4
$162,738
113
$102,490
227
$117,102
41
$40,442
4
$1,481,485
33
$110,958
APPLICATIONS WITHDRAWN
1
$139,510
38
$95,452
98
$123,517
4
$96,690
1
$1,275,000
17
$99,461
FILES CLOSED FOR INCOMPLETENESS
0
$0
21
$95,757
29
$103,043
2
$105,470
0
$0
3
$122,437
Aggregated Statistics For Year 2005 (Based on 1 full and 2 partial tracts)
A) FHA, FSA/RHS & VA Home Purchase Loans
B) Conventional Home Purchase Loans
C) Refinancings
D) Home Improvement Loans
E) Loans on Dwellings For 5+ Families
F) Non-occupant Loans on < 5 Family Dwellings (A B C & D)
Number
Average Value
Number
Average Value
Number
Average Value
Number
Average Value
Number
Average Value
Number
Average Value
LOANS ORIGINATED
10
$123,415
155
$90,692
233
$103,853
36
$54,944
5
$1,447,904
56
$98,590
APPLICATIONS APPROVED, NOT ACCEPTED
2
$105,105
51
$93,302
57
$98,177
11
$56,583
0
$0
16
$97,584
APPLICATIONS DENIED
3
$145,397
71
$93,272
217
$106,933
47
$39,873
2
$359,955
28
$106,138
APPLICATIONS WITHDRAWN
0
$0
34
$90,619
94
$112,565
10
$159,552
0
$0
14
$122,781
FILES CLOSED FOR INCOMPLETENESS
0
$0
17
$78,256
47
$107,805
0
$0
0
$0
7
$92,224
Aggregated Statistics For Year 2004 (Based on 1 full and 2 partial tracts)
A) FHA, FSA/RHS & VA Home Purchase Loans
B) Conventional Home Purchase Loans
C) Refinancings
D) Home Improvement Loans
E) Loans on Dwellings For 5+ Families
F) Non-occupant Loans on < 5 Family Dwellings (A B C & D)
G) Loans On Manufactured Home Dwelling (A B C & D)
Number
Average Value
Number
Average Value
Number
Average Value
Number
Average Value
Number
Average Value
Number
Average Value
Number
Average Value
LOANS ORIGINATED
17
$120,816
144
$84,335
248
$93,765
28
$44,976
7
$431,397
41
$81,877
0
$0
APPLICATIONS APPROVED, NOT ACCEPTED
5
$124,196
43
$80,540
66
$96,552
9
$34,579
0
$0
22
$79,285
1
$41,230
APPLICATIONS DENIED
6
$121,770
59
$85,442
252
$97,194
41
$34,973
0
$0
30
$81,632
0
$0
APPLICATIONS WITHDRAWN
7
$108,176
25
$92,199
118
$101,779
10
$58,266
0
$0
16
$99,021
0
$0
FILES CLOSED FOR INCOMPLETENESS
0
$0
6
$131,958
51
$95,778
2
$73,810
5
$469,406
3
$116,210
0
$0
Aggregated Statistics For Year 2003 (Based on 1 full and 2 partial tracts)
A) FHA, FSA/RHS & VA Home Purchase Loans
B) Conventional Home Purchase Loans
C) Refinancings
D) Home Improvement Loans
E) Loans on Dwellings For 5+ Families
F) Non-occupant Loans on < 5 Family Dwellings (A B C & D)
Number
Average Value
Number
Average Value
Number
Average Value
Number
Average Value
Number
Average Value
Number
Average Value
LOANS ORIGINATED
28
$100,094
81
$85,247
268
$87,636
16
$21,867
5
$498,214
31
$69,821
APPLICATIONS APPROVED, NOT ACCEPTED
1
$151,000
28
$76,547
54
$89,540
6
$36,348
0
$0
14
$72,674
APPLICATIONS DENIED
4
$65,430
32
$85,318
212
$94,375
21
$13,747
1
$2,424,730
13
$130,502
APPLICATIONS WITHDRAWN
1
$62,900
21
$81,662
115
$93,135
2
$76,775
0
$0
8
$79,980
FILES CLOSED FOR INCOMPLETENESS
0
$0
9
$74,161
22
$80,224
1
$8,090
0
$0
2
$88,950
Aggregated Statistics For Year 2002 (Based on 1 full and 2 partial tracts)
A) FHA, FSA/RHS & VA Home Purchase Loans
B) Conventional Home Purchase Loans
C) Refinancings
D) Home Improvement Loans
E) Loans on Dwellings For 5+ Families
F) Non-occupant Loans on < 5 Family Dwellings (A B C & D)
Number
Average Value
Number
Average Value
Number
Average Value
Number
Average Value
Number
Average Value
Number
Average Value
LOANS ORIGINATED
22
$103,729
66
$84,696
190
$83,648
19
$16,123
1
$774,490
22
$62,223
APPLICATIONS APPROVED, NOT ACCEPTED
1
$115,840
12
$77,497
31
$75,026
4
$11,658
0
$0
3
$54,967
APPLICATIONS DENIED
2
$98,520
21
$70,492
122
$84,260
16
$19,134
0
$0
17
$72,085
APPLICATIONS WITHDRAWN
5
$104,438
13
$80,433
82
$89,284
2
$15,120
0
$0
6
$70,438
FILES CLOSED FOR INCOMPLETENESS
3
$90,360
3
$78,213
32
$85,329
0
$0
0
$0
1
$107,420
Aggregated Statistics For Year 2001 (Based on 1 full and 2 partial tracts)
A) FHA, FSA/RHS & VA Home Purchase Loans
B) Conventional Home Purchase Loans
C) Refinancings
D) Home Improvement Loans
E) Loans on Dwellings For 5+ Families
F) Non-occupant Loans on < 5 Family Dwellings (A B C & D)
Number
Average Value
Number
Average Value
Number
Average Value
Number
Average Value
Number
Average Value
Number
Average Value
LOANS ORIGINATED
32
$96,619
35
$71,911
169
$78,902
23
$27,723
3
$638,160
15
$76,735
APPLICATIONS APPROVED, NOT ACCEPTED
3
$103,530
20
$73,260
30
$73,569
9
$29,711
0
$0
5
$52,122
APPLICATIONS DENIED
5
$102,136
29
$76,578
180
$72,542
33
$13,698
0
$0
13
$81,319
APPLICATIONS WITHDRAWN
4
$79,242
9
$89,311
82
$77,485
10
$23,400
0
$0
2
$111,875
FILES CLOSED FOR INCOMPLETENESS
1
$73,950
5
$44,350
28
$78,870
2
$55,680
0
$0
2
$57,710
Aggregated Statistics For Year 2000 (Based on 1 full and 2 partial tracts)
A) FHA, FSA/RHS & VA Home Purchase Loans
B) Conventional Home Purchase Loans
C) Refinancings
D) Home Improvement Loans
E) Loans on Dwellings For 5+ Families
F) Non-occupant Loans on < 5 Family Dwellings (A B C & D)
Number
Average Value
Number
Average Value
Number
Average Value
Number
Average Value
Number
Average Value
Number
Average Value
LOANS ORIGINATED
36
$87,836
41
$76,078
108
$70,452
31
$18,519
3
$321,413
8
$58,365
APPLICATIONS APPROVED, NOT ACCEPTED
4
$87,718
13
$80,533
47
$80,210
19
$24,287
0
$0
2
$66,305
APPLICATIONS DENIED
11
$80,065
35
$72,560
156
$71,534
45
$23,045
1
$272,060
11
$62,567
APPLICATIONS WITHDRAWN
3
$87,797
10
$76,813
54
$62,097
9
$16,432
0
$0
3
$73,637
FILES CLOSED FOR INCOMPLETENESS
0
$0
5
$72,646
46
$82,408
0
$0
1
$135,000
1
$89,000
Aggregated Statistics For Year 1999 (Based on 1 full and 2 partial tracts)
A) FHA, FSA/RHS & VA Home Purchase Loans
B) Conventional Home Purchase Loans
C) Refinancings
D) Home Improvement Loans
E) Loans on Dwellings For 5+ Families
F) Non-occupant Loans on < 5 Family Dwellings (A B C & D)
2002 - 2018 National Fire Incident Reporting System (NFIRS) incidents
Based on the data from the years 2002 - 2018 the average number of fire incidents per year is 57. The highest number of fire incidents - 136 took place in 2015, and the least - 6 in 2004. The data has an increasing trend.
When looking into fire subcategories, the most reports belonged to: Structure Fires (61.7%), and Mobile Property/Vehicle Fires (21.4%).
Fire incident types reported to NFIRS in Calumet Park, IL
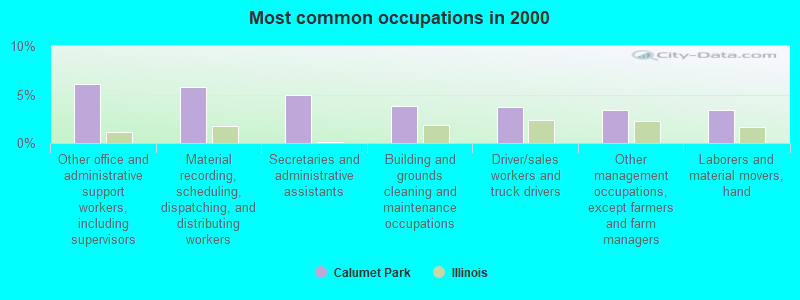
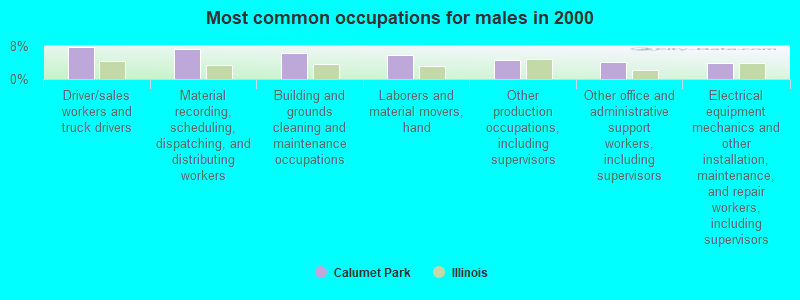
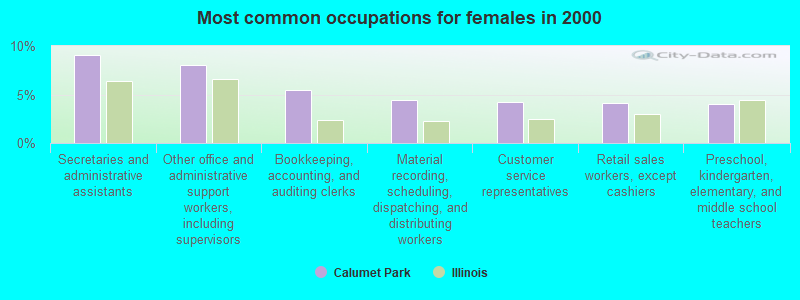
#4 on the list of "Top 101 cities with largest percentage of males in occupations: office and administrative support occupations (population 5,000+)"
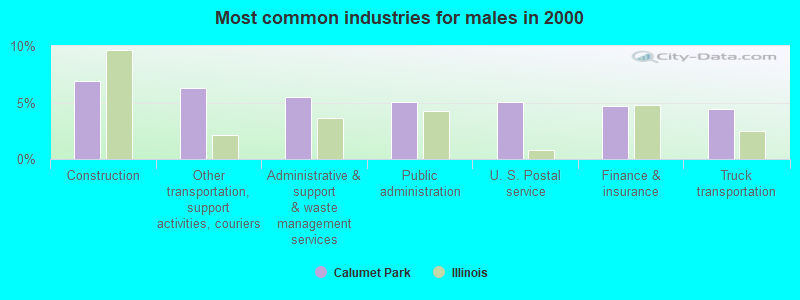
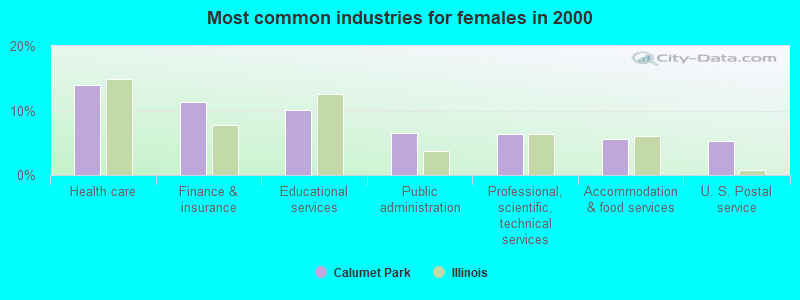
#4 on the list of "Top 101 cities with largest percentage of females in industries: transportation and warehousing (population 5,000+)"
#6 on the list of "Top 101 cities with largest percentage of females in occupations: office and administrative support occupations (population 5,000+)"
#27 on the list of "Top 101 cities with the most residents born in Other Southern Africa (population 500+)"
#45 on the list of "Top 101 cities with largest percentage of females in industries: information (population 5,000+)"
#47 on the list of "Top 101 cities with largest percentage of males in industries: transportation and warehousing (population 5,000+)"
#65 on the list of "Top 101 cities with largest percentage of females in occupations: transportation occupations (population 5,000+)"
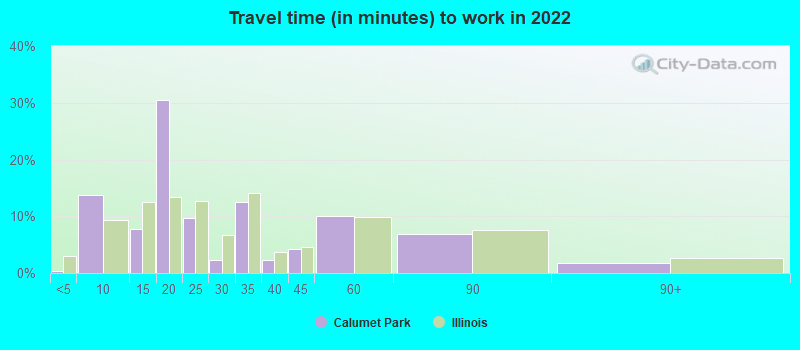
#71 on the list of "Top 101 cities with the lowest percentage of workers working at home, population 5,000+"
#22 (60827) on the list of "Top 101 zip codes with the lowest 2012 average net capital gain/loss (pop 5,000+)"
#1 on the list of "Top 101 counties with the most Black Protestant congregations"
#1 on the list of "Top 101 counties with the most Catholic congregations"
#1 on the list of "Top 101 counties with the highest surface withdrawal of fresh water for public supply"
#2 on the list of "Top 101 counties with the most Black Protestant adherents"
#2 on the list of "Top 101 counties with the most Orthodox congregations (pop. 50,000+)"
There is 1 pilot and no other airmen in this city.


 Recent articles from our blog. Our writers, many of them Ph.D. graduates or candidates, create easy-to-read articles on a wide variety of topics.

 (6.0 miles


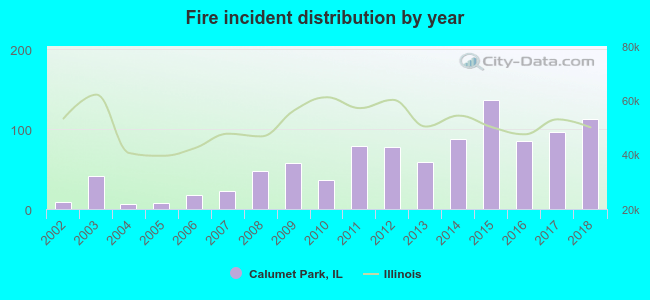 Based on the data from the years 2002 - 2018 the average number of fire incidents per year is 57. The highest number of fire incidents - 136 took place in 2015, and the least - 6 in 2004. The data has an increasing trend.
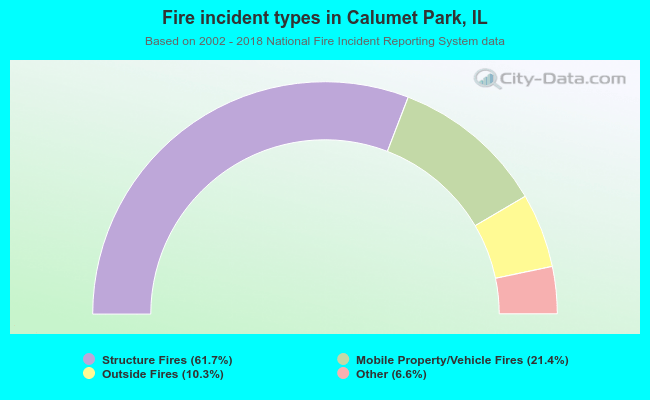 When looking into fire subcategories, the most reports belonged to: Structure Fires (61.7%), and Mobile Property/Vehicle Fires (21.4%).