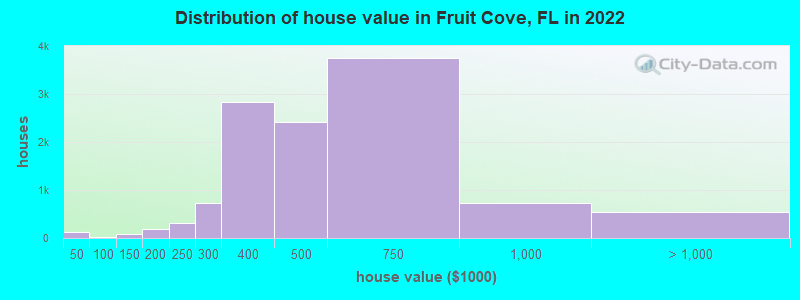
Estimated median house or condo value in 2022: $479,517 (it was $179,400 in 2000)
Fruit Cove:
$479,517
FL:
$354,100
Mean prices in 2022:all housing units: $556,130; detached houses: $570,594; townhouses or other attached units: $592,301; in 3-to-4-unit structures: $193,145; in 5-or-more-unit structures: $329,167; mobile homes: $147,170
Median gross rent in 2022: $2,233.
March 2022 cost of living index in Fruit Cove: 90.1 (less than average, U.S. average is 100)
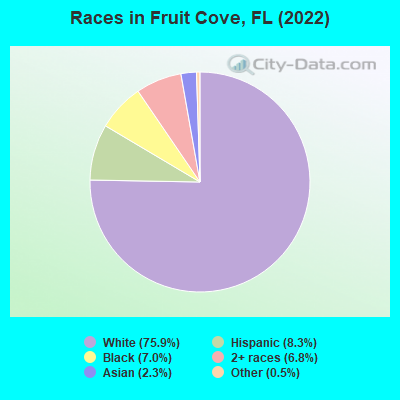
Percentage of residents living in poverty in 2022: 2.3%
(1.5% for White Non-Hispanic residents, 9.2% for Black residents, 2.4% for Hispanic or Latino residents, 10.9% for other race residents, 0.9% for two or more races residents)
Latest news from Fruit Cove, FL collected exclusively by city-data.com from local newspapers, TV, and radio stations
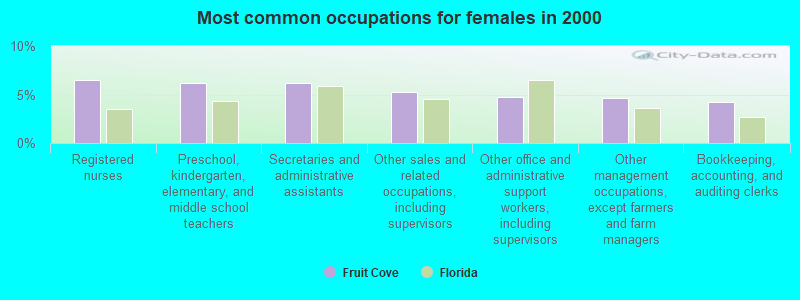
Ancestries: American (25.0%), English (14.0%), Italian (5.8%), German (5.6%), Irish (5.3%), Polish (2.3%).
Current Local Time: EST time zone
Elevation: 10 feet
Land area: 17.9 square miles.
Population density: 1,644 people per square mile (low).
3,011 residents are foreign born (3.4% Latin America, 2.2% Asia, 1.8% Europe).
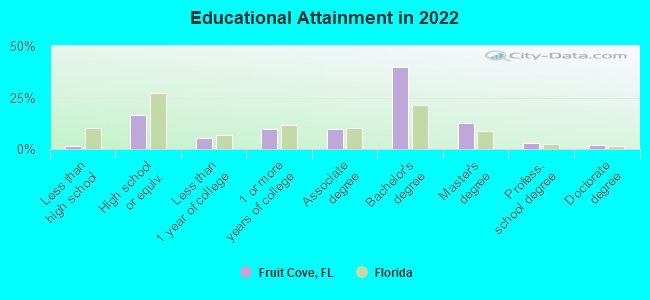
This place:
7.7%
Florida:
21.1%
Median real estate property taxes paid for housing units with mortgages in 2022: $3,229 (0.7%) Median real estate property taxes paid for housing units with no mortgage in 2022: $3,082 (0.7%)
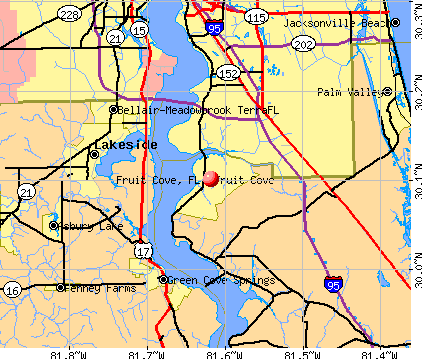
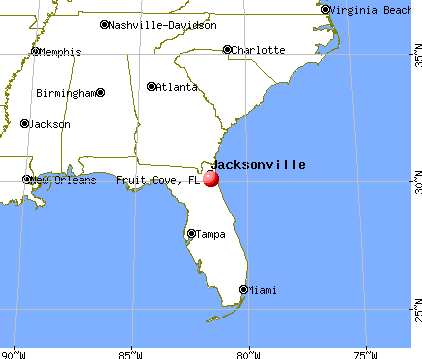
Nearest city with pop. 50,000+: Jacksonville, FL (15.3 miles , pop. 735,617).
Nearest city with pop. 1,000,000+: Philadelphia, PA (775.9 miles , pop. 1,517,550).
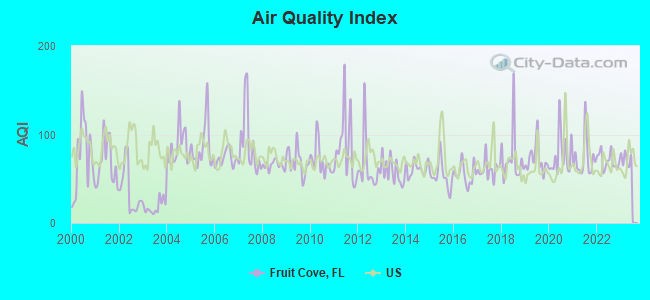
Air Quality Index (AQI) level in 2022 was 70.4. This is about average.
City:
70.4
U.S.:
72.6
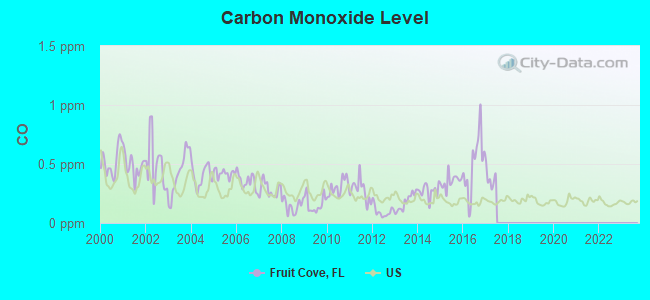
Carbon Monoxide (CO) [ppm] level in 2016 was 0.501. This is significantly worse than average.Closest monitor was 15.0 miles away from the city center.
City:
0.501
U.S.:
0.251
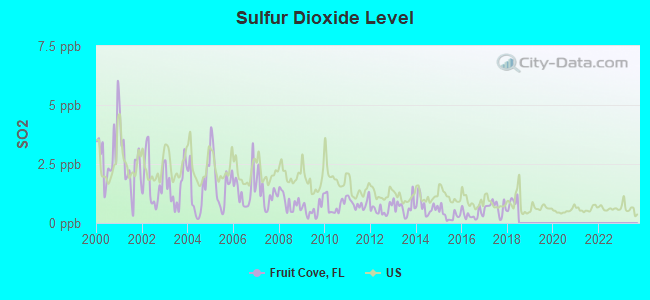
Sulfur Dioxide (SO2) [ppb] level in 2017 was 0.672. This is significantly better than average.Closest monitor was 8.5 miles away from the city center.
City:
0.672
U.S.:
1.515
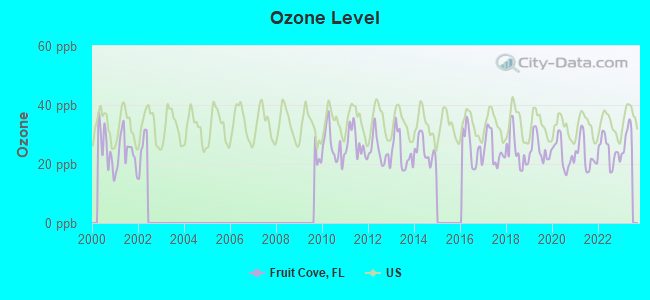
Ozone [ppb] level in 2022 was 24.5. This is better than average.Closest monitor was 8.9 miles away from the city center.
City:
24.5
U.S.:
33.3
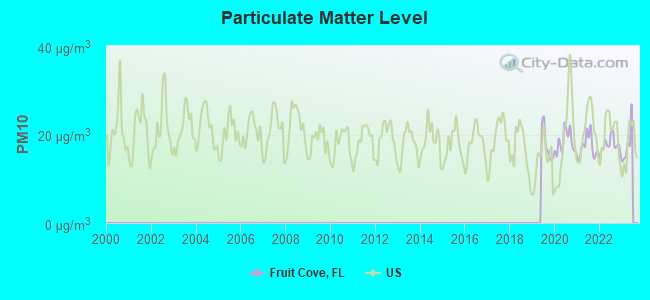
Particulate Matter (PM10) [µg/m3] level in 2022 was 17.5. This is about average.Closest monitor was 2.6 miles away from the city center.
City:
17.5
U.S.:
19.2
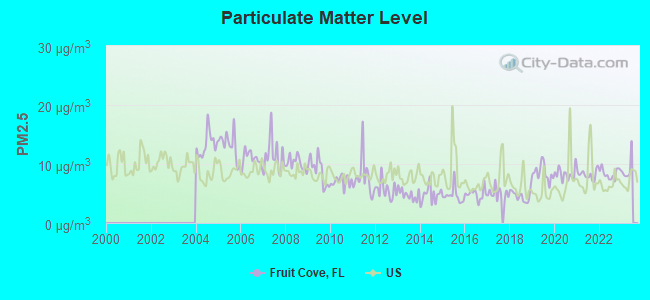
Particulate Matter (PM2.5) [µg/m3] level in 2022 was 8.39. This is about average.Closest monitor was 2.6 miles away from the city center.
City:
8.39
U.S.:
8.11
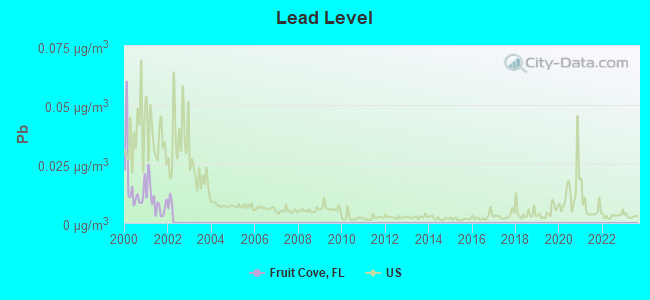
Lead (Pb) [µg/m3] level in 2002 was 0.00332. This is significantly better than average.Closest monitor was 14.6 miles away from the city center.
City:
0.00332
U.S.:
0.00931
Tornado activity:
Fruit Cove-area historical tornado activity is slightly below Florida state average. It is 17% smaller than the overall U.S. average.
On 2/7/1971, a category F3 (max. wind speeds 158-206 mph) tornado 14.5 miles away from the Fruit Cove place center causedbetween $50,000 and $500,000 in damages.
On 4/15/1958, a category F3 tornado 24.9 miles away from the place center injured 9 peopleand causedbetween $50,000 and $500,000 in damages.
Earthquake activity:
Fruit Cove-area historical earthquake activity is significantly above Florida state average. It is 83% smaller than the overall U.S. average.
On 9/10/2006 at 14:56:08, a magnitude 5.9 (5.9 MB, 5.5 MS, 5.8 MW, Class: Moderate, Intensity: VI - VII) earthquake occurred 405.3 miles away from Fruit Cove center On 11/22/1974 at 05:25:55, a magnitude 4.7 (4.7 MB, Class: Light, Intensity: IV - V) earthquake occurred 212.2 miles away from Fruit Cove center On 8/2/1974 at 08:52:09, a magnitude 4.9 (4.3 MB, 4.9 LG) earthquake occurred 265.8 miles away from the city center On 8/21/1992 at 16:31:55, a magnitude 4.4 (4.1 MB, 4.1 LG, 4.4 LG, Depth: 6.2 mi) earthquake occurred 222.3 miles away from Fruit Cove center On 9/4/2016 at 18:29:29, a magnitude 3.8 (3.8 ML, Class: Light, Intensity: II - III) earthquake occurred 124.3 miles away from Fruit Cove center On 9/21/2016 at 16:30:52, a magnitude 3.8 (3.8 ML) earthquake occurred 126.5 miles away from the city center Magnitude types: regional Lg-wave magnitude (LG), body-wave magnitude (MB), local magnitude (ML), surface-wave magnitude (MS), moment magnitude (MW)
Natural disasters:
The number of natural disasters in St. Johns County (5) is a lot smaller than the US average (15). Major Disasters (Presidential) Declared: 1 Emergencies Declared: 1
Causes of natural disasters: Hurricanes: 4, Other: 1 (Note: some incidents may be assigned to more than one category).
Hospitals and medical centers near Fruit Cove:
WESTMINSTER WOODS ON JULINGTON CREEK (Nursing Home, about 2 miles away; JACKSONVILLE, FL)
RIVER GARDEN HEBREW HOME FOR THE AGED (Nursing Home, about 5 miles away; JACKSONVILLE, FL)
ATKINSONS HOME HEALTH CARE, INC (Home Health Center, about 6 miles away; ORANGE PARK, FL)
JACKSONVILLE SOUTH DIALYSIS CENTER (Dialysis Facility, about 7 miles away; JACKSONVILLE, FL)
JOYAL HEALTH CARE SERVICES INC (Home Health Center, about 7 miles away; JACKSONVILLE, FL)
SOUTHLAKE NURSING AND REHABILITATION CENTER (Nursing Home, about 7 miles away; JACKSONVILLE, FL)
DOCTORS LAKE OF ORANGE PARK (Nursing Home, about 8 miles away; ORANGE PARK, FL)
Amtrak station near Fruit Cove:
20 miles: JACKSONVILLE (3570 CLIFFORD LANE) . Services: ticket office, fully wheelchair accessible, enclosed waiting area, public restrooms, public payphones, vending machines, free short-term parking, free long-term parking, call for car rental service, taxi stand, public transit connection.
Colleges/universities with over 2000 students nearest to Fruit Cove:
University of North Florida (about 14 miles; Jacksonville, FL; Full-time enrollment: 13,870)
Florida State College at Jacksonville (about 17 miles; Jacksonville, FL; FT enrollment: 21,810)
Jacksonville University (about 18 miles; Jacksonville, FL; FT enrollment: 3,335)
Flagler College-St Augustine (about 24 miles; Saint Augustine, FL; FT enrollment: 2,644)
Saint Johns River State College (about 32 miles; Palatka, FL; FT enrollment: 4,698)
University of Florida (about 55 miles; Gainesville, FL; FT enrollment: 43,357)
Santa Fe College (about 57 miles; Gainesville, FL; FT enrollment: 11,819)
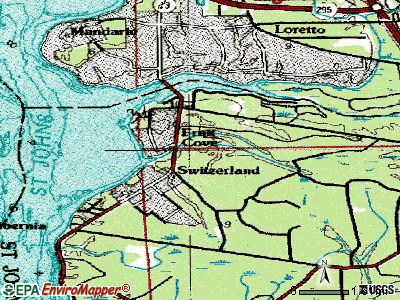
Notable locations in Fruit Cove: The Falls Country Club (A), Camp Saint Johns (B), Dupont Plaza (C), Saint Johns County Public Library System Bartram Trail Branch Library (D), Saint Johns County Sheriff's Office - Julington (E), Saint Johns County Fire Rescue Station 2 Switzerland (F). Display/hide their locations on the map
Churches in Fruit Cove include: Saint Johns Chapel (A), The Julington Creek Church of Christ (B), Cross Creek Presbyterian Church (C), Celebration Lutheran Church (D), Switzerland Community Church (E), Swiss Cove Church (F), San Juan del rio Church (G), Servants of Christ Church (H), Fruit Cove Baptist Church (I). Display/hide their locations on the map
St. Johns County has a predicted average indoor radon screening level less than 2 pCi/L (pico curies per liter) - Low Potential
Average household size:
This place:
3.0 people
Florida:
2.5 people
Percentage of family households:
This place:
84.1%
Whole state:
65.2%
Percentage of households with unmarried partners:
This place:
3.1%
Whole state:
7.3%
Likely homosexual households (counted as self-reported same-sex unmarried-partner households)
Lesbian couples: 0.4% of all households
Gay men: 0.2% of all households
72 people in nursing facilities/skilled-nursing facilities in 2010
2 people in group homes intended for adults in 2010
83 people in nursing homes in 2000
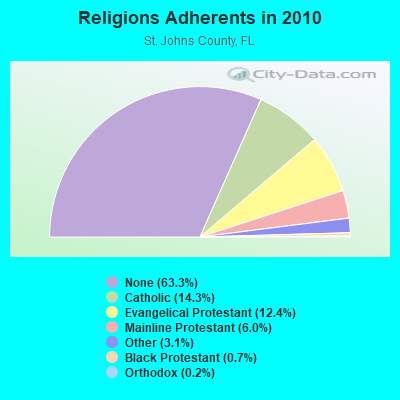
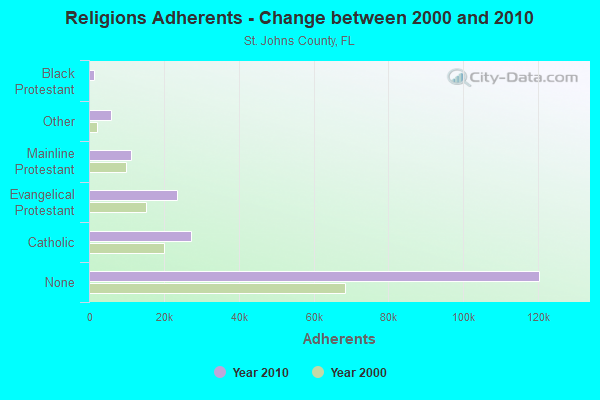
Religion statistics for Fruit Cove, FL (based on St. Johns County data)
Religion
Adherents
Congregations
Catholic
27,153
11
Evangelical Protestant
23,636
78
Mainline Protestant
11,329
18
Other
5,929
17
Black Protestant
1,300
9
Orthodox
320
1
None
120,372
-
Source: Clifford Grammich, Kirk Hadaway, Richard Houseal, Dale E.Jones, Alexei Krindatch, Richie Stanley and Richard H.Taylor. 2012. 2010 U.S.Religion Census: Religious Congregations & Membership Study. Association of Statisticians of American Religious Bodies. Jones, Dale E., et al. 2002. Congregations and Membership in the United States 2000. Nashville, TN: Glenmary Research Center. Graphs represent county-level data
Call Sign: KB9UAK, Licensee ID: L01494164, Grant Date: 12/20/2018, Expiration Date: 01/22/2029, Certifier: Zachary R Spoehr, Registrant: Zachary R Spoehr, 412 N Bridgestone Ave, Fruit Cove, FL 32259
Call Sign: KC4ZKK, Licensee ID: L00414722, Grant Date: 12/20/2022, Expiration Date: 12/20/2032, Registrant: John F Wester, 611 Cindy Court, Fruit Cove, FL 32259
Call Sign: W4NSM, Previous Call Sign: KN4QDY, Licensee ID: L02224484, Grant Date: 12/11/2018, Expiration Date: 12/11/2028, Certifier: Neal S Maceachron, Registrant: Neal S Maceachron, 1474 Otoes Place, Fruit Cove, FL 32259
Call Sign: KO4AAI, Licensee ID: L02306374, Grant Date: 11/18/2019, Expiration Date: 11/18/2029, Certifier: Rachel I Friederich, Registrant: Rachel I Friederich, 4417 N Pennycress Pl, Fruit Cove, FL 32259
Call Sign: KY4DL, Licensee ID: L02401621, Grant Date: 12/29/2020, Expiration Date: 12/29/2030, Certifier: Douglas W Hurst, Registrant: Douglas W Hurst, 1265 Lakewood Dr, Fruit Cove, FL 32259
FAA Registered Aircraft:
1
Aircraft: PIPER PA-24-260 (Category: Land, Seats: 4, Weight: Up to 12,499 Pounds, Speed: 135 mph), Engine: LYCOMING O&VO-360 SER (180 HP) (Reciprocating) N-Number: 8830P, N8830P, N-8830P, Serial Number: 24-4286, Year manufactured: 1965, Airworthiness Date: 07/12/1965, Certificate Issue Date: 10/19/2016 Registrant (Individual): Daniel H Canon, 2120 White Wing Dove Pl, Fruit Cove, FL 32259
Home Mortgage Disclosure Act Aggregated Statistics For Year 2009 (Based on 1 partial tract)
A) FHA, FSA/RHS & VA Home Purchase Loans
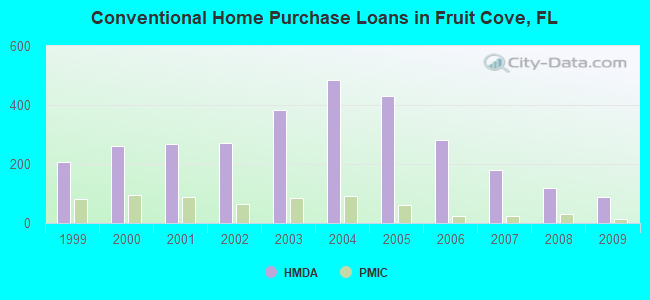
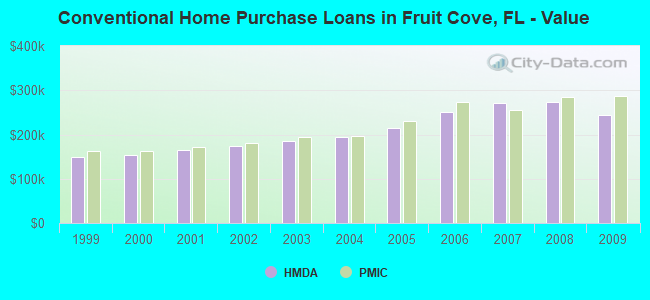
B) Conventional Home Purchase Loans
C) Refinancings
D) Home Improvement Loans
F) Non-occupant Loans on < 5 Family Dwellings (A B C & D)
G) Loans On Manufactured Home Dwelling (A B C & D)
Number
Average Value
Number
Average Value
Number
Average Value
Number
Average Value
Number
Average Value
Number
Average Value
LOANS ORIGINATED
86
$229,766
88
$244,694
248
$227,936
8
$141,962
9
$215,986
2
$90,275
APPLICATIONS APPROVED, NOT ACCEPTED
2
$283,925
9
$238,024
25
$254,432
0
$0
1
$161,480
1
$111,380
APPLICATIONS DENIED
13
$207,352
11
$214,375
78
$267,670
5
$85,496
4
$239,232
1
$142,150
APPLICATIONS WITHDRAWN
12
$225,140
13
$275,485
68
$250,482
3
$239,550
2
$160,590
1
$120,280
FILES CLOSED FOR INCOMPLETENESS
2
$184,240
3
$228,870
15
$268,558
0
$0
1
$260,400
0
$0
Aggregated Statistics For Year 2008 (Based on 1 partial tract)
A) FHA, FSA/RHS & VA Home Purchase Loans
B) Conventional Home Purchase Loans
C) Refinancings
D) Home Improvement Loans
F) Non-occupant Loans on < 5 Family Dwellings (A B C & D)
G) Loans On Manufactured Home Dwelling (A B C & D)
Number
Average Value
Number
Average Value
Number
Average Value
Number
Average Value
Number
Average Value
Number
Average Value
LOANS ORIGINATED
52
$229,530
120
$274,400
132
$226,666
9
$102,568
11
$195,348
3
$125,963
APPLICATIONS APPROVED, NOT ACCEPTED
1
$136,050
20
$313,132
33
$269,265
2
$61,030
3
$191,233
2
$131,725
APPLICATIONS DENIED
12
$212,086
17
$308,631
78
$257,130
10
$120,767
7
$189,853
3
$81,290
APPLICATIONS WITHDRAWN
5
$258,114
21
$269,994
38
$265,991
2
$131,725
3
$202,170
0
$0
FILES CLOSED FOR INCOMPLETENESS
2
$159,830
5
$339,846
12
$275,449
1
$44,500
1
$202,420
0
$0
Aggregated Statistics For Year 2007 (Based on 1 partial tract)
A) FHA, FSA/RHS & VA Home Purchase Loans
B) Conventional Home Purchase Loans
C) Refinancings
D) Home Improvement Loans
F) Non-occupant Loans on < 5 Family Dwellings (A B C & D)
G) Loans On Manufactured Home Dwelling (A B C & D)
Number
Average Value
Number
Average Value
Number
Average Value
Number
Average Value
Number
Average Value
Number
Average Value
LOANS ORIGINATED
13
$239,981
179
$271,303
201
$224,143
28
$114,453
17
$213,612
2
$115,070
APPLICATIONS APPROVED, NOT ACCEPTED
0
$0
23
$260,503
37
$259,750
8
$82,394
3
$158,343
2
$76,035
APPLICATIONS DENIED
4
$212,405
21
$295,024
87
$279,727
19
$113,726
8
$189,009
2
$124,605
APPLICATIONS WITHDRAWN
2
$242,855
21
$265,392
57
$243,405
5
$73,188
3
$172,160
0
$0
FILES CLOSED FOR INCOMPLETENESS
0
$0
6
$290,368
18
$308,522
1
$151,050
1
$136,050
0
$0
Aggregated Statistics For Year 2006 (Based on 1 partial tract)
A) FHA, FSA/RHS & VA Home Purchase Loans
B) Conventional Home Purchase Loans
C) Refinancings
D) Home Improvement Loans
F) Non-occupant Loans on < 5 Family Dwellings (A B C & D)
G) Loans On Manufactured Home Dwelling (A B C & D)
Number
Average Value
Number
Average Value
Number
Average Value
Number
Average Value
Number
Average Value
Number
Average Value
LOANS ORIGINATED
6
$236,880
281
$251,182
257
$212,591
45
$92,565
44
$182,882
4
$138,592
APPLICATIONS APPROVED, NOT ACCEPTED
1
$187,160
39
$265,072
41
$210,858
10
$55,997
10
$185,715
1
$32,300
APPLICATIONS DENIED
1
$208,020
41
$218,227
97
$245,531
18
$106,919
12
$186,550
4
$135,350
APPLICATIONS WITHDRAWN
1
$167,580
38
$236,158
86
$201,870
8
$148,639
15
$190,487
1
$134,520
FILES CLOSED FOR INCOMPLETENESS
0
$0
8
$252,106
23
$249,203
2
$142,660
2
$236,755
1
$55,440
Aggregated Statistics For Year 2005 (Based on 1 partial tract)
A) FHA, FSA/RHS & VA Home Purchase Loans
B) Conventional Home Purchase Loans
C) Refinancings
D) Home Improvement Loans
F) Non-occupant Loans on < 5 Family Dwellings (A B C & D)
G) Loans On Manufactured Home Dwelling (A B C & D)
Number
Average Value
Number
Average Value
Number
Average Value
Number
Average Value
Number
Average Value
Number
Average Value
LOANS ORIGINATED
10
$196,345
430
$215,128
292
$198,283
44
$82,197
68
$165,329
3
$68,577
APPLICATIONS APPROVED, NOT ACCEPTED
1
$76,540
32
$209,750
49
$177,937
7
$62,667
5
$157,666
2
$87,100
APPLICATIONS DENIED
0
$0
48
$238,978
84
$199,081
20
$80,600
12
$154,021
4
$79,278
APPLICATIONS WITHDRAWN
1
$145,710
40
$245,711
94
$216,996
12
$212,849
6
$160,167
2
$149,020
FILES CLOSED FOR INCOMPLETENESS
0
$0
10
$240,568
31
$223,513
2
$60,395
2
$126,895
0
$0
Aggregated Statistics For Year 2004 (Based on 1 partial tract)
A) FHA, FSA/RHS & VA Home Purchase Loans
B) Conventional Home Purchase Loans
C) Refinancings
D) Home Improvement Loans
F) Non-occupant Loans on < 5 Family Dwellings (A B C & D)
G) Loans On Manufactured Home Dwelling (A B C & D)
Number
Average Value
Number
Average Value
Number
Average Value
Number
Average Value
Number
Average Value
Number
Average Value
LOANS ORIGINATED
41
$158,938
484
$193,694
265
$179,785
33
$61,402
54
$156,352
6
$90,870
APPLICATIONS APPROVED, NOT ACCEPTED
1
$234,460
35
$197,918
41
$197,312
9
$53,827
5
$129,642
3
$172,670
APPLICATIONS DENIED
5
$135,288
32
$162,696
99
$182,580
17
$61,915
6
$130,243
7
$68,516
APPLICATIONS WITHDRAWN
3
$182,417
50
$191,264
80
$197,254
9
$77,449
7
$175,140
1
$54,930
FILES CLOSED FOR INCOMPLETENESS
0
$0
9
$264,670
18
$225,098
1
$26,450
1
$130,460
0
$0
Aggregated Statistics For Year 2003 (Based on 1 partial tract)
A) FHA, FSA/RHS & VA Home Purchase Loans
B) Conventional Home Purchase Loans
C) Refinancings
D) Home Improvement Loans
F) Non-occupant Loans on < 5 Family Dwellings (A B C & D)
Number
Average Value
Number
Average Value
Number
Average Value
Number
Average Value
Number
Average Value
LOANS ORIGINATED
34
$169,798
384
$184,575
617
$160,193
15
$58,235
39
$131,219
APPLICATIONS APPROVED, NOT ACCEPTED
1
$121,050
19
$206,518
64
$159,235
4
$38,335
2
$109,475
APPLICATIONS DENIED
3
$159,530
22
$195,210
103
$161,323
10
$37,738
4
$114,690
APPLICATIONS WITHDRAWN
4
$171,270
41
$194,087
101
$172,287
5
$40,994
5
$123,742
FILES CLOSED FOR INCOMPLETENESS
1
$113,420
13
$229,281
24
$202,539
3
$24,497
2
$97,780
Aggregated Statistics For Year 2002 (Based on 1 partial tract)
A) FHA, FSA/RHS & VA Home Purchase Loans
B) Conventional Home Purchase Loans
C) Refinancings
D) Home Improvement Loans
F) Non-occupant Loans on < 5 Family Dwellings (A B C & D)
Number
Average Value
Number
Average Value
Number
Average Value
Number
Average Value
Number
Average Value
LOANS ORIGINATED
23
$159,015
272
$174,238
340
$157,220
21
$60,427
25
$129,907
APPLICATIONS APPROVED, NOT ACCEPTED
2
$121,555
22
$167,225
45
$157,316
5
$34,432
1
$117,740
APPLICATIONS DENIED
1
$187,420
15
$149,918
73
$127,059
11
$35,047
1
$120,540
APPLICATIONS WITHDRAWN
3
$169,703
23
$168,933
56
$155,282
3
$26,787
2
$89,130
FILES CLOSED FOR INCOMPLETENESS
1
$165,550
10
$198,329
18
$171,582
1
$20,600
1
$119,270
Aggregated Statistics For Year 2001 (Based on 1 partial tract)
A) FHA, FSA/RHS & VA Home Purchase Loans
B) Conventional Home Purchase Loans
C) Refinancings
D) Home Improvement Loans
F) Non-occupant Loans on < 5 Family Dwellings (A B C & D)
Number
Average Value
Number
Average Value
Number
Average Value
Number
Average Value
Number
Average Value
LOANS ORIGINATED
29
$150,616
268
$165,697
240
$146,603
24
$36,164
10
$139,407
APPLICATIONS APPROVED, NOT ACCEPTED
2
$115,325
21
$153,960
29
$113,058
10
$38,348
1
$80,360
APPLICATIONS DENIED
2
$183,350
14
$138,702
58
$122,656
11
$42,976
2
$65,610
APPLICATIONS WITHDRAWN
7
$147,567
25
$155,794
47
$129,433
5
$47,706
2
$73,875
FILES CLOSED FOR INCOMPLETENESS
1
$70,950
5
$123,438
11
$134,872
2
$31,280
0
$0
Aggregated Statistics For Year 2000 (Based on 1 partial tract)
A) FHA, FSA/RHS & VA Home Purchase Loans
B) Conventional Home Purchase Loans
C) Refinancings
D) Home Improvement Loans
F) Non-occupant Loans on < 5 Family Dwellings (A B C & D)
Number
Average Value
Number
Average Value
Number
Average Value
Number
Average Value
Number
Average Value
LOANS ORIGINATED
26
$146,937
261
$152,662
35
$109,167
29
$34,427
11
$130,872
APPLICATIONS APPROVED, NOT ACCEPTED
1
$95,360
22
$136,721
11
$118,758
14
$29,172
1
$154,360
APPLICATIONS DENIED
2
$138,340
22
$105,847
28
$88,832
12
$29,012
1
$96,630
APPLICATIONS WITHDRAWN
3
$130,200
28
$141,772
18
$75,400
5
$61,032
3
$129,607
FILES CLOSED FOR INCOMPLETENESS
0
$0
5
$138,542
5
$109,706
1
$35,600
1
$45,270
Aggregated Statistics For Year 1999 (Based on 1 partial tract)
A) FHA, FSA/RHS & VA Home Purchase Loans
B) Conventional Home Purchase Loans
C) Refinancings
D) Home Improvement Loans
F) Non-occupant Loans on < 5 Family Dwellings (A B C & D)


 Recent articles from our blog. Our writers, many of them Ph.D. graduates or candidates, create easy-to-read articles on a wide variety of topics.


 (15.3 miles