Galion, Ohio

Galion: Galion Public Library
![Galion: The Central Hotel [Senior Appartments] From the wrecking ball to the National Treasure](https://pics2.city-data.com/picthumbc/thumbc33514.jpg)
Galion: The Central Hotel [Senior Appartments] From the wrecking ball to the National Treasure

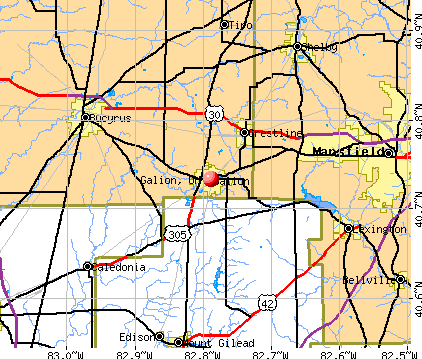
Galion
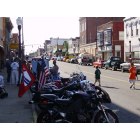
Galion: Galion's car show
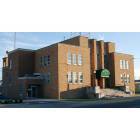
Galion: Galion City Building

Galion: Galion Post Office
- add
your
Submit your own pictures of this city and show them to the world
- OSM Map
- General Map
- Google Map
- MSN Map
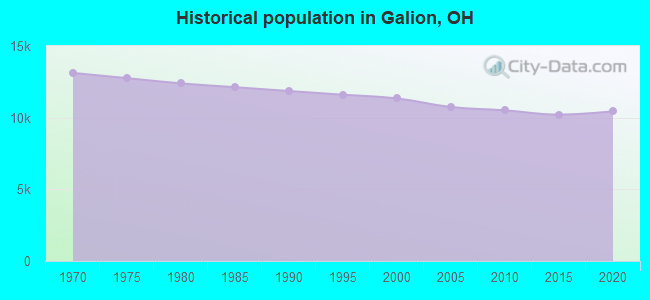
Population change since 2000: -9.1%
 |
| Males: 4,848 | |
| Females: 5,460 |
| Median resident age: | 42.1 years |
| Ohio median age: | 39.9 years |
Zip codes: 44833.
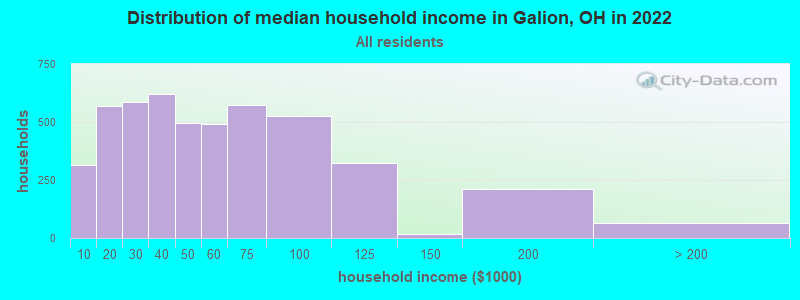
| Galion: | $43,615 |
| OH: | $65,720 |
Estimated per capita income in 2022: $24,983 (it was $16,113 in 2000)
Galion city income, earnings, and wages data
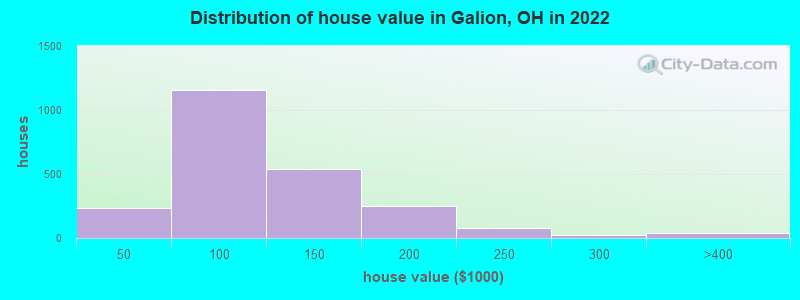
Estimated median house or condo value in 2022: $103,999 (it was $70,000 in 2000)
| Galion: | $103,999 |
| OH: | $204,100 |
Mean prices in 2022: all housing units: $112,643; detached houses: $112,201; townhouses or other attached units: $165,034; in 2-unit structures: $84,143; mobile homes: $8,427
Median gross rent in 2022: $765.
(18.7% for White Non-Hispanic residents, 1.2% for Black residents, 37.8% for two or more races residents)
Detailed information about poverty and poor residents in Galion, OH
Compare current foreclosures in Galion, OH:
| Photo | Address | Area | Beds / Baths | Price | Details |
|---|---|---|---|---|---|

|
#1
E Walnut St
Galion, OH 44833
|
1,138 sq. feet
|
1 baths 3 beds |
show details | |

|
#2
Oak St
Galion, OH 44833
|
1,140 sq. feet
|
1 baths 3 beds |
show details | |

|
#3
Cherry St
Galion, OH 44833
|
1,056 sq. feet
|
2 baths 2 beds |
show details | |

|
#4
Beechwood Dr
Galion, OH 44833
|
1,930 sq. feet
|
2 baths 4 beds |
show details | |

|
#5
State Route 61
Galion, OH 44833
|
1,040 sq. feet
|
1 baths 3 beds |
show details | |

|
#6
E Brandt Rd
Galion, OH 44833
|
1,090 sq. feet
|
1 baths 3 beds |
show details | |

|
#7
Grand St
Galion, OH 44833
|
885 sq. feet
|
1 baths 2 beds |
show details | |

|
#8
Euclid Ave
Galion, OH 44833
|
948 sq. feet
|
1 baths 2 beds |
show details | |

|
#9
Orange St
Galion, OH 44833
|
2,441 sq. feet
|
2 baths 3 beds |
show details | |

|
#10
Township Road 34
Galion, OH 44833
|
1,594 sq. feet
|
1 baths 3 beds |
show details |
| Photo | Address | Area | Beds / Baths | Price | Details |
|---|---|---|---|---|---|

|
#11
Harding Way E
Galion, OH 44833
|
1,920 sq. feet
|
1 baths 4 beds |
show details | |

|
#12
Hessenauer Dr
Galion, OH 44833
|
2,128 sq. feet
|
2 baths 3 beds |
show details | |

|
#13
W Summit St
Galion, OH 44833
|
1,395 sq. feet
|
1 baths 3 beds |
show details | |

|
#14
3rd Ave
Galion, OH 44833
|
1,708 sq. feet
|
1 baths 2 beds |
show details | |

|
#15
Charles St
Galion, OH 44833
|
867 sq. feet
|
1 baths 2 beds |
show details | |

|
#16
Pine St
Galion, OH 44833
|
904 sq. feet
|
1 baths 3 beds |
show details | |

|
#17
Tidd Dr
Galion, OH 44833
|
1,472 sq. feet
|
1 baths 3 beds |
show details | |

|
#18
E Atwood St
Galion, OH 44833
|
867 sq. feet
|
2 baths 3 beds |
show details | |

|
#19
Cherry St
Galion, OH 44833
|
1,480 sq. feet
|
2 baths 3 beds |
show details | |

|
#20
1st Ave
Galion, OH 44833
|
- sq. feet
|
1 baths 2 beds |
show details |
| Photo | Address | Area | Beds / Baths | Price | Details |
|---|---|---|---|---|---|

|
#21
Cherry St
Galion, OH 44833
|
- sq. feet
|
- baths - beds |
show details | |

|
#22
Ohio 19
Galion, OH 44833
|
- sq. feet
|
- baths - beds |
show details | |

|
#23
Maple Heights Dr
Galion, OH 44833
|
- sq. feet
|
- baths - beds |
show details | |

|
#24
Edward St
Galion, OH 44833
|
- sq. feet
|
- baths - beds |
show details | |

|
#25
Portland Way S
Galion, OH 44833
|
- sq. feet
|
- baths - beds |
show details | |

|
#26
Baehr St
Galion, OH 44833
|
- sq. feet
|
- baths - beds |
show details | |

|
#27
N Market St
Galion, OH 44833
|
- sq. feet
|
- baths - beds |
show details | |

|
#28
Woodline Dr
Galion, OH 44833
|
- sq. feet
|
- baths - beds |
show details | |

|
#29
Smith St
Galion, OH 44833
|
- sq. feet
|
- baths - beds |
show details | |

|
#30
Bucyrus Rd
Galion, OH 44833
|
- sq. feet
|
- baths - beds |
show details |
| Photo | Address | Area | Beds / Baths | Price | Details |
|---|---|---|---|---|---|

|
Check over 1 million property listings on Foreclosure.com!
|
browse all offers | |||
| Photo | Address | Area | Beds / Baths | Price | Details |
|---|


- 9,74794.1%White alone
- 2282.2%Two or more races
- 1451.4%Hispanic
- 1081.0%Black alone
- 400.4%Asian alone
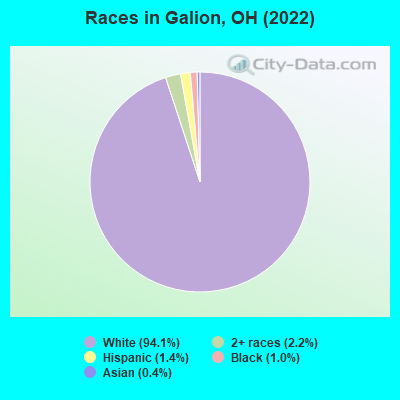
Races in Galion detailed stats: ancestries, foreign born residents, place of birth
According to our research of Ohio and other state lists, there were 51 registered sex offenders living in Galion, Ohio as of June 19, 2024.
The ratio of all residents to sex offenders in Galion is 201 to 1.
Type |
2009 |
2010 |
2011 |
2012 |
2013 |
2014 |
2015 |
2016 |
2017 |
2018 |
2019 |
2020 |
2021 |
2022 |
|---|---|---|---|---|---|---|---|---|---|---|---|---|---|---|
| Murders (per 100,000) | 0 (0.0) | 0 (0.0) | 0 (0.0) | 0 (0.0) | 0 (0.0) | 0 (0.0) | 0 (0.0) | 0 (0.0) | 0 (0.0) | 0 (0.0) | 0 (0.0) | 0 (0.0) | 0 (0.0) | 0 (0.0) |
| Rapes (per 100,000) | 2 (18.8) | 4 (38.1) | 6 (57.0) | 2 (19.2) | 3 (29.4) | 3 (29.4) | 6 (59.4) | 5 (49.7) | 7 (69.5) | 5 (50.2) | 4 (40.4) | 2 (20.2) | 6 (60.8) | 4 (38.7) |
| Robberies (per 100,000) | 5 (47.0) | 7 (66.6) | 9 (85.6) | 3 (28.8) | 8 (78.4) | 7 (68.5) | 5 (49.5) | 4 (39.8) | 0 (0.0) | 2 (20.1) | 3 (30.3) | 1 (10.1) | 1 (10.1) | 1 (9.7) |
| Assaults (per 100,000) | 9 (84.6) | 6 (57.1) | 7 (66.5) | 6 (57.6) | 11 (107.8) | 9 (88.1) | 15 (148.6) | 8 (79.6) | 5 (49.6) | 10 (100.4) | 6 (60.7) | 3 (30.3) | 15 (152.1) | 11 (106.4) |
| Burglaries (per 100,000) | 114 (1,071) | 134 (1,275) | 152 (1,445) | 150 (1,440) | 173 (1,696) | 121 (1,185) | 109 (1,080) | 73 (726.2) | 51 (506.3) | 26 (261.1) | 21 (212.3) | 13 (131.1) | 17 (172.3) | 14 (135.4) |
| Thefts (per 100,000) | 354 (3,326) | 402 (3,824) | 413 (3,926) | 464 (4,455) | 406 (3,980) | 433 (4,239) | 287 (2,843) | 264 (2,626) | 228 (2,263) | 190 (1,908) | 114 (1,153) | 70 (705.9) | 64 (648.8) | 81 (783.5) |
| Auto thefts (per 100,000) | 5 (47.0) | 1 (9.5) | 11 (104.6) | 7 (67.2) | 10 (98.0) | 15 (146.8) | 7 (69.3) | 4 (39.8) | 5 (49.6) | 4 (40.2) | 10 (101.1) | 5 (50.4) | 3 (30.4) | 4 (38.7) |
| Arson (per 100,000) | 1 (9.4) | 1 (9.5) | 0 (0.0) | 0 (0.0) | 0 (0.0) | 0 (0.0) | 1 (9.9) | 3 (29.8) | 2 (19.9) | 1 (10.0) | 0 (0.0) | 0 (0.0) | 1 (10.1) | 1 (9.7) |
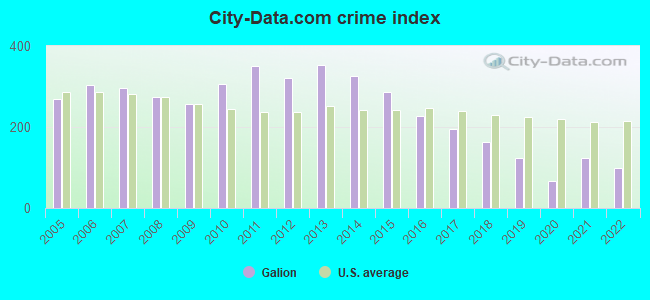
| City-Data.com crime index | 257.8 | 304.8 | 351.1 | 319.9 | 354.3 | 325.9 | 287.0 | 226.7 | 195.5 | 164.1 | 122.6 | 66.7 | 122.6 | 99.1 |
The City-Data.com crime index weighs serious crimes and violent crimes more heavily. Higher means more crime, U.S. average is 246.1. It adjusts for the number of visitors and daily workers commuting into cities.
Crime rate in Galion detailed stats: murders, rapes, robberies, assaults, burglaries, thefts, arson
Full-time law enforcement employees in 2021, including police officers: 23 (19 officers - 18 male; 1 female).
| Officers per 1,000 residents here: | 1.93 |
| Ohio average: | 2.31 |
 Recent articles from our blog. Our writers, many of them Ph.D. graduates or candidates, create easy-to-read articles on a wide variety of topics.

 | 2-Part Question: A) Why Did You Leave Ohio or Move to Ohio B) What area did you leave/move to, and why? (100 replies) |
| Commuter trains in Ohio (66 replies) |
| Do you support the proposed Ohio Rail (3-C Connector)? (362 replies) |
| The life in Mansfield ohio (9 replies) |
| Question about Hwy 30 (6 replies) |
| If I describe my perfect town, can you tell me where it is? (22 replies) |
Latest news from Galion, OH collected exclusively by city-data.com from local newspapers, TV, and radio stations
Ancestries: German (31.6%), American (14.3%), English (9.3%), Irish (6.3%), Italian (3.8%), Polish (1.5%).
Current Local Time: EST time zone
Incorporated in 1985
Elevation: 1166 feet
Land area: 4.96 square miles.
Population density: 2,078 people per square mile (low).
119 residents are foreign born
| This city: | 1.1% |
| Ohio: | 4.9% |
Median real estate property taxes paid for housing units with mortgages in 2022: $1,247 (1.2%)
Median real estate property taxes paid for housing units with no mortgage in 2022: $1,161 (1.2%)
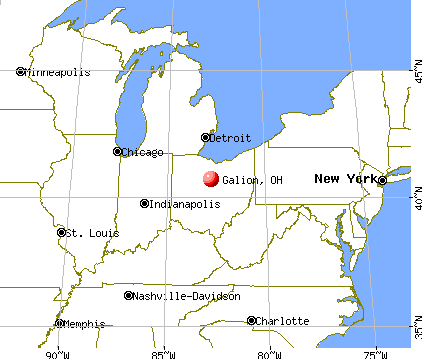
Nearest city with pop. 50,000+: Columbus, OH  (52.5 miles , pop. 711,470).
Nearest city with pop. 1,000,000+: Chicago, IL (265.4 miles , pop. 2,896,016).
Nearest cities:
), ), ), ), ), Latitude: 40.73 N, Longitude: 82.79 W
Daytime population change due to commuting: -501 (-4.8%)
Workers who live and work in this city: 1,554 (34.7%)
Area codes: 419, 567

Galion, Ohio accommodation & food services, waste management - Economy and Business Data
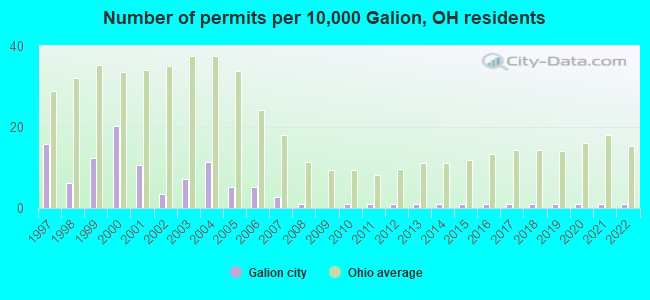
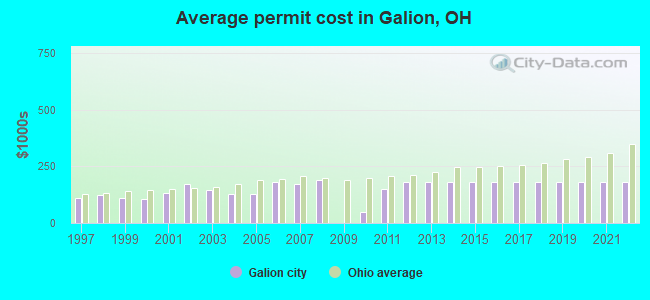
Single-family new house construction building permits:
- 2022: 1 building, cost: $180,000
- 2021: 1 building, cost: $180,000
- 2020: 1 building, cost: $180,000
- 2019: 1 building, cost: $180,000
- 2018: 1 building, cost: $180,000
- 2017: 1 building, cost: $180,000
- 2016: 1 building, cost: $180,000
- 2015: 1 building, cost: $180,000
- 2014: 1 building, cost: $180,000
- 2013: 1 building, cost: $180,000
- 2012: 1 building, cost: $180,000
- 2011: 1 building, cost: $150,000
- 2010: 1 building, cost: $50,000
- 2008: 1 building, cost: $187,700
- 2007: 3 buildings, average cost: $170,400
- 2006: 6 buildings, average cost: $179,100
- 2005: 6 buildings, average cost: $129,700
- 2004: 13 buildings, average cost: $128,600
- 2003: 8 buildings, average cost: $143,700
- 2002: 4 buildings, average cost: $172,300
- 2001: 12 buildings, average cost: $132,400
- 2000: 23 buildings, average cost: $107,800
- 1999: 14 buildings, average cost: $111,000
- 1998: 7 buildings, average cost: $122,400
- 1997: 18 buildings, average cost: $109,100
| Here: | 3.7% |
| Ohio: | 3.1% |
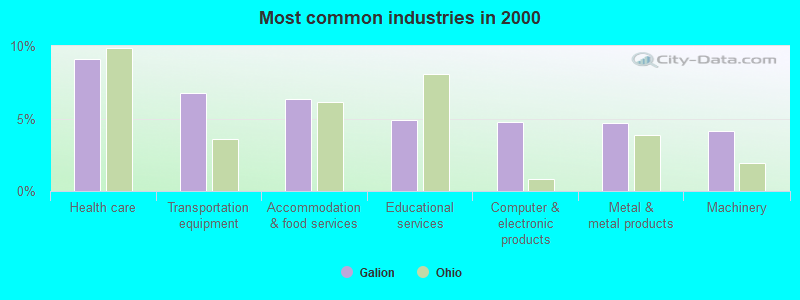
- Health care (9.1%)
- Transportation equipment (6.8%)
- Accommodation & food services (6.3%)
- Educational services (4.9%)
- Computer & electronic products (4.7%)
- Metal & metal products (4.7%)
- Machinery (4.1%)
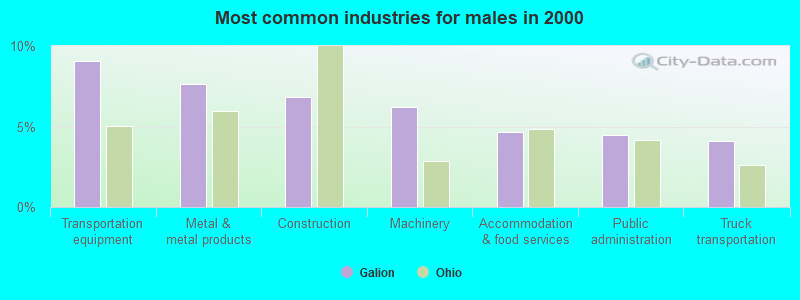
- Transportation equipment (9.1%)
- Metal & metal products (7.6%)
- Construction (6.8%)
- Machinery (6.2%)
- Accommodation & food services (4.6%)
- Public administration (4.5%)
- Truck transportation (4.1%)
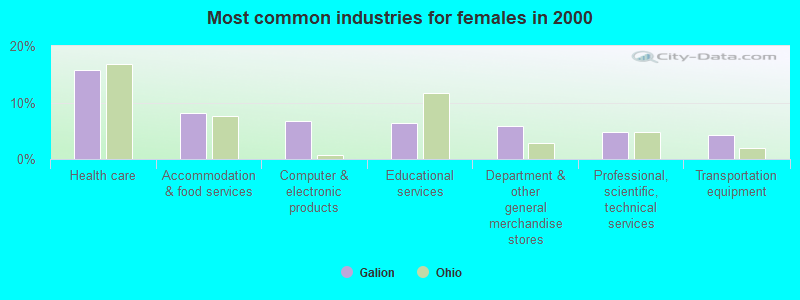
- Health care (15.7%)
- Accommodation & food services (8.1%)
- Computer & electronic products (6.7%)
- Educational services (6.5%)
- Department & other general merchandise stores (5.8%)
- Professional, scientific, technical services (4.8%)
- Transportation equipment (4.3%)
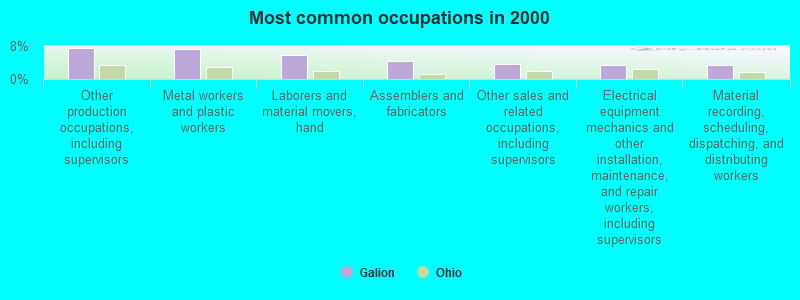
- Other production occupations, including supervisors (7.5%)
- Metal workers and plastic workers (7.3%)
- Laborers and material movers, hand (5.7%)
- Assemblers and fabricators (4.5%)
- Other sales and related occupations, including supervisors (3.7%)
- Electrical equipment mechanics and other installation, maintenance, and repair workers, including supervisors (3.5%)
- Material recording, scheduling, dispatching, and distributing workers (3.4%)
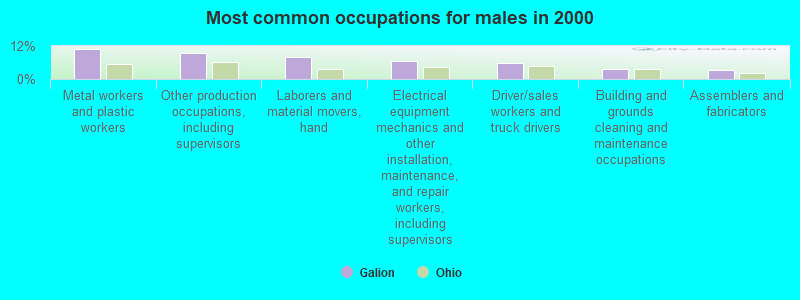
- Metal workers and plastic workers (11.0%)
- Other production occupations, including supervisors (9.5%)
- Laborers and material movers, hand (7.9%)
- Electrical equipment mechanics and other installation, maintenance, and repair workers, including supervisors (6.6%)
- Driver/sales workers and truck drivers (5.8%)
- Building and grounds cleaning and maintenance occupations (3.8%)
- Assemblers and fabricators (3.2%)

- Secretaries and administrative assistants (6.1%)
- Assemblers and fabricators (5.8%)
- Other production occupations, including supervisors (5.5%)
- Nursing, psychiatric, and home health aides (5.1%)
- Other sales and related occupations, including supervisors (4.3%)
- Preschool, kindergarten, elementary, and middle school teachers (4.2%)
- Material recording, scheduling, dispatching, and distributing workers (4.1%)
Average climate in Galion, Ohio
Based on data reported by over 4,000 weather stations


|
|


Tornado activity:
Galion-area historical tornado activity is near Ohio state average. It is 30% greater than the overall U.S. average.
On 6/13/1981, a category F3 (max. wind speeds 158-206 mph) tornado 13.1 miles away from the Galion city center killed 4 people and injured 56 people and caused between $5,000,000 and $50,000,000 in damages.
On 4/11/1965, a category F4 (max. wind speeds 207-260 mph) tornado 44.4 miles away from the city center killed 18 people and injured 200 people and caused between $5,000,000 and $50,000,000 in damages.
Earthquake activity:
Galion-area historical earthquake activity is significantly above Ohio state average. It is 30% smaller than the overall U.S. average.On 9/25/1998 at 19:52:52, a magnitude 5.2 (4.8 MB, 4.3 MS, 5.2 LG, 4.5 MW, Depth: 3.1 mi, Class: Moderate, Intensity: VI - VII) earthquake occurred 135.2 miles away from the city center
On 1/31/1986 at 16:46:43, a magnitude 5.0 (5.0 MB) earthquake occurred 103.9 miles away from Galion center
On 7/27/1980 at 18:52:21, a magnitude 5.2 (5.1 MB, 4.7 MS, 5.0 UK, 5.2 UK) earthquake occurred 185.4 miles away from the city center
On 8/23/2011 at 17:51:04, a magnitude 5.8 (5.8 MW, Depth: 3.7 mi) earthquake occurred 324.8 miles away from the city center
On 7/12/1986 at 08:19:37, a magnitude 4.5 (4.5 MB, Class: Light, Intensity: IV - V) earthquake occurred 84.2 miles away from Galion center
On 4/18/2008 at 09:36:59, a magnitude 5.4 (5.1 MB, 4.8 MS, 5.4 MW, 5.2 MW) earthquake occurred 314.1 miles away from Galion center
Magnitude types: regional Lg-wave magnitude (LG), body-wave magnitude (MB), surface-wave magnitude (MS), moment magnitude (MW)
Natural disasters:
The number of natural disasters in Crawford County (11) is smaller than the US average (15).Major Disasters (Presidential) Declared: 5
Emergencies Declared: 5
Causes of natural disasters: Floods: 5, Storms: 4, Snows: 2, Snowstorms: 2, Blizzard: 1, Hurricane: 1, Mudslide: 1, Tornado: 1, Winter Storm: 1, Other: 1 (Note: some incidents may be assigned to more than one category).

Main business address for: PECO II INC (CONSTRUCTION SPECIAL TRADE CONTRACTORS).
Hospitals and medical centers in Galion:
- GALION COMMUNITY HOSPITAL (Voluntary non-profit - Church, provides emergency services, 269 PORTLAND WAY SOUTH)
- HOMECARE MATTERS HOME HEALTH (1220 NORTH MARKET STREET)
- ATWOOD MANOR NURSING CENTER (347 W ATWOOD ST)
- GALION POINTE, INC (925 WAGNER AVE)
- MILL CREEK NURSING AND REHABILITATION (900 WEDGEWOOD CIRCLE)
- OLENTANGY WOODS (935 ROSEWOOD DR)
Airports and heliports located in Galion:
- Galion Municipal Airport (GQQ) (Runways: 1, Itinerant Ops: 1,800, Local Ops: 4,400, Military Ops: 16)
- Horning Airport (OH21) (Runways: 1, Itinerant Ops: 100, Local Ops: 200)
- Galion Community Hospital Heliport (01OI)
Colleges/universities with over 2000 students nearest to Galion:
- Ashland University (about 27 miles; Ashland, OH; Full-time enrollment: 5,151)
- Tiffin University (about 34 miles; Tiffin, OH; FT enrollment: 4,927)
- Otterbein University (about 43 miles; Westerville, OH; FT enrollment: 2,933)
- The College of Wooster (about 46 miles; Wooster, OH; FT enrollment: 2,112)
- Terra State Community College (about 48 miles; Fremont, OH; FT enrollment: 2,119)
- Denison University (about 48 miles; Granville, OH; FT enrollment: 2,268)
- Oberlin College (about 49 miles; Oberlin, OH; FT enrollment: 2,795)
Public high schools in Galion:
- NORTHMOR HIGH SCHOOL (Students: 570, Location: 7819 STATE ROUTE 19, Grades: 7-12)
- GALION HIGH SCHOOL (Students: 550, Location: 472 PORTLAND WAY N, Grades: 9-12)
Public elementary/middle schools in Galion:
- PRIMARY ELEMENTARY SCHOOL (Students: 474, Location: 478 PORTLAND WAY N, Grades: PK-2)
- INTERMEDIATE ELEMENTARY SCHOOL (Students: 462, Location: 476 PORTLAND WAY N, Grades: 3-6)
- GALION MIDDLE SCHOOL (Students: 455, Location: 474 PORTLAND WAY N, Grades: 6-8)
- NORTHMOR ELEMENTARY SCHOOL (Location: 7819 STATE ROUTE 19, Grades: PK-6)
Private elementary/middle school in Galion:
Points of interest:
Notable locations in Galion: Galion Water Works (A), Crawford County Childrens Home (B), Galion Water Treatment Plant (C), Galion Fire Department (D), Galion City Hall (E), Galion Public Library (F). Display/hide their locations on the map
Shopping Center: Washington Street Station Mall Shopping Center (1). Display/hide its location on the map
Churches in Galion include: Seventh Day Adventist Church (A), First Church of Christ Scientist (B), First Church of Christ (C), First Baptist Church (D), Church of the Nazarene (E), First Church of the Open Bible (F), Peace Lutheran Church (G), Trinity Lutheran Church (H), Saint Paul United Methodist Church (I). Display/hide their locations on the map
Parks in Galion include: Cobey Park (1), Eastside Park (2), South Park (3), Public Square (4), Heise Park (5). Display/hide their locations on the map
Tourist attractions: Galion Historical Society (Historical Places & Services; 132 South Union Street), Brownella (Historical Places & Services; 132 South Union Street).
Hotels: Deb's Cedar Cabin Retreats (5310 State Route 288), Harvest Inn (225 Harding Way East).
Court: Crawford County Municipal Court Eastern District (301 Harding Way East).
Birthplace of: Robert W. Morgan - Radio personality, Bob Schnelker - Football player, Chuck Curran - Politician, Dave Sherer - Football player, J. B. Shuck - Baseball player, Logan Bartholomew - He's amazing :).
Drinking water stations with addresses in Galion and their reported violations in the past:
GALION CITY (Population served: 10,503, Surface water):Past monitoring violations:
- Monitoring and Reporting (DBP) - Between OCT-2007 and DEC-2007, Contaminant: CARBON, TOTAL. Follow-up actions: St Public Notif received (JAN-11-2008), St Violation/Reminder Notice (JAN-11-2008), St Compliance achieved (FEB-08-2008)
| This city: | 2.3 people |
| Ohio: | 2.4 people |
| This city: | 62.4% |
| Whole state: | 65.0% |
| This city: | 8.7% |
| Whole state: | 6.8% |
Likely homosexual households (counted as self-reported same-sex unmarried-partner households)
- Lesbian couples: 0.2% of all households
- Gay men: 0.2% of all households
104 people in nursing homes in 2000
37 people in other group homes in 2000
Banks with branches in Galion (2011 data):
- Galion Building and Loan Bank: Bucyrus Road Branch at 920 Bucyrus Road, branch established on 2001/12/19; Galion Building And Loan Bank at 135 South Market Street, branch established on 1884/02/13. Info updated 2011/07/21: Bank assets: $65.5 mil, Deposits: $58.9 mil, local headquarters, positive income, Mortgage Lending Specialization, 2 total offices
- First Federal Bank of Ohio: First Federal Bank Of Ohio at 140 North Columbus Street, branch established on 1891/01/01; Bucyrus Road Branch at 901 Bucyrus Road, branch established on 1891/01/01. Info updated 2011/07/21: Bank assets: $255.5 mil, Deposits: $196.7 mil, local headquarters, negative income in the last year, 9 total offices
- The Park National Bank: 1803 Galion Branch at 8 Public Square, branch established on 1864/01/01. Info updated 2008/09/29: Bank assets: $6,281.7 mil, Deposits: $4,611.6 mil, headquarters in Newark, OH, positive income, Commercial Lending Specialization, 123 total offices, Holding Company: Park National Corporation
- U.S. Bank National Association: Galion Branch at 1 Public Square, branch established on 1985/06/11. Info updated 2012/01/30: Bank assets: $330,470.8 mil, Deposits: $236,091.5 mil, headquarters in Cincinnati, OH, positive income, 3121 total offices, Holding Company: U.S. Bancorp
- Firstmerit Bank, National Association: Galion West Branch at 260 Portland Way North, branch established on 1964/09/08. Info updated 2010/05/17: Bank assets: $14,420.6 mil, Deposits: $11,497.6 mil, headquarters in Akron, OH, positive income, Commercial Lending Specialization, 213 total offices, Holding Company: Firstmerit Corporation
For population 15 years and over in Galion:
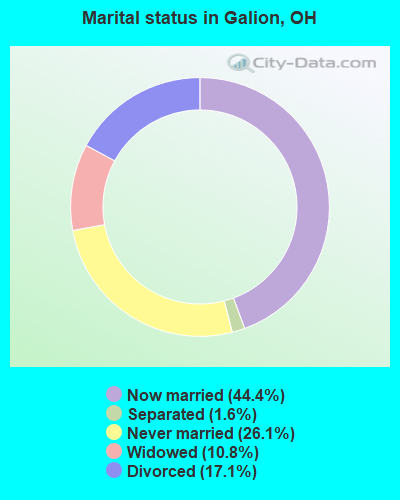
- Never married: 26.1%
- Now married: 44.4%
- Separated: 1.6%
- Widowed: 10.8%
- Divorced: 17.1%
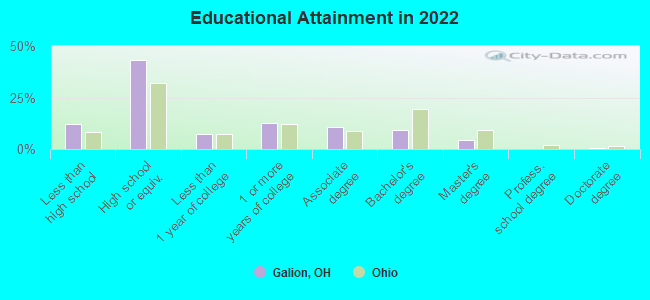
For population 25 years and over in Galion:
- High school or higher: 87.7%
- Bachelor's degree or higher: 13.5%
- Graduate or professional degree: 4.9%
- Unemployed: 5.3%
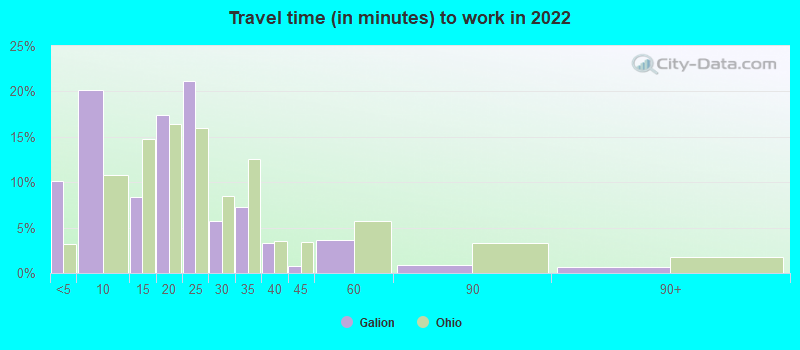
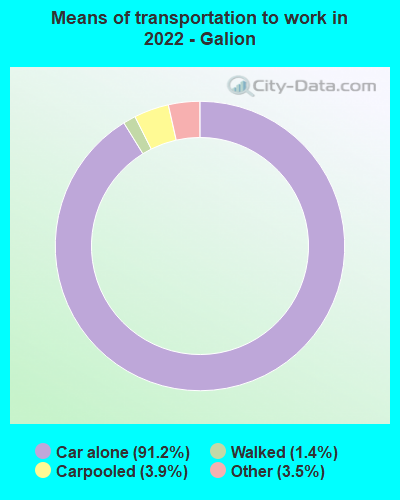
- Mean travel time to work (commute): 26.5 minutes

| Here: | 10.6 |
| Ohio average: | 11.0 |
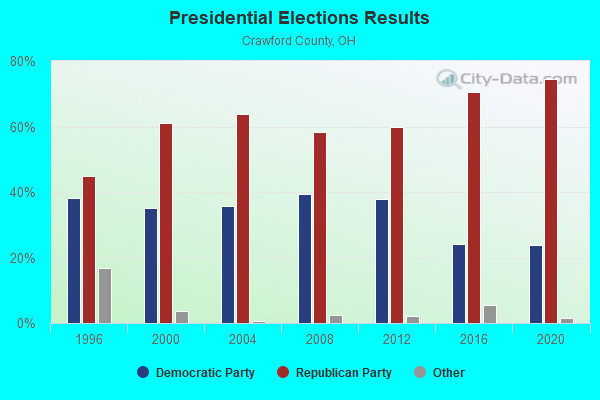
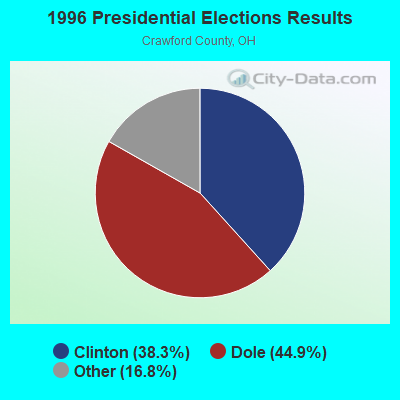
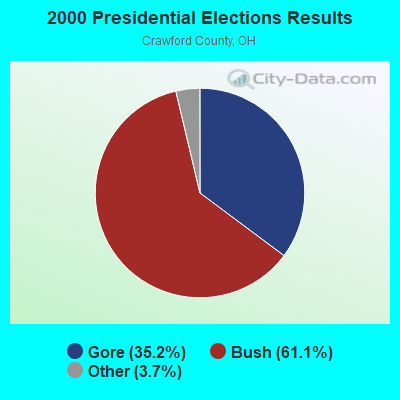
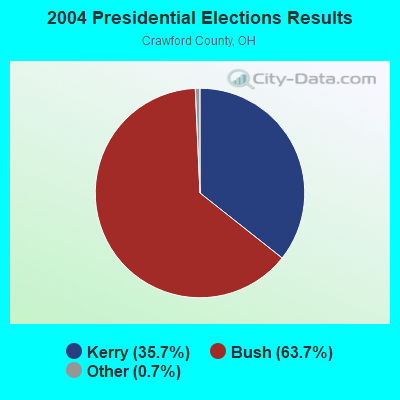
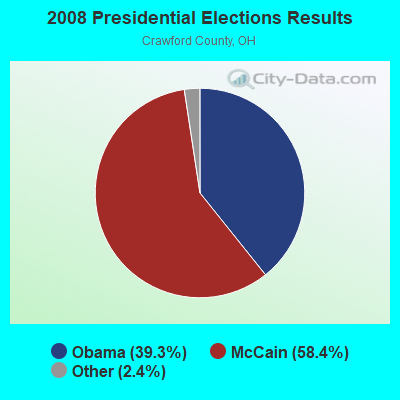
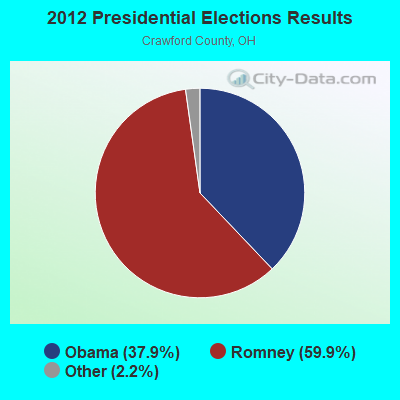
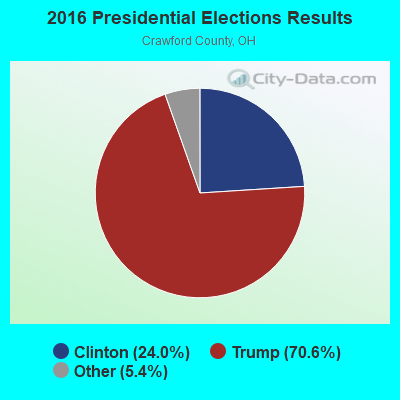
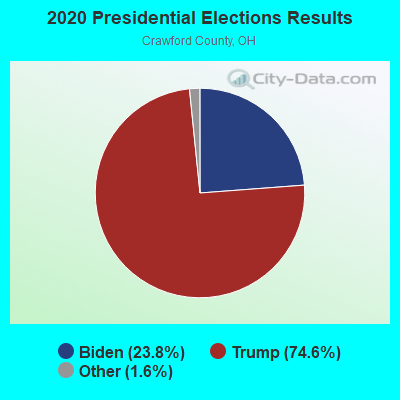
Graphs represent county-level data. Detailed 2008 Election Results
Religion statistics for Galion, OH (based on Crawford County data)
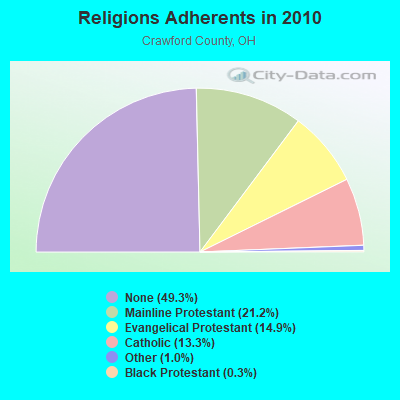
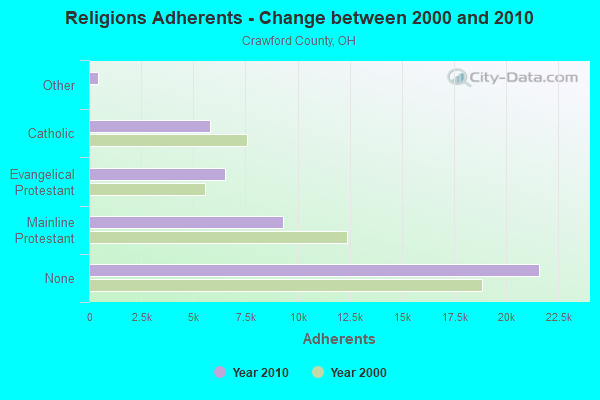
| Religion | Adherents | Congregations |
|---|---|---|
| Mainline Protestant | 9,303 | 34 |
| Evangelical Protestant | 6,514 | 54 |
| Catholic | 5,812 | 4 |
| Other | 442 | 3 |
| Black Protestant | 121 | 1 |
| Orthodox | 3 | 1 |
| None | 21,589 | - |
Food Environment Statistics:
| Crawford County: | 1.36 / 10,000 pop. |
| Ohio: | 1.89 / 10,000 pop. |
| Crawford County: | 0.23 / 10,000 pop. |
| State: | 0.13 / 10,000 pop. |
| Crawford County: | 0.68 / 10,000 pop. |
| State: | 1.25 / 10,000 pop. |
| Crawford County: | 4.31 / 10,000 pop. |
| State: | 2.93 / 10,000 pop. |
| Here: | 4.76 / 10,000 pop. |
| State: | 6.25 / 10,000 pop. |
| This county: | 11.1% |
| State: | 10.3% |
| Crawford County: | 29.2% |
| Ohio: | 29.1% |
| Here: | 14.6% |
| Ohio: | 11.9% |
Health and Nutrition:
| Galion: | 51.5% |
| Ohio: | 50.4% |
| This city: | 48.2% |
| State: | 47.8% |
| Galion: | 28.4 |
| Ohio: | 28.7 |
| Galion: | 20.5% |
| Ohio: | 20.6% |
| Galion: | 11.1% |
| State: | 10.4% |
| This city: | 6.9 |
| State: | 6.8 |
| Galion: | 34.0% |
| Ohio: | 34.3% |
| This city: | 57.5% |
| State: | 57.0% |
| Galion: | 77.8% |
| Ohio: | 79.1% |
More about Health and Nutrition of Galion, OH Residents
| Local government employment and payroll (March 2022) | |||||
| Function | Full-time employees | Monthly full-time payroll | Average yearly full-time wage | Part-time employees | Monthly part-time payroll |
|---|---|---|---|---|---|
| Firefighters | 20 | $88,850 | $53,310 | 0 | $0 |
| Police Protection - Officers | 19 | $79,149 | $49,989 | 0 | $0 |
| Streets and Highways | 14 | $49,781 | $42,669 | 0 | $0 |
| Health | 8 | $23,920 | $35,880 | 5 | $8,021 |
| Other and Unallocable | 7 | $23,549 | $40,370 | 0 | $0 |
| Electric Power | 7 | $32,706 | $56,067 | 0 | $0 |
| Sewerage | 7 | $27,331 | $46,853 | 0 | $0 |
| Other Government Administration | 5 | $49,774 | $119,458 | 13 | $15,639 |
| Financial Administration | 4 | $14,147 | $42,441 | 0 | $0 |
| Police - Other | 4 | $14,415 | $43,245 | 5 | $4,798 |
| Water Supply | 4 | $14,171 | $42,513 | 0 | $0 |
| Airports | 0 | $0 | 1 | $891 | |
| Judicial and Legal | 0 | $0 | 2 | $3,038 | |
| Totals for Government | 99 | $417,792 | $50,641 | 26 | $32,387 |
Galion government finances - Expenditure in 2021 (per resident):
- Construction - Parks and Recreation: $141,000 ($13.68)
Sewerage: $58,000 ($5.63)
Water Utilities: $54,000 ($5.24)
Solid Waste Management: $10,000 ($0.97)
- Current Operations - Electric Utilities: $11,279,000 ($1094.20)
Sewerage: $3,307,000 ($320.82)
Solid Waste Management: $2,110,000 ($204.70)
Water Utilities: $2,042,000 ($198.10)
Local Fire Protection: $1,696,000 ($164.53)
Police Protection: $1,692,000 ($164.14)
Regular Highways: $1,628,000 ($157.94)
Health - Other: $773,000 ($74.99)
Central Staff Services: $756,000 ($73.34)
General - Other: $500,000 ($48.51)
Financial Administration: $477,000 ($46.27)
Parks and Recreation: $240,000 ($23.28)
Judicial and Legal Services: $207,000 ($20.08)
Air Transportation: $173,000 ($16.78)
Protective Inspection and Regulation - Other: $71,000 ($6.89)
- Electric Utilities - Interest on Debt: $152,000 ($14.75)
- General - Interest on Debt: $184,000 ($17.85)
- Other Capital Outlay - Regular Highways: $1,483,000 ($143.87)
Solid Waste Management: $550,000 ($53.36)
Local Fire Protection: $253,000 ($24.54)
Electric Utilities: $205,000 ($19.89)
Sewerage: $133,000 ($12.90)
Police Protection: $127,000 ($12.32)
Parks and Recreation: $94,000 ($9.12)
Water Utilities: $45,000 ($4.37)
Health - Other: $14,000 ($1.36)
- Total Salaries and Wages: $6,436,000 ($624.37)
- Water Utilities - Interest on Debt: $129,000 ($12.51)
Galion government finances - Revenue in 2021 (per resident):
- Charges - Sewerage: $2,381,000 ($230.99)
Other: $842,000 ($81.68)
Air Transportation: $66,000 ($6.40)
Parks and Recreation: $4,000 ($0.39)
- Federal Intergovernmental - Public Welfare: $824,000 ($79.94)
Air Transportation: $460,000 ($44.63)
Other: $15,000 ($1.46)
- Local Intergovernmental - Housing and Community Development: $317,000 ($30.75)
General Local Government Support: $228,000 ($22.12)
Public Welfare: $183,000 ($17.75)
- Miscellaneous - Interest Earnings: $505,000 ($48.99)
Donations From Private Sources: $318,000 ($30.85)
General Revenue - Other: $296,000 ($28.72)
Special Assessments: $27,000 ($2.62)
Fines and Forfeits: $7,000 ($0.68)
Rents: $4,000 ($0.39)
- Revenue - Electric Utilities: $11,932,000 ($1157.55)
Water Utilities: $1,771,000 ($171.81)
- State Intergovernmental - Sewerage: $254,000 ($24.64)
Health and Hospitals: $201,000 ($19.50)
General Local Government Support: $41,000 ($3.98)
Other: $4,000 ($0.39)
- Tax - Individual Income: $5,459,000 ($529.59)
Motor Fuels Sales: $545,000 ($52.87)
General Sales and Gross Receipts: $414,000 ($40.16)
Property: $404,000 ($39.19)
Occupation and Business License - Other: $244,000 ($23.67)
Other Selective Sales: $202,000 ($19.60)
Motor Vehicle License: $72,000 ($6.98)
Alcoholic Beverage License: $14,000 ($1.36)
Galion government finances - Debt in 2021 (per resident):
- Long Term Debt - Beginning Outstanding - Unspecified Public Purpose: $8,939,000 ($867.19)
Outstanding Unspecified Public Purpose: $8,532,000 ($827.71)
Retired Unspecified Public Purpose: $655,000 ($63.54)
Issue, Unspecified Public Purpose: $247,000 ($23.96)
- Short Term Debt Outstanding - Beginning: $2,607,000 ($252.91)
End of Fiscal Year: $2,607,000 ($252.91)
Galion government finances - Cash and Securities in 2021 (per resident):
- Other Funds - Cash and Securities: $19,344,000 ($1876.60)
| Businesses in Galion, OH | ||||
| Name | Count | Name | Count | |
|---|---|---|---|---|
| Advance Auto Parts | 1 | Lane Furniture | 1 | |
| Burger King | 1 | Little Caesars Pizza | 1 | |
| Chevrolet | 1 | McDonald's | 1 | |
| Circle K | 1 | Pizza Hut | 1 | |
| Curves | 1 | Rite Aid | 1 | |
| Domino's Pizza | 1 | Subway | 1 | |
| FedEx | 2 | Taco Bell | 1 | |
| Ford | 1 | True Value | 1 | |
| GNC | 1 | U-Haul | 1 | |
| H&R Block | 1 | UPS | 1 | |
| Jones New York | 2 | Wendy's | 1 | |
| KFC | 1 | YMCA | 1 | |
| La-Z-Boy | 1 | |||
Strongest AM radio stations in Galion:
- WKNR (850 AM; 50 kW; CLEVELAND, OH; Owner: CARON BROADCASTING, INC.)
- WTVN (610 AM; 50 kW; COLUMBUS, OH; Owner: CITICASTERS LICENSES, L.P.)
- WTAM (1100 AM; 50 kW; CLEVELAND, OH; Owner: JACOR BROADCASTING CORPORATION)
- WHK (1220 AM; 50 kW; CLEVELAND, OH; Owner: CARON BROADCASTING, INC.)
- WRGM (1440 AM; 1 kW; ONTARIO, OH; Owner: GSM MEDIA CORPORATION)
- WRFD (880 AM; daytime; 23 kW; COLUMBUS-WORTHINGTON, OH; Owner: SALEM MEDIA OF OHIO, INC.)
- WJR (760 AM; 50 kW; DETROIT, MI; Owner: ABC, INC.)
- WFDF (910 AM; 50 kW; FLINT, MI; Owner: ABC, INC.)
- WBCO (1540 AM; daytime; 0 kW; BUCYRUS, OH; Owner: ANCHOR BROADCASTING COMPANY)
- WDFN (1130 AM; 50 kW; DETROIT, MI; Owner: AMFM RADIO LICENSES, L.L.C.)
- WLW (700 AM; 50 kW; CINCINNATI, OH; Owner: JACOR BROADCASTING CORPORATION)
- WCHB (1200 AM; 50 kW; TAYLOR, MI; Owner: RADIO ONE OF DETROIT, LLC)
- WMAN (1400 AM; 1 kW; MANSFIELD, OH; Owner: CAPSTAR TX LIMITED PARTNERSHIP)
Strongest FM radio stations in Galion:
- WFXN-FM (102.3 FM; GALION, OH; Owner: CAPSTAR TX LIMITED PARTNERSHIP)
- WYXZ (98.7 FM; CRESTLINE, OH; Owner: ELYRIA-LORAIN BROADCASTING COMPANY)
- WVNO-FM (106.1 FM; MANSFIELD, OH; Owner: JOHNNY APPLESEED BROADCASTING CO.)
- WQEL (92.7 FM; BUCYRUS, OH; Owner: ANCHOR BROADCASTING COMPANY)
- WVXG (95.1 FM; MOUNT GILEAD, OH; Owner: XAVIER UNIVERSITY)
- WYHT (105.3 FM; MANSFIELD, OH; Owner: CAPSTAR TX LIMITED PARTNERSHIP)
- WOSV (91.7 FM; MANSFIELD, OH; Owner: THE OHIO STATE UNIVERSITY)
- WWBK (98.3 FM; FREDERICKTOWN, OH; Owner: CAPSTAR TX LIMITED PARTNERSHIP)
- WVMC-FM (90.7 FM; MANSFIELD, OH; Owner: MANSFIELD CHRISTIAN SCHOOL)
- WSWR (100.1 FM; SHELBY, OH; Owner: CAPSTAR TX LIMITED PARTNERSHIP)
- WNCO-FM (101.3 FM; ASHLAND, OH; Owner: CAPSTAR TX LIMITED PARTNERSHIP)
- WLRD (96.9 FM; WILLARD, OH; Owner: CHRISTIAN FAITH BROADCAST, INC.)
- WMRN-FM (106.9 FM; MARION, OH; Owner: CITICASTERS LICENSES, L.P.)
- WQIO (93.7 FM; MOUNT VERNON, OH; Owner: CAPSTAR TX LIMITED PARTNERSHIP)
- WXML (90.1 FM; UPPER SANDUSKY, OH; Owner: KAYSER B/CAST MINISTRIES, INC.)
- WAUI (88.3 FM; SHELBY, OH; Owner: AMERICAN FAMILY ASSOCIATION)
TV broadcast stations around Galion:
- WMFD-TV (Channel 68; MANSFIELD, OH; Owner: MID-STATE TELEVISION,INC.)
- W54AF (Channel 54; BUCYRUS, OH; Owner: CRAWFORD BROADCASTING. COMPANY, INC.)
- WOHZ-LP (Channel 57; MANSFIELD, OH; Owner: MID-STATE TELEVISION, INC.)
- W32AR (Channel 32; LEXINGTON, OH; Owner: TRINITY BROADCASTING NETWORK)
- WBKA-LP (Channel 22; BUCYRUS, OH; Owner: CRAWFORD BROADCASTING CO., INC.)
- WOSU-TV (Channel 34; COLUMBUS, OH; Owner: THE OHIO STATE UNIVERSITY)
- W33BW (Channel 33; ASHLAND, OH; Owner: CHRISTIAN FAITH BROADCAST, INC.)
- WOCB-LP (Channel 39; MARION, OH; Owner: CENTRAL OHIO ASSOCIATION OF CHRISTIAN BROADCASTERS)
- National Bridge Inventory (NBI) Statistics
- 51Number of bridges
- 443ft / 135mTotal length
- $82,071,000Total costs
- 172,253Total average daily traffic
- 29,235Total average daily truck traffic
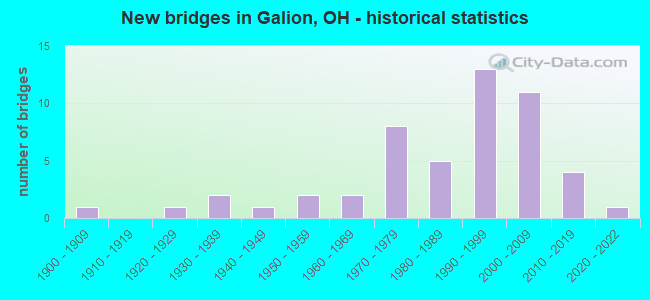
- New bridges - historical statistics
- 11900-1909
- 11920-1929
- 21930-1939
- 11940-1949
- 21950-1959
- 21960-1969
- 81970-1979
- 51980-1989
- 131990-1999
- 112000-2009
- 42010-2019
- 12020-2022
FCC Registered Antenna Towers: 100 (See the full list of FCC Registered Antenna Towers)
FCC Registered Commercial Land Mobile Towers: 1 (See the full list of FCC Registered Commercial Land Mobile Towers in Galion, OH)
FCC Registered Broadcast Land Mobile Towers: 24 (See the full list of FCC Registered Broadcast Land Mobile Towers)
FCC Registered Microwave Towers: 6 (See the full list of FCC Registered Microwave Towers in this town)
FCC Registered Paging Towers: 5 (See the full list of FCC Registered Paging Towers)
FCC Registered Maritime Coast & Aviation Ground Towers: 1 (See the full list of FCC Registered Maritime Coast & Aviation Ground Towers)
FCC Registered Amateur Radio Licenses: 96 (See the full list of FCC Registered Amateur Radio Licenses in Galion)
FAA Registered Aircraft: 21 (See the full list of FAA Registered Aircraft in Galion)
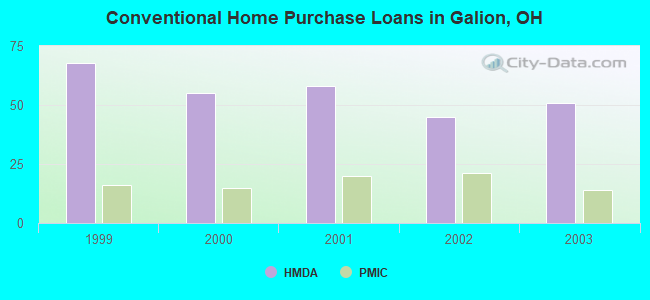
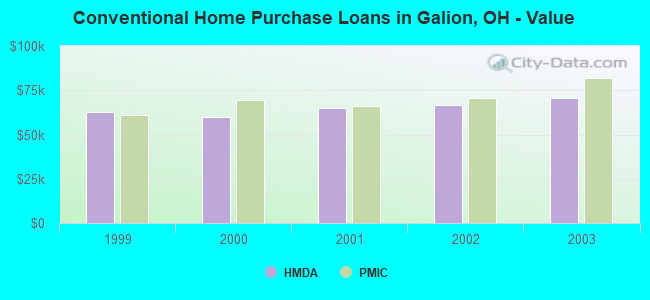
| Home Mortgage Disclosure Act Aggregated Statistics For Year 2003 (Based on 1 full and 3 partial tracts) | ||||||||||
| A) FHA, FSA/RHS & VA Home Purchase Loans | B) Conventional Home Purchase Loans | C) Refinancings | D) Home Improvement Loans | F) Non-occupant Loans on < 5 Family Dwellings (A B C & D) | ||||||
|---|---|---|---|---|---|---|---|---|---|---|
| Number | Average Value | Number | Average Value | Number | Average Value | Number | Average Value | Number | Average Value | |
| LOANS ORIGINATED | 17 | $86,522 | 51 | $70,855 | 186 | $72,031 | 14 | $27,937 | 27 | $45,440 |
| APPLICATIONS APPROVED, NOT ACCEPTED | 0 | $0 | 6 | $50,830 | 24 | $77,921 | 2 | $15,750 | 0 | $0 |
| APPLICATIONS DENIED | 3 | $92,413 | 17 | $55,789 | 93 | $80,155 | 6 | $17,912 | 4 | $52,128 |
| APPLICATIONS WITHDRAWN | 2 | $99,435 | 8 | $58,372 | 55 | $85,656 | 2 | $13,620 | 1 | $29,310 |
| FILES CLOSED FOR INCOMPLETENESS | 0 | $0 | 4 | $56,118 | 12 | $79,852 | 0 | $0 | 0 | $0 |
Detailed HMDA statistics for the following Tracts: 9750.00 , 9751.00, 9752.00, 9753.00
| Private Mortgage Insurance Companies Aggregated Statistics For Year 2003 (Based on 1 full and 3 partial tracts) | ||||||
| A) Conventional Home Purchase Loans | B) Refinancings | C) Non-occupant Loans on < 5 Family Dwellings (A & B) | ||||
|---|---|---|---|---|---|---|
| Number | Average Value | Number | Average Value | Number | Average Value | |
| LOANS ORIGINATED | 14 | $81,908 | 17 | $84,199 | 1 | $53,970 |
| APPLICATIONS APPROVED, NOT ACCEPTED | 5 | $69,358 | 12 | $95,492 | 1 | $82,000 |
| APPLICATIONS DENIED | 1 | $16,000 | 1 | $105,000 | 1 | $16,000 |
| APPLICATIONS WITHDRAWN | 0 | $0 | 3 | $85,927 | 0 | $0 |
| FILES CLOSED FOR INCOMPLETENESS | 1 | $108,880 | 0 | $0 | 0 | $0 |
Detailed PMIC statistics for the following Tracts: 9750.00 , 9751.00, 9752.00, 9753.00
2002 - 2018 National Fire Incident Reporting System (NFIRS) incidents
- Fire incident types reported to NFIRS in Galion, OH
- 47443.6%Outside Fires
- 46342.6%Structure Fires
- 13812.7%Mobile Property/Vehicle Fires
- 121.1%Other
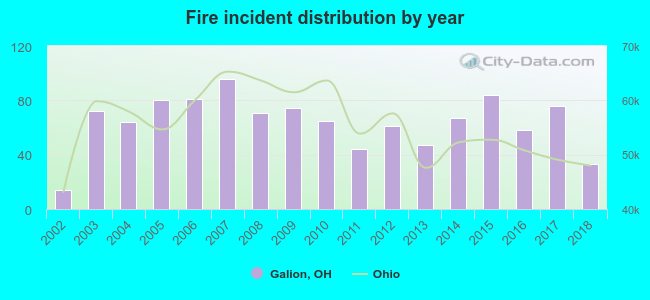 According to the data from the years 2002 - 2018 the average number of fire incidents per year is 64. The highest number of reported fire incidents - 96 took place in 2007, and the least - 14 in 2002. The data has a rising trend.
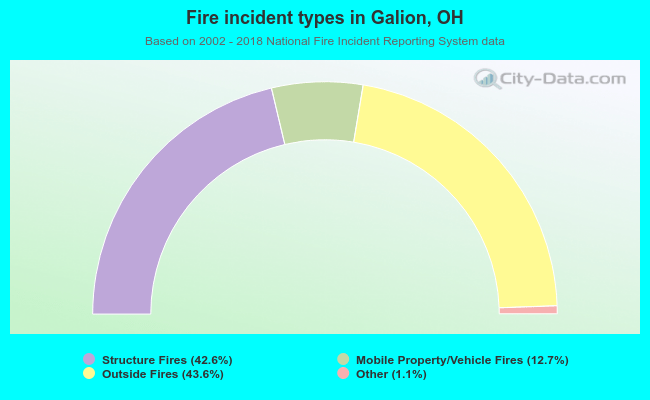 When looking into fire subcategories, the most incidents belonged to: Outside Fires (43.6%), and Structure Fires (42.6%).
| Most common first names in Galion, OH among deceased individuals | ||
| Name | Count | Lived (average) |
|---|---|---|
| Mary | 167 | 79.4 years |
| Charles | 134 | 73.6 years |
| John | 133 | 74.6 years |
| Robert | 131 | 71.2 years |
| William | 108 | 72.5 years |
| James | 81 | 66.0 years |
| Ruth | 73 | 79.6 years |
| Dorothy | 70 | 77.4 years |
| Helen | 68 | 79.6 years |
| Richard | 67 | 67.6 years |
| Most common last names in Galion, OH among deceased individuals | ||
| Last name | Count | Lived (average) |
|---|---|---|
| Smith | 73 | 79.0 years |
| Miller | 60 | 79.3 years |
| Brown | 30 | 81.5 years |
| Garverick | 25 | 76.1 years |
| Johnson | 25 | 70.7 years |
| Young | 24 | 75.1 years |
| Snyder | 22 | 76.8 years |
| Davis | 21 | 77.5 years |
| Tracht | 20 | 81.8 years |
| Williams | 20 | 79.7 years |
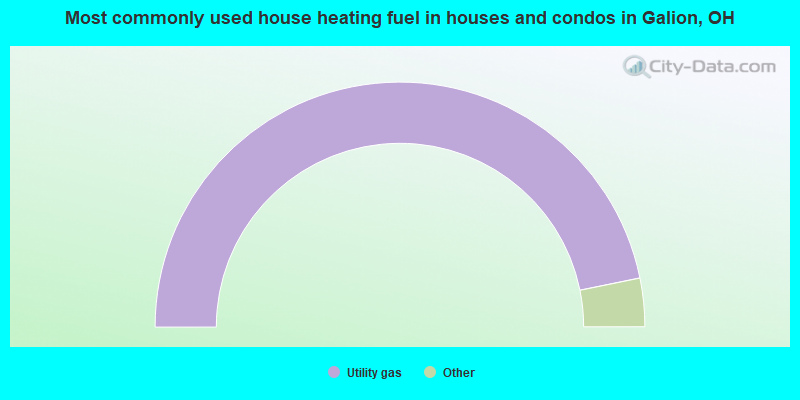
- 93.6%Utility gas
- 3.3%Electricity
- 1.4%Bottled, tank, or LP gas
- 0.8%No fuel used
- 0.6%Fuel oil, kerosene, etc.
- 0.2%Coal or coke
- 0.1%Wood
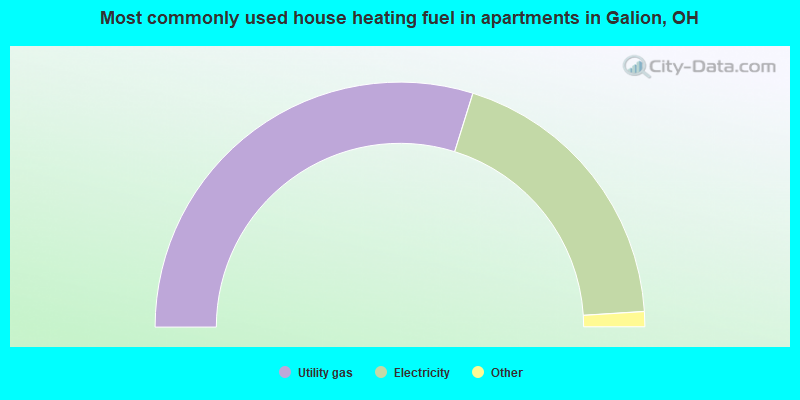
- 59.7%Utility gas
- 38.4%Electricity
- 1.6%Bottled, tank, or LP gas
- 0.3%Fuel oil, kerosene, etc.
Galion compared to Ohio state average:
- Median household income below state average.
- Median house value below state average.
- Unemployed percentage below state average.
- Black race population percentage significantly below state average.
- Hispanic race population percentage significantly below state average.
- Foreign-born population percentage significantly below state average.
- Length of stay since moving in significantly above state average.
- Number of college students below state average.
- Percentage of population with a bachelor's degree or higher below state average.

|
|
Total of 12 patent applications in 2008-2024.