Port Chester, New York Submit your own pictures of this village and show them to the world
OSM Map
General Map
Google Map
MSN Map
OSM Map
General Map
Google Map
MSN Map
OSM Map
General Map
Google Map
MSN Map
OSM Map
General Map
Google Map
MSN Map
Please wait while loading the map...
Population in 2022: 30,823 (100% urban, 0% rural). Population change since 2000: +10.6%Males: 16,403 Females: 14,420
March 2022 cost of living index in Port Chester: 153.7 (very high, U.S. average is 100) Percentage of residents living in poverty in 2022: 14.3%for White Non-Hispanic residents , 14.3% for Black residents , 17.5% for Hispanic or Latino residents , 89.3% for American Indian residents , 16.8% for other race residents , 12.5% for two or more races residents )
Profiles of local businesses
Business Search - 14 Million verified businesses
Data:
Median household income ($)
Median household income (% change since 2000)
Household income diversity
Ratio of average income to average house value (%)
Ratio of average income to average rent
Median household income ($) - White
Median household income ($) - Black or African American
Median household income ($) - Asian
Median household income ($) - Hispanic or Latino
Median household income ($) - American Indian and Alaska Native
Median household income ($) - Multirace
Median household income ($) - Other Race
Median household income for houses/condos with a mortgage ($)
Median household income for apartments without a mortgage ($)
Races - White alone (%)
Races - White alone (% change since 2000)
Races - Black alone (%)
Races - Black alone (% change since 2000)
Races - American Indian alone (%)
Races - American Indian alone (% change since 2000)
Races - Asian alone (%)
Races - Asian alone (% change since 2000)
Races - Hispanic (%)
Races - Hispanic (% change since 2000)
Races - Native Hawaiian and Other Pacific Islander alone (%)
Races - Native Hawaiian and Other Pacific Islander alone (% change since 2000)
Races - Two or more races (%)
Races - Two or more races (% change since 2000)
Races - Other race alone (%)
Races - Other race alone (% change since 2000)
Racial diversity
Unemployment (%)
Unemployment (% change since 2000)
Unemployment (%) - White
Unemployment (%) - Black or African American
Unemployment (%) - Asian
Unemployment (%) - Hispanic or Latino
Unemployment (%) - American Indian and Alaska Native
Unemployment (%) - Multirace
Unemployment (%) - Other Race
Population density (people per square mile)
Population - Males (%)
Population - Females (%)
Population - Males (%) - White
Population - Males (%) - Black or African American
Population - Males (%) - Asian
Population - Males (%) - Hispanic or Latino
Population - Males (%) - American Indian and Alaska Native
Population - Males (%) - Multirace
Population - Males (%) - Other Race
Population - Females (%) - White
Population - Females (%) - Black or African American
Population - Females (%) - Asian
Population - Females (%) - Hispanic or Latino
Population - Females (%) - American Indian and Alaska Native
Population - Females (%) - Multirace
Population - Females (%) - Other Race
Coronavirus confirmed cases (Jun 19, 2024)
Deaths caused by coronavirus (Jun 19, 2024)
Coronavirus confirmed cases (per 100k population) (Jun 19, 2024)
Deaths caused by coronavirus (per 100k population) (Jun 19, 2024)
Daily increase in number of cases (Jun 19, 2024)
Weekly increase in number of cases (Jun 19, 2024)
Cases doubled (in days) (Jun 19, 2024)
Hospitalized patients (Apr 18, 2022)
Negative test results (Apr 18, 2022)
Total test results (Apr 18, 2022)
COVID Vaccine doses distributed (per 100k population) (Sep 19, 2023)
COVID Vaccine doses administered (per 100k population) (Sep 19, 2023)
COVID Vaccine doses distributed (Sep 19, 2023)
COVID Vaccine doses administered (Sep 19, 2023)
Likely homosexual households (%)
Likely homosexual households (% change since 2000)
Likely homosexual households - Lesbian couples (%)
Likely homosexual households - Lesbian couples (% change since 2000)
Likely homosexual households - Gay men (%)
Likely homosexual households - Gay men (% change since 2000)
Cost of living index
Median gross rent ($)
Median contract rent ($)
Median monthly housing costs ($)
Median house or condo value ($)
Median house or condo value ($ change since 2000)
Mean house or condo value by units in structure - 1, detached ($)
Mean house or condo value by units in structure - 1, attached ($)
Mean house or condo value by units in structure - 2 ($)
Mean house or condo value by units in structure by units in structure - 3 or 4 ($)
Mean house or condo value by units in structure - 5 or more ($)
Mean house or condo value by units in structure - Boat, RV, van, etc. ($)
Mean house or condo value by units in structure - Mobile home ($)
Median house or condo value ($) - White
Median house or condo value ($) - Black or African American
Median house or condo value ($) - Asian
Median house or condo value ($) - Hispanic or Latino
Median house or condo value ($) - American Indian and Alaska Native
Median house or condo value ($) - Multirace
Median house or condo value ($) - Other Race
Median resident age
Resident age diversity
Median resident age - Males
Median resident age - Females
Median resident age - White
Median resident age - Black or African American
Median resident age - Asian
Median resident age - Hispanic or Latino
Median resident age - American Indian and Alaska Native
Median resident age - Multirace
Median resident age - Other Race
Median resident age - Males - White
Median resident age - Males - Black or African American
Median resident age - Males - Asian
Median resident age - Males - Hispanic or Latino
Median resident age - Males - American Indian and Alaska Native
Median resident age - Males - Multirace
Median resident age - Males - Other Race
Median resident age - Females - White
Median resident age - Females - Black or African American
Median resident age - Females - Asian
Median resident age - Females - Hispanic or Latino
Median resident age - Females - American Indian and Alaska Native
Median resident age - Females - Multirace
Median resident age - Females - Other Race
Commute - mean travel time to work (minutes)
Travel time to work - Less than 5 minutes (%)
Travel time to work - Less than 5 minutes (% change since 2000)
Travel time to work - 5 to 9 minutes (%)
Travel time to work - 5 to 9 minutes (% change since 2000)
Travel time to work - 10 to 19 minutes (%)
Travel time to work - 10 to 19 minutes (% change since 2000)
Travel time to work - 20 to 29 minutes (%)
Travel time to work - 20 to 29 minutes (% change since 2000)
Travel time to work - 30 to 39 minutes (%)
Travel time to work - 30 to 39 minutes (% change since 2000)
Travel time to work - 40 to 59 minutes (%)
Travel time to work - 40 to 59 minutes (% change since 2000)
Travel time to work - 60 to 89 minutes (%)
Travel time to work - 60 to 89 minutes (% change since 2000)
Travel time to work - 90 or more minutes (%)
Travel time to work - 90 or more minutes (% change since 2000)
Marital status - Never married (%)
Marital status - Now married (%)
Marital status - Separated (%)
Marital status - Widowed (%)
Marital status - Divorced (%)
Median family income ($)
Median family income (% change since 2000)
Median non-family income ($)
Median non-family income (% change since 2000)
Median per capita income ($)
Median per capita income (% change since 2000)
Median family income ($) - White
Median family income ($) - Black or African American
Median family income ($) - Asian
Median family income ($) - Hispanic or Latino
Median family income ($) - American Indian and Alaska Native
Median family income ($) - Multirace
Median family income ($) - Other Race
Median year house/condo built
Median year apartment built
Year house built - Built 2005 or later (%)
Year house built - Built 2000 to 2004 (%)
Year house built - Built 1990 to 1999 (%)
Year house built - Built 1980 to 1989 (%)
Year house built - Built 1970 to 1979 (%)
Year house built - Built 1960 to 1969 (%)
Year house built - Built 1950 to 1959 (%)
Year house built - Built 1940 to 1949 (%)
Year house built - Built 1939 or earlier (%)
Average household size
Household density (households per square mile)
Average household size - White
Average household size - Black or African American
Average household size - Asian
Average household size - Hispanic or Latino
Average household size - American Indian and Alaska Native
Average household size - Multirace
Average household size - Other Race
Occupied housing units (%)
Vacant housing units (%)
Owner occupied housing units (%)
Renter occupied housing units (%)
Vacancy status - For rent (%)
Vacancy status - For sale only (%)
Vacancy status - Rented or sold, not occupied (%)
Vacancy status - For seasonal, recreational, or occasional use (%)
Vacancy status - For migrant workers (%)
Vacancy status - Other vacant (%)
Residents with income below the poverty level (%)
Residents with income below 50% of the poverty level (%)
Children below poverty level (%)
Poor families by family type - Married-couple family (%)
Poor families by family type - Male, no wife present (%)
Poor families by family type - Female, no husband present (%)
Poverty status for native-born residents (%)
Poverty status for foreign-born residents (%)
Poverty among high school graduates not in families (%)
Poverty among people who did not graduate high school not in families (%)
Residents with income below the poverty level (%) - White
Residents with income below the poverty level (%) - Black or African American
Residents with income below the poverty level (%) - Asian
Residents with income below the poverty level (%) - Hispanic or Latino
Residents with income below the poverty level (%) - American Indian and Alaska Native
Residents with income below the poverty level (%) - Multirace
Residents with income below the poverty level (%) - Other Race
Air pollution - Air Quality Index (AQI)
Air pollution - CO
Air pollution - NO2
Air pollution - SO2
Air pollution - Ozone
Air pollution - PM10
Air pollution - PM25
Air pollution - Pb
Crime - Murders per 100,000 population
Crime - Rapes per 100,000 population
Crime - Robberies per 100,000 population
Crime - Assaults per 100,000 population
Crime - Burglaries per 100,000 population
Crime - Thefts per 100,000 population
Crime - Auto thefts per 100,000 population
Crime - Arson per 100,000 population
Crime - City-data.com crime index
Crime - Violent crime index
Crime - Property crime index
Crime - Murders per 100,000 population (5 year average)
Crime - Rapes per 100,000 population (5 year average)
Crime - Robberies per 100,000 population (5 year average)
Crime - Assaults per 100,000 population (5 year average)
Crime - Burglaries per 100,000 population (5 year average)
Crime - Thefts per 100,000 population (5 year average)
Crime - Auto thefts per 100,000 population (5 year average)
Crime - Arson per 100,000 population (5 year average)
Crime - City-data.com crime index (5 year average)
Crime - Violent crime index (5 year average)
Crime - Property crime index (5 year average)
1996 Presidential Elections Results (%) - Democratic Party (Clinton)
1996 Presidential Elections Results (%) - Republican Party (Dole)
1996 Presidential Elections Results (%) - Other
2000 Presidential Elections Results (%) - Democratic Party (Gore)
2000 Presidential Elections Results (%) - Republican Party (Bush)
2000 Presidential Elections Results (%) - Other
2004 Presidential Elections Results (%) - Democratic Party (Kerry)
2004 Presidential Elections Results (%) - Republican Party (Bush)
2004 Presidential Elections Results (%) - Other
2008 Presidential Elections Results (%) - Democratic Party (Obama)
2008 Presidential Elections Results (%) - Republican Party (McCain)
2008 Presidential Elections Results (%) - Other
2012 Presidential Elections Results (%) - Democratic Party (Obama)
2012 Presidential Elections Results (%) - Republican Party (Romney)
2012 Presidential Elections Results (%) - Other
2016 Presidential Elections Results (%) - Democratic Party (Clinton)
2016 Presidential Elections Results (%) - Republican Party (Trump)
2016 Presidential Elections Results (%) - Other
2020 Presidential Elections Results (%) - Democratic Party (Biden)
2020 Presidential Elections Results (%) - Republican Party (Trump)
2020 Presidential Elections Results (%) - Other
Ancestries Reported - Arab (%)
Ancestries Reported - Czech (%)
Ancestries Reported - Danish (%)
Ancestries Reported - Dutch (%)
Ancestries Reported - English (%)
Ancestries Reported - French (%)
Ancestries Reported - French Canadian (%)
Ancestries Reported - German (%)
Ancestries Reported - Greek (%)
Ancestries Reported - Hungarian (%)
Ancestries Reported - Irish (%)
Ancestries Reported - Italian (%)
Ancestries Reported - Lithuanian (%)
Ancestries Reported - Norwegian (%)
Ancestries Reported - Polish (%)
Ancestries Reported - Portuguese (%)
Ancestries Reported - Russian (%)
Ancestries Reported - Scotch-Irish (%)
Ancestries Reported - Scottish (%)
Ancestries Reported - Slovak (%)
Ancestries Reported - Subsaharan African (%)
Ancestries Reported - Swedish (%)
Ancestries Reported - Swiss (%)
Ancestries Reported - Ukrainian (%)
Ancestries Reported - United States (%)
Ancestries Reported - Welsh (%)
Ancestries Reported - West Indian (%)
Ancestries Reported - Other (%)
Educational Attainment - No schooling completed (%)
Educational Attainment - Less than high school (%)
Educational Attainment - High school or equivalent (%)
Educational Attainment - Less than 1 year of college (%)
Educational Attainment - 1 or more years of college (%)
Educational Attainment - Associate degree (%)
Educational Attainment - Bachelor's degree (%)
Educational Attainment - Master's degree (%)
Educational Attainment - Professional school degree (%)
Educational Attainment - Doctorate degree (%)
School Enrollment - Nursery, preschool (%)
School Enrollment - Kindergarten (%)
School Enrollment - Grade 1 to 4 (%)
School Enrollment - Grade 5 to 8 (%)
School Enrollment - Grade 9 to 12 (%)
School Enrollment - College undergrad (%)
School Enrollment - Graduate or professional (%)
School Enrollment - Not enrolled in school (%)
School enrollment - Public schools (%)
School enrollment - Private schools (%)
School enrollment - Not enrolled (%)
Median number of rooms in houses and condos
Median number of rooms in apartments
Housing units lacking complete plumbing facilities (%)
Housing units lacking complete kitchen facilities (%)
Density of houses
Urban houses (%)
Rural houses (%)
Households with people 60 years and over (%)
Households with people 65 years and over (%)
Households with people 75 years and over (%)
Households with one or more nonrelatives (%)
Households with no nonrelatives (%)
Population in households (%)
Family households (%)
Nonfamily households (%)
Population in families (%)
Family households with own children (%)
Median number of bedrooms in owner occupied houses
Mean number of bedrooms in owner occupied houses
Median number of bedrooms in renter occupied houses
Mean number of bedrooms in renter occupied houses
Median number of vehichles in owner occupied houses
Mean number of vehichles in owner occupied houses
Median number of vehichles in renter occupied houses
Mean number of vehichles in renter occupied houses
Mortgage status - with mortgage (%)
Mortgage status - with second mortgage (%)
Mortgage status - with home equity loan (%)
Mortgage status - with both second mortgage and home equity loan (%)
Mortgage status - without a mortgage (%)
Average family size
Average family size - White
Average family size - Black or African American
Average family size - Asian
Average family size - Hispanic or Latino
Average family size - American Indian and Alaska Native
Average family size - Multirace
Average family size - Other Race
Geographical mobility - Same house 1 year ago (%)
Geographical mobility - Moved within same county (%)
Geographical mobility - Moved from different county within same state (%)
Geographical mobility - Moved from different state (%)
Geographical mobility - Moved from abroad (%)
Place of birth - Born in state of residence (%)
Place of birth - Born in other state (%)
Place of birth - Native, outside of US (%)
Place of birth - Foreign born (%)
Housing units in structures - 1, detached (%)
Housing units in structures - 1, attached (%)
Housing units in structures - 2 (%)
Housing units in structures - 3 or 4 (%)
Housing units in structures - 5 to 9 (%)
Housing units in structures - 10 to 19 (%)
Housing units in structures - 20 to 49 (%)
Housing units in structures - 50 or more (%)
Housing units in structures - Mobile home (%)
Housing units in structures - Boat, RV, van, etc. (%)
House/condo owner moved in on average (years ago)
Renter moved in on average (years ago)
Year householder moved into unit - Moved in 1999 to March 2000 (%)
Year householder moved into unit - Moved in 1995 to 1998 (%)
Year householder moved into unit - Moved in 1990 to 1994 (%)
Year householder moved into unit - Moved in 1980 to 1989 (%)
Year householder moved into unit - Moved in 1970 to 1979 (%)
Year householder moved into unit - Moved in 1969 or earlier (%)
Means of transportation to work - Drove car alone (%)
Means of transportation to work - Carpooled (%)
Means of transportation to work - Public transportation (%)
Means of transportation to work - Bus or trolley bus (%)
Means of transportation to work - Streetcar or trolley car (%)
Means of transportation to work - Subway or elevated (%)
Means of transportation to work - Railroad (%)
Means of transportation to work - Ferryboat (%)
Means of transportation to work - Taxicab (%)
Means of transportation to work - Motorcycle (%)
Means of transportation to work - Bicycle (%)
Means of transportation to work - Walked (%)
Means of transportation to work - Other means (%)
Working at home (%)
Industry diversity
Most Common Industries - Agriculture, forestry, fishing and hunting, and mining (%)
Most Common Industries - Agriculture, forestry, fishing and hunting (%)
Most Common Industries - Mining, quarrying, and oil and gas extraction (%)
Most Common Industries - Construction (%)
Most Common Industries - Manufacturing (%)
Most Common Industries - Wholesale trade (%)
Most Common Industries - Retail trade (%)
Most Common Industries - Transportation and warehousing, and utilities (%)
Most Common Industries - Transportation and warehousing (%)
Most Common Industries - Utilities (%)
Most Common Industries - Information (%)
Most Common Industries - Finance and insurance, and real estate and rental and leasing (%)
Most Common Industries - Finance and insurance (%)
Most Common Industries - Real estate and rental and leasing (%)
Most Common Industries - Professional, scientific, and management, and administrative and waste management services (%)
Most Common Industries - Professional, scientific, and technical services (%)
Most Common Industries - Management of companies and enterprises (%)
Most Common Industries - Administrative and support and waste management services (%)
Most Common Industries - Educational services, and health care and social assistance (%)
Most Common Industries - Educational services (%)
Most Common Industries - Health care and social assistance (%)
Most Common Industries - Arts, entertainment, and recreation, and accommodation and food services (%)
Most Common Industries - Arts, entertainment, and recreation (%)
Most Common Industries - Accommodation and food services (%)
Most Common Industries - Other services, except public administration (%)
Most Common Industries - Public administration (%)
Occupation diversity
Most Common Occupations - Management, business, science, and arts occupations (%)
Most Common Occupations - Management, business, and financial occupations (%)
Most Common Occupations - Management occupations (%)
Most Common Occupations - Business and financial operations occupations (%)
Most Common Occupations - Computer, engineering, and science occupations (%)
Most Common Occupations - Computer and mathematical occupations (%)
Most Common Occupations - Architecture and engineering occupations (%)
Most Common Occupations - Life, physical, and social science occupations (%)
Most Common Occupations - Education, legal, community service, arts, and media occupations (%)
Most Common Occupations - Community and social service occupations (%)
Most Common Occupations - Legal occupations (%)
Most Common Occupations - Education, training, and library occupations (%)
Most Common Occupations - Arts, design, entertainment, sports, and media occupations (%)
Most Common Occupations - Healthcare practitioners and technical occupations (%)
Most Common Occupations - Health diagnosing and treating practitioners and other technical occupations (%)
Most Common Occupations - Health technologists and technicians (%)
Most Common Occupations - Service occupations (%)
Most Common Occupations - Healthcare support occupations (%)
Most Common Occupations - Protective service occupations (%)
Most Common Occupations - Fire fighting and prevention, and other protective service workers including supervisors (%)
Most Common Occupations - Law enforcement workers including supervisors (%)
Most Common Occupations - Food preparation and serving related occupations (%)
Most Common Occupations - Building and grounds cleaning and maintenance occupations (%)
Most Common Occupations - Personal care and service occupations (%)
Most Common Occupations - Sales and office occupations (%)
Most Common Occupations - Sales and related occupations (%)
Most Common Occupations - Office and administrative support occupations (%)
Most Common Occupations - Natural resources, construction, and maintenance occupations (%)
Most Common Occupations - Farming, fishing, and forestry occupations (%)
Most Common Occupations - Construction and extraction occupations (%)
Most Common Occupations - Installation, maintenance, and repair occupations (%)
Most Common Occupations - Production, transportation, and material moving occupations (%)
Most Common Occupations - Production occupations (%)
Most Common Occupations - Transportation occupations (%)
Most Common Occupations - Material moving occupations (%)
People in Group quarters - Institutionalized population (%)
People in Group quarters - Correctional institutions (%)
People in Group quarters - Federal prisons and detention centers (%)
People in Group quarters - Halfway houses (%)
People in Group quarters - Local jails and other confinement facilities (including police lockups) (%)
People in Group quarters - Military disciplinary barracks (%)
People in Group quarters - State prisons (%)
People in Group quarters - Other types of correctional institutions (%)
People in Group quarters - Nursing homes (%)
People in Group quarters - Hospitals/wards, hospices, and schools for the handicapped (%)
People in Group quarters - Hospitals/wards and hospices for chronically ill (%)
People in Group quarters - Hospices or homes for chronically ill (%)
People in Group quarters - Military hospitals or wards for chronically ill (%)
People in Group quarters - Other hospitals or wards for chronically ill (%)
People in Group quarters - Hospitals or wards for drug/alcohol abuse (%)
People in Group quarters - Mental (Psychiatric) hospitals or wards (%)
People in Group quarters - Schools, hospitals, or wards for the mentally retarded (%)
People in Group quarters - Schools, hospitals, or wards for the physically handicapped (%)
People in Group quarters - Institutions for the deaf (%)
People in Group quarters - Institutions for the blind (%)
People in Group quarters - Orthopedic wards and institutions for the physically handicapped (%)
People in Group quarters - Wards in general hospitals for patients who have no usual home elsewhere (%)
People in Group quarters - Wards in military hospitals for patients who have no usual home elsewhere (%)
People in Group quarters - Juvenile institutions (%)
People in Group quarters - Long-term care (%)
People in Group quarters - Homes for abused, dependent, and neglected children (%)
People in Group quarters - Residential treatment centers for emotionally disturbed children (%)
People in Group quarters - Training schools for juvenile delinquents (%)
People in Group quarters - Short-term care, detention or diagnostic centers for delinquent children (%)
People in Group quarters - Type of juvenile institution unknown (%)
People in Group quarters - Noninstitutionalized population (%)
People in Group quarters - College dormitories (includes college quarters off campus) (%)
People in Group quarters - Military quarters (%)
People in Group quarters - On base (%)
People in Group quarters - Barracks, unaccompanied personnel housing (UPH), (Enlisted/Officer), ;and similar group living quarters for military personnel (%)
People in Group quarters - Transient quarters for temporary residents (%)
People in Group quarters - Military ships (%)
People in Group quarters - Group homes (%)
People in Group quarters - Homes or halfway houses for drug/alcohol abuse (%)
People in Group quarters - Homes for the mentally ill (%)
People in Group quarters - Homes for the mentally retarded (%)
People in Group quarters - Homes for the physically handicapped (%)
People in Group quarters - Other group homes (%)
People in Group quarters - Religious group quarters (%)
People in Group quarters - Dormitories (%)
People in Group quarters - Agriculture workers' dormitories on farms (%)
People in Group quarters - Job Corps and vocational training facilities (%)
People in Group quarters - Other workers' dormitories (%)
People in Group quarters - Crews of maritime vessels (%)
People in Group quarters - Other nonhousehold living situations (%)
People in Group quarters - Other noninstitutional group quarters (%)
Residents speaking English at home (%)
Residents speaking English at home - Born in the United States (%)
Residents speaking English at home - Native, born elsewhere (%)
Residents speaking English at home - Foreign born (%)
Residents speaking Spanish at home (%)
Residents speaking Spanish at home - Born in the United States (%)
Residents speaking Spanish at home - Native, born elsewhere (%)
Residents speaking Spanish at home - Foreign born (%)
Residents speaking other language at home (%)
Residents speaking other language at home - Born in the United States (%)
Residents speaking other language at home - Native, born elsewhere (%)
Residents speaking other language at home - Foreign born (%)
Class of Workers - Employee of private company (%)
Class of Workers - Self-employed in own incorporated business (%)
Class of Workers - Private not-for-profit wage and salary workers (%)
Class of Workers - Local government workers (%)
Class of Workers - State government workers (%)
Class of Workers - Federal government workers (%)
Class of Workers - Self-employed workers in own not incorporated business and Unpaid family workers (%)
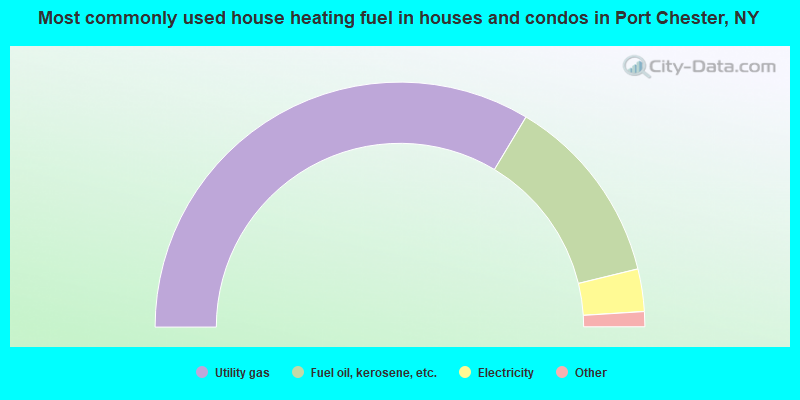
House heating fuel used in houses and condos - Utility gas (%)
House heating fuel used in houses and condos - Bottled, tank, or LP gas (%)
House heating fuel used in houses and condos - Electricity (%)
House heating fuel used in houses and condos - Fuel oil, kerosene, etc. (%)
House heating fuel used in houses and condos - Coal or coke (%)
House heating fuel used in houses and condos - Wood (%)
House heating fuel used in houses and condos - Solar energy (%)
House heating fuel used in houses and condos - Other fuel (%)
House heating fuel used in houses and condos - No fuel used (%)
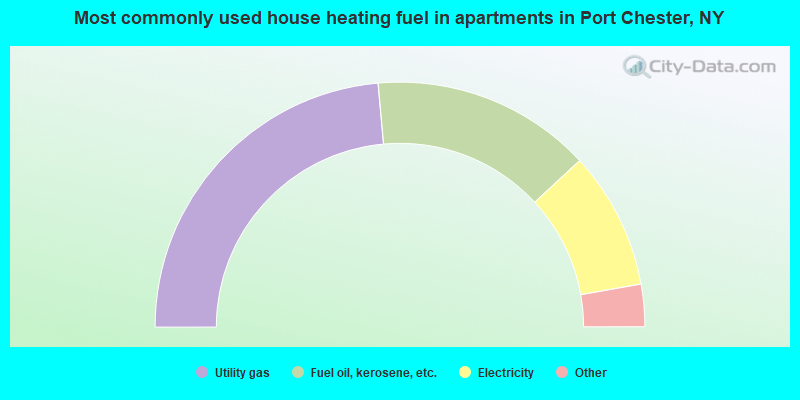
House heating fuel used in apartments - Utility gas (%)
House heating fuel used in apartments - Bottled, tank, or LP gas (%)
House heating fuel used in apartments - Electricity (%)
House heating fuel used in apartments - Fuel oil, kerosene, etc. (%)
House heating fuel used in apartments - Coal or coke (%)
House heating fuel used in apartments - Wood (%)
House heating fuel used in apartments - Solar energy (%)
House heating fuel used in apartments - Other fuel (%)
House heating fuel used in apartments - No fuel used (%)
Armed forces status - In Armed Forces (%)
Armed forces status - Civilian (%)
Armed forces status - Civilian - Veteran (%)
Armed forces status - Civilian - Nonveteran (%)
Fatal accidents locations in years 2005-2021
Fatal accidents locations in 2005
Fatal accidents locations in 2006
Fatal accidents locations in 2007
Fatal accidents locations in 2008
Fatal accidents locations in 2009
Fatal accidents locations in 2010
Fatal accidents locations in 2011
Fatal accidents locations in 2012
Fatal accidents locations in 2013
Fatal accidents locations in 2014
Fatal accidents locations in 2015
Fatal accidents locations in 2016
Fatal accidents locations in 2017
Fatal accidents locations in 2018
Fatal accidents locations in 2019
Fatal accidents locations in 2020
Fatal accidents locations in 2021
Alcohol use - People drinking some alcohol every month (%)
Alcohol use - People not drinking at all (%)
Alcohol use - Average days/month drinking alcohol
Alcohol use - Average drinks/week
Alcohol use - Average days/year people drink much
Audiometry - Average condition of hearing (%)
Audiometry - People that can hear a whisper from across a quiet room (%)
Audiometry - People that can hear normal voice from across a quiet room (%)
Audiometry - Ears ringing, roaring, buzzing (%)
Audiometry - Had a job exposure to loud noise (%)
Audiometry - Had off-work exposure to loud noise (%)
Blood Pressure & Cholesterol - Has high blood pressure (%)
Blood Pressure & Cholesterol - Checking blood pressure at home (%)
Blood Pressure & Cholesterol - Frequently checking blood cholesterol (%)
Blood Pressure & Cholesterol - Has high cholesterol level (%)
Consumer Behavior - Money monthly spent on food at supermarket/grocery store
Consumer Behavior - Money monthly spent on food at other stores
Consumer Behavior - Money monthly spent on eating out
Consumer Behavior - Money monthly spent on carryout/delivered foods
Consumer Behavior - Income spent on food at supermarket/grocery store (%)
Consumer Behavior - Income spent on food at other stores (%)
Consumer Behavior - Income spent on eating out (%)
Consumer Behavior - Income spent on carryout/delivered foods (%)
Current Health Status - General health condition (%)
Current Health Status - Blood donors (%)
Current Health Status - Has blood ever tested for HIV virus (%)
Current Health Status - Left-handed people (%)
Dermatology - People using sunscreen (%)
Diabetes - Diabetics (%)
Diabetes - Had a blood test for high blood sugar (%)
Diabetes - People taking insulin (%)
Diet Behavior & Nutrition - Diet health (%)
Diet Behavior & Nutrition - Milk product consumption (# of products/month)
Diet Behavior & Nutrition - Meals not home prepared (#/week)
Diet Behavior & Nutrition - Meals from fast food or pizza place (#/week)
Diet Behavior & Nutrition - Ready-to-eat foods (#/month)
Diet Behavior & Nutrition - Frozen meals/pizza (#/month)
Drug Use - People that ever used marijuana or hashish (%)
Drug Use - Ever used hard drugs (%)
Drug Use - Ever used any form of cocaine (%)
Drug Use - Ever used heroin (%)
Drug Use - Ever used methamphetamine (%)
Health Insurance - People covered by health insurance (%)
Kidney Conditions-Urology - Avg. # of times urinating at night
Medical Conditions - People with asthma (%)
Medical Conditions - People with anemia (%)
Medical Conditions - People with psoriasis (%)
Medical Conditions - People with overweight (%)
Medical Conditions - Elderly people having difficulties in thinking or remembering (%)
Medical Conditions - People who ever received blood transfusion (%)
Medical Conditions - People having trouble seeing even with glass/contacts (%)
Medical Conditions - People with arthritis (%)
Medical Conditions - People with gout (%)
Medical Conditions - People with congestive heart failure (%)
Medical Conditions - People with coronary heart disease (%)
Medical Conditions - People with angina pectoris (%)
Medical Conditions - People who ever had heart attack (%)
Medical Conditions - People who ever had stroke (%)
Medical Conditions - People with emphysema (%)
Medical Conditions - People with thyroid problem (%)
Medical Conditions - People with chronic bronchitis (%)
Medical Conditions - People with any liver condition (%)
Medical Conditions - People who ever had cancer or malignancy (%)
Mental Health - People who have little interest in doing things (%)
Mental Health - People feeling down, depressed, or hopeless (%)
Mental Health - People who have trouble sleeping or sleeping too much (%)
Mental Health - People feeling tired or having little energy (%)
Mental Health - People with poor appetite or overeating (%)
Mental Health - People feeling bad about themself (%)
Mental Health - People who have trouble concentrating on things (%)
Mental Health - People moving or speaking slowly or too fast (%)
Mental Health - People having thoughts they would be better off dead (%)
Oral Health - Average years since last visit a dentist
Oral Health - People embarrassed because of mouth (%)
Oral Health - People with gum disease (%)
Oral Health - General health of teeth and gums (%)
Oral Health - Average days a week using dental floss/device
Oral Health - Average days a week using mouthwash for dental problem
Oral Health - Average number of teeth
Pesticide Use - Households using pesticides to control insects (%)
Pesticide Use - Households using pesticides to kill weeds (%)
Physical Activity - People doing vigorous-intensity work activities (%)
Physical Activity - People doing moderate-intensity work activities (%)
Physical Activity - People walking or bicycling (%)
Physical Activity - People doing vigorous-intensity recreational activities (%)
Physical Activity - People doing moderate-intensity recreational activities (%)
Physical Activity - Average hours a day doing sedentary activities
Physical Activity - Average hours a day watching TV or videos
Physical Activity - Average hours a day using computer
Physical Functioning - People having limitations keeping them from working (%)
Physical Functioning - People limited in amount of work they can do (%)
Physical Functioning - People that need special equipment to walk (%)
Physical Functioning - People experiencing confusion/memory problems (%)
Physical Functioning - People requiring special healthcare equipment (%)
Prescription Medications - Average number of prescription medicines taking
Preventive Aspirin Use - Adults 40+ taking low-dose aspirin (%)
Reproductive Health - Vaginal deliveries (%)
Reproductive Health - Cesarean deliveries (%)
Reproductive Health - Deliveries resulted in a live birth (%)
Reproductive Health - Pregnancies resulted in a delivery (%)
Reproductive Health - Women breastfeeding newborns (%)
Reproductive Health - Women that had a hysterectomy (%)
Reproductive Health - Women that had both ovaries removed (%)
Reproductive Health - Women that have ever taken birth control pills (%)
Reproductive Health - Women taking birth control pills (%)
Reproductive Health - Women that have ever used Depo-Provera or injectables (%)
Reproductive Health - Women that have ever used female hormones (%)
Sexual Behavior - People 18+ that ever had sex (vaginal, anal, or oral) (%)
Sexual Behavior - Males 18+ that ever had vaginal sex with a woman (%)
Sexual Behavior - Males 18+ that ever performed oral sex on a woman (%)
Sexual Behavior - Males 18+ that ever had anal sex with a woman (%)
Sexual Behavior - Males 18+ that ever had any sex with a man (%)
Sexual Behavior - Females 18+ that ever had vaginal sex with a man (%)
Sexual Behavior - Females 18+ that ever performed oral sex on a man (%)
Sexual Behavior - Females 18+ that ever had anal sex with a man (%)
Sexual Behavior - Females 18+ that ever had any kind of sex with a woman (%)
Sexual Behavior - Average age people first had sex
Sexual Behavior - Average number of female sex partners in lifetime (males 18+)
Sexual Behavior - Average number of female vaginal sex partners in lifetime (males 18+)
Sexual Behavior - Average age people first performed oral sex on a woman (18+)
Sexual Behavior - Average number of woman performed oral sex on in lifetime (18+)
Sexual Behavior - Average number of male sex partners in lifetime (males 18+)
Sexual Behavior - Average number of male anal sex partners in lifetime (males 18+)
Sexual Behavior - Average age people first performed oral sex on a man (18+)
Sexual Behavior - Average number of male oral sex partners in lifetime (18+)
Sexual Behavior - People using protection when performing oral sex (%)
Sexual Behavior - Average number of times people have vaginal or anal sex a year
Sexual Behavior - People having sex without condom (%)
Sexual Behavior - Average number of male sex partners in lifetime (females 18+)
Sexual Behavior - Average number of male vaginal sex partners in lifetime (females 18+)
Sexual Behavior - Average number of female sex partners in lifetime (females 18+)
Sexual Behavior - Circumcised males 18+ (%)
Sleep Disorders - Average hours sleeping at night
Sleep Disorders - People that has trouble sleeping (%)
Smoking-Cigarette Use - People smoking cigarettes (%)
Taste & Smell - People 40+ having problems with smell (%)
Taste & Smell - People 40+ having problems with taste (%)
Taste & Smell - People 40+ that ever had wisdom teeth removed (%)
Taste & Smell - People 40+ that ever had tonsils teeth removed (%)
Taste & Smell - People 40+ that ever had a loss of consciousness because of a head injury (%)
Taste & Smell - People 40+ that ever had a broken nose or other serious injury to face or skull (%)
Taste & Smell - People 40+ that ever had two or more sinus infections (%)
Weight - Average height (inches)
Weight - Average weight (pounds)
Weight - Average BMI
Weight - People that are obese (%)
Weight - People that ever were obese (%)
Weight - People trying to lose weight (%)
According to our research of New York and other state lists, there were 19 registered sex offenders living in Port Chester, New York as of June 19, 2024 . The ratio of all residents to sex offenders in Port Chester is 1,557 to 1.The ratio of registered sex offenders to all residents in this city is lower than the state average.
Officers per 1,000 residents here:
2.01New York average:
3.28
Latest news from Port Chester, NY collected exclusively by city-data.com from local newspapers, TV, and radio stations
Ancestries: Italian (13.5%), Irish (2.3%), Polish (2.1%), American (2.0%), English (1.3%).
Current Local Time:
Land area: 2.36 square miles.
Population density: 13,079 people per square mile (very high).
13,342 residents are foreign born (38.6% Latin America ).
This village:
43.0%New York:
22.6%
Median real estate property taxes paid for housing units with mortgages in 2022: $10,001 (1.7%)Median real estate property taxes paid for housing units with no mortgage in 2022: $10,001 (2.0%)
Nearest city with pop. 50,000+: Greenwich, CT
Nearest city with pop. 200,000+: Bronx, NY
Nearest cities:
Latitude: 41.01 N, Longitude: 73.67 W
Daytime population change due to commuting: -5,423 (-17.5%)Workers who live and work in this village: 4,110 (25.7%)
Area code commonly used in this area: 203
Single-family new house construction building permits:
2017: 10 buildings , average cost: $272,5002016: 9 buildings , average cost: $272,5002015: 9 buildings , average cost: $272,5002014: 6 buildings , average cost: $272,5002013: 5 buildings , average cost: $272,5002012: 4 buildings , average cost: $272,5002011: 1 building , cost: $298,3002010: 1 building , cost: $195,0002009: 3 buildings , average cost: $298,3002008: 2 buildings , average cost: $1,625,0002007: 53 buildings , average cost: $354,3002006: 4 buildings , average cost: $900,0002005: 3 buildings , average cost: $350,0002004: 1 building , cost: $800,0002003: 3 buildings , average cost: $410,0002001: 3 buildings , average cost: $878,3002000: 4 buildings , average cost: $243,8001999: 4 buildings , average cost: $528,9001998: 2 buildings , average cost: $179,0001997: 1 building , cost: $100,000Unemployment in December 2023:
Population change in the 1990s: +2,846 (+11.4%).
Most common occupations in Port Chester, NY (%)
Both Males Females
Building and grounds cleaning and maintenance occupations (13.4%)
Other office and administrative support workers, including supervisors (4.1%)
Cooks and food preparation workers (2.9%)
Secretaries and administrative assistants (2.8%)
Retail sales workers, except cashiers (2.7%)
Other management occupations, except farmers and farm managers (2.6%)
Waiters and waitresses (2.5%)
Building and grounds cleaning and maintenance occupations (15.2%)
Painters and paperhangers (3.8%)
Cooks and food preparation workers (3.6%)
Construction laborers (3.3%)
Material recording, scheduling, dispatching, and distributing workers (3.1%)
Other management occupations, except farmers and farm managers (3.1%)
Other production occupations, including supervisors (2.9%)
Building and grounds cleaning and maintenance occupations (10.9%)
Other office and administrative support workers, including supervisors (6.2%)
Secretaries and administrative assistants (6.1%)
Information and record clerks, except customer service representatives (4.6%)
Cashiers (3.6%)
Preschool, kindergarten, elementary, and middle school teachers (3.6%)
Other sales and related occupations, including supervisors (3.6%)
Tornado activity:
Port Chester-area historical tornado activity is above New York state average. It is 41% smaller than the overall U.S. average.
On 7/10/1989, a category F4 (max. wind speeds 207-260 mph) tornado 44.7 miles away from the Port Chester village center injured 40 people and caused between $50,000,000 and $500,000,000 in damages.
On 7/12/2006, a category F2 (max. wind speeds 113-157 mph) tornado 11.4 miles away from the village center injured 6 people and caused $12 million in damages.
Earthquake activity:
Port Chester-area historical earthquake activity is significantly above New York state average. It is 69% smaller than the overall U.S. average. On 10/7/1983 at 10:18:46, a magnitude 5.3 (5.1 MB, 5.3 LG, 5.1 ML, Class: Moderate, Intensity: VI - VII) earthquake occurred 206.8 miles away from the city center On 8/23/2011 at 17:51:04, a magnitude 5.8 (5.8 MW, Depth: 3.7 mi) earthquake occurred 312.6 miles away from Port Chester center On 4/20/2002 at 10:50:47, a magnitude 5.3 (5.3 ML, Depth: 3.0 mi) earthquake occurred 242.6 miles away from the city center On 4/20/2002 at 10:50:47, a magnitude 5.2 (5.2 MB, 4.2 MS, 5.2 MW, 5.0 MW) earthquake occurred 240.8 miles away from Port Chester center On 1/16/1994 at 01:49:16, a magnitude 4.6 (4.6 MB, 4.6 LG, Depth: 3.1 mi, Class: Light, Intensity: IV - V) earthquake occurred 132.7 miles away from the city center On 8/22/1992 at 12:20:32, a magnitude 4.8 (4.8 MB, 3.8 MS, 4.7 LG, Depth: 6.2 mi) earthquake occurred 220.7 miles away from Port Chester center Magnitude types: regional Lg-wave magnitude (LG), body-wave magnitude (MB), local magnitude (ML), surface-wave magnitude (MS), moment magnitude (MW) Natural disasters: The number of natural disasters in Westchester County (26) is a lot greater than the US average (15).Major Disasters (Presidential) Declared: 17Emergencies Declared: 8Floods: 9, Storms: 9, Hurricanes: 7, Blizzards: 2, Heavy Rains: 2, Tropical Storms: 2, Landslide: 1, Power Outage: 1, Snowstorm: 1, Water Shortage: 1, Other: 3 (Note: some incidents may be assigned to more than one category). Hospitals and medical centers in Port Chester: HIGH POINT HOSP (provides emergency services, UPPER KING ST) UNITED HOSPITAL HOSPICE (406 BOSTON POST RD) KING STREET HOME INC (787 KING STREET)
KING STREET HRF (787 KING ST)
NEW YORK UNITED HOSPITAL MEDICAL CENTER (406 BOSTON POST ROAD)
PORT CHESTER NURSING AND REHAB (1000 HIGH ST)
PORT CHESTER DIALYSIS AND RENAL CTR. (38 BULKLEY AVENUE)
UNITED HOSP HME HLTH CLOSED (406 BOSTON POST ROAD)
Amtrak stations near Port Chester: 8 miles: STAMFORD (WASHINGTON BLVD. & E. STATE ST.) Services: ticket office, fully wheelchair accessible, enclosed waiting area, public restrooms, public payphones, snack bar, ATM, paid short-term parking, paid long-term parking, call for car rental service, taxi stand, public transit connection.
9 miles: NEW ROCHELLE (DEPOT PLAZA NORTH) Services: enclosed waiting area, public restrooms, public payphones, paid short-term parking, paid long-term parking, call for car rental service, taxi stand, public transit connection.
14 miles: YONKERS (FOOT OF DOCK ST. & WELLS AVE.) Services: fully wheelchair accessible, enclosed waiting area, public restrooms, public payphones, snack bar, paid short-term parking, paid long-term parking, call for car rental service, taxi stand, public transit connection.
Colleges/universities with over 2000 students nearest to Port Chester:
Manhattanville College (about 4 miles; Purchase, NY ; Full-time enrollment: 2,299)
SUNY at Purchase College (about 4 miles; Purchase, NY ; FT enrollment: 4,415)
SUNY Westchester Community College (about 8 miles; Valhalla, NY ; FT enrollment: 10,278)
Iona College (about 9 miles; New Rochelle, NY ; FT enrollment: 3,775)
The College of New Rochelle (about 10 miles; New Rochelle, NY ; FT enrollment: 3,635)
Mercy College (about 11 miles; Dobbs Ferry, NY ; FT enrollment: 8,602)
Norwalk Community College (about 14 miles; Norwalk, CT ; FT enrollment: 4,085)
Public high school in Port Chester:
Public elementary/middle schools in Port Chester: PORT CHESTER MIDDLE SCHOOL Students: 864, Location: 113 BOWMAN AVE, Grades: 6-8)JOHN F KENNEDY MAGNET SCHOOL Students: 725, Location: 40 OLIVIA ST, Grades: KG-5)PARK AVENUE SCHOOL Students: 466, Location: PARK AVE, Grades: KG-5)THOMAS A EDISON SCHOOL Students: 430, Location: 132 RECTORY ST, Grades: KG-5)KING STREET SCHOOL Students: 417, Location: 697 KING ST, Grades: KG-5)Private elementary/middle school in Port Chester: CORPUS CHRISTI HOLY ROSARY SCHOOL Students: 281, Location: 135 S REGENT ST, Grades: PK-8)
See full list of schools located in Port Chester Library in Port Chester: PORT CHESTER PUBLIC LIBRARY Operating income: $1,331,668; Location: 1 HASECO AVENUE; 82,599 books ; 767 e-books ; 3,079 audio materials ; 2,498 video materials ; 14 state licensed databases ; 10 other licensed databases ; 1,402 print serial subscriptions )
User-submitted facts and corrections:
United Hospital has closed. White Plains Hospital should be added.
Notable locations in Port Chester: (A) , Brooksville Fire House (B) , Washington Fire Department (C) . Display/hide their locations on the map
Churches in Port Chester include: (A) , Sacred Heart of Jesus Church (B) , Chinese Alliance Church (C) , Parkside Assembly of God (D) , Corpus Christi Church (E) , Our Lady of Mercy Roman Catholic Church (F) , Saint Peter's Episcopal Church (G) , Westchester Pentecostal Church (H) , Bethesda Baptist Church (I) . Display/hide their locations on the map
Parks in Port Chester include: (1) , Columbus Park (2) , Edgewood Park (3) , Monument Park (4) , Memorial Park (5) , John Lyon Park (6) , Davenport Park (7) , Cannon Park (8) , Glen And Haseco Park (9) . Display/hide their locations on the map
Hotel:
Birthplace of: Frank Pavone - Roman Catholic priest and pro-life activist, Andre Roy - NHL player (Pittsburgh Penguins, born : Feb 8, 1975), Anne Edwards - Biographer, David Glantz - Historian, Francis Joseph Tief - Catholic bishop, Herman Barron - Professional golfer, Jennifer Donnelly - Writer, John Abercrombie (guitarist) - Jazz guitarist, Joseph Iannuzzi - Recipient of the Purple Heart, Lank Leonard - Cartoonist.
Westchester County has a predicted average indoor radon screening level less than 2 pCi/L (pico curies per liter) - Low Potential Average household size: This village:
3.1 peopleNew York:
2.6 people
Percentage of family households: This village:
68.7%Whole state:
63.5%
Percentage of households with unmarried partners: This village:
6.6%Whole state:
6.8%
Likely homosexual households (counted as self-reported same-sex unmarried-partner households)
Lesbian couples: 0.2% of all households Gay men: 0.3% of all households
People in group quarters in Port Chester in 2010:
230 people in other noninstitutional facilities
154 people in nursing facilities/skilled-nursing facilities
68 people in group homes intended for adults
13 people in residential treatment centers for adults
People in group quarters in Port Chester in 2000:
208 people in nursing homes
23 people in religious group quarters
13 people in homes for the mentally ill
12 people in other group homes
10 people in orthopedic wards and institutions for the physically handicapped
9 people in homes for the mentally retarded
Banks with branches in Port Chester (2011 data):
JPMorgan Chase Bank, National Association: Rye Ridge Branch, Port Chester Branch, North Main Street Branch, Midland Avenue Branch. Info updated 2011/11/10: Bank assets: $1,811,678.0 mil, Deposits: $1,190,738.0 mil, headquarters in Columbus, OH, positive income , International Specialization, 5577 total offices , Holding Company: Jpmorgan Chase & Co.
TD Bank, National Association: Port Chester Branch at 250 Boston Post Road, branch established on 2004/12/18. Info updated 2010/10/04: Bank assets: $188,912.6 mil, Deposits: $153,149.8 mil, headquarters in Wilmington, DE, positive income , 1314 total offices , Holding Company: Toronto-Dominion Bank, The
Hudson City Savings Bank: 115 South Ridge St Branch at 115 South Ridge St, branch established on 1890/01/01. Info updated 2012/01/09: Bank assets: $45,373.6 mil, Deposits: $25,645.6 mil, headquarters in Paramus, NJ, negative income in the last year , Mortgage Lending Specialization, 135 total offices
Bank of America, National Association: Port Chester Branch at 433 Boston Post Road, branch established on 1988/05/02. Info updated 2009/11/18: Bank assets: $1,451,969.3 mil, Deposits: $1,077,176.8 mil, headquarters in Charlotte, NC, positive income , 5782 total offices , Holding Company: Bank Of America Corporation
Hudson Valley Bank, National Association: Port Chester Branch at 500 Westchester Avenue, branch established on 1995/05/01. Info updated 2012/03/13: Bank assets: $2,794.2 mil, Deposits: $2,433.4 mil, headquarters in Stamford, CT, negative income in the last year , Commercial Lending Specialization, 36 total offices , Holding Company: Hudson Valley Holding Corp.
Wells Fargo Bank, National Association: Port Chester at 133 North Main Street, branch established on 1865/06/15. Info updated 2011/04/05: Bank assets: $1,161,490.0 mil, Deposits: $905,653.0 mil, headquarters in Sioux Falls, SD, positive income , 6395 total offices , Holding Company: Wells Fargo & Company
Customers Bank: Port Chester Branch at 601 North Main Street, branch established on 2005/12/22. Info updated 2011/09/28: Bank assets: $2,077.5 mil, Deposits: $1,587.9 mil, headquarters in Phoenixville, PA, positive income , 16 total offices , Holding Company: Customers Bancorp, Inc
For population 15 years and over in Port Chester:
Never married: 36.4%Now married: 48.2%Separated: 2.7%Widowed: 3.4%Divorced: 9.3% For population 25 years and over in Port Chester:
High school or higher: 78.7%Bachelor's degree or higher: 33.3%Graduate or professional degree: 12.3%Unemployed: 5.0%Mean travel time to work (commute): 21.6 minutes
Education Gini index (Inequality in education) Here:
18.5New York average:
13.9
Religion statistics for Port Chester, NY (based on Westchester County data)
Religion Adherents Congregations Catholic 435,590 100 Other 75,029 114 Mainline Protestant 46,854 176 Evangelical Protestant 28,915 209 Black Protestant 17,814 38 Orthodox 5,458 16 None 339,453 -
Source: Clifford Grammich, Kirk Hadaway, Richard Houseal, Dale E.Jones, Alexei Krindatch, Richie Stanley and Richard H.Taylor. 2012. 2010 U.S.Religion Census: Religious Congregations & Membership Study. Association of Statisticians of American Religious Bodies. Jones, Dale E., et al. 2002. Congregations and Membership in the United States 2000. Nashville, TN: Glenmary Research Center. Graphs represent county-level data
Food Environment Statistics: Number of grocery stores : 417Westchester County :
4.39 / 10,000 pop.New York :
4.13 / 10,000 pop.
Number of supercenters and club stores : 5This county :
0.05 / 10,000 pop.New York :
0.06 / 10,000 pop.
Number of convenience stores (no gas) : 71Westchester County :
0.75 / 10,000 pop.New York :
0.92 / 10,000 pop.
Number of convenience stores (with gas) : 111Westchester County :
1.17 / 10,000 pop.New York :
1.68 / 10,000 pop.
Number of full-service restaurants : 904Westchester County :
9.52 / 10,000 pop.New York :
8.82 / 10,000 pop.
Adult diabetes rate : This county :
7.6%New York :
8.2%
Low-income preschool obesity rate : Westchester County :
17.8%New York :
15.6%
Health and Nutrition: Healthy diet rate : Port Chester:
47.6%New York:
50.1%
Average overall health of teeth and gums : Port Chester:
47.4%New York:
48.1%
Average BMI : Port Chester:
28.3New York:
28.5
People feeling badly about themselves : People not drinking alcohol at all : Port Chester:
9.8%New York:
11.1%
Average hours sleeping at night : Port Chester:
6.8New York:
6.8
General health condition : This city:
55.6%New York:
56.5%
Average condition of hearing : Port Chester:
80.8%New York:
80.2%
More about Health and Nutrition of Port Chester, NY Residents
Local government employment and payroll (March 2022)
Function
Full-time employees
Monthly full-time payroll
Average yearly full-time wage
Part-time employees
Monthly part-time payroll
Police Protection - Officers
59 $672,479 $136,775 0 $0 Streets and Highways
25 $175,737 $84,354 0 $0 Solid Waste Management
21 $130,207 $74,404 1 $2,425 Other and Unallocable
13 $96,313 $88,904 1 $1,242 Other Government Administration
9 $74,491 $99,321 8 $11,554 Financial Administration
8 $68,698 $103,047 0 $0 Firefighters
3 $10,159 $40,636 0 $0 Parks and Recreation
2 $14,597 $87,582 4 $425 Welfare
1 $7,495 $89,940 19 $17,730 Judicial and Legal
1 $6,538 $78,456 0 $0 Police - Other
1 $6,873 $82,476 26 $20,597 Fire - Other
0 $0 6 $2,978
Totals for Government
143 $1,263,586 $106,035 65 $56,951
Port Chester government finances - Expenditure in 2018 (per resident):
Construction - Sewerage: $2,790,000 ($90.52)
Regular Highways: $2,425,000 ($78.68)Police Protection: $592,000 ($19.21)Parks and Recreation: $534,000 ($17.32)General - Other: $451,000 ($14.63)Local Fire Protection: $117,000 ($3.80)Current Operations - General - Other: $14,583,000 ($473.12)
Police Protection: $9,172,000 ($297.57)Solid Waste Management: $2,113,000 ($68.55)Judicial and Legal Services: $1,789,000 ($58.04)Regular Highways: $1,543,000 ($50.06)Protective Inspection and Regulation - Other: $1,396,000 ($45.29)Central Staff Services: $1,148,000 ($37.24)Parks and Recreation: $1,120,000 ($36.34)Libraries: $1,015,000 ($32.93)Local Fire Protection: $737,000 ($23.91)Financial Administration: $708,000 ($22.97)General Public Buildings: $596,000 ($19.34)Parking Facilities: $421,000 ($13.66)Sewerage: $319,000 ($10.35)Health - Other: $272,000 ($8.82)Correctional Institutions: $3,000 ($0.10)General - Interest on Debt: $2,328,000 ($75.53)
Intergovernmental to Local - Other - Financial Administration: $127,000 ($4.12)
Other Capital Outlay - Police Protection: $110,000 ($3.57)
Local Fire Protection: $100,000 ($3.24)Regular Highways: $65,000 ($2.11)General - Other: $58,000 ($1.88)Central Staff Services: $49,000 ($1.59)Parks and Recreation: $21,000 ($0.68)Solid Waste Management: $21,000 ($0.68)Sewerage: $16,000 ($0.52)General Public Building: $12,000 ($0.39)Protective Inspection and Regulation - Other: $7,000 ($0.23)Financial Administration: $5,000 ($0.16)Judicial and Legal Services: $2,000 ($0.06)Total Salaries and Wages: $17,919,000 ($581.35)
Port Chester government finances - Revenue in 2018 (per resident):
Charges - Parking Facilities: $1,769,000 ($57.39)
Sewerage: $1,528,000 ($49.57)Other: $1,238,000 ($40.16)Solid Waste Management: $300,000 ($9.73)Parks and Recreation: $251,000 ($8.14)Federal Intergovernmental - Other: $163,000 ($5.29)
Local Intergovernmental - General Local Government Support: $4,570,000 ($148.27)
Highways: $79,000 ($2.56)Miscellaneous - Fines and Forfeits: $2,960,000 ($96.03)
General Revenue - Other: $1,461,000 ($47.40)Rents: $399,000 ($12.94)Donations From Private Sources: $46,000 ($1.49)Interest Earnings: $30,000 ($0.97)Special Assessments: $26,000 ($0.84)State Intergovernmental - Other: $433,000 ($14.05)
General Local Government Support: $400,000 ($12.98)Highways: $349,000 ($11.32)Tax - Property: $24,084,000 ($781.36)
Other License: $1,343,000 ($43.57)Public Utilities Sales: $976,000 ($31.66)Amusements License: $2,000 ($0.06)
Port Chester government finances - Debt in 2018 (per resident):
Long Term Debt - Outstanding Unspecified Public Purpose: $43,928,000 ($1425.17)
Beginning Outstanding - Unspecified Public Purpose: $37,210,000 ($1207.22)Issue, Unspecified Public Purpose: $10,293,000 ($333.94)Retired Unspecified Public Purpose: $3,575,000 ($115.98)Short Term Debt Outstanding - Beginning: $5,998,000 ($194.59)
End of Fiscal Year: $4,681,000 ($151.87)
Port Chester government finances - Cash and Securities in 2018 (per resident):
Bond Funds - Cash and Securities: $12,780,000 ($414.63)
Other Funds - Cash and Securities: $7,807,000 ($253.28)
Sinking Funds - Cash and Securities: $551,000 ($17.88)
5.69% of this county's 2021 resident taxpayers lived in other counties in 2020 ($147,956 average adjusted gross income )
Here:
5.69%New York average:
5.29%
0.02% of residents moved from foreign countries ($25 average AGI )Westchester County:
0.02%New York average:
0.01%
Top counties from which taxpayers relocated into this county between 2020 and 2021:
6.51% of this county's 2020 resident taxpayers moved to other counties in 2021 ($174,362 average adjusted gross income )
Here:
6.51%New York average:
6.93%
0.01% of residents moved to foreign countries ($44 average AGI )Westchester County:
0.01%New York average:
0.02%
Top counties to which taxpayers relocated from this county between 2020 and 2021:
Businesses in Port Chester, NY
Name Count Name Count
Applebee's 1 MasterBrand Cabinets 1 Bed Bath & Beyond 1 New Balance 3 Buffalo Wild Wings 1 Nike 1 Burger King 1 Nissan 1 Casual Male XL 1 Panera Bread 1 Costco 1 Pathmark 1 DHL 1 PetSmart 1 Domino's Pizza 1 RadioShack 1 DressBarn 1 Sprint Nextel 1 Dressbarn 1 Starbucks 1 Dunkin Donuts 2 Stop & Shop 1 FedEx 4 Subway 3 GameStop 1 True Value 1 H&R Block 1 U-Haul 1 Home Depot 1 UPS 3 KFC 1 Verizon Wireless 1 Kohl's 1 Walgreens 1 Marshalls 1 Wendy's 1
Strongest AM radio stations in Port Chester:
WFAN (660 AM; 50 kW; NEW YORK, NY; Owner: INFINITY BROADCASTING OPERATIONS, INC.)
WCBS (880 AM; 50 kW; NEW YORK, NY; Owner: INFINITY BROADCASTING OPERATIONS, INC.)
WGSM (740 AM; 25 kW; HUNTINGTON, NY; Owner: K RADIO LICENSEE, INC.)
WABC (770 AM; 50 kW; NEW YORK, NY; Owner: WABC-AM RADIO, INC.)
WGCH (1490 AM; 1 kW; GREENWICH, CT; Owner: THE GREENWICH BROADCASTING CORP.)
WMCA (570 AM; 50 kW; NEW YORK, NY; Owner: SALEM MEDIA OF NEW YORK, LLC)
WOR (710 AM; 50 kW; NEW YORK, NY; Owner: BUCKLEY BROADCASTING CORPORATION)
WBBR (1130 AM; 50 kW; NEW YORK, NY; Owner: BLOOMBERG COMMUNICATIONS INC.)
WEPN (1050 AM; 50 kW; NEW YORK, NY; Owner: NEW YORK AM RADIO, LLC)
WINS (1010 AM; 50 kW; NEW YORK, NY; Owner: INFINITY BROADCASTING OPERATIONS, INC.)
WADO (1280 AM; 50 kW; NEW YORK, NY; Owner: WADO-AM LICENSE CORP.)
WQEW (1560 AM; 50 kW; NEW YORK, NY; Owner: THE NEW YORK TIMES ELECTRONIC MEDIA COMPANY)
WLIB (1190 AM; 30 kW; NEW YORK, NY; Owner: ICBC BROADCAST HOLDINGS-NY, INC.)
Strongest FM radio stations in Port Chester:
WPLJ (95.5 FM; NEW YORK, NY; Owner: WPLJ-FM RADIO, INC.)
WFAS-FM (103.9 FM; WHITE PLAINS, NY; Owner: CUMULUS LICENSING CORP.)
WXPK (107.1 FM; BRIARCLIFF MANOR, NY; Owner: NASSAU BROADCASTING HOLDINGS, INC.)
WARY (88.1 FM; VALHALLA, NY; Owner: WESTCHESTER COMMUNITY COLLEGE)
WKCR-FM (89.9 FM; NEW YORK, NY; Owner: TRUSTEES OF COLUMBIA UNIVERSITY IN NEW YORK)
WKTU (103.5 FM; LAKE SUCCESS, NY; Owner: AMFM RADIO LICENSES, LLC)
WKHL (96.7 FM; STAMFORD, CT; Owner: COX RADIO, INC.)
WEDW-FM (88.5 FM; STAMFORD, CT; Owner: CONNECTICUT PUBLIC BROADCASTING, INC)
WQCD (101.9 FM; NEW YORK, NY; Owner: EMMIS RADIO LICENSE CORPORATION)
WAXQ (104.3 FM; NEW YORK, NY; Owner: AMFM NEW YORK LICENSES, LLC)
WHTZ (100.3 FM; NEWARK, NJ; Owner: AMFM RADIO LICENSES, L.L.C.)
WWPR-FM (105.1 FM; NEW YORK, NY; Owner: AMFM RADIO LICENSES, L.L.C.)
WCAA (105.9 FM; NEWARK, NJ; Owner: WADO-AM LICENSE CORP. ("WADO"))
WBAI (99.5 FM; NEW YORK, NY; Owner: PACIFICA FOUNDATION, INC.)
WBLS (107.5 FM; NEW YORK, NY; Owner: ICBC BROADCAST HOLDINGS-NY, INC.)
WLTW (106.7 FM; NEW YORK, NY; Owner: AMFM NEW YORK LICENSES, LLC)
WQXR-FM (96.3 FM; NEW YORK, NY; Owner: THE NEW YORK TIMES ELECTRONIC MEDIA COMPANY)
WSKQ-FM (97.9 FM; NEW YORK, NY; Owner: WSKQ LICENSING, INC.)
WXRK (92.3 FM; NEW YORK, NY; Owner: INFINITY BROADCASTING OPERATIONS, INC.)
WCBS-FM (101.1 FM; NEW YORK, NY; Owner: INFINITY BROADCASTING OPERATIONS, INC.)
TV broadcast stations around Port Chester:
WNYW (Channel 5; NEW YORK, NY; Owner: FOX TELEVISION STATIONS, INC.)
W38CL (Channel 38; BRONX, NY; Owner: RENARD COMMUNICATIONS CORP.)
WCBS-TV (Channel 2; NEW YORK, NY; Owner: CBS BROADCASTING INC.)
WABC-TV (Channel 7; NEW YORK, NY; Owner: AMERICAN BROADCASTING COMPANIES, INC)
WPIX (Channel 11; NEW YORK, NY; Owner: WPIX, INC.)
WWOR-TV (Channel 9; SECAUCUS, NJ; Owner: FOX TELEVISION STATIONS, INC.)
W68DN (Channel 68; CHERRY HILL, ETC., NJ; Owner: MARCIA COHEN)
WXNY-LP (Channel 32; NEW YORK, NY; Owner: ISLAND BROADCASTING COMPANY)
WNJU (Channel 47; LINDEN, NJ; Owner: WNJU LICENSE CORPORATION)
WFUT (Channel 68; NEWARK, NJ; Owner: UNIVISION NEW YORK LLC)
WPXN-TV (Channel 31; NEW YORK, NY; Owner: PAXSON COMMUNICATIONS LICENSE COMPANY, LLC)
WNYE-TV (Channel 25; NEW YORK, NY; Owner: NEW YORK CITY BOARD OF EDUCATION)
WNBC (Channel 4; NEW YORK, NY; Owner: NATIONAL BROADCASTING COMPANY, INC.)
WNET (Channel 13; NEWARK, NJ; Owner: EDUCATIONAL BROADCASTING CORPORATION)
WXTV (Channel 41; PATERSON, NJ; Owner: WXTV LICENSE PARTNERSHIP, G.P.)
WKOB-LP (Channel 53; NEW YORK, NY; Owner: WKOB COMMUNICATIONS, INC.)
WEBR-CA (Channel 17; MANHATTAN, NY; Owner: K LICENSEE INC.)
WRNN-LP (Channel 57; NYACK, NY; Owner: LP NYACK LIMITED PARTNERSHIP)
W60AI (Channel 60; NEW YORK, NY; Owner: VENTANA TELEVISION, INC.)
W27CD (Channel 27; STAMFORD, CT; Owner: WLNY-TV, INC.)
WPXO-LP (Channel 34; EAST ORANGE, NJ; Owner: PAXSON COMMUNICATIONS LPTV, INC.)
WNYX-LP (Channel 35; NEW YORK, NY; Owner: ISLAND BROADCASTING COMPANY)
W33BS (Channel 33; DARIEN, CT; Owner: CT&T BROADCASTING, INC.)
WNYN-LP (Channel 39; NEW YORK, NY; Owner: ISLAND BROADCASTING COMPANY)
WFME-TV (Channel 66; WEST MILFORD, NJ; Owner: FAMILY STATIONS, INC.)
National Bridge Inventory (NBI) Statistics 19 Number of bridges203ft / 61.9m Total length $94,720,000 Total costs396,861 Total average daily traffic9,424 Total average daily truck traffic
New bridges - historical statistics
6 Before 1900 2 1900-1909 1 1920-1929 3 1930-1939 2 1950-1959 2 1960-1969 1 1990-1999 2 2020-2022
See full National Bridge Inventory statistics for Port Chester, NY
FCC Registered Private Land Mobile Towers: 2 (
See the full list of FCC Registered Private Land Mobile Towers in Port Chester, NY )
FCC Registered Broadcast Land Mobile Towers: 9 (
See the full list of FCC Registered Broadcast Land Mobile Towers )
FCC Registered Microwave Towers: 6 (
See the full list of FCC Registered Microwave Towers in this town )
FCC Registered Paging Towers: 2 (
See the full list of FCC Registered Paging Towers )
FCC Registered Maritime Coast & Aviation Ground Towers: 2 (
See the full list of FCC Registered Maritime Coast & Aviation Ground Towers )
FCC Registered Amateur Radio Licenses: 26 (
See the full list of FCC Registered Amateur Radio Licenses in Port Chester )
FAA Registered Aircraft: 1
Aircraft: PIPER PA-28-140 (Category: Land, Seats: 4, Weight: Up to 12,499 Pounds, Speed: 107 mph), Engine: LYCOMING 0-320 SERIES (180 HP) (Reciprocating)N-Number: 75037, N75037, N-75037, Serial Number: 28-7625193, Year manufactured: 1976, Certificate Issue Date: 11/10/1976Registrant (Individual): John Cooper, 80 Purdy Ave, Port Chester, NY 10573
Home Mortgage Disclosure Act Aggregated Statistics For Year 2009(Based on 5 full tracts) A) FHA, FSA/RHS & VA B) Conventional C) Refinancings D) Home Improvement Loans E) Loans on Dwellings For 5+ Families F) Non-occupant Loans on G) Loans On Manufactured Number Average Value Number Average Value Number Average Value Number Average Value Number Average Value Number Average Value Number Average Value
LOANS ORIGINATED 24 $369,583 81 $266,704 100 $301,630 9 $152,889 3 $1,383,333 5 $500,000 0 $0 APPLICATIONS APPROVED, NOT ACCEPTED 0 $0 10 $246,300 24 $321,167 4 $117,250 0 $0 0 $0 1 $410,000 APPLICATIONS DENIED 10 $375,500 35 $203,971 101 $349,238 10 $69,900 1 $200,000 16 $286,500 0 $0 APPLICATIONS WITHDRAWN 10 $344,200 11 $265,818 45 $318,356 2 $322,500 3 $660,000 2 $280,000 0 $0 FILES CLOSED FOR INCOMPLETENESS 3 $378,667 6 $260,833 21 $377,667 2 $156,000 0 $0 6 $396,500 0 $0
Aggregated Statistics For Year 2008(Based on 5 full tracts) A) FHA, FSA/RHS & VA B) Conventional C) Refinancings D) Home Improvement Loans E) Loans on Dwellings For 5+ Families F) Non-occupant Loans on Number Average Value Number Average Value Number Average Value Number Average Value Number Average Value Number Average Value
LOANS ORIGINATED 5 $437,800 127 $316,268 67 $354,836 16 $116,500 4 $1,557,500 17 $567,353 APPLICATIONS APPROVED, NOT ACCEPTED 0 $0 25 $309,800 46 $289,391 4 $48,750 0 $0 4 $321,750 APPLICATIONS DENIED 2 $263,000 50 $290,680 127 $370,606 25 $95,040 0 $0 9 $355,778 APPLICATIONS WITHDRAWN 2 $334,000 23 $337,957 39 $366,410 1 $150,000 2 $350,000 3 $364,000 FILES CLOSED FOR INCOMPLETENESS 1 $360,000 13 $314,462 14 $370,071 4 $316,000 0 $0 2 $456,000
Aggregated Statistics For Year 2007(Based on 5 full tracts) A) FHA, FSA/RHS & VA B) Conventional C) Refinancings D) Home Improvement Loans E) Loans on Dwellings For 5+ Families F) Non-occupant Loans on Number Average Value Number Average Value Number Average Value Number Average Value Number Average Value Number Average Value
LOANS ORIGINATED 3 $404,333 208 $303,236 218 $314,183 31 $110,129 15 $812,400 35 $417,657 APPLICATIONS APPROVED, NOT ACCEPTED 0 $0 44 $327,273 79 $326,696 18 $72,556 0 $0 6 $367,167 APPLICATIONS DENIED 1 $275,000 79 $329,785 270 $401,570 34 $103,912 3 $518,000 36 $352,611 APPLICATIONS WITHDRAWN 2 $290,000 30 $320,567 66 $372,530 4 $222,250 3 $608,333 12 $408,333 FILES CLOSED FOR INCOMPLETENESS 0 $0 7 $341,857 37 $422,081 0 $0 0 $0 4 $431,000
Aggregated Statistics For Year 2006(Based on 5 full tracts) A) FHA, FSA/RHS & VA B) Conventional C) Refinancings D) Home Improvement Loans E) Loans on Dwellings For 5+ Families F) Non-occupant Loans on Number Average Value Number Average Value Number Average Value Number Average Value Number Average Value Number Average Value
LOANS ORIGINATED 2 $299,500 280 $294,400 326 $327,193 41 $116,683 21 $1,074,429 48 $353,354 APPLICATIONS APPROVED, NOT ACCEPTED 0 $0 48 $281,625 111 $280,532 19 $107,579 0 $0 15 $363,400 APPLICATIONS DENIED 0 $0 139 $348,662 236 $337,992 39 $117,513 2 $600,000 31 $366,032 APPLICATIONS WITHDRAWN 0 $0 57 $291,421 165 $343,745 8 $286,000 1 $250,000 10 $408,100 FILES CLOSED FOR INCOMPLETENESS 0 $0 14 $328,071 38 $358,579 0 $0 0 $0 2 $386,500
Aggregated Statistics For Year 2005(Based on 5 full tracts) B) Conventional C) Refinancings D) Home Improvement Loans E) Loans on Dwellings For 5+ Families F) Non-occupant Loans on Number Average Value Number Average Value Number Average Value Number Average Value Number Average Value
LOANS ORIGINATED 394 $307,924 310 $318,987 54 $198,556 7 $545,429 56 $328,571 APPLICATIONS APPROVED, NOT ACCEPTED 54 $271,611 79 $315,620 17 $103,882 0 $0 17 $394,529 APPLICATIONS DENIED 148 $323,541 192 $357,964 39 $174,282 1 $1,013,000 43 $408,209 APPLICATIONS WITHDRAWN 61 $337,951 193 $309,332 18 $250,278 4 $787,500 18 $391,222 FILES CLOSED FOR INCOMPLETENESS 12 $297,250 59 $361,780 1 $75,000 0 $0 5 $368,200
Aggregated Statistics For Year 2004(Based on 5 full tracts) A) FHA, FSA/RHS & VA B) Conventional C) Refinancings D) Home Improvement Loans E) Loans on Dwellings For 5+ Families F) Non-occupant Loans on G) Loans On Manufactured Number Average Value Number Average Value Number Average Value Number Average Value Number Average Value Number Average Value Number Average Value
LOANS ORIGINATED 0 $0 297 $312,350 355 $291,513 42 $147,167 9 $897,667 70 $305,486 0 $0 APPLICATIONS APPROVED, NOT ACCEPTED 1 $345,000 66 $319,697 108 $294,380 19 $104,947 3 $420,333 19 $313,368 0 $0 APPLICATIONS DENIED 0 $0 72 $303,875 202 $323,277 58 $119,448 1 $500,000 32 $289,688 0 $0 APPLICATIONS WITHDRAWN 0 $0 57 $299,439 187 $292,898 13 $173,077 2 $622,500 16 $283,625 2 $405,000 FILES CLOSED FOR INCOMPLETENESS 0 $0 13 $336,923 52 $320,442 4 $104,000 0 $0 4 $317,500 0 $0
Aggregated Statistics For Year 2003(Based on 5 full tracts) A) FHA, FSA/RHS & VA B) Conventional C) Refinancings D) Home Improvement Loans E) Loans on Dwellings For 5+ Families F) Non-occupant Loans on Number Average Value Number Average Value Number Average Value Number Average Value Number Average Value Number Average Value
LOANS ORIGINATED 1 $228,000 289 $268,083 675 $238,879 25 $61,360 8 $475,875 90 $274,711 APPLICATIONS APPROVED, NOT ACCEPTED 0 $0 46 $269,109 142 $259,092 13 $57,769 0 $0 13 $214,462 APPLICATIONS DENIED 0 $0 65 $313,554 259 $263,537 31 $42,258 1 $425,000 26 $282,269 APPLICATIONS WITHDRAWN 0 $0 42 $473,000 144 $246,590 4 $50,000 1 $780,000 12 $317,833 FILES CLOSED FOR INCOMPLETENESS 0 $0 12 $225,500 45 $244,756 4 $68,000 0 $0 0 $0
Aggregated Statistics For Year 2002(Based on 5 full tracts) B) Conventional C) Refinancings D) Home Improvement Loans E) Loans on Dwellings For 5+ Families F) Non-occupant Loans on Number Average Value Number Average Value Number Average Value Number Average Value Number Average Value
LOANS ORIGINATED 264 $236,739 479 $215,010 45 $48,067 9 $610,444 67 $225,209 APPLICATIONS APPROVED, NOT ACCEPTED 37 $290,811 113 $208,504 16 $47,250 0 $0 18 $267,722 APPLICATIONS DENIED 47 $247,213 194 $201,943 41 $35,317 2 $319,000 18 $238,111 APPLICATIONS WITHDRAWN 31 $195,323 145 $200,697 11 $95,636 1 $473,000 10 $182,300 FILES CLOSED FOR INCOMPLETENESS 4 $190,750 29 $202,655 0 $0 0 $0 2 $160,500
Aggregated Statistics For Year 2001(Based on 5 full tracts) A) FHA, FSA/RHS & VA B) Conventional C) Refinancings D) Home Improvement Loans E) Loans on Dwellings For 5+ Families F) Non-occupant Loans on Number Average Value Number Average Value Number Average Value Number Average Value Number Average Value Number Average Value
LOANS ORIGINATED 4 $219,750 230 $220,696 330 $205,945 43 $53,349 5 $255,800 56 $208,839 APPLICATIONS APPROVED, NOT ACCEPTED 0 $0 36 $215,028 74 $174,216 21 $53,476 0 $0 10 $178,600 APPLICATIONS DENIED 2 $149,000 63 $203,889 153 $185,745 51 $36,373 2 $807,500 26 $212,192 APPLICATIONS WITHDRAWN 0 $0 28 $197,250 134 $191,851 23 $41,043 1 $200,000 12 $173,500 FILES CLOSED FOR INCOMPLETENESS 1 $149,000 10 $254,000 21 $189,810 3 $61,000 0 $0 6 $252,000
Aggregated Statistics For Year 2000(Based on 5 full tracts) A) FHA, FSA/RHS & VA B) Conventional C) Refinancings D) Home Improvement Loans E) Loans on Dwellings For 5+ Families F) Non-occupant Loans on Number Average Value Number Average Value Number Average Value Number Average Value Number Average Value Number Average Value
LOANS ORIGINATED 11 $252,364 282 $216,291 114 $163,009 43 $33,209 10 $322,100 33 $209,758 APPLICATIONS APPROVED, NOT ACCEPTED 1 $432,000 51 $248,000 41 $135,732 11 $65,727 1 $540,000 10 $216,000 APPLICATIONS DENIED 6 $258,833 98 $178,520 115 $151,757 39 $37,590 2 $395,500 14 $211,857 APPLICATIONS WITHDRAWN 0 $0 33 $233,515 105 $110,533 9 $53,222 0 $0 6 $230,167 FILES CLOSED FOR INCOMPLETENESS 0 $0 9 $209,556 21 $187,048 2 $27,500 0 $0 0 $0
Aggregated Statistics For Year 1999(Based on 2 full and 3 partial tracts) A) FHA, FSA/RHS & VA B) Conventional C) Refinancings D) Home Improvement Loans E) Loans on Dwellings For 5+ Families F) Non-occupant Loans on Number Average Value Number Average Value Number Average Value Number Average Value Number Average Value Number Average Value
LOANS ORIGINATED 12 $178,463 229 $176,581 202 $148,990 54 $32,118 8 $328,994 45 $164,088 APPLICATIONS APPROVED, NOT ACCEPTED 0 $0 37 $215,284 66 $143,629 19 $37,283 3 $133,333 10 $160,008 APPLICATIONS DENIED 3 $191,293 76 $183,976 127 $143,825 32 $49,439 4 $425,718 18 $134,417 APPLICATIONS WITHDRAWN 3 $291,890 32 $202,413 111 $137,693 9 $88,671 2 $253,545 7 $145,800 FILES CLOSED FOR INCOMPLETENESS 1 $220,000 12 $144,410 26 $174,544 5 $72,402 0 $0 3 $164,143
Detailed HMDA statistics for the following Tracts:
0078.00
, 0079.00 , 0080.00 , 0081.00 , 0082.00
Private Mortgage Insurance Companies Aggregated Statistics For Year 2009(Based on 5 full tracts) A) Conventional B) Refinancings Number Average Value Number Average Value
LOANS ORIGINATED 18 $306,667 2 $378,500 APPLICATIONS APPROVED, NOT ACCEPTED 4 $280,500 2 $424,000 APPLICATIONS DENIED 10 $301,000 1 $380,000 APPLICATIONS WITHDRAWN 0 $0 2 $371,000 FILES CLOSED FOR INCOMPLETENESS 2 $405,500 1 $441,000
Aggregated Statistics For Year 2008(Based on 5 full tracts) A) Conventional B) Refinancings C) Non-occupant Loans on Number Average Value Number Average Value Number Average Value
LOANS ORIGINATED 45 $343,044 5 $426,000 0 $0 APPLICATIONS APPROVED, NOT ACCEPTED 16 $317,750 1 $642,000 0 $0 APPLICATIONS DENIED 12 $324,917 1 $383,000 1 $243,000 APPLICATIONS WITHDRAWN 5 $388,600 1 $441,000 1 $401,000 FILES CLOSED FOR INCOMPLETENESS 1 $81,000 0 $0 0 $0
Aggregated Statistics For Year 2007(Based on 5 full tracts) A) Conventional B) Refinancings C) Non-occupant Loans on Number Average Value Number Average Value Number Average Value
LOANS ORIGINATED 31 $257,194 10 $485,900 0 $0 APPLICATIONS APPROVED, NOT ACCEPTED 6 $285,667 4 $391,750 1 $364,000 APPLICATIONS DENIED 5 $545,200 0 $0 0 $0 APPLICATIONS WITHDRAWN 3 $223,667 1 $468,000 0 $0 FILES CLOSED FOR INCOMPLETENESS 0 $0 1 $363,000 0 $0
Aggregated Statistics For Year 2006(Based on 4 full tracts) A) Conventional B) Refinancings Number Average Value Number Average Value
LOANS ORIGINATED 16 $225,812 1 $477,000 APPLICATIONS APPROVED, NOT ACCEPTED 15 $173,133 2 $328,000 APPLICATIONS DENIED 0 $0 0 $0 APPLICATIONS WITHDRAWN 1 $109,000 0 $0 FILES CLOSED FOR INCOMPLETENESS 0 $0 0 $0
Aggregated Statistics For Year 2005(Based on 5 full tracts) A) Conventional B) Refinancings C) Non-occupant Loans on Number Average Value Number Average Value Number Average Value
LOANS ORIGINATED 26 $209,000 2 $491,500 3 $359,667 APPLICATIONS APPROVED, NOT ACCEPTED 16 $219,750 0 $0 1 $621,000 APPLICATIONS DENIED 1 $456,000 0 $0 0 $0 APPLICATIONS WITHDRAWN 1 $203,000 0 $0 0 $0 FILES CLOSED FOR INCOMPLETENESS 1 $272,000 1 $240,000 0 $0
Aggregated Statistics For Year 2004(Based on 5 full tracts) A) Conventional B) Refinancings Number Average Value Number Average Value
LOANS ORIGINATED 35 $234,743 2 $277,000 APPLICATIONS APPROVED, NOT ACCEPTED 12 $246,667 2 $304,000 APPLICATIONS DENIED 2 $220,000 0 $0 APPLICATIONS WITHDRAWN 1 $443,000 1 $330,000 FILES CLOSED FOR INCOMPLETENESS 2 $214,500 0 $0
Aggregated Statistics For Year 2003(Based on 5 full tracts) A) Conventional B) Refinancings C) Non-occupant Loans on Number Average Value Number Average Value Number Average Value
LOANS ORIGINATED 74 $269,932 17 $263,941 5 $178,400 APPLICATIONS APPROVED, NOT ACCEPTED 22 $259,273 1 $412,000 0 $0 APPLICATIONS DENIED 2 $182,500 1 $110,000 2 $182,500 APPLICATIONS WITHDRAWN 3 $239,333 2 $292,500 0 $0 FILES CLOSED FOR INCOMPLETENESS 0 $0 0 $0 0 $0
Aggregated Statistics For Year 2002(Based on 5 full tracts) A) Conventional B) Refinancings C) Non-occupant Loans on Number Average Value Number Average Value Number Average Value
LOANS ORIGINATED 62 $259,226 10 $260,300 0 $0 APPLICATIONS APPROVED, NOT ACCEPTED 37 $276,405 12 $291,500 1 $234,000 APPLICATIONS DENIED 4 $256,750 3 $291,333 1 $247,000 APPLICATIONS WITHDRAWN 2 $254,500 1 $276,000 1 $269,000 FILES CLOSED FOR INCOMPLETENESS 4 $171,000 1 $359,000 1 $167,000
Aggregated Statistics For Year 2001(Based on 5 full tracts) A) Conventional B) Refinancings C) Non-occupant Loans on Number Average Value Number Average Value Number Average Value
LOANS ORIGINATED 75 $227,880 19 $274,684 4 $183,500 APPLICATIONS APPROVED, NOT ACCEPTED 33 $267,455 5 $251,400 2 $280,500 APPLICATIONS DENIED 4 $288,750 0 $0 1 $269,000 APPLICATIONS WITHDRAWN 1 $295,000 0 $0 0 $0 FILES CLOSED FOR INCOMPLETENESS 0 $0 0 $0 0 $0
Aggregated Statistics For Year 2000(Based on 5 full tracts) A) Conventional B) Refinancings C) Non-occupant Loans on Number Average Value Number Average Value Number Average Value
LOANS ORIGINATED 93 $230,430 10 $206,500 4 $172,500 APPLICATIONS APPROVED, NOT ACCEPTED 16 $248,750 1 $215,000 1 $215,000 APPLICATIONS DENIED 7 $245,429 0 $0 0 $0 APPLICATIONS WITHDRAWN 2 $298,500 1 $38,000 0 $0 FILES CLOSED FOR INCOMPLETENESS 0 $0 0 $0 0 $0
Aggregated Statistics For Year 1999(Based on 2 full and 3 partial tracts) A) Conventional B) Refinancings C) Non-occupant Loans on Number Average Value Number Average Value Number Average Value
LOANS ORIGINATED 84 $190,202 6 $204,900 1 $229,080 APPLICATIONS APPROVED, NOT ACCEPTED 10 $152,306 4 $153,685 0 $0 APPLICATIONS DENIED 12 $196,258 0 $0 0 $0 APPLICATIONS WITHDRAWN 7 $208,511 0 $0 0 $0 FILES CLOSED FOR INCOMPLETENESS 3 $161,660 0 $0 0 $0
Detailed PMIC statistics for the following Tracts:
0078.00
, 0079.00 , 0080.00 , 0081.00 , 0082.00 Port Chester compared to New York state average:
Unemployed percentage significantly below state average. Black race population percentage below state average. Hispanic race population percentage significantly above state average. Median age below state average. Foreign-born population percentage above state average. Length of stay since moving in above state average. Port Chester on our top lists :
#7 on the list of "Top 101 cities with the most people taking a taxi to work (population 5,000+)"
#9 on the list of "Top 101 cities with largest percentage of females in industries: other services, except public administration (population 5,000+)"
#21 on the list of "Top 101 cities with largest percentage of females in occupations: building and grounds cleaning and maintenance occupations (population 5,000+)"
#23 on the list of "Top 101 cities with the most residents born in Ecuador (population 500+)"
#38 on the list of "Top 101 cities with the most residents born in Peru (population 500+)"
#40 on the list of "Top 101 cities with the most residents born in Guatemala (population 500+)"
#44 on the list of "Top 101 cities with the most residents born in South America (population 500+)"
#45 on the list of "Top 101 cities with the most residents born in Chile (population 500+)"
#52 on the list of "Top 101 cities with the most local government spending on highway construction per resident (population 10,000+)"
#52 on the list of "Top 101 cities with the most people walking to work (population 5,000+)"
#72 on the list of "Top 101 cities with largest percentage of males in occupations: building and grounds cleaning and maintenance occupations (population 5,000+)"
#80 on the list of "Top 101 cities with largest percentage of males in industries: administrative and support and waste management services (population 5,000+)"
#93 on the list of "Top 100 cities with highest percentage of foreign-born residents (pop. 5,000+)"
#95 on the list of "Top 101 cities with largest percentage of males in occupations: food preparation and serving related occupations (population 5,000+)"
#10 on the list of "Top 101 counties with the lowest percentage of residents that keep firearms around their homes"
#18 on the list of "Top 101 counties with the most Catholic congregations"
#19 on the list of "Top 101 counties with the most Catholic adherents"
#25 on the list of "Top 101 counties with the most Orthodox congregations"
#27 on the list of "Top 101 counties with the highest percentage of residents that visited a dentist within the past year"
Top Patent Applicants
Chen-Yong Cher (29)
Lorraine M. Herger (25)
Dmitry Andreev (7)
Abram L. Falk (6)
Oktie Hassanzadeh (4)
Rama Gadiraju (3)
Mathew S. Thoennes (2)
Lorraine Herger (2)
Jyotica V. Patel (2)
Zhuojie Wu (2)
Total of 108 patent applications in 2008-2024.
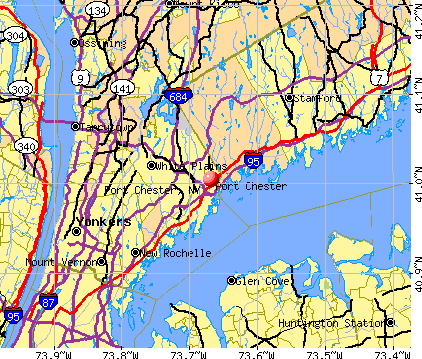


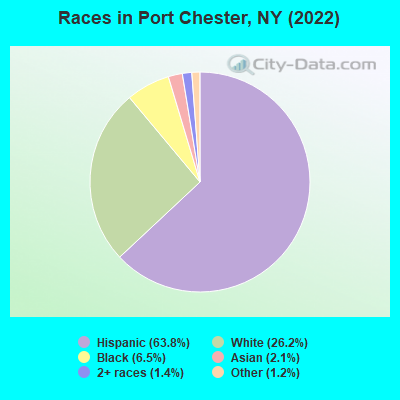
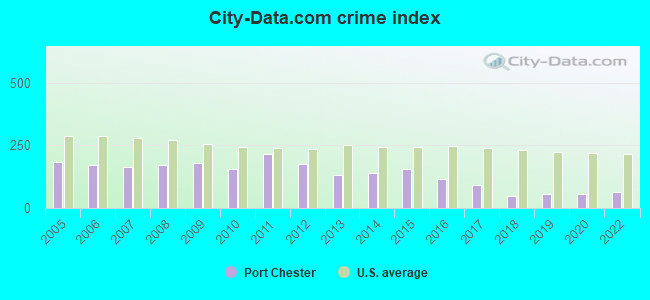
 Recent articles from our blog. Our writers, many of them Ph.D. graduates or candidates, create easy-to-read articles on a wide variety of topics.

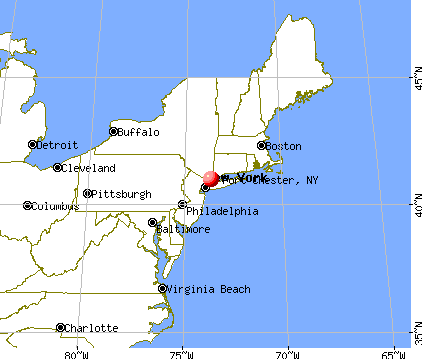
 (3.4 miles
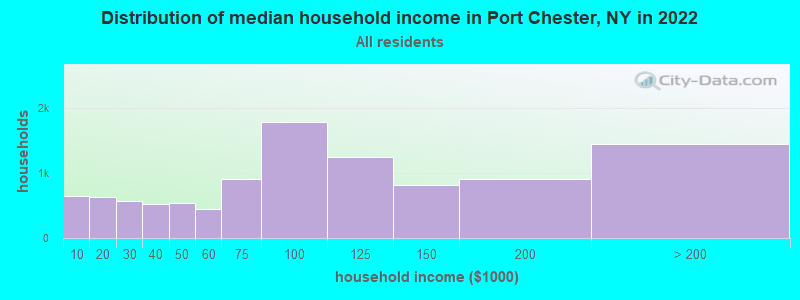
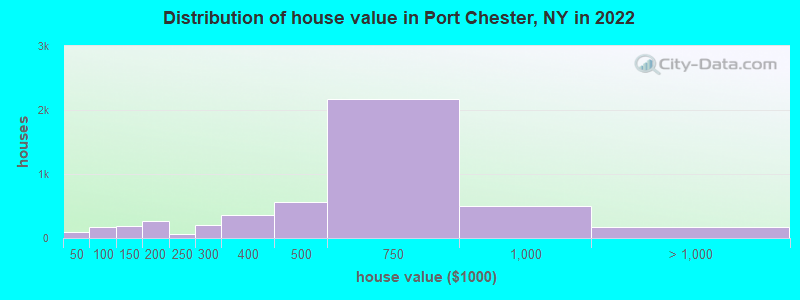
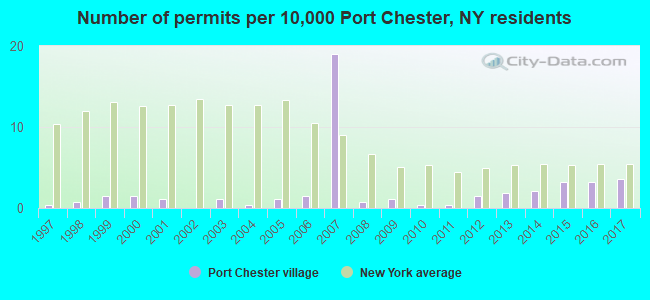
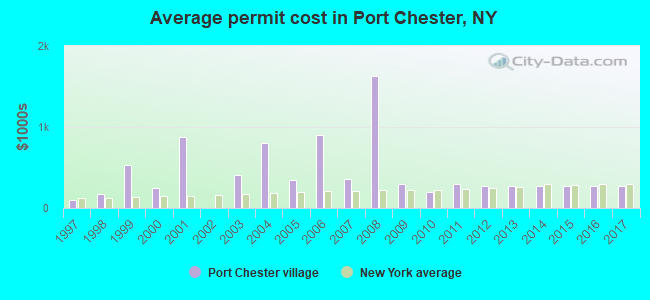
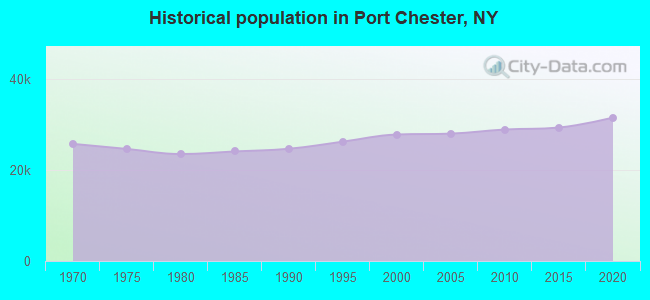
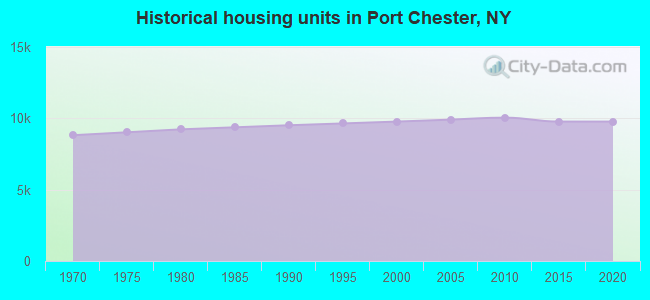
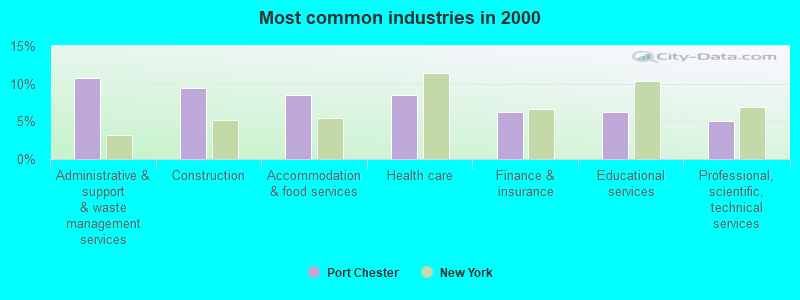
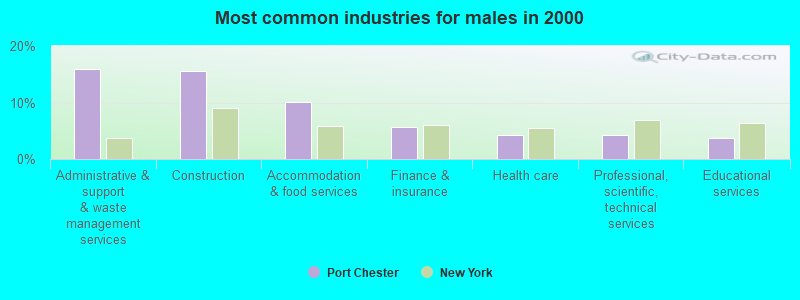
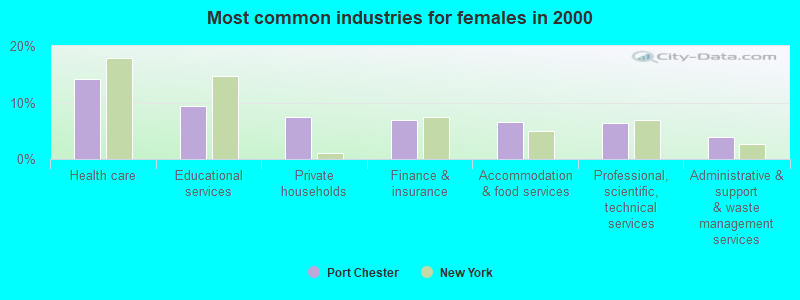
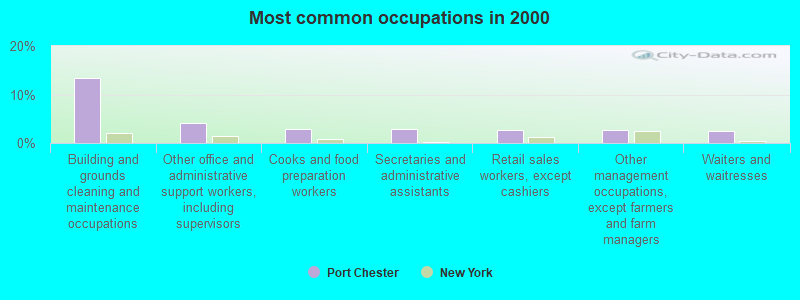
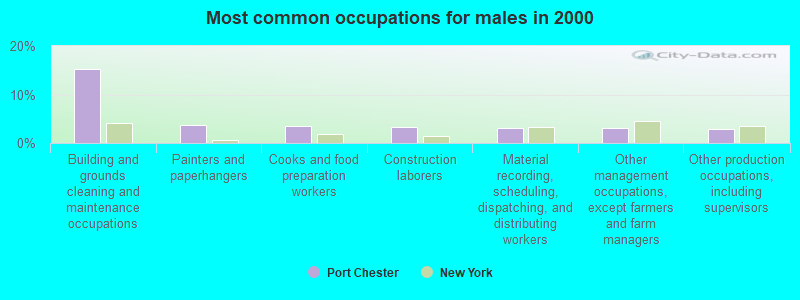
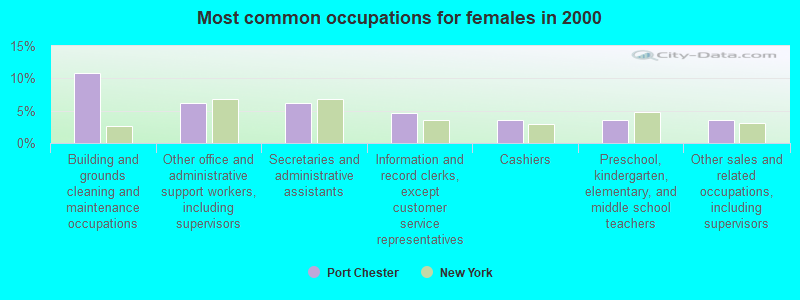


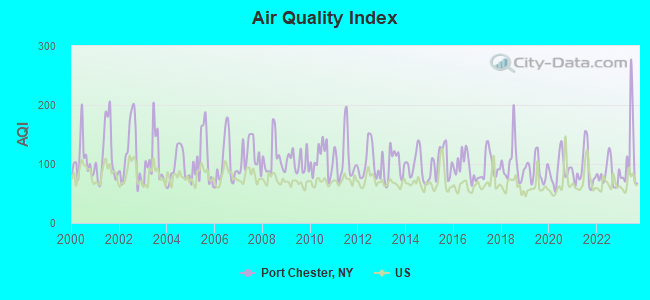
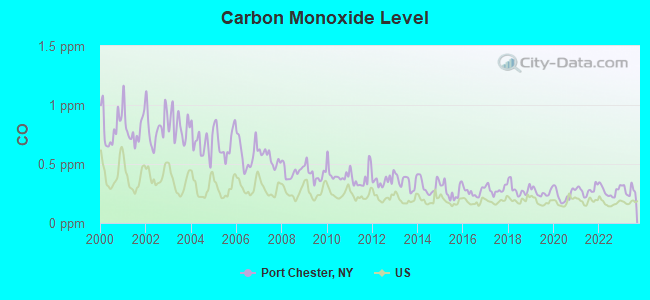
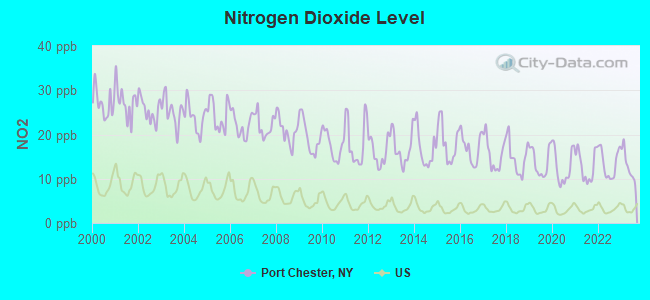
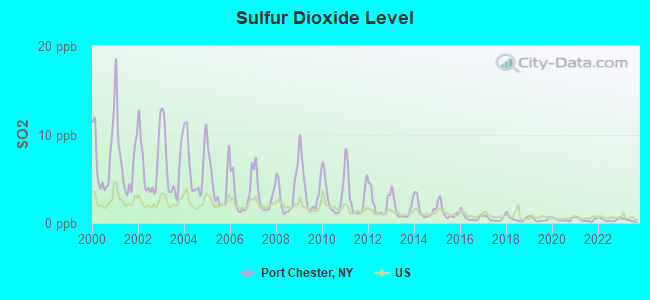
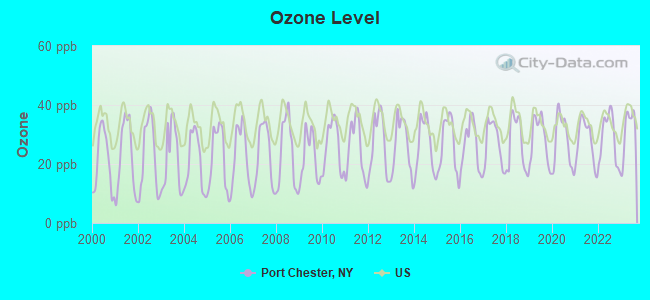
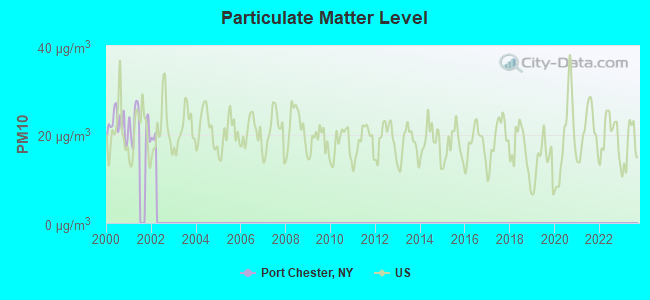
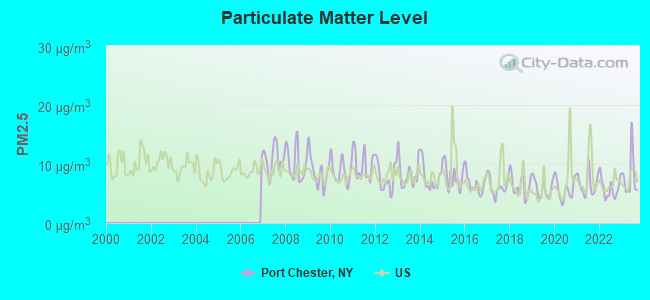
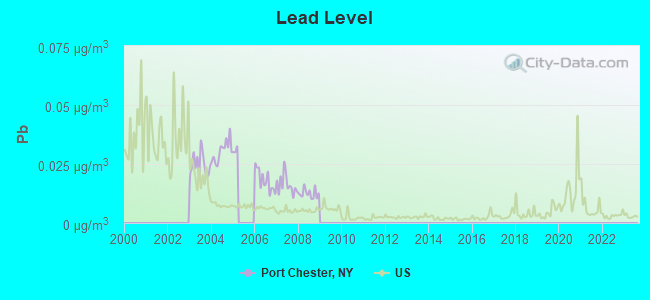
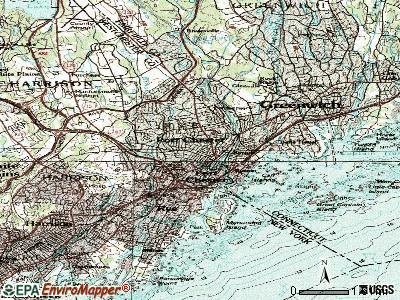
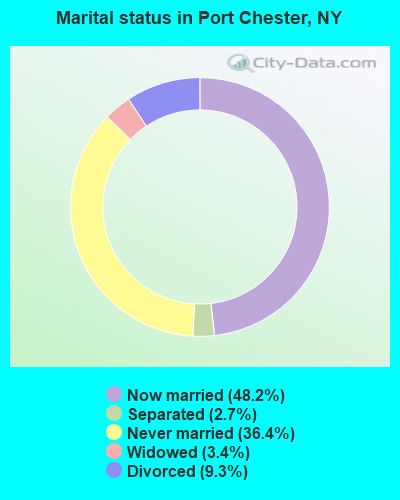
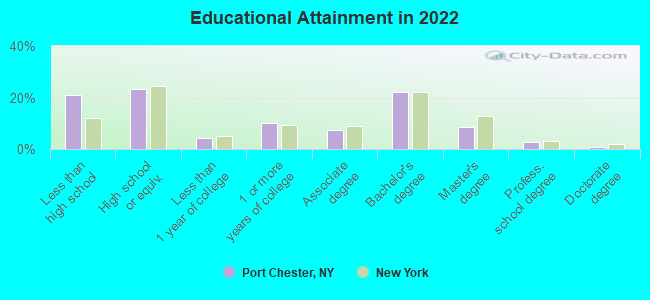
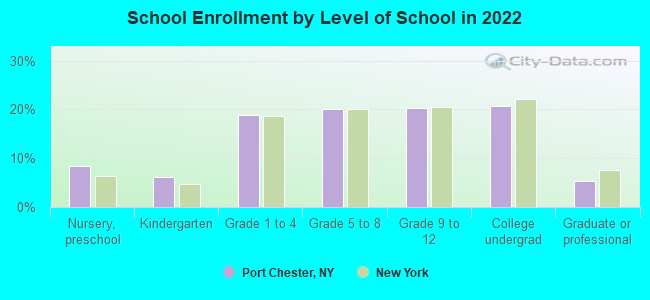
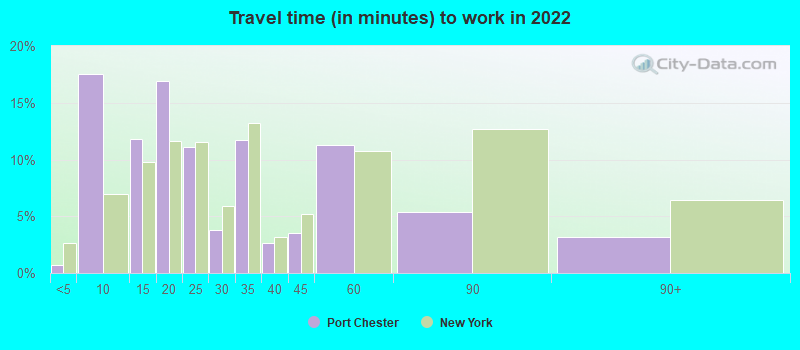
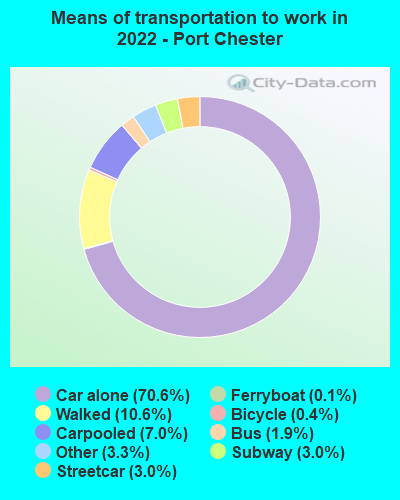
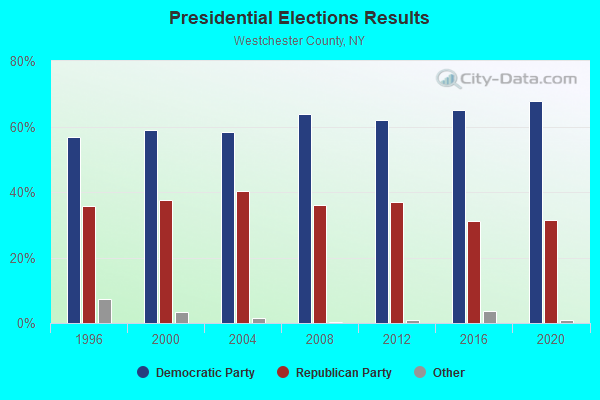
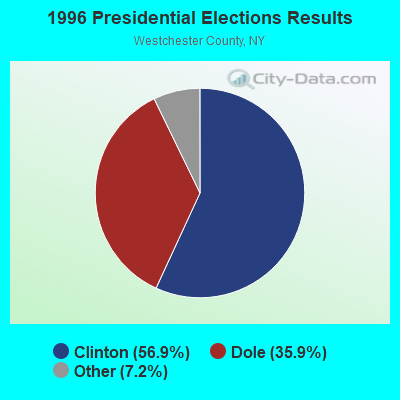
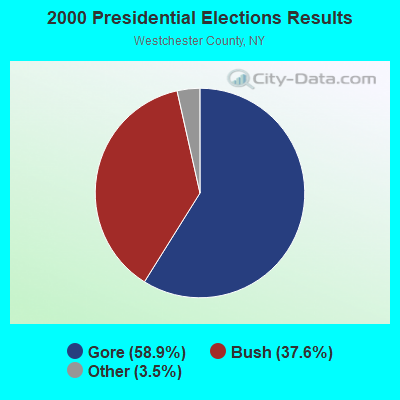
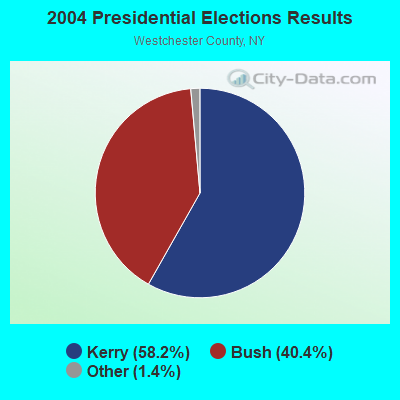
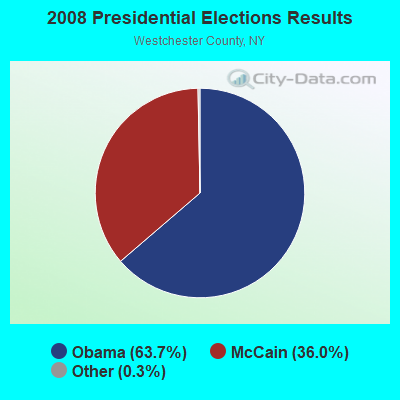
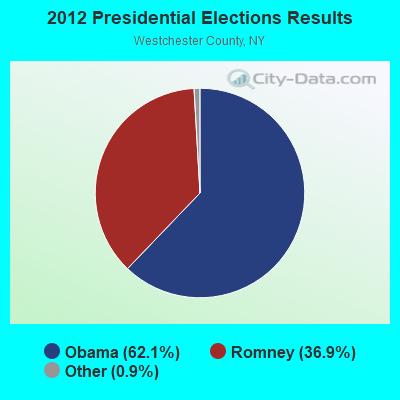
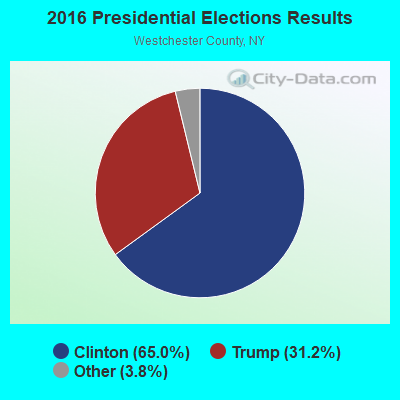
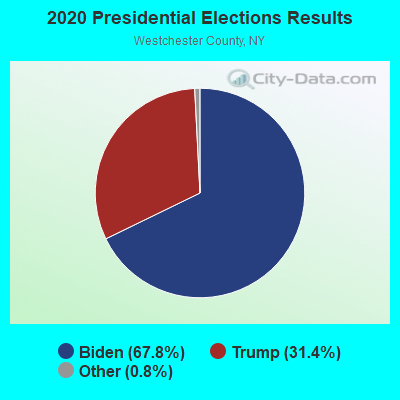
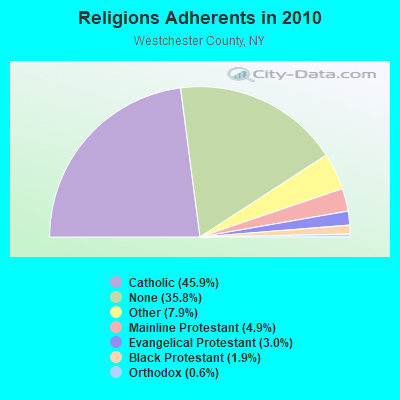
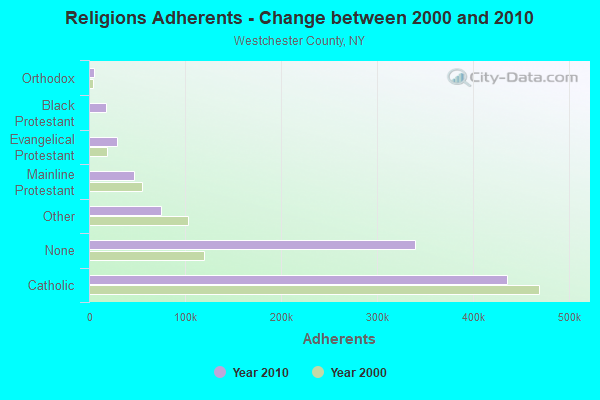
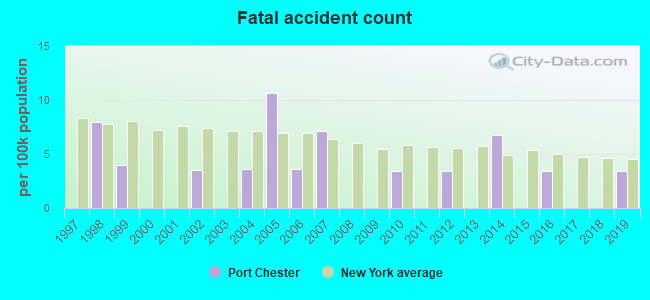
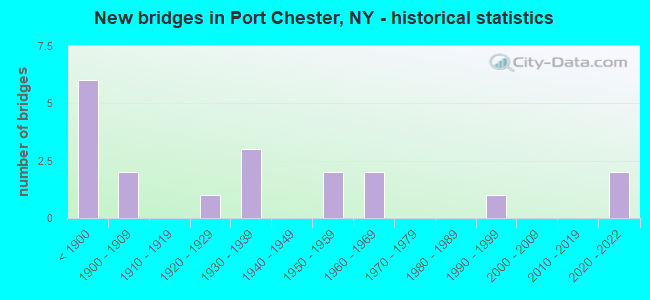
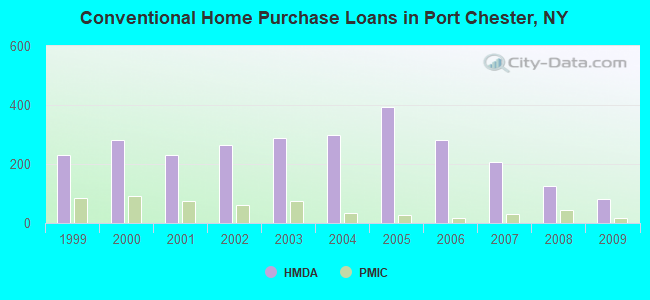
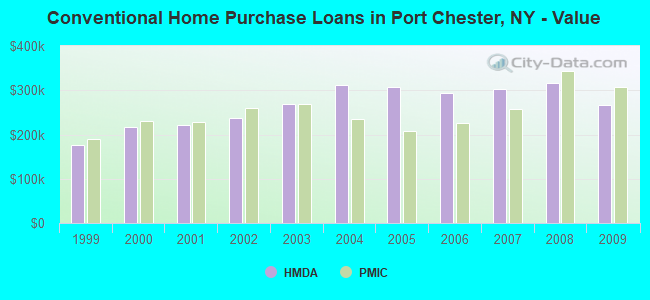
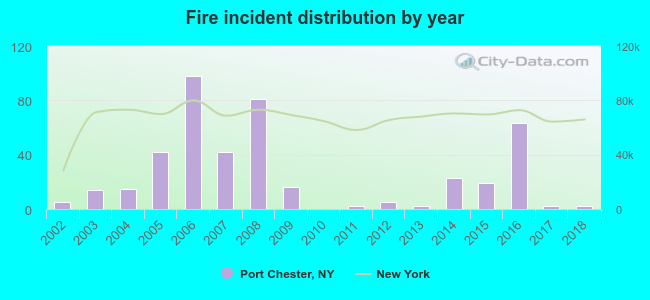 Based on the data from the years 2002 - 2018 the average number of fire incidents per year is 25. The highest number of fire incidents - 98 took place in 2006, and the least - 0 in 2010. The data has a dropping trend.
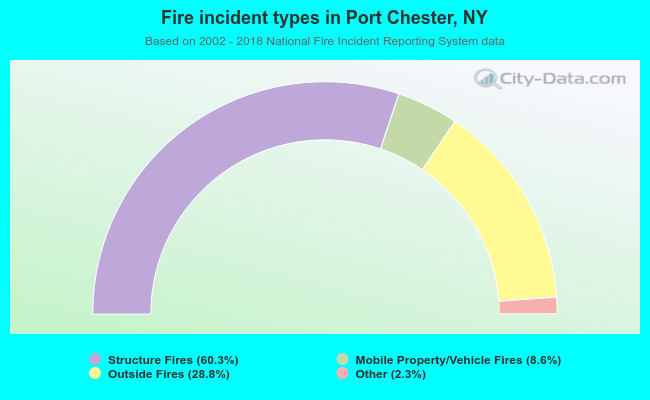 When looking into fire subcategories, the most incidents belonged to: Structure Fires (60.3%), and Outside Fires (28.8%).