Port Jervis, New York Submit your own pictures of this city and show them to the world
OSM Map
General Map
Google Map
MSN Map
OSM Map
General Map
Google Map
MSN Map
OSM Map
General Map
Google Map
MSN Map
OSM Map
General Map
Google Map
MSN Map
Please wait while loading the map...
Population in 2022: 8,625 (100% urban, 0% rural). Population change since 2000: -2.7%Males: 4,191 Females: 4,434
March 2022 cost of living index in Port Jervis: 135.0 (high, U.S. average is 100) Percentage of residents living in poverty in 2022: 23.6%for White Non-Hispanic residents , 35.7% for Black residents , 25.2% for Hispanic or Latino residents , 10.6% for American Indian residents , 10.4% for other race residents , 19.0% for two or more races residents )
Profiles of local businesses
Business Search - 14 Million verified businesses
Data:
Median household income ($)
Median household income (% change since 2000)
Household income diversity
Ratio of average income to average house value (%)
Ratio of average income to average rent
Median household income ($) - White
Median household income ($) - Black or African American
Median household income ($) - Asian
Median household income ($) - Hispanic or Latino
Median household income ($) - American Indian and Alaska Native
Median household income ($) - Multirace
Median household income ($) - Other Race
Median household income for houses/condos with a mortgage ($)
Median household income for apartments without a mortgage ($)
Races - White alone (%)
Races - White alone (% change since 2000)
Races - Black alone (%)
Races - Black alone (% change since 2000)
Races - American Indian alone (%)
Races - American Indian alone (% change since 2000)
Races - Asian alone (%)
Races - Asian alone (% change since 2000)
Races - Hispanic (%)
Races - Hispanic (% change since 2000)
Races - Native Hawaiian and Other Pacific Islander alone (%)
Races - Native Hawaiian and Other Pacific Islander alone (% change since 2000)
Races - Two or more races (%)
Races - Two or more races (% change since 2000)
Races - Other race alone (%)
Races - Other race alone (% change since 2000)
Racial diversity
Unemployment (%)
Unemployment (% change since 2000)
Unemployment (%) - White
Unemployment (%) - Black or African American
Unemployment (%) - Asian
Unemployment (%) - Hispanic or Latino
Unemployment (%) - American Indian and Alaska Native
Unemployment (%) - Multirace
Unemployment (%) - Other Race
Population density (people per square mile)
Population - Males (%)
Population - Females (%)
Population - Males (%) - White
Population - Males (%) - Black or African American
Population - Males (%) - Asian
Population - Males (%) - Hispanic or Latino
Population - Males (%) - American Indian and Alaska Native
Population - Males (%) - Multirace
Population - Males (%) - Other Race
Population - Females (%) - White
Population - Females (%) - Black or African American
Population - Females (%) - Asian
Population - Females (%) - Hispanic or Latino
Population - Females (%) - American Indian and Alaska Native
Population - Females (%) - Multirace
Population - Females (%) - Other Race
Coronavirus confirmed cases (Jun 19, 2024)
Deaths caused by coronavirus (Jun 19, 2024)
Coronavirus confirmed cases (per 100k population) (Jun 19, 2024)
Deaths caused by coronavirus (per 100k population) (Jun 19, 2024)
Daily increase in number of cases (Jun 19, 2024)
Weekly increase in number of cases (Jun 19, 2024)
Cases doubled (in days) (Jun 19, 2024)
Hospitalized patients (Apr 18, 2022)
Negative test results (Apr 18, 2022)
Total test results (Apr 18, 2022)
COVID Vaccine doses distributed (per 100k population) (Sep 19, 2023)
COVID Vaccine doses administered (per 100k population) (Sep 19, 2023)
COVID Vaccine doses distributed (Sep 19, 2023)
COVID Vaccine doses administered (Sep 19, 2023)
Likely homosexual households (%)
Likely homosexual households (% change since 2000)
Likely homosexual households - Lesbian couples (%)
Likely homosexual households - Lesbian couples (% change since 2000)
Likely homosexual households - Gay men (%)
Likely homosexual households - Gay men (% change since 2000)
Cost of living index
Median gross rent ($)
Median contract rent ($)
Median monthly housing costs ($)
Median house or condo value ($)
Median house or condo value ($ change since 2000)
Mean house or condo value by units in structure - 1, detached ($)
Mean house or condo value by units in structure - 1, attached ($)
Mean house or condo value by units in structure - 2 ($)
Mean house or condo value by units in structure by units in structure - 3 or 4 ($)
Mean house or condo value by units in structure - 5 or more ($)
Mean house or condo value by units in structure - Boat, RV, van, etc. ($)
Mean house or condo value by units in structure - Mobile home ($)
Median house or condo value ($) - White
Median house or condo value ($) - Black or African American
Median house or condo value ($) - Asian
Median house or condo value ($) - Hispanic or Latino
Median house or condo value ($) - American Indian and Alaska Native
Median house or condo value ($) - Multirace
Median house or condo value ($) - Other Race
Median resident age
Resident age diversity
Median resident age - Males
Median resident age - Females
Median resident age - White
Median resident age - Black or African American
Median resident age - Asian
Median resident age - Hispanic or Latino
Median resident age - American Indian and Alaska Native
Median resident age - Multirace
Median resident age - Other Race
Median resident age - Males - White
Median resident age - Males - Black or African American
Median resident age - Males - Asian
Median resident age - Males - Hispanic or Latino
Median resident age - Males - American Indian and Alaska Native
Median resident age - Males - Multirace
Median resident age - Males - Other Race
Median resident age - Females - White
Median resident age - Females - Black or African American
Median resident age - Females - Asian
Median resident age - Females - Hispanic or Latino
Median resident age - Females - American Indian and Alaska Native
Median resident age - Females - Multirace
Median resident age - Females - Other Race
Commute - mean travel time to work (minutes)
Travel time to work - Less than 5 minutes (%)
Travel time to work - Less than 5 minutes (% change since 2000)
Travel time to work - 5 to 9 minutes (%)
Travel time to work - 5 to 9 minutes (% change since 2000)
Travel time to work - 10 to 19 minutes (%)
Travel time to work - 10 to 19 minutes (% change since 2000)
Travel time to work - 20 to 29 minutes (%)
Travel time to work - 20 to 29 minutes (% change since 2000)
Travel time to work - 30 to 39 minutes (%)
Travel time to work - 30 to 39 minutes (% change since 2000)
Travel time to work - 40 to 59 minutes (%)
Travel time to work - 40 to 59 minutes (% change since 2000)
Travel time to work - 60 to 89 minutes (%)
Travel time to work - 60 to 89 minutes (% change since 2000)
Travel time to work - 90 or more minutes (%)
Travel time to work - 90 or more minutes (% change since 2000)
Marital status - Never married (%)
Marital status - Now married (%)
Marital status - Separated (%)
Marital status - Widowed (%)
Marital status - Divorced (%)
Median family income ($)
Median family income (% change since 2000)
Median non-family income ($)
Median non-family income (% change since 2000)
Median per capita income ($)
Median per capita income (% change since 2000)
Median family income ($) - White
Median family income ($) - Black or African American
Median family income ($) - Asian
Median family income ($) - Hispanic or Latino
Median family income ($) - American Indian and Alaska Native
Median family income ($) - Multirace
Median family income ($) - Other Race
Median year house/condo built
Median year apartment built
Year house built - Built 2005 or later (%)
Year house built - Built 2000 to 2004 (%)
Year house built - Built 1990 to 1999 (%)
Year house built - Built 1980 to 1989 (%)
Year house built - Built 1970 to 1979 (%)
Year house built - Built 1960 to 1969 (%)
Year house built - Built 1950 to 1959 (%)
Year house built - Built 1940 to 1949 (%)
Year house built - Built 1939 or earlier (%)
Average household size
Household density (households per square mile)
Average household size - White
Average household size - Black or African American
Average household size - Asian
Average household size - Hispanic or Latino
Average household size - American Indian and Alaska Native
Average household size - Multirace
Average household size - Other Race
Occupied housing units (%)
Vacant housing units (%)
Owner occupied housing units (%)
Renter occupied housing units (%)
Vacancy status - For rent (%)
Vacancy status - For sale only (%)
Vacancy status - Rented or sold, not occupied (%)
Vacancy status - For seasonal, recreational, or occasional use (%)
Vacancy status - For migrant workers (%)
Vacancy status - Other vacant (%)
Residents with income below the poverty level (%)
Residents with income below 50% of the poverty level (%)
Children below poverty level (%)
Poor families by family type - Married-couple family (%)
Poor families by family type - Male, no wife present (%)
Poor families by family type - Female, no husband present (%)
Poverty status for native-born residents (%)
Poverty status for foreign-born residents (%)
Poverty among high school graduates not in families (%)
Poverty among people who did not graduate high school not in families (%)
Residents with income below the poverty level (%) - White
Residents with income below the poverty level (%) - Black or African American
Residents with income below the poverty level (%) - Asian
Residents with income below the poverty level (%) - Hispanic or Latino
Residents with income below the poverty level (%) - American Indian and Alaska Native
Residents with income below the poverty level (%) - Multirace
Residents with income below the poverty level (%) - Other Race
Air pollution - Air Quality Index (AQI)
Air pollution - CO
Air pollution - NO2
Air pollution - SO2
Air pollution - Ozone
Air pollution - PM10
Air pollution - PM25
Air pollution - Pb
Crime - Murders per 100,000 population
Crime - Rapes per 100,000 population
Crime - Robberies per 100,000 population
Crime - Assaults per 100,000 population
Crime - Burglaries per 100,000 population
Crime - Thefts per 100,000 population
Crime - Auto thefts per 100,000 population
Crime - Arson per 100,000 population
Crime - City-data.com crime index
Crime - Violent crime index
Crime - Property crime index
Crime - Murders per 100,000 population (5 year average)
Crime - Rapes per 100,000 population (5 year average)
Crime - Robberies per 100,000 population (5 year average)
Crime - Assaults per 100,000 population (5 year average)
Crime - Burglaries per 100,000 population (5 year average)
Crime - Thefts per 100,000 population (5 year average)
Crime - Auto thefts per 100,000 population (5 year average)
Crime - Arson per 100,000 population (5 year average)
Crime - City-data.com crime index (5 year average)
Crime - Violent crime index (5 year average)
Crime - Property crime index (5 year average)
1996 Presidential Elections Results (%) - Democratic Party (Clinton)
1996 Presidential Elections Results (%) - Republican Party (Dole)
1996 Presidential Elections Results (%) - Other
2000 Presidential Elections Results (%) - Democratic Party (Gore)
2000 Presidential Elections Results (%) - Republican Party (Bush)
2000 Presidential Elections Results (%) - Other
2004 Presidential Elections Results (%) - Democratic Party (Kerry)
2004 Presidential Elections Results (%) - Republican Party (Bush)
2004 Presidential Elections Results (%) - Other
2008 Presidential Elections Results (%) - Democratic Party (Obama)
2008 Presidential Elections Results (%) - Republican Party (McCain)
2008 Presidential Elections Results (%) - Other
2012 Presidential Elections Results (%) - Democratic Party (Obama)
2012 Presidential Elections Results (%) - Republican Party (Romney)
2012 Presidential Elections Results (%) - Other
2016 Presidential Elections Results (%) - Democratic Party (Clinton)
2016 Presidential Elections Results (%) - Republican Party (Trump)
2016 Presidential Elections Results (%) - Other
2020 Presidential Elections Results (%) - Democratic Party (Biden)
2020 Presidential Elections Results (%) - Republican Party (Trump)
2020 Presidential Elections Results (%) - Other
Ancestries Reported - Arab (%)
Ancestries Reported - Czech (%)
Ancestries Reported - Danish (%)
Ancestries Reported - Dutch (%)
Ancestries Reported - English (%)
Ancestries Reported - French (%)
Ancestries Reported - French Canadian (%)
Ancestries Reported - German (%)
Ancestries Reported - Greek (%)
Ancestries Reported - Hungarian (%)
Ancestries Reported - Irish (%)
Ancestries Reported - Italian (%)
Ancestries Reported - Lithuanian (%)
Ancestries Reported - Norwegian (%)
Ancestries Reported - Polish (%)
Ancestries Reported - Portuguese (%)
Ancestries Reported - Russian (%)
Ancestries Reported - Scotch-Irish (%)
Ancestries Reported - Scottish (%)
Ancestries Reported - Slovak (%)
Ancestries Reported - Subsaharan African (%)
Ancestries Reported - Swedish (%)
Ancestries Reported - Swiss (%)
Ancestries Reported - Ukrainian (%)
Ancestries Reported - United States (%)
Ancestries Reported - Welsh (%)
Ancestries Reported - West Indian (%)
Ancestries Reported - Other (%)
Educational Attainment - No schooling completed (%)
Educational Attainment - Less than high school (%)
Educational Attainment - High school or equivalent (%)
Educational Attainment - Less than 1 year of college (%)
Educational Attainment - 1 or more years of college (%)
Educational Attainment - Associate degree (%)
Educational Attainment - Bachelor's degree (%)
Educational Attainment - Master's degree (%)
Educational Attainment - Professional school degree (%)
Educational Attainment - Doctorate degree (%)
School Enrollment - Nursery, preschool (%)
School Enrollment - Kindergarten (%)
School Enrollment - Grade 1 to 4 (%)
School Enrollment - Grade 5 to 8 (%)
School Enrollment - Grade 9 to 12 (%)
School Enrollment - College undergrad (%)
School Enrollment - Graduate or professional (%)
School Enrollment - Not enrolled in school (%)
School enrollment - Public schools (%)
School enrollment - Private schools (%)
School enrollment - Not enrolled (%)
Median number of rooms in houses and condos
Median number of rooms in apartments
Housing units lacking complete plumbing facilities (%)
Housing units lacking complete kitchen facilities (%)
Density of houses
Urban houses (%)
Rural houses (%)
Households with people 60 years and over (%)
Households with people 65 years and over (%)
Households with people 75 years and over (%)
Households with one or more nonrelatives (%)
Households with no nonrelatives (%)
Population in households (%)
Family households (%)
Nonfamily households (%)
Population in families (%)
Family households with own children (%)
Median number of bedrooms in owner occupied houses
Mean number of bedrooms in owner occupied houses
Median number of bedrooms in renter occupied houses
Mean number of bedrooms in renter occupied houses
Median number of vehichles in owner occupied houses
Mean number of vehichles in owner occupied houses
Median number of vehichles in renter occupied houses
Mean number of vehichles in renter occupied houses
Mortgage status - with mortgage (%)
Mortgage status - with second mortgage (%)
Mortgage status - with home equity loan (%)
Mortgage status - with both second mortgage and home equity loan (%)
Mortgage status - without a mortgage (%)
Average family size
Average family size - White
Average family size - Black or African American
Average family size - Asian
Average family size - Hispanic or Latino
Average family size - American Indian and Alaska Native
Average family size - Multirace
Average family size - Other Race
Geographical mobility - Same house 1 year ago (%)
Geographical mobility - Moved within same county (%)
Geographical mobility - Moved from different county within same state (%)
Geographical mobility - Moved from different state (%)
Geographical mobility - Moved from abroad (%)
Place of birth - Born in state of residence (%)
Place of birth - Born in other state (%)
Place of birth - Native, outside of US (%)
Place of birth - Foreign born (%)
Housing units in structures - 1, detached (%)
Housing units in structures - 1, attached (%)
Housing units in structures - 2 (%)
Housing units in structures - 3 or 4 (%)
Housing units in structures - 5 to 9 (%)
Housing units in structures - 10 to 19 (%)
Housing units in structures - 20 to 49 (%)
Housing units in structures - 50 or more (%)
Housing units in structures - Mobile home (%)
Housing units in structures - Boat, RV, van, etc. (%)
House/condo owner moved in on average (years ago)
Renter moved in on average (years ago)
Year householder moved into unit - Moved in 1999 to March 2000 (%)
Year householder moved into unit - Moved in 1995 to 1998 (%)
Year householder moved into unit - Moved in 1990 to 1994 (%)
Year householder moved into unit - Moved in 1980 to 1989 (%)
Year householder moved into unit - Moved in 1970 to 1979 (%)
Year householder moved into unit - Moved in 1969 or earlier (%)
Means of transportation to work - Drove car alone (%)
Means of transportation to work - Carpooled (%)
Means of transportation to work - Public transportation (%)
Means of transportation to work - Bus or trolley bus (%)
Means of transportation to work - Streetcar or trolley car (%)
Means of transportation to work - Subway or elevated (%)
Means of transportation to work - Railroad (%)
Means of transportation to work - Ferryboat (%)
Means of transportation to work - Taxicab (%)
Means of transportation to work - Motorcycle (%)
Means of transportation to work - Bicycle (%)
Means of transportation to work - Walked (%)
Means of transportation to work - Other means (%)
Working at home (%)
Industry diversity
Most Common Industries - Agriculture, forestry, fishing and hunting, and mining (%)
Most Common Industries - Agriculture, forestry, fishing and hunting (%)
Most Common Industries - Mining, quarrying, and oil and gas extraction (%)
Most Common Industries - Construction (%)
Most Common Industries - Manufacturing (%)
Most Common Industries - Wholesale trade (%)
Most Common Industries - Retail trade (%)
Most Common Industries - Transportation and warehousing, and utilities (%)
Most Common Industries - Transportation and warehousing (%)
Most Common Industries - Utilities (%)
Most Common Industries - Information (%)
Most Common Industries - Finance and insurance, and real estate and rental and leasing (%)
Most Common Industries - Finance and insurance (%)
Most Common Industries - Real estate and rental and leasing (%)
Most Common Industries - Professional, scientific, and management, and administrative and waste management services (%)
Most Common Industries - Professional, scientific, and technical services (%)
Most Common Industries - Management of companies and enterprises (%)
Most Common Industries - Administrative and support and waste management services (%)
Most Common Industries - Educational services, and health care and social assistance (%)
Most Common Industries - Educational services (%)
Most Common Industries - Health care and social assistance (%)
Most Common Industries - Arts, entertainment, and recreation, and accommodation and food services (%)
Most Common Industries - Arts, entertainment, and recreation (%)
Most Common Industries - Accommodation and food services (%)
Most Common Industries - Other services, except public administration (%)
Most Common Industries - Public administration (%)
Occupation diversity
Most Common Occupations - Management, business, science, and arts occupations (%)
Most Common Occupations - Management, business, and financial occupations (%)
Most Common Occupations - Management occupations (%)
Most Common Occupations - Business and financial operations occupations (%)
Most Common Occupations - Computer, engineering, and science occupations (%)
Most Common Occupations - Computer and mathematical occupations (%)
Most Common Occupations - Architecture and engineering occupations (%)
Most Common Occupations - Life, physical, and social science occupations (%)
Most Common Occupations - Education, legal, community service, arts, and media occupations (%)
Most Common Occupations - Community and social service occupations (%)
Most Common Occupations - Legal occupations (%)
Most Common Occupations - Education, training, and library occupations (%)
Most Common Occupations - Arts, design, entertainment, sports, and media occupations (%)
Most Common Occupations - Healthcare practitioners and technical occupations (%)
Most Common Occupations - Health diagnosing and treating practitioners and other technical occupations (%)
Most Common Occupations - Health technologists and technicians (%)
Most Common Occupations - Service occupations (%)
Most Common Occupations - Healthcare support occupations (%)
Most Common Occupations - Protective service occupations (%)
Most Common Occupations - Fire fighting and prevention, and other protective service workers including supervisors (%)
Most Common Occupations - Law enforcement workers including supervisors (%)
Most Common Occupations - Food preparation and serving related occupations (%)
Most Common Occupations - Building and grounds cleaning and maintenance occupations (%)
Most Common Occupations - Personal care and service occupations (%)
Most Common Occupations - Sales and office occupations (%)
Most Common Occupations - Sales and related occupations (%)
Most Common Occupations - Office and administrative support occupations (%)
Most Common Occupations - Natural resources, construction, and maintenance occupations (%)
Most Common Occupations - Farming, fishing, and forestry occupations (%)
Most Common Occupations - Construction and extraction occupations (%)
Most Common Occupations - Installation, maintenance, and repair occupations (%)
Most Common Occupations - Production, transportation, and material moving occupations (%)
Most Common Occupations - Production occupations (%)
Most Common Occupations - Transportation occupations (%)
Most Common Occupations - Material moving occupations (%)
People in Group quarters - Institutionalized population (%)
People in Group quarters - Correctional institutions (%)
People in Group quarters - Federal prisons and detention centers (%)
People in Group quarters - Halfway houses (%)
People in Group quarters - Local jails and other confinement facilities (including police lockups) (%)
People in Group quarters - Military disciplinary barracks (%)
People in Group quarters - State prisons (%)
People in Group quarters - Other types of correctional institutions (%)
People in Group quarters - Nursing homes (%)
People in Group quarters - Hospitals/wards, hospices, and schools for the handicapped (%)
People in Group quarters - Hospitals/wards and hospices for chronically ill (%)
People in Group quarters - Hospices or homes for chronically ill (%)
People in Group quarters - Military hospitals or wards for chronically ill (%)
People in Group quarters - Other hospitals or wards for chronically ill (%)
People in Group quarters - Hospitals or wards for drug/alcohol abuse (%)
People in Group quarters - Mental (Psychiatric) hospitals or wards (%)
People in Group quarters - Schools, hospitals, or wards for the mentally retarded (%)
People in Group quarters - Schools, hospitals, or wards for the physically handicapped (%)
People in Group quarters - Institutions for the deaf (%)
People in Group quarters - Institutions for the blind (%)
People in Group quarters - Orthopedic wards and institutions for the physically handicapped (%)
People in Group quarters - Wards in general hospitals for patients who have no usual home elsewhere (%)
People in Group quarters - Wards in military hospitals for patients who have no usual home elsewhere (%)
People in Group quarters - Juvenile institutions (%)
People in Group quarters - Long-term care (%)
People in Group quarters - Homes for abused, dependent, and neglected children (%)
People in Group quarters - Residential treatment centers for emotionally disturbed children (%)
People in Group quarters - Training schools for juvenile delinquents (%)
People in Group quarters - Short-term care, detention or diagnostic centers for delinquent children (%)
People in Group quarters - Type of juvenile institution unknown (%)
People in Group quarters - Noninstitutionalized population (%)
People in Group quarters - College dormitories (includes college quarters off campus) (%)
People in Group quarters - Military quarters (%)
People in Group quarters - On base (%)
People in Group quarters - Barracks, unaccompanied personnel housing (UPH), (Enlisted/Officer), ;and similar group living quarters for military personnel (%)
People in Group quarters - Transient quarters for temporary residents (%)
People in Group quarters - Military ships (%)
People in Group quarters - Group homes (%)
People in Group quarters - Homes or halfway houses for drug/alcohol abuse (%)
People in Group quarters - Homes for the mentally ill (%)
People in Group quarters - Homes for the mentally retarded (%)
People in Group quarters - Homes for the physically handicapped (%)
People in Group quarters - Other group homes (%)
People in Group quarters - Religious group quarters (%)
People in Group quarters - Dormitories (%)
People in Group quarters - Agriculture workers' dormitories on farms (%)
People in Group quarters - Job Corps and vocational training facilities (%)
People in Group quarters - Other workers' dormitories (%)
People in Group quarters - Crews of maritime vessels (%)
People in Group quarters - Other nonhousehold living situations (%)
People in Group quarters - Other noninstitutional group quarters (%)
Residents speaking English at home (%)
Residents speaking English at home - Born in the United States (%)
Residents speaking English at home - Native, born elsewhere (%)
Residents speaking English at home - Foreign born (%)
Residents speaking Spanish at home (%)
Residents speaking Spanish at home - Born in the United States (%)
Residents speaking Spanish at home - Native, born elsewhere (%)
Residents speaking Spanish at home - Foreign born (%)
Residents speaking other language at home (%)
Residents speaking other language at home - Born in the United States (%)
Residents speaking other language at home - Native, born elsewhere (%)
Residents speaking other language at home - Foreign born (%)
Class of Workers - Employee of private company (%)
Class of Workers - Self-employed in own incorporated business (%)
Class of Workers - Private not-for-profit wage and salary workers (%)
Class of Workers - Local government workers (%)
Class of Workers - State government workers (%)
Class of Workers - Federal government workers (%)
Class of Workers - Self-employed workers in own not incorporated business and Unpaid family workers (%)
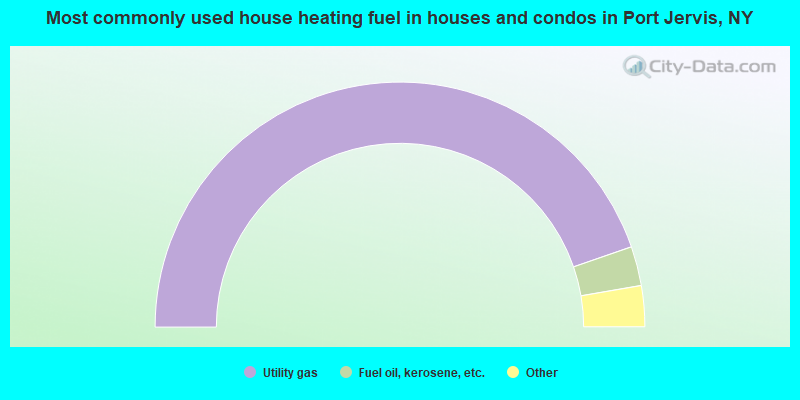
House heating fuel used in houses and condos - Utility gas (%)
House heating fuel used in houses and condos - Bottled, tank, or LP gas (%)
House heating fuel used in houses and condos - Electricity (%)
House heating fuel used in houses and condos - Fuel oil, kerosene, etc. (%)
House heating fuel used in houses and condos - Coal or coke (%)
House heating fuel used in houses and condos - Wood (%)
House heating fuel used in houses and condos - Solar energy (%)
House heating fuel used in houses and condos - Other fuel (%)
House heating fuel used in houses and condos - No fuel used (%)
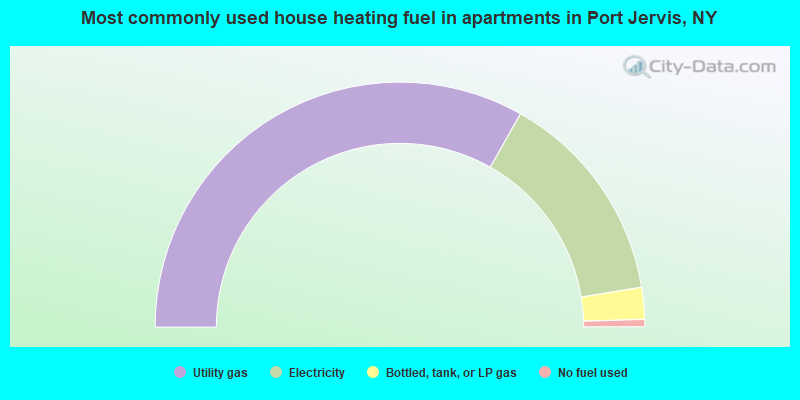
House heating fuel used in apartments - Utility gas (%)
House heating fuel used in apartments - Bottled, tank, or LP gas (%)
House heating fuel used in apartments - Electricity (%)
House heating fuel used in apartments - Fuel oil, kerosene, etc. (%)
House heating fuel used in apartments - Coal or coke (%)
House heating fuel used in apartments - Wood (%)
House heating fuel used in apartments - Solar energy (%)
House heating fuel used in apartments - Other fuel (%)
House heating fuel used in apartments - No fuel used (%)
Armed forces status - In Armed Forces (%)
Armed forces status - Civilian (%)
Armed forces status - Civilian - Veteran (%)
Armed forces status - Civilian - Nonveteran (%)
Fatal accidents locations in years 2005-2021
Fatal accidents locations in 2005
Fatal accidents locations in 2006
Fatal accidents locations in 2007
Fatal accidents locations in 2008
Fatal accidents locations in 2009
Fatal accidents locations in 2010
Fatal accidents locations in 2011
Fatal accidents locations in 2012
Fatal accidents locations in 2013
Fatal accidents locations in 2014
Fatal accidents locations in 2015
Fatal accidents locations in 2016
Fatal accidents locations in 2017
Fatal accidents locations in 2018
Fatal accidents locations in 2019
Fatal accidents locations in 2020
Fatal accidents locations in 2021
Alcohol use - People drinking some alcohol every month (%)
Alcohol use - People not drinking at all (%)
Alcohol use - Average days/month drinking alcohol
Alcohol use - Average drinks/week
Alcohol use - Average days/year people drink much
Audiometry - Average condition of hearing (%)
Audiometry - People that can hear a whisper from across a quiet room (%)
Audiometry - People that can hear normal voice from across a quiet room (%)
Audiometry - Ears ringing, roaring, buzzing (%)
Audiometry - Had a job exposure to loud noise (%)
Audiometry - Had off-work exposure to loud noise (%)
Blood Pressure & Cholesterol - Has high blood pressure (%)
Blood Pressure & Cholesterol - Checking blood pressure at home (%)
Blood Pressure & Cholesterol - Frequently checking blood cholesterol (%)
Blood Pressure & Cholesterol - Has high cholesterol level (%)
Consumer Behavior - Money monthly spent on food at supermarket/grocery store
Consumer Behavior - Money monthly spent on food at other stores
Consumer Behavior - Money monthly spent on eating out
Consumer Behavior - Money monthly spent on carryout/delivered foods
Consumer Behavior - Income spent on food at supermarket/grocery store (%)
Consumer Behavior - Income spent on food at other stores (%)
Consumer Behavior - Income spent on eating out (%)
Consumer Behavior - Income spent on carryout/delivered foods (%)
Current Health Status - General health condition (%)
Current Health Status - Blood donors (%)
Current Health Status - Has blood ever tested for HIV virus (%)
Current Health Status - Left-handed people (%)
Dermatology - People using sunscreen (%)
Diabetes - Diabetics (%)
Diabetes - Had a blood test for high blood sugar (%)
Diabetes - People taking insulin (%)
Diet Behavior & Nutrition - Diet health (%)
Diet Behavior & Nutrition - Milk product consumption (# of products/month)
Diet Behavior & Nutrition - Meals not home prepared (#/week)
Diet Behavior & Nutrition - Meals from fast food or pizza place (#/week)
Diet Behavior & Nutrition - Ready-to-eat foods (#/month)
Diet Behavior & Nutrition - Frozen meals/pizza (#/month)
Drug Use - People that ever used marijuana or hashish (%)
Drug Use - Ever used hard drugs (%)
Drug Use - Ever used any form of cocaine (%)
Drug Use - Ever used heroin (%)
Drug Use - Ever used methamphetamine (%)
Health Insurance - People covered by health insurance (%)
Kidney Conditions-Urology - Avg. # of times urinating at night
Medical Conditions - People with asthma (%)
Medical Conditions - People with anemia (%)
Medical Conditions - People with psoriasis (%)
Medical Conditions - People with overweight (%)
Medical Conditions - Elderly people having difficulties in thinking or remembering (%)
Medical Conditions - People who ever received blood transfusion (%)
Medical Conditions - People having trouble seeing even with glass/contacts (%)
Medical Conditions - People with arthritis (%)
Medical Conditions - People with gout (%)
Medical Conditions - People with congestive heart failure (%)
Medical Conditions - People with coronary heart disease (%)
Medical Conditions - People with angina pectoris (%)
Medical Conditions - People who ever had heart attack (%)
Medical Conditions - People who ever had stroke (%)
Medical Conditions - People with emphysema (%)
Medical Conditions - People with thyroid problem (%)
Medical Conditions - People with chronic bronchitis (%)
Medical Conditions - People with any liver condition (%)
Medical Conditions - People who ever had cancer or malignancy (%)
Mental Health - People who have little interest in doing things (%)
Mental Health - People feeling down, depressed, or hopeless (%)
Mental Health - People who have trouble sleeping or sleeping too much (%)
Mental Health - People feeling tired or having little energy (%)
Mental Health - People with poor appetite or overeating (%)
Mental Health - People feeling bad about themself (%)
Mental Health - People who have trouble concentrating on things (%)
Mental Health - People moving or speaking slowly or too fast (%)
Mental Health - People having thoughts they would be better off dead (%)
Oral Health - Average years since last visit a dentist
Oral Health - People embarrassed because of mouth (%)
Oral Health - People with gum disease (%)
Oral Health - General health of teeth and gums (%)
Oral Health - Average days a week using dental floss/device
Oral Health - Average days a week using mouthwash for dental problem
Oral Health - Average number of teeth
Pesticide Use - Households using pesticides to control insects (%)
Pesticide Use - Households using pesticides to kill weeds (%)
Physical Activity - People doing vigorous-intensity work activities (%)
Physical Activity - People doing moderate-intensity work activities (%)
Physical Activity - People walking or bicycling (%)
Physical Activity - People doing vigorous-intensity recreational activities (%)
Physical Activity - People doing moderate-intensity recreational activities (%)
Physical Activity - Average hours a day doing sedentary activities
Physical Activity - Average hours a day watching TV or videos
Physical Activity - Average hours a day using computer
Physical Functioning - People having limitations keeping them from working (%)
Physical Functioning - People limited in amount of work they can do (%)
Physical Functioning - People that need special equipment to walk (%)
Physical Functioning - People experiencing confusion/memory problems (%)
Physical Functioning - People requiring special healthcare equipment (%)
Prescription Medications - Average number of prescription medicines taking
Preventive Aspirin Use - Adults 40+ taking low-dose aspirin (%)
Reproductive Health - Vaginal deliveries (%)
Reproductive Health - Cesarean deliveries (%)
Reproductive Health - Deliveries resulted in a live birth (%)
Reproductive Health - Pregnancies resulted in a delivery (%)
Reproductive Health - Women breastfeeding newborns (%)
Reproductive Health - Women that had a hysterectomy (%)
Reproductive Health - Women that had both ovaries removed (%)
Reproductive Health - Women that have ever taken birth control pills (%)
Reproductive Health - Women taking birth control pills (%)
Reproductive Health - Women that have ever used Depo-Provera or injectables (%)
Reproductive Health - Women that have ever used female hormones (%)
Sexual Behavior - People 18+ that ever had sex (vaginal, anal, or oral) (%)
Sexual Behavior - Males 18+ that ever had vaginal sex with a woman (%)
Sexual Behavior - Males 18+ that ever performed oral sex on a woman (%)
Sexual Behavior - Males 18+ that ever had anal sex with a woman (%)
Sexual Behavior - Males 18+ that ever had any sex with a man (%)
Sexual Behavior - Females 18+ that ever had vaginal sex with a man (%)
Sexual Behavior - Females 18+ that ever performed oral sex on a man (%)
Sexual Behavior - Females 18+ that ever had anal sex with a man (%)
Sexual Behavior - Females 18+ that ever had any kind of sex with a woman (%)
Sexual Behavior - Average age people first had sex
Sexual Behavior - Average number of female sex partners in lifetime (males 18+)
Sexual Behavior - Average number of female vaginal sex partners in lifetime (males 18+)
Sexual Behavior - Average age people first performed oral sex on a woman (18+)
Sexual Behavior - Average number of woman performed oral sex on in lifetime (18+)
Sexual Behavior - Average number of male sex partners in lifetime (males 18+)
Sexual Behavior - Average number of male anal sex partners in lifetime (males 18+)
Sexual Behavior - Average age people first performed oral sex on a man (18+)
Sexual Behavior - Average number of male oral sex partners in lifetime (18+)
Sexual Behavior - People using protection when performing oral sex (%)
Sexual Behavior - Average number of times people have vaginal or anal sex a year
Sexual Behavior - People having sex without condom (%)
Sexual Behavior - Average number of male sex partners in lifetime (females 18+)
Sexual Behavior - Average number of male vaginal sex partners in lifetime (females 18+)
Sexual Behavior - Average number of female sex partners in lifetime (females 18+)
Sexual Behavior - Circumcised males 18+ (%)
Sleep Disorders - Average hours sleeping at night
Sleep Disorders - People that has trouble sleeping (%)
Smoking-Cigarette Use - People smoking cigarettes (%)
Taste & Smell - People 40+ having problems with smell (%)
Taste & Smell - People 40+ having problems with taste (%)
Taste & Smell - People 40+ that ever had wisdom teeth removed (%)
Taste & Smell - People 40+ that ever had tonsils teeth removed (%)
Taste & Smell - People 40+ that ever had a loss of consciousness because of a head injury (%)
Taste & Smell - People 40+ that ever had a broken nose or other serious injury to face or skull (%)
Taste & Smell - People 40+ that ever had two or more sinus infections (%)
Weight - Average height (inches)
Weight - Average weight (pounds)
Weight - Average BMI
Weight - People that are obese (%)
Weight - People that ever were obese (%)
Weight - People trying to lose weight (%)
Officers per 1,000 residents here:
3.57New York average:
3.28
Latest news from Port Jervis, NY collected exclusively by city-data.com from local newspapers, TV, and radio stations
Ancestries: Italian (7.7%), Irish (7.4%), American (5.6%), German (5.1%), British West Indian (4.7%), English (4.2%).
Current Local Time:
Land area: 2.54 square miles.
Population density: 3,401 people per square mile (average).
988 residents are foreign born (5.8% Asia , 4.4% Latin America ).
This city:
11.2%New York:
22.6%
Median real estate property taxes paid for housing units with mortgages in 2022: $4,708 (2.2%)Median real estate property taxes paid for housing units with no mortgage in 2022: $4,261 (2.0%)
Nearest city with pop. 50,000+: Ramapo, NY
Nearest city with pop. 200,000+: Newark, NJ
Nearest city with pop. 1,000,000+: Bronx, NY
Nearest cities:
Latitude: 41.38 N, Longitude: 74.69 W
Daytime population change due to commuting: +49 (+0.6%)Workers who live and work in this city: 1,330 (37.2%)
Port Jervis tourist attractions:
Single-family new house construction building permits:
2022: 1 building , cost: $177,1002021: 2 buildings , average cost: $157,0002020: 2 buildings , average cost: $111,8002018: 1 building , cost: $85,0002017: 1 building , cost: $125,0002016: 1 building , cost: $125,0002012: 1 building , cost: $389,9002010: 1 building , cost: $84,0002009: 4 buildings , average cost: $159,4002008: 6 buildings , average cost: $143,9002007: 12 buildings , average cost: $142,3002006: 10 buildings , average cost: $128,5002005: 14 buildings , average cost: $101,2002004: 8 buildings , average cost: $89,4002003: 8 buildings , average cost: $93,1002002: 1 building , cost: $75,0002001: 5 buildings , average cost: $120,8001999: 1 building , cost: $68,500Unemployment in December 2023:
Most common occupations in Port Jervis, NY (%)
Both Males Females
Other production occupations, including supervisors (6.0%)
Assemblers and fabricators (5.2%)
Building and grounds cleaning and maintenance occupations (4.9%)
Cashiers (4.7%)
Law enforcement workers, including supervisors (3.9%)
Other office and administrative support workers, including supervisors (3.9%)
Laborers and material movers, hand (3.5%)
Other production occupations, including supervisors (7.5%)
Law enforcement workers, including supervisors (6.8%)
Laborers and material movers, hand (5.3%)
Driver/sales workers and truck drivers (5.0%)
Electrical equipment mechanics and other installation, maintenance, and repair workers, including supervisors (4.9%)
Building and grounds cleaning and maintenance occupations (4.8%)
Material recording, scheduling, dispatching, and distributing workers (4.5%)
Assemblers and fabricators (9.4%)
Cashiers (8.5%)
Other office and administrative support workers, including supervisors (6.9%)
Building and grounds cleaning and maintenance occupations (4.9%)
Registered nurses (4.8%)
Nursing, psychiatric, and home health aides (4.6%)
Other production occupations, including supervisors (4.4%)
Air pollution and air quality trends(lower is better)
Pb
Lead (Pb) [µg/m3 ] level in 2008 was 0.0180. This is significantly worse than average. Closest monitor was 17.7 miles away from the city center.
Tornado activity:
Port Jervis-area historical tornado activity is above New York state average. It is 36% smaller than the overall U.S. average.
On 7/14/1988, a category F3 (max. wind speeds 158-206 mph) tornado 8.8 miles away from the Port Jervis city center injured one person and caused between $500,000 and $5,000,000 in damages.
On 5/31/1998, a category F3 tornado 13.8 miles away from the city center injured 2 people and caused $1 million in damages.
Earthquake activity:
Port Jervis-area historical earthquake activity is significantly above New York state average. It is 67% smaller than the overall U.S. average. On 10/7/1983 at 10:18:46, a magnitude 5.3 (5.1 MB, 5.3 LG, 5.1 ML, Class: Moderate, Intensity: VI - VII) earthquake occurred 179.2 miles away from Port Jervis center On 8/23/2011 at 17:51:04, a magnitude 5.8 (5.8 MW, Depth: 3.7 mi) earthquake occurred 295.6 miles away from the city center On 4/20/2002 at 10:50:47, a magnitude 5.3 (5.3 ML, Depth: 3.0 mi) earthquake occurred 222.7 miles away from the city center On 4/20/2002 at 10:50:47, a magnitude 5.2 (5.2 MB, 4.2 MS, 5.2 MW, 5.0 MW) earthquake occurred 220.8 miles away from Port Jervis center On 1/16/1994 at 01:49:16, a magnitude 4.6 (4.6 MB, 4.6 LG, Depth: 3.1 mi, Class: Light, Intensity: IV - V) earthquake occurred 101.0 miles away from the city center On 1/16/1994 at 00:42:43, a magnitude 4.2 (4.2 MB, 4.0 LG, Depth: 3.1 mi) earthquake occurred 100.1 miles away from Port Jervis center Magnitude types: regional Lg-wave magnitude (LG), body-wave magnitude (MB), local magnitude (ML), surface-wave magnitude (MS), moment magnitude (MW) Natural disasters: The number of natural disasters in Orange County (28) is a lot greater than the US average (15).Major Disasters (Presidential) Declared: 18Emergencies Declared: 9Floods: 8, Storms: 8, Hurricanes: 7, Blizzards: 2, Snowstorms: 2, Tropical Storms: 2, Fire: 1, Power Outage: 1, Tropical Depression: 1, Water Shortage: 1, Other: 3 (Note: some incidents may be assigned to more than one category). Hospitals and medical centers in Port Jervis: BON SECOURS COMMUNITY HOSPITAL (Voluntary non-profit - Church, provides emergency services, 160 EAST MAIN STREET) Other hospitals and medical centers near Port Jervis: BELLE REVE HEALTH CARE CENTER (Nursing Home, about 7 miles away; MILFORD, PA)
HEAD INJURY RECOVERY CTR AT HILLCREST (Nursing Home, about 7 miles away; MILFORD, PA)
ALL ASPECTS HOME HEALTH AGENCY, LLC (Home Health Center, about 8 miles away; MILFORD, PA)
SAINT CLARE'S HOSPITAL/SUSSEX (Hospital, about 13 miles away; SUSSEX, NJ)
MIDDLETOWN PSYCHIATRIC CENTER (Hospital, about 15 miles away; MIDDLETOWN, NY)
ST TERESA'S NURSING AND REHABILITATION CENTER (Nursing Home, about 16 miles away; MIDDLETOWN, NY)
HORTON MEMORIAL HOSPITAL (Hospital, about 16 miles away; MIDDLETOWN, NY)
Colleges/universities with over 2000 students nearest to Port Jervis:
Orange County Community College (about 15 miles; Middletown, NY ; Full-time enrollment: 4,742)
Sussex County Community College (about 22 miles; Newton, NJ ; FT enrollment: 2,402)
Rockland Community College (about 36 miles; Suffern, NY ; FT enrollment: 6,026)
Mount Saint Mary College (about 37 miles; Newburgh, NY ; FT enrollment: 2,166)
East Stroudsburg University of Pennsylvania (about 37 miles; East Stroudsburg, PA ; FT enrollment: 6,195)
County College of Morris (about 37 miles; Randolph, NJ ; FT enrollment: 6,427)
Centenary College (about 38 miles; Hackettstown, NJ ; FT enrollment: 2,271)
Public high school in Port Jervis:
Public elementary/middle schools in Port Jervis:
See full list of schools located in Port Jervis Library in Port Jervis: PORT JERVIS FREE LIBRARY Operating income: $769,303; Location: 138 PIKE STREET; 43,960 books ; 1,904 e-books ; 2,605 audio materials ; 2,764 video materials ; 14 state licensed databases ; 6 other licensed databases ; 110 print serial subscriptions )
Notable locations in Port Jervis: (A) , Laurel Grove Greenhouse (B) , Port Jervis Fire Department Excelsior Engine 5 (C) , Port Jervis Fire Department Tri - State Hose Company 6 (D) , Erie Depot Museum (E) , Port Jervis Fireman Museum (F) , Port Jervis Free Library (G) , Orange County Youth Community Center (H) , Port Jervis Fire Department Municipal Training Facility (I) , Port Jervis Fire Engine Company 1 (J) , Port Jervis Fire Department Delaware Engine 2 (K) , Port Jervis Fire Department Howard Wheat Engine 4 (L) . Display/hide their locations on the map
Churches in Port Jervis include: (A) , Port Jervis Bible Baptist Church (B) , Light of the World Christian Church (C) , Grace Fellowship Church (D) , Church of Most Sacred Heart (E) , West End Reformed Church (F) , Wickham Chapel (G) , Grace Episcopal Church (H) , First Baptist Church (I) . Display/hide their locations on the map
Cemeteries: (1) , Agudath Achim Cemetery (2) , Laurel Grove Cemetery (3) . Display/hide their locations on the map
Parks in Port Jervis include: (1) , Bell Memorial Field (2) , West End Memorial Park (3) , Church Street Park (4) , Riverside Park (5) , Orange Square (6) , Elks Memorial Park (7) . Display/hide their locations on the map
Beach: (A) . Display/hide its location on the map
Tourist attraction:
Hotels:
Birthplace of: Bucky Harris - Baseball player, George McVey - Baseball player, Hudson Van Etten - Navy Medal of Honor recipient, Jim Connor - Baseball player, Mike Goodfellow - Baseball player.
Orange County has a predicted average indoor radon screening level greater than 4 pCi/L (pico curies per liter) - Highest Potential Drinking water stations with addresses in Port Jervis and their reported violations in the past:
PORT JERVIS ELKS LODGE #645 (Population served: 270, Groundwater):
Past monitoring violations:
2 routine major monitoring violations
Population served: 200, Groundwater):
Past health violations:
Treatment Technique (SWTR and GWR) - In APR-2013, Contaminant: GROUNDWATER RULE. Follow-up actions: St Public Notif requested (MAY-06-2013), St Formal NOV issued (MAY-06-2013), St Compliance achieved (AUG-07-2013)
Past monitoring violations:
8 routine major monitoring violations
3 regular monitoring violations
Address: 2247 GREENVILLE TURNPIKE Population served: 200, Groundwater):
Past monitoring violations:
3 routine major monitoring violations
One regular monitoring violation
Address: 1316 US HIGHWAY 6 Population served: 100, Groundwater):
Past monitoring violations:
10 routine major monitoring violations
Address: 107 ROUTE 209 Population served: 84, Groundwater):
Past monitoring violations:
3 routine major monitoring violations
Address: 104 US ROUTE 6 Population served: 80, Groundwater):
Past monitoring violations:
14 routine major monitoring violations
4 regular monitoring violations
Address: 194 ROUTE 209 Population served: 30, Groundwater):
Past monitoring violations:
6 routine major monitoring violations
2 regular monitoring violations
Average household size: This city:
2.5 peopleNew York:
2.6 people
Percentage of family households: This city:
58.3%Whole state:
63.5%
Percentage of households with unmarried partners: This city:
12.5%Whole state:
6.8%
Likely homosexual households (counted as self-reported same-sex unmarried-partner households)
Lesbian couples: 0.4% of all households Gay men: 0.3% of all households
People in group quarters in Port Jervis in 2010:
39 people in nursing facilities/skilled-nursing facilities
31 people in other noninstitutional facilities
16 people in group homes intended for adults
people in mental (psychiatric) hospitals or wards in 2000people in homes for the mentally retarded in 2000Banks with branches in Port Jervis (2011 data):
TD Bank, National Association: Port Jervis Branch at 205 East Main Street, branch established on 1973/06/23. Info updated 2010/10/04: Bank assets: $188,912.6 mil, Deposits: $153,149.8 mil, headquarters in Wilmington, DE, positive income , 1314 total offices , Holding Company: Toronto-Dominion Bank, The
JPMorgan Chase Bank, National Association: Port Jervis Branch at Sussex And Ball Streets, branch established on 1956/12/10. Info updated 2011/11/10: Bank assets: $1,811,678.0 mil, Deposits: $1,190,738.0 mil, headquarters in Columbus, OH, positive income , International Specialization, 5577 total offices , Holding Company: Jpmorgan Chase & Co.
Manufacturers and Traders Trust Company: Port Jervis Branch at 13-15 Sussex Street, branch established on 1978/12/02. Info updated 2011/08/08: Bank assets: $76,887.1 mil, Deposits: $60,064.2 mil, headquarters in Buffalo, NY, positive income , Commercial Lending Specialization, 808 total offices , Holding Company: M&T Bank Corporation
RBS Citizens, National Association: Port Jervis Branch at 5 South Broome Street, branch established on 1982/06/19. Info updated 2007/09/19: Bank assets: $106,940.6 mil, Deposits: $75,690.2 mil, headquarters in Providence, RI, positive income , 1135 total offices , Holding Company: Uk Financial Investments Limited
SussexBank: Port Jervis Branch at 20-22 Fowler Street, branch established on 2001/03/18. Info updated 2010/12/17: Bank assets: $504.9 mil, Deposits: $426.1 mil, headquarters in Franklin, NJ, positive income , Commercial Lending Specialization, 10 total offices , Holding Company: Sussex Bancorp
Bank of America, National Association: Port Jervis Branch at 13-17 Hammond Street, branch established on 1916/01/01. Info updated 2009/11/18: Bank assets: $1,451,969.3 mil, Deposits: $1,077,176.8 mil, headquarters in Charlotte, NC, positive income , 5782 total offices , Holding Company: Bank Of America Corporation
For population 15 years and over in Port Jervis:
Never married: 39.1%Now married: 37.3%Separated: 1.9%Widowed: 9.8%Divorced: 11.9% For population 25 years and over in Port Jervis:
High school or higher: 85.7%Bachelor's degree or higher: 14.8%Graduate or professional degree: 7.1%Unemployed: 8.4%Mean travel time to work (commute): 21.9 minutes
Education Gini index (Inequality in education) Here:
11.6New York average:
13.9
Religion statistics for Port Jervis, NY (based on Orange County data)
Religion Adherents Congregations Catholic 131,308 45 Other 30,221 42 Mainline Protestant 19,326 88 Evangelical Protestant 14,437 95 Black Protestant 1,711 9 Orthodox 973 6 None 174,837 -
Source: Clifford Grammich, Kirk Hadaway, Richard Houseal, Dale E.Jones, Alexei Krindatch, Richie Stanley and Richard H.Taylor. 2012. 2010 U.S.Religion Census: Religious Congregations & Membership Study. Association of Statisticians of American Religious Bodies. Jones, Dale E., et al. 2002. Congregations and Membership in the United States 2000. Nashville, TN: Glenmary Research Center. Graphs represent county-level data
Food Environment Statistics: Number of grocery stores : 113Orange County :
3.00 / 10,000 pop.New York :
4.13 / 10,000 pop.
Number of supercenters and club stores : 4Orange County :
0.11 / 10,000 pop.New York :
0.06 / 10,000 pop.
Number of convenience stores (no gas) : 46Here :
1.22 / 10,000 pop.New York :
0.92 / 10,000 pop.
Number of convenience stores (with gas) : 94This county :
2.50 / 10,000 pop.State :
1.68 / 10,000 pop.
Number of full-service restaurants : 314Here :
8.34 / 10,000 pop.New York :
8.82 / 10,000 pop.
Adult diabetes rate : Orange County :
8.6%State :
8.2%
Adult obesity rate : Orange County :
25.9%State :
23.8%
Low-income preschool obesity rate : Health and Nutrition: Healthy diet rate : This city:
50.7%New York:
50.1%
Average overall health of teeth and gums : This city:
48.0%New York:
48.1%
Average BMI : Port Jervis:
28.4New York:
28.5
People feeling badly about themselves : People not drinking alcohol at all : Port Jervis:
10.2%New York:
11.1%
Average hours sleeping at night : Port Jervis:
6.9New York:
6.8
Overweight people : Port Jervis:
33.3%New York:
33.4%
General health condition : This city:
57.1%New York:
56.5%
Average condition of hearing : Port Jervis:
78.6%New York:
80.2%
More about Health and Nutrition of Port Jervis, NY Residents
Local government employment and payroll (March 2022)
Function
Full-time employees
Monthly full-time payroll
Average yearly full-time wage
Part-time employees
Monthly part-time payroll
Police Protection - Officers
32 $294,239 $110,340 6 $13,250 Water Supply
9 $53,258 $71,011 0 $0 Other and Unallocable
8 $41,877 $62,816 1 $844 Solid Waste Management
8 $40,163 $60,245 0 $0 Financial Administration
8 $42,554 $63,831 0 $0 Streets and Highways
7 $39,507 $67,726 0 $0 Sewerage
6 $34,693 $69,386 0 $0 Parks and Recreation
3 $19,977 $79,908 4 $3,884 Police - Other
1 $4,535 $54,420 10 $11,567 Other Government Administration
0 $0 11 $7,882 Transit
0 $0 5 $6,572
Totals for Government
82 $570,803 $83,532 37 $44,000
Port Jervis government finances - Expenditure in 2021 (per resident):
Assistance and Subsidies - Public Welfare, Cash Assistance Programs - Other: $1,624,000 ($188.29)
Construction - Regular Highways: $2,853,000 ($330.78)
Sewerage: $949,000 ($110.03)Police Protection: $301,000 ($34.90)Parks and Recreation: $63,000 ($7.30)Local Fire Protection: $50,000 ($5.80)Water Utilities: $35,000 ($4.06)General - Other: $31,000 ($3.59)Current Operations - General - Other: $4,710,000 ($546.09)
Police Protection: $4,191,000 ($485.91)Water Utilities: $1,732,000 ($200.81)Solid Waste Management: $692,000 ($80.23)Sewerage: $645,000 ($74.78)Regular Highways: $615,000 ($71.30)Financial Administration: $410,000 ($47.54)General Public Buildings: $387,000 ($44.87)Parks and Recreation: $338,000 ($39.19)Local Fire Protection: $310,000 ($35.94)Housing and Community Development: $287,000 ($33.28)Protective Inspection and Regulation - Other: $271,000 ($31.42)Central Staff Services: $246,000 ($28.52)Corrections - Other: $107,000 ($12.41)Transit Utilities: $75,000 ($8.70)Judicial and Legal Services: $52,000 ($6.03)Health - Other: $26,000 ($3.01)Parking Facilities: $4,000 ($0.46)General - Interest on Debt: $905,000 ($104.93)
Intergovernmental to Local - Other - Financial Administration: $67,000 ($7.77)
Other Capital Outlay - Local Fire Protection: $37,000 ($4.29)
Police Protection: $9,000 ($1.04)Total Salaries and Wages: $7,481,000 ($867.36)
Port Jervis government finances - Revenue in 2021 (per resident):
Charges - Other: $904,000 ($104.81)
Sewerage: $826,000 ($95.77)Parks and Recreation: $6,000 ($0.70)Federal Intergovernmental - Housing and Community Development: $1,439,000 ($166.84)
Highways: $1,244,000 ($144.23)Other: $424,000 ($49.16)Local Intergovernmental - General Local Government Support: $3,229,000 ($374.38)
Other: $16,000 ($1.86)Miscellaneous - General Revenue - Other: $382,000 ($44.29)
Fines and Forfeits: $69,000 ($8.00)Rents: $66,000 ($7.65)Interest Earnings: $32,000 ($3.71)Donations From Private Sources: $2,000 ($0.23)Revenue - Water Utilities: $2,489,000 ($288.58)
State Intergovernmental - General Local Government Support: $1,336,000 ($154.90)
Other: $1,010,000 ($117.10)Highways: $679,000 ($78.72)Transit Utilities: $44,000 ($5.10)Education: $2,000 ($0.23)Tax - Property: $6,593,000 ($764.41)
Public Utilities Sales: $614,000 ($71.19)Other License: $276,000 ($32.00)
Port Jervis government finances - Debt in 2021 (per resident):
Long Term Debt - Beginning Outstanding - Unspecified Public Purpose: $12,506,000 ($1449.97)
Outstanding Unspecified Public Purpose: $11,727,000 ($1359.65)Retired Unspecified Public Purpose: $893,000 ($103.54)Issue, Unspecified Public Purpose: $114,000 ($13.22)Short Term Debt Outstanding - Beginning: $5,080,000 ($588.99)
End of Fiscal Year: $2,581,000 ($299.25)
Port Jervis government finances - Cash and Securities in 2021 (per resident):
Bond Funds - Cash and Securities: $181,000 ($20.99)
Other Funds - Cash and Securities: $4,503,000 ($522.09)
6.30% of this county's 2021 resident taxpayers lived in other counties in 2020 ($81,451 average adjusted gross income )
Here:
6.30%New York average:
5.29%
0.03% of residents moved from foreign countries ($369 average AGI )Orange County:
0.03%New York average:
0.01%
Top counties from which taxpayers relocated into this county between 2020 and 2021:
6.58% of this county's 2020 resident taxpayers moved to other counties in 2021 ($77,430 average adjusted gross income )
Here:
6.58%New York average:
6.93%
0.03% of residents moved to foreign countries ($315 average AGI )Orange County:
0.03%New York average:
0.02%
Top counties to which taxpayers relocated from this county between 2020 and 2021:
Businesses in Port Jervis, NY
Name Count Name Count
Baskin-Robbins 1 MasterBrand Cabinets 4 Burger King 1 Penske 1 Days Inn 1 Rite Aid 1 Dunkin Donuts 1 Subway 1 FedEx 2 True Value 1 Ford 1 U-Haul 2 H&R Block 1 UPS 1 Lane Furniture 1
Strongest AM radio stations in Port Jervis:
WDLC (1490 AM; 1 kW; PORT JERVIS, NY; Owner: PORT JERVIS BROADCASTING CO., INC.)
WMCA (570 AM; 50 kW; NEW YORK, NY; Owner: SALEM MEDIA OF NEW YORK, LLC)
WABC (770 AM; 50 kW; NEW YORK, NY; Owner: WABC-AM RADIO, INC.)
WOR (710 AM; 50 kW; NEW YORK, NY; Owner: BUCKLEY BROADCASTING CORPORATION)
WSNR (620 AM; 20 kW; JERSEY CITY, NJ)
WFAN (660 AM; 50 kW; NEW YORK, NY; Owner: INFINITY BROADCASTING OPERATIONS, INC.)
WINS (1010 AM; 50 kW; NEW YORK, NY; Owner: INFINITY BROADCASTING OPERATIONS, INC.)
WEPN (1050 AM; 50 kW; NEW YORK, NY; Owner: NEW YORK AM RADIO, LLC)
WVNJ (1160 AM; 20 kW; OAKLAND, NJ; Owner: UNIVERSAL B/CASTING OF NEW YORK,INC.)
WBBR (1130 AM; 50 kW; NEW YORK, NY; Owner: BLOOMBERG COMMUNICATIONS INC.)
WADO (1280 AM; 50 kW; NEW YORK, NY; Owner: WADO-AM LICENSE CORP.)
WCBS (880 AM; 50 kW; NEW YORK, NY; Owner: INFINITY BROADCASTING OPERATIONS, INC.)
WWJZ (640 AM; 50 kW; MOUNT HOLLY, NJ; Owner: ABC, INC.)
Strongest FM radio stations in Port Jervis:
WTSX (96.7 FM; PORT JERVIS, NY; Owner: PORT JERVIS BROADCASTING CO., INC.)
WRPJ (88.9 FM; PORT JERVIS, NY; Owner: SOUND OF LIFE, INC.)
WXHD (90.1 FM; MOUNT HOPE, NY; Owner: AURICLE COMMUNICATIONS)
WFKP (99.3 FM; ELLENVILLE, NY; Owner: CLEAR CHANNEL BROADCASTING LICENSES, INC.)
WSUS (102.3 FM; FRANKLIN, NJ; Owner: CLEAR CHANNEL BROADCASTING LICENSES, INC.)
WNNJ-FM (103.7 FM; NEWTON, NJ; Owner: CLEAR CHANNEL BROADCASTING LICENSES, INC.)
WOSR (91.7 FM; MIDDLETOWN, NY; Owner: WAMC)
WZAD (97.3 FM; WURTSBORO, NY; Owner: CUMULUS LICENSING CORP.)
WNJP (88.5 FM; SUSSEX, NJ; Owner: NEW JERSEY PUBLIC BROADCASTING AUTH.)
W215BG (90.9 FM; MILFORD, PA; Owner: JC RADIO, INC.)
WLJP (89.3 FM; MONROE, NY; Owner: SOUND OF LIFE, INC.)
WHCY (106.3 FM; BLAIRSTOWN, NJ; Owner: CLEAR CHANNEL BROADCASTING LICENSES, INC.)
WPDH (101.5 FM; POUGHKEEPSIE, NY; Owner: CUMULUS LICENSING CORP.)
WSUL (98.3 FM; MONTICELLO, NY; Owner: REYNOLDS COMMUNICATIONS, INC.)
WRRV (92.7 FM; MIDDLETOWN, NY; Owner: CUMULUS LICENSING CORP.)
WSPK (104.7 FM; POUGHKEEPSIE, NY; Owner: 6 JOHNSON ROAD LICENSES, INC.)
WFNP (88.7 FM; ROSENDALE, NY; Owner: STATE UNIVERSITY OF NEW YORK)
WRHV (88.7 FM; POUGHKEEPSIE, NY; Owner: WMHT EDUCATIONAL TELECOMMUNICATIONS)
WRKS (98.7 FM; NEW YORK, NY; Owner: EMMIS RADIO LICENSE CORP OF NEW YORK)
WPLJ (95.5 FM; NEW YORK, NY; Owner: WPLJ-FM RADIO, INC.)
TV broadcast stations around Port Jervis:
WNYW (Channel 5; NEW YORK, NY; Owner: FOX TELEVISION STATIONS, INC.)
WFME-TV (Channel 66; WEST MILFORD, NJ; Owner: FAMILY STATIONS, INC.)
WMBC-TV (Channel 63; NEWTON, NJ; Owner: MOUNTAIN BROADCASTING CORPORATION)
WPXO-LP (Channel 34; EAST ORANGE, NJ; Owner: PAXSON COMMUNICATIONS LPTV, INC.)
WTBY (Channel 54; POUGHKEEPSIE, NY; Owner: TRINITY BROADCASTING OF NEW YORK, INC.)
W36AZ (Channel 36; SUSSEX, NJ; Owner: NEW JERSEY PUBLIC B/CING. AUTHORITY)
National Bridge Inventory (NBI) Statistics 23 Number of bridges433ft / 132m Total length $83,603,000 Total costs193,000 Total average daily traffic21,167 Total average daily truck traffic
New bridges - historical statistics
1 1900-1909 5 1930-1939 12 1960-1969 2 2000-2009 2 2010-2019 1 2020-2022
See full National Bridge Inventory statistics for Port Jervis, NY
FCC Registered Cell Phone Towers: 1 (
See the full list of FCC Registered Cell Phone Towers in Port Jervis )
FCC Registered Antenna Towers: 10 (
See the full list of FCC Registered Antenna Towers )
FCC Registered Private Land Mobile Towers: 3 (
See the full list of FCC Registered Private Land Mobile Towers in Port Jervis, NY )
FCC Registered Broadcast Land Mobile Towers: 10 (
See the full list of FCC Registered Broadcast Land Mobile Towers )
FCC Registered Microwave Towers: 4
Horn Rd Approx .9 Mi Se (Lat: 41.363694 Lon: -74.677639), Overall height: 43.9 m, Call Sign: WPW27, Assigned Frequencies: 947.350 MHz, 947.650 MHz, Grant Date: 06/27/1973, Expiration Date: 06/01/2030, Registrant: Digital Radio Engineering, Inc., 15 Neversink Drive, Port Jervis, NY 12771, Phone: (845) 856-4000, Fax: (845) 856-4757, Email:
NY10001E, Mp 1, Route 84 West (Lat: 41.354611 Lon: -74.681167), Type: Mtower, Structure height: 56 m, Overall height: 57 m, Call Sign: WQWM755, Assigned Frequencies: 10775.0 MHz, 10775.0 MHz, 10775.0 MHz, 10775.0 MHz, 10775.0 MHz, 10775.0 MHz, 10775.0 MHz, 10775.0 MHz, Grant Date: 10/06/2015, Expiration Date: 10/06/2025, Certifier: David Werblow, Registrant: T-Mobile License LLC, 12920 Se 38th St, Bellevue, WA 98006, Phone: (425) 383-8401, Fax: (425) 383-4040, Email:
PJ Substation, 73 West Main Street (Lat: 41.378472 Lon: -74.695278), Type: Ltower, Structure height: 15.8 m, Call Sign: WRNN690, Assigned Frequencies: 10835.0 MHz, Grant Date: 08/02/2021, Expiration Date: 08/02/2031, Certifier: Michael E Durling, Registrant: Blooston, Mordkofsky, Dickens & Prendergast, LLP, 2120 L Street, N.W., Suite 825, Washington, DC 20037, Phone: (202) 828-5565, Fax: (202) 828-5568, Email:
Port Jervis, 16 Pike Street (Lat: 41.372861 Lon: -74.696528), Type: Tower, Structure height: 30.5 m, Call Sign: WEW34, Assigned Frequencies: 6004.50 MHz, Grant Date: 11/12/2020, Expiration Date: 10/18/2030, Registrant: Blooston, Mordkofsky, Dickens & Prendergast, LLP, 2120 L Street, N.W., Suite 825, Washington, DC 20037, Phone: (202) 828-5565, Fax: (202) 828-5568, Email:
FCC Registered Paging Towers: 2
Guymard Turnpike (Lat: 41.427222 Lon: -74.581389), Type: Tower, Structure height: 54.9 m, Overall height: 60.7 m, Call Sign: KNKM812, Licensee ID: L01422065, Assigned Frequencies: 931.837 MHz, Grant Date: 09/03/2008, Expiration Date: 07/01/2018, Cancellation Date: 01/28/2014, Certifier: Shawn E Endsley, Registrant: Usa Mobility Wireless, Inc., 3000 Technology Dr. #400, Plano, TX 75074, Phone: (972) 801-0000, Fax: (972) 801-1699, Email:
160 E Main Street (Lat: 41.367583 Lon: -74.682083), Overall height: 33.5 m, Call Sign: KNKM812, Licensee ID: L01422065, Assigned Frequencies: 931.837 MHz, Grant Date: 09/03/2008, Expiration Date: 07/01/2018, Cancellation Date: 01/28/2014, Certifier: Shawn E Endsley, Registrant: Usa Mobility Wireless, Inc., 3000 Technology Dr. #400, Plano, TX 75074, Phone: (972) 801-0000, Fax: (972) 801-1699, Email:
FCC Registered Amateur Radio Licenses: 68 (
See the full list of FCC Registered Amateur Radio Licenses in Port Jervis )
FAA Registered Aircraft Manufacturers and Dealers: 2 (
See the full list of FAA Registered Manufacturers and Dealers in Port Jervis )
FAA Registered Aircraft: 10 (
See the full list of FAA Registered Aircraft )
Home Mortgage Disclosure Act Aggregated Statistics For Year 2009(Based on 3 full tracts) A) FHA, FSA/RHS & VA B) Conventional C) Refinancings D) Home Improvement Loans F) Non-occupant Loans on Number Average Value Number Average Value Number Average Value Number Average Value Number Average Value
LOANS ORIGINATED 20 $140,300 15 $104,000 41 $134,098 5 $19,400 8 $69,500 APPLICATIONS APPROVED, NOT ACCEPTED 2 $196,500 2 $90,500 11 $143,818 3 $96,667 0 $0 APPLICATIONS DENIED 7 $118,429 7 $78,143 51 $133,392 16 $58,438 12 $85,083 APPLICATIONS WITHDRAWN 3 $123,000 3 $82,333 22 $132,500 4 $145,750 2 $129,500 FILES CLOSED FOR INCOMPLETENESS 0 $0 0 $0 3 $130,667 1 $58,000 0 $0
Aggregated Statistics For Year 2008(Based on 3 full tracts) A) FHA, FSA/RHS & VA B) Conventional C) Refinancings D) Home Improvement Loans E) Loans on Dwellings For 5+ Families F) Non-occupant Loans on G) Loans On Manufactured Number Average Value Number Average Value Number Average Value Number Average Value Number Average Value Number Average Value Number Average Value
LOANS ORIGINATED 21 $148,286 35 $128,686 44 $123,250 12 $54,750 0 $0 14 $119,357 0 $0 APPLICATIONS APPROVED, NOT ACCEPTED 4 $131,750 3 $155,000 13 $108,846 10 $34,300 0 $0 2 $153,500 1 $110,000 APPLICATIONS DENIED 3 $162,333 16 $115,500 76 $157,987 17 $53,882 0 $0 10 $110,400 0 $0 APPLICATIONS WITHDRAWN 7 $148,143 3 $136,333 40 $145,075 3 $139,667 1 $800,000 3 $120,000 0 $0 FILES CLOSED FOR INCOMPLETENESS 0 $0 5 $164,600 8 $115,750 0 $0 0 $0 3 $125,333 0 $0
Aggregated Statistics For Year 2007(Based on 3 full tracts) A) FHA, FSA/RHS & VA B) Conventional C) Refinancings D) Home Improvement Loans E) Loans on Dwellings For 5+ Families F) Non-occupant Loans on G) Loans On Manufactured Number Average Value Number Average Value Number Average Value Number Average Value Number Average Value Number Average Value Number Average Value
LOANS ORIGINATED 4 $175,500 87 $136,644 110 $134,318 41 $64,463 1 $300,000 21 $126,619 1 $39,000 APPLICATIONS APPROVED, NOT ACCEPTED 1 $194,000 20 $107,250 29 $127,034 4 $79,500 0 $0 5 $139,800 0 $0 APPLICATIONS DENIED 5 $211,000 51 $133,588 143 $135,860 51 $52,196 1 $400,000 28 $121,714 1 $21,000 APPLICATIONS WITHDRAWN 2 $169,500 24 $129,333 54 $149,000 9 $133,778 0 $0 4 $191,000 0 $0 FILES CLOSED FOR INCOMPLETENESS 1 $113,000 6 $93,500 11 $180,364 2 $58,500 0 $0 2 $178,500 0 $0
Aggregated Statistics For Year 2006(Based on 3 full tracts) A) FHA, FSA/RHS & VA B) Conventional C) Refinancings D) Home Improvement Loans E) Loans on Dwellings For 5+ Families F) Non-occupant Loans on G) Loans On Manufactured Number Average Value Number Average Value Number Average Value Number Average Value Number Average Value Number Average Value Number Average Value
LOANS ORIGINATED 6 $170,667 128 $117,359 185 $118,903 44 $50,409 3 $436,000 43 $121,419 1 $21,000 APPLICATIONS APPROVED, NOT ACCEPTED 1 $224,000 21 $123,286 48 $137,021 5 $44,000 0 $0 17 $147,647 1 $43,000 APPLICATIONS DENIED 1 $155,000 74 $114,284 146 $141,760 82 $52,024 0 $0 30 $110,533 2 $83,500 APPLICATIONS WITHDRAWN 0 $0 32 $125,969 146 $138,418 13 $54,462 0 $0 19 $125,053 1 $124,000 FILES CLOSED FOR INCOMPLETENESS 0 $0 11 $132,545 19 $153,947 0 $0 0 $0 7 $161,143 0 $0
Aggregated Statistics For Year 2005(Based on 3 full tracts) A) FHA, FSA/RHS & VA B) Conventional C) Refinancings D) Home Improvement Loans E) Loans on Dwellings For 5+ Families F) Non-occupant Loans on G) Loans On Manufactured Number Average Value Number Average Value Number Average Value Number Average Value Number Average Value Number Average Value Number Average Value
LOANS ORIGINATED 3 $190,667 197 $118,807 233 $118,386 40 $41,375 3 $213,667 59 $119,068 1 $10,000 APPLICATIONS APPROVED, NOT ACCEPTED 0 $0 28 $120,714 25 $122,200 11 $50,727 0 $0 9 $162,444 0 $0 APPLICATIONS DENIED 1 $165,000 53 $109,849 145 $124,400 48 $44,542 0 $0 29 $101,379 2 $55,000 APPLICATIONS WITHDRAWN 2 $166,000 45 $137,467 174 $125,655 19 $119,526 0 $0 14 $144,857 0 $0 FILES CLOSED FOR INCOMPLETENESS 0 $0 5 $132,800 26 $139,038 4 $85,250 0 $0 3 $129,000 0 $0
Aggregated Statistics For Year 2004(Based on 3 full tracts) A) FHA, FSA/RHS & VA B) Conventional C) Refinancings D) Home Improvement Loans E) Loans on Dwellings For 5+ Families F) Non-occupant Loans on G) Loans On Manufactured Number Average Value Number Average Value Number Average Value Number Average Value Number Average Value Number Average Value Number Average Value
LOANS ORIGINATED 7 $134,571 177 $117,045 189 $103,894 30 $42,267 2 $186,000 78 $110,051 0 $0 APPLICATIONS APPROVED, NOT ACCEPTED 2 $102,500 33 $118,000 55 $101,836 5 $47,000 0 $0 11 $105,182 1 $80,000 APPLICATIONS DENIED 3 $141,000 50 $107,160 97 $98,113 52 $54,558 0 $0 18 $95,278 10 $38,600 APPLICATIONS WITHDRAWN 3 $154,000 42 $130,452 97 $108,082 21 $53,571 0 $0 19 $132,737 1 $108,000 FILES CLOSED FOR INCOMPLETENESS 0 $0 14 $113,143 12 $145,750 4 $111,500 0 $0 4 $135,000 0 $0
Aggregated Statistics For Year 2003(Based on 3 full tracts) A) FHA, FSA/RHS & VA B) Conventional C) Refinancings D) Home Improvement Loans E) Loans on Dwellings For 5+ Families F) Non-occupant Loans on Number Average Value Number Average Value Number Average Value Number Average Value Number Average Value Number Average Value
LOANS ORIGINATED 13 $108,385 134 $89,239 153 $94,830 13 $40,000 1 $110,000 45 $81,111 APPLICATIONS APPROVED, NOT ACCEPTED 3 $138,333 22 $89,182 35 $84,600 3 $50,000 0 $0 9 $105,111 APPLICATIONS DENIED 4 $103,250 33 $90,333 118 $91,288 19 $25,895 1 $255,000 13 $76,231 APPLICATIONS WITHDRAWN 4 $126,000 17 $95,647 81 $98,778 8 $50,875 0 $0 9 $78,333 FILES CLOSED FOR INCOMPLETENESS 1 $96,000 5 $86,600 6 $100,000 1 $20,000 0 $0 1 $100,000
Aggregated Statistics For Year 2002(Based on 3 full tracts) A) FHA, FSA/RHS & VA B) Conventional C) Refinancings D) Home Improvement Loans E) Loans on Dwellings For 5+ Families F) Non-occupant Loans on Number Average Value Number Average Value Number Average Value Number Average Value Number Average Value Number Average Value
LOANS ORIGINATED 18 $87,167 85 $70,459 89 $77,989 16 $31,562 1 $123,000 38 $62,868 APPLICATIONS APPROVED, NOT ACCEPTED 3 $80,667 17 $70,412 27 $76,444 7 $16,571 0 $0 10 $62,500 APPLICATIONS DENIED 4 $101,500 25 $91,160 73 $67,425 25 $17,200 2 $249,000 11 $59,182 APPLICATIONS WITHDRAWN 9 $84,556 13 $68,077 84 $72,036 6 $39,500 0 $0 5 $54,000 FILES CLOSED FOR INCOMPLETENESS 0 $0 7 $55,000 28 $77,786 0 $0 0 $0 3 $62,333
Aggregated Statistics For Year 2001(Based on 3 full tracts) A) FHA, FSA/RHS & VA B) Conventional C) Refinancings D) Home Improvement Loans E) Loans on Dwellings For 5+ Families F) Non-occupant Loans on Number Average Value Number Average Value Number Average Value Number Average Value Number Average Value Number Average Value
LOANS ORIGINATED 21 $83,000 55 $82,527 88 $68,909 17 $28,529 1 $84,000 16 $67,438 APPLICATIONS APPROVED, NOT ACCEPTED 1 $52,000 14 $63,143 19 $62,684 7 $24,571 1 $116,000 3 $73,667 APPLICATIONS DENIED 2 $73,500 33 $73,576 96 $55,177 25 $29,240 0 $0 10 $60,300 APPLICATIONS WITHDRAWN 5 $78,600 9 $65,333 80 $72,338 7 $25,714 0 $0 6 $61,167 FILES CLOSED FOR INCOMPLETENESS 1 $78,000 5 $47,600 16 $71,688 1 $7,000 0 $0 2 $52,500
Aggregated Statistics For Year 2000(Based on 3 full tracts) A) FHA, FSA/RHS & VA B) Conventional C) Refinancings D) Home Improvement Loans E) Loans on Dwellings For 5+ Families F) Non-occupant Loans on Number Average Value Number Average Value Number Average Value Number Average Value Number Average Value Number Average Value
LOANS ORIGINATED 26 $82,269 44 $61,250 37 $55,784 20 $32,050 1 $51,000 21 $55,619 APPLICATIONS APPROVED, NOT ACCEPTED 1 $69,000 11 $62,818 19 $51,211 7 $17,429 0 $0 4 $61,000 APPLICATIONS DENIED 3 $72,667 39 $51,795 62 $54,645 24 $21,750 0 $0 18 $56,444 APPLICATIONS WITHDRAWN 3 $56,333 15 $106,067 53 $76,774 4 $35,500 1 $77,000 4 $58,250 FILES CLOSED FOR INCOMPLETENESS 1 $43,000 4 $64,000 22 $68,591 0 $0 0 $0 2 $60,500
Aggregated Statistics For Year 1999(Based on 2 full and 1 partial tracts) A) FHA, FSA/RHS & VA B) Conventional C) Refinancings D) Home Improvement Loans E) Loans on Dwellings For 5+ Families F) Non-occupant Loans on Number Average Value Number Average Value Number Average Value Number Average Value Number Average Value Number Average Value
LOANS ORIGINATED 17 $72,273 55 $62,368 70 $60,105 11 $24,995 2 $2,116,130 15 $47,889 APPLICATIONS APPROVED, NOT ACCEPTED 2 $56,980 9 $58,656 20 $56,592 8 $26,102 0 $0 3 $52,380 APPLICATIONS DENIED 3 $88,047 26 $55,592 77 $51,821 16 $32,872 0 $0 15 $55,709 APPLICATIONS WITHDRAWN 1 $76,630 10 $38,232 53 $61,120 2 $20,905 1 $388,480 4 $43,070 FILES CLOSED FOR INCOMPLETENESS 0 $0 2 $203,235 17 $57,296 0 $0 0 $0 0 $0
Detailed HMDA statistics for the following Tracts:
0021.00
, 0022.00 , 0023.00
Private Mortgage Insurance Companies Aggregated Statistics For Year 2009(Based on 2 full tracts) A) Conventional B) Refinancings Number Average Value Number Average Value
LOANS ORIGINATED 2 $158,500 1 $170,000 APPLICATIONS APPROVED, NOT ACCEPTED 0 $0 0 $0 APPLICATIONS DENIED 1 $215,000 0 $0 APPLICATIONS WITHDRAWN 1 $92,000 0 $0 FILES CLOSED FOR INCOMPLETENESS 0 $0 0 $0
Aggregated Statistics For Year 2008(Based on 3 full tracts) A) Conventional B) Refinancings C) Non-occupant Loans on Number Average Value Number Average Value Number Average Value
LOANS ORIGINATED 18 $137,222 4 $193,500 3 $117,000 APPLICATIONS APPROVED, NOT ACCEPTED 10 $147,700 4 $178,250 3 $105,333 APPLICATIONS DENIED 4 $133,250 0 $0 1 $72,000 APPLICATIONS WITHDRAWN 0 $0 0 $0 0 $0 FILES CLOSED FOR INCOMPLETENESS 1 $143,000 0 $0 0 $0
Aggregated Statistics For Year 2007(Based on 3 full tracts) A) Conventional B) Refinancings C) Non-occupant Loans on Number Average Value Number Average Value Number Average Value
LOANS ORIGINATED 37 $162,838 11 $187,818 5 $163,800 APPLICATIONS APPROVED, NOT ACCEPTED 4 $191,750 0 $0 0 $0 APPLICATIONS DENIED 1 $213,000 3 $242,000 3 $242,000 APPLICATIONS WITHDRAWN 1 $130,000 1 $179,000 0 $0 FILES CLOSED FOR INCOMPLETENESS 0 $0 0 $0 0 $0
Aggregated Statistics For Year 2006(Based on 3 full tracts) A) Conventional B) Refinancings C) Non-occupant Loans on Number Average Value Number Average Value Number Average Value
LOANS ORIGINATED 21 $160,524 3 $193,667 2 $101,500 APPLICATIONS APPROVED, NOT ACCEPTED 4 $137,500 1 $169,000 1 $63,000 APPLICATIONS DENIED 0 $0 0 $0 0 $0 APPLICATIONS WITHDRAWN 3 $179,667 0 $0 0 $0 FILES CLOSED FOR INCOMPLETENESS 1 $162,000 0 $0 0 $0
Aggregated Statistics For Year 2005(Based on 3 full tracts) A) Conventional B) Refinancings C) Non-occupant Loans on Number Average Value Number Average Value Number Average Value
LOANS ORIGINATED 40 $164,250 1 $181,000 8 $166,000 APPLICATIONS APPROVED, NOT ACCEPTED 6 $142,667 0 $0 1 $133,000 APPLICATIONS DENIED 0 $0 0 $0 0 $0 APPLICATIONS WITHDRAWN 6 $148,500 0 $0 3 $169,333 FILES CLOSED FOR INCOMPLETENESS 0 $0 0 $0 0 $0
Aggregated Statistics For Year 2004(Based on 3 full tracts) A) Conventional B) Refinancings C) Non-occupant Loans on Number Average Value Number Average Value Number Average Value
LOANS ORIGINATED 52 $129,788 6 $147,667 14 $117,429 APPLICATIONS APPROVED, NOT ACCEPTED 7 $107,571 1 $87,000 3 $94,000 APPLICATIONS DENIED 1 $153,000 0 $0 0 $0 APPLICATIONS WITHDRAWN 1 $113,000 0 $0 0 $0 FILES CLOSED FOR INCOMPLETENESS 1 $148,000 0 $0 1 $148,000
Aggregated Statistics For Year 2003(Based on 3 full tracts) A) Conventional B) Refinancings C) Non-occupant Loans on Number Average Value Number Average Value Number Average Value
LOANS ORIGINATED 62 $95,306 7 $99,286 12 $84,083 APPLICATIONS APPROVED, NOT ACCEPTED 20 $94,100 2 $83,000 3 $72,333 APPLICATIONS DENIED 4 $96,500 0 $0 2 $73,500 APPLICATIONS WITHDRAWN 2 $86,500 0 $0 1 $113,000 FILES CLOSED FOR INCOMPLETENESS 0 $0 0 $0 0 $0
Aggregated Statistics For Year 2002(Based on 3 full tracts) A) Conventional B) Refinancings C) Non-occupant Loans on Number Average Value Number Average Value Number Average Value
LOANS ORIGINATED 29 $85,724 5 $92,800 8 $71,750 APPLICATIONS APPROVED, NOT ACCEPTED 7 $73,429 1 $79,000 2 $63,500 APPLICATIONS DENIED 1 $76,000 0 $0 0 $0 APPLICATIONS WITHDRAWN 3 $51,000 1 $108,000 0 $0 FILES CLOSED FOR INCOMPLETENESS 0 $0 0 $0 0 $0
Aggregated Statistics For Year 2001(Based on 3 full tracts) A) Conventional B) Refinancings C) Non-occupant Loans on Number Average Value Number Average Value Number Average Value
LOANS ORIGINATED 24 $74,750 8 $82,000 5 $74,400 APPLICATIONS APPROVED, NOT ACCEPTED 4 $92,250 2 $108,500 1 $54,000 APPLICATIONS DENIED 0 $0 0 $0 0 $0 APPLICATIONS WITHDRAWN 0 $0 0 $0 0 $0 FILES CLOSED FOR INCOMPLETENESS 0 $0 0 $0 0 $0
Aggregated Statistics For Year 2000(Based on 3 full tracts) A) Conventional B) Refinancings C) Non-occupant Loans on Number Average Value Number Average Value Number Average Value
LOANS ORIGINATED 16 $69,188 3 $61,667 5 $58,200 APPLICATIONS APPROVED, NOT ACCEPTED 3 $76,667 3 $74,000 0 $0 APPLICATIONS DENIED 2 $68,500 0 $0 0 $0 APPLICATIONS WITHDRAWN 1 $65,000 0 $0 0 $0 FILES CLOSED FOR INCOMPLETENESS 0 $0 0 $0 0 $0
Aggregated Statistics For Year 1999(Based on 2 full and 1 partial tracts) A) Conventional B) Refinancings C) Non-occupant Loans on Number Average Value Number Average Value Number Average Value
LOANS ORIGINATED 23 $75,308 9 $75,263 4 $68,245 APPLICATIONS APPROVED, NOT ACCEPTED 3 $76,230 2 $60,865 2 $69,645 APPLICATIONS DENIED 0 $0 0 $0 0 $0 APPLICATIONS WITHDRAWN 3 $73,127 0 $0 1 $47,810 FILES CLOSED FOR INCOMPLETENESS 1 $89,400 0 $0 0 $0
Detailed PMIC statistics for the following Tracts:
0021.00
, 0022.00 , 0023.00
Most common first names in Port Jervis, NY among deceased individuals Name Count Lived (average)
John 147 72.6 years Mary 126 79.8 years William 113 73.7 years Charles 86 72.4 years Joseph 79 75.8 years George 77 72.2 years Helen 73 78.6 years Frank 64 77.7 years James 63 70.2 years Anna 62 81.7 years
Most common last names in Port Jervis, NY among deceased individuals Last name Count Lived (average)
Smith 43 74.1 years Conklin 38 76.2 years Decker 26 75.0 years Cuddeback 18 79.2 years Wilson 17 70.6 years Quick 17 69.7 years Williams 16 75.4 years Morgan 14 65.9 years Cole 13 69.0 years Clark 13 73.3 years
Port Jervis compared to New York state average:
Median household income below state average. Median house value below state average. Unemployed percentage below state average. Foreign-born population percentage below state average. Length of stay since moving in significantly above state average. Percentage of population with a bachelor's degree or higher below state average. Port Jervis on our top lists :
#13 on the list of "Top 101 cities with largest percentage of males in industries: retail trade (population 5,000+)"
#21 on the list of "Top 101 cities with the largest percentage of unmarried partner households (population 5,000+)"
#40 on the list of "Top 101 cities with the most people taking a taxi to work (population 5,000+)"
#5 on the list of "Top 101 counties with the largest increase in the number of infant deaths per 1000 residents 2000-2006 to 2007-2013 (pop. 50,000+)"
#21 on the list of "Top 101 counties with the lowest Ozone (1-hour) air pollution readings in 2012 (ppm)"
#67 on the list of "Top 101 counties with the largest number of people moving out compared to moving in (pop. 50,000+)"
#79 on the list of "Top 101 counties with the most Catholic congregations"
#90 on the list of "Top 101 counties with the most Other adherents (pop. 50,000+)"
Top Patent Applicants
Christopher P. Vignola (8)
Michael John O'Leary (2)
Tim James O'Leary (2)
Craig D. Robertson (2)
Chris M. Langley (2)
Craig Robert Onofry (2)
Christopher G. Baker (2)
Shailesh Mehta (1)
Gene Petit (1)
Christopher Paul Vignola (1)
Total of 24 patent applications in 2008-2024.
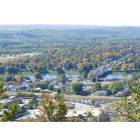
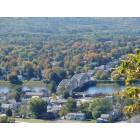

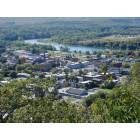
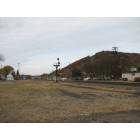
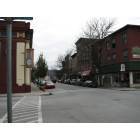
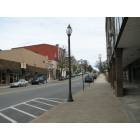
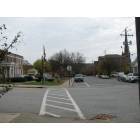
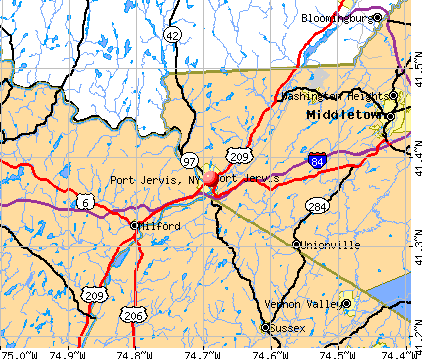


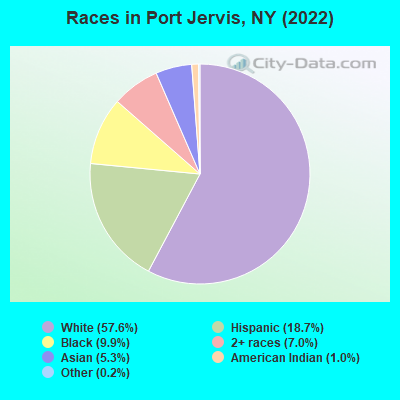
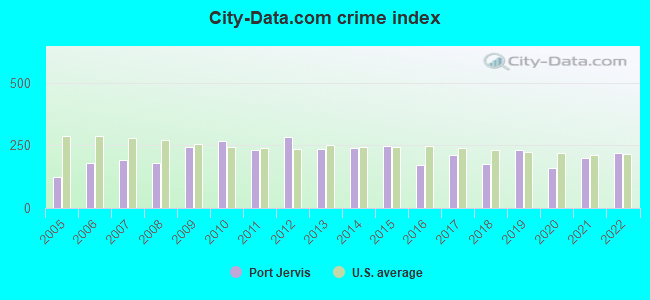
 Recent articles from our blog. Our writers, many of them Ph.D. graduates or candidates, create easy-to-read articles on a wide variety of topics.

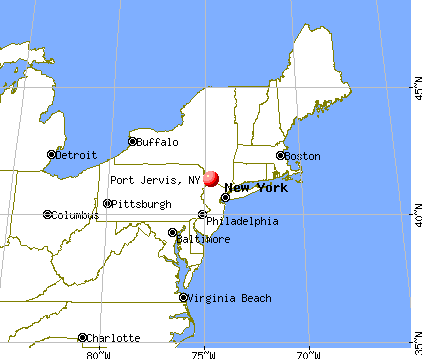
 (36.0 miles
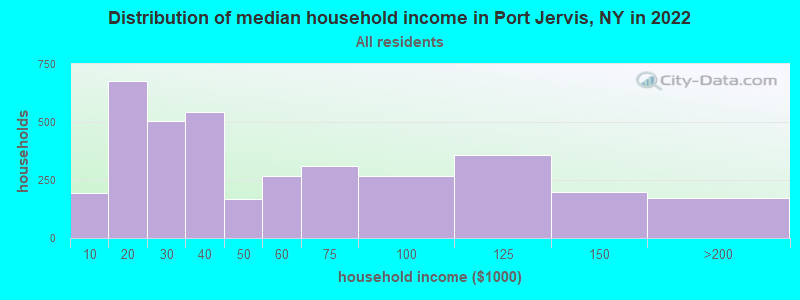
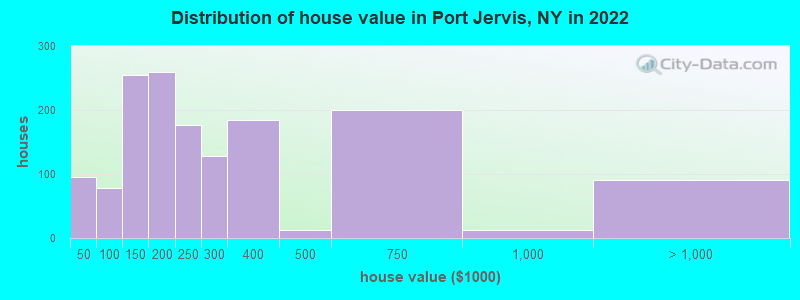

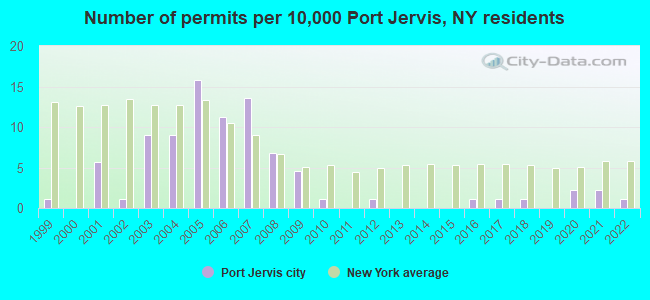
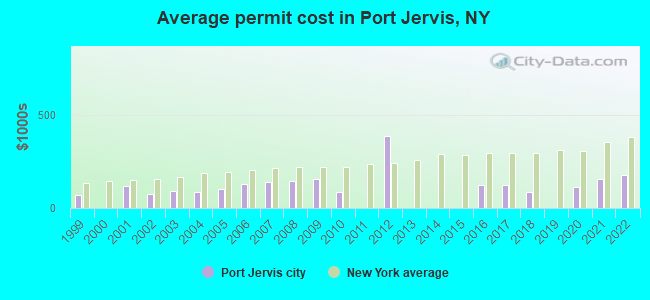
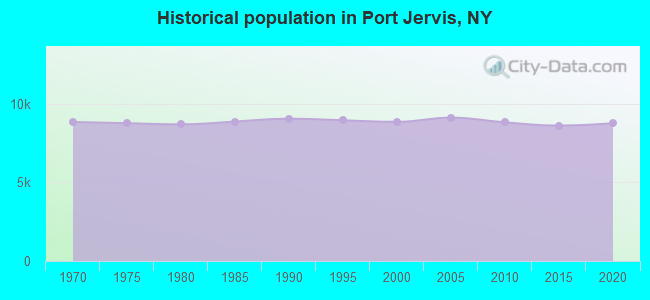
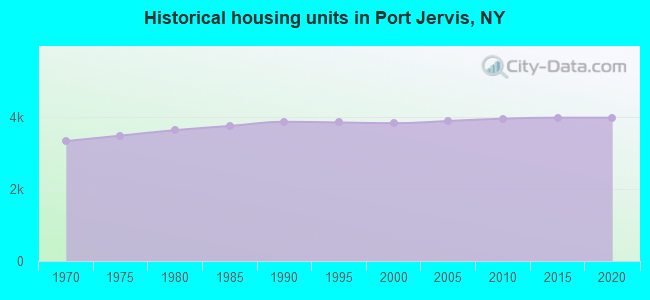
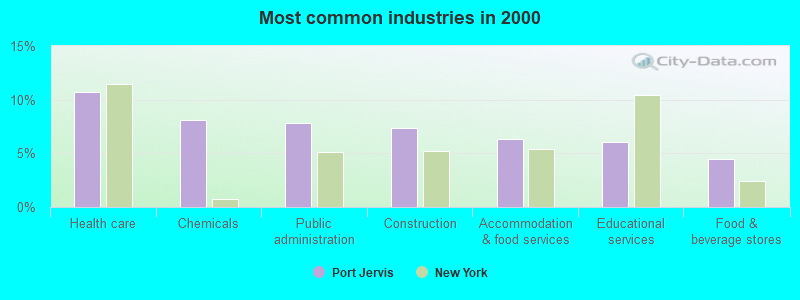
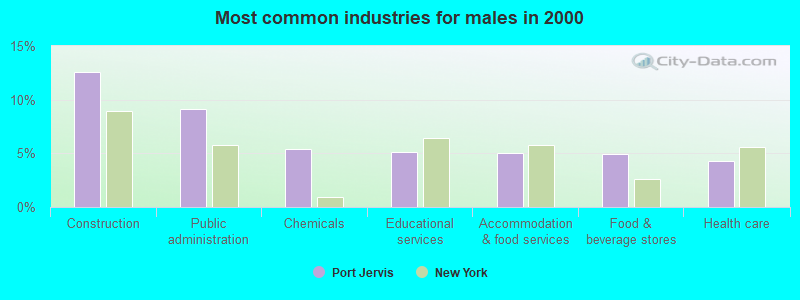
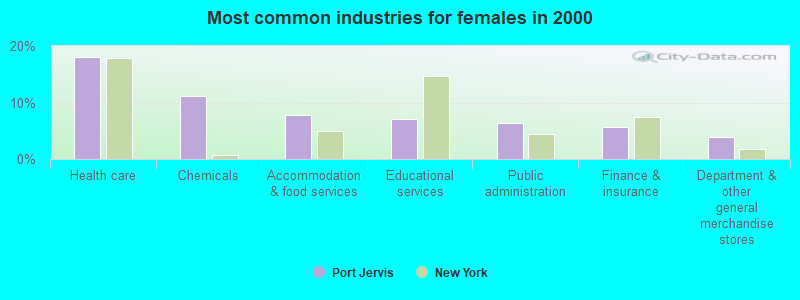
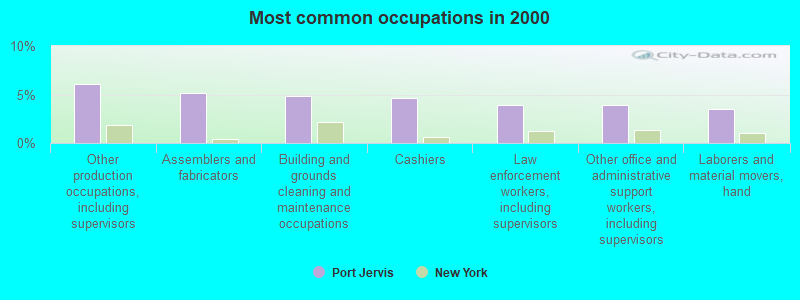
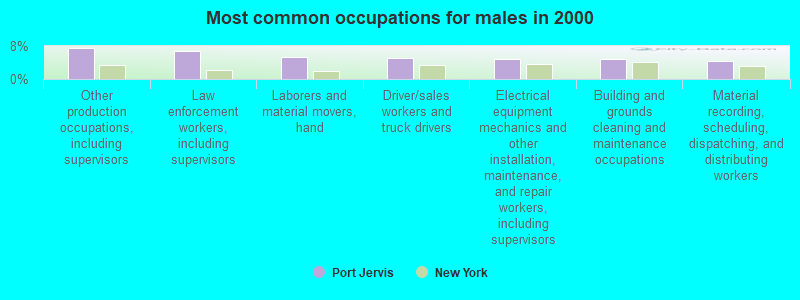
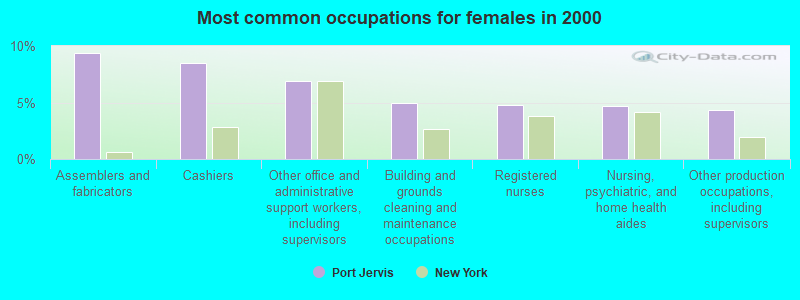


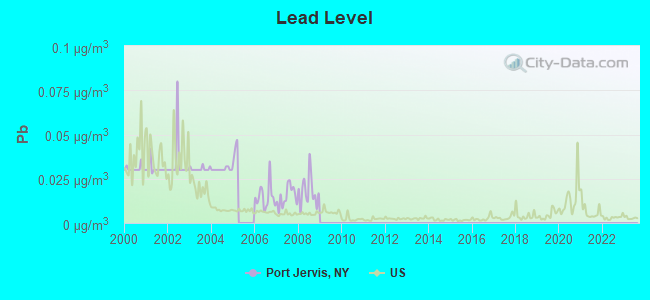


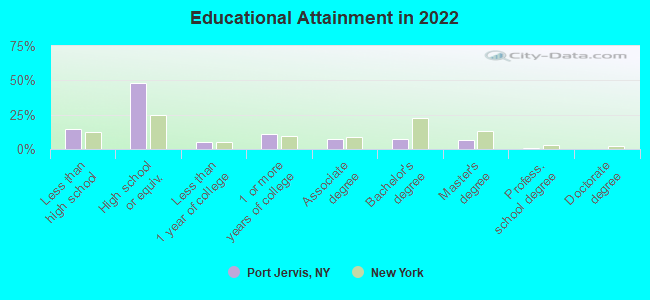
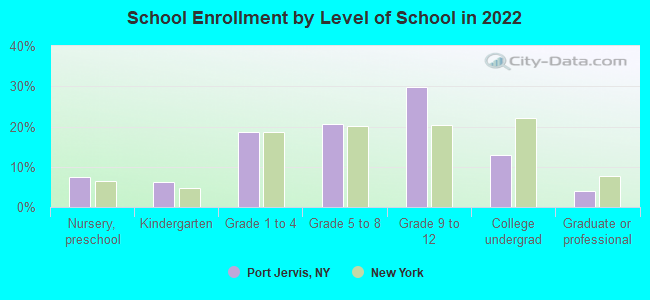
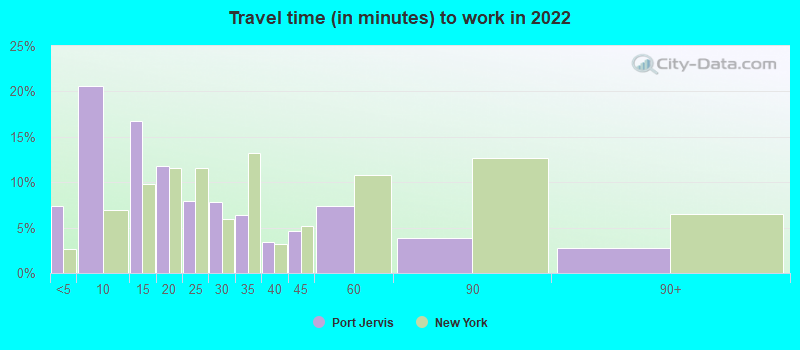
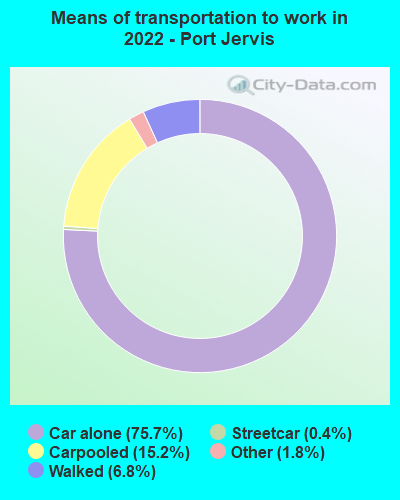
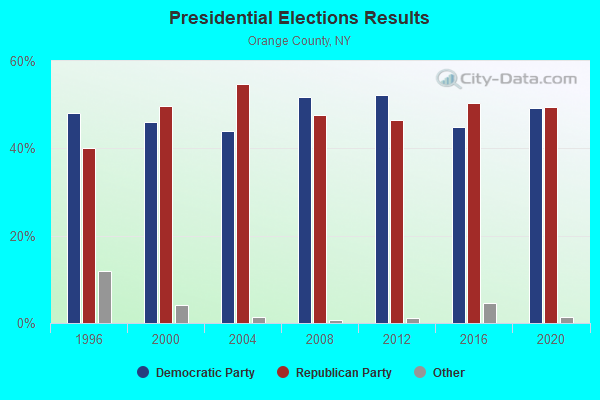
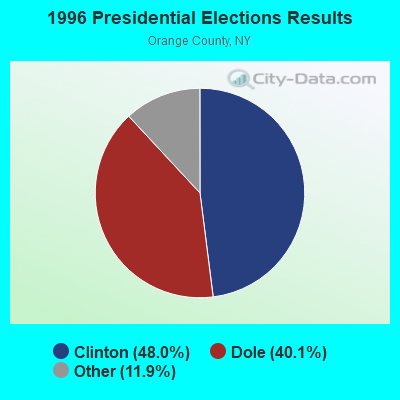
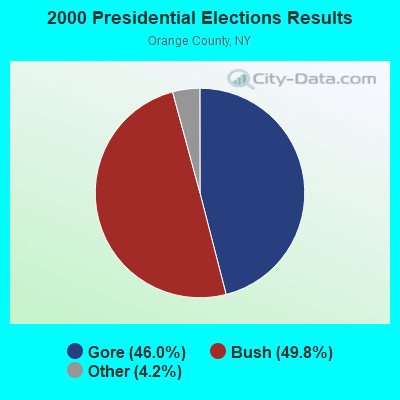
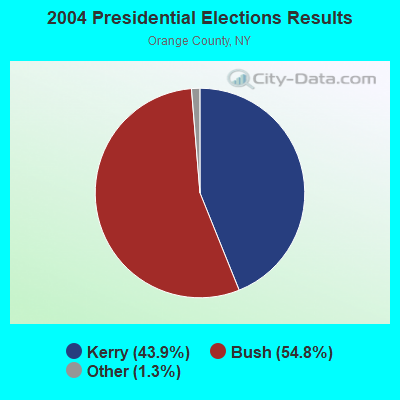
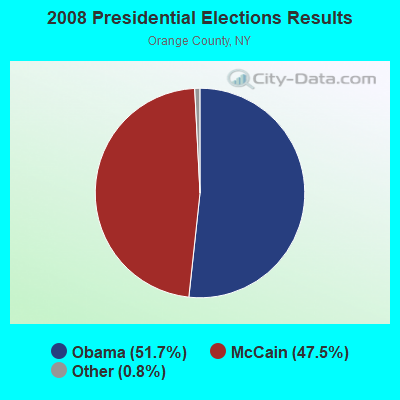
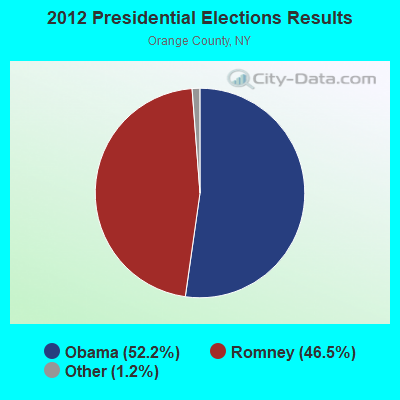
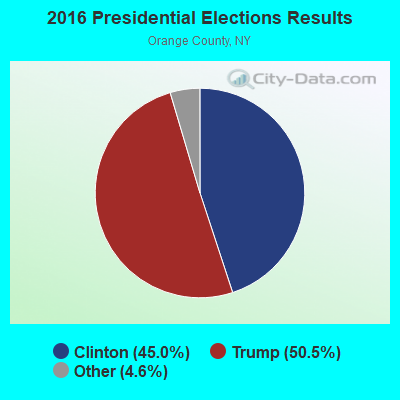
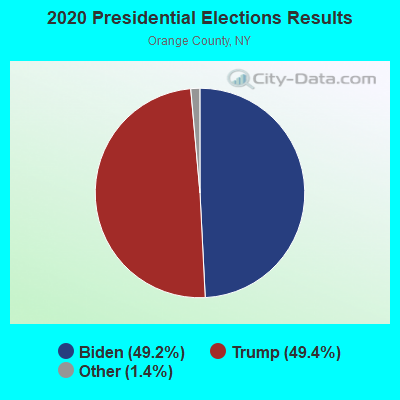
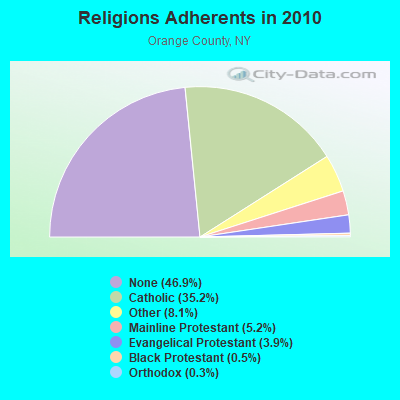
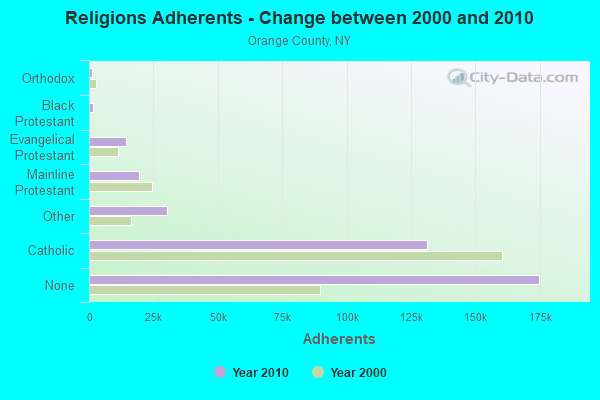
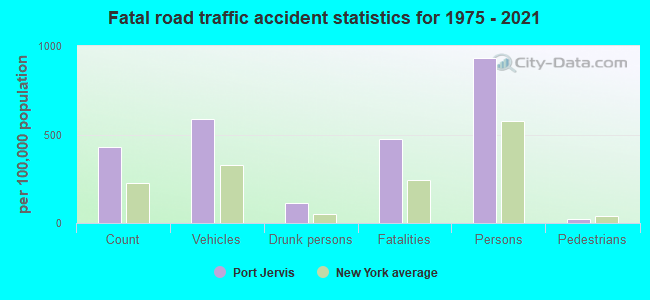
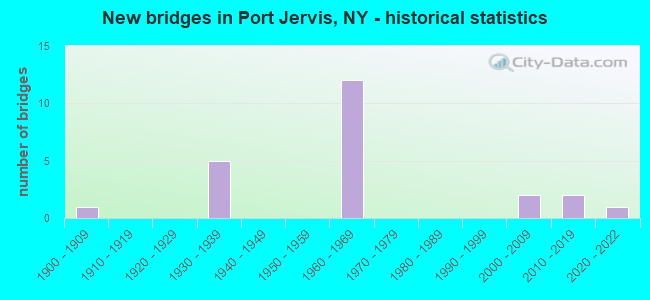
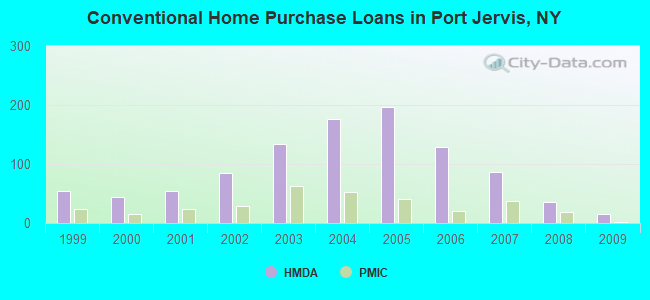
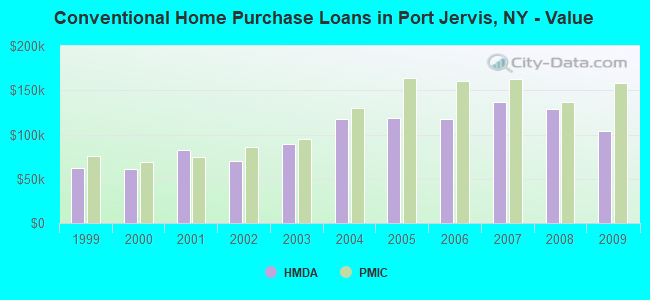
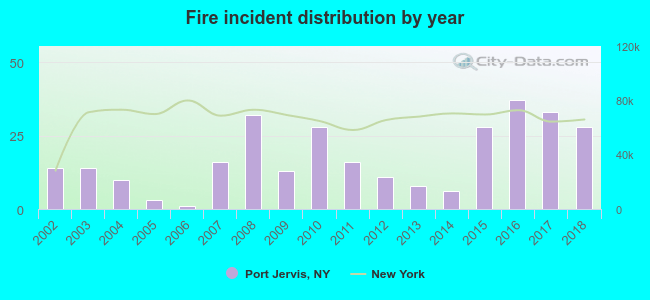 According to the data from the years 2002 - 2018 the average number of fire incidents per year is 18. The highest number of fires - 37 took place in 2016, and the least - 1 in 2006. The data has a growing trend.
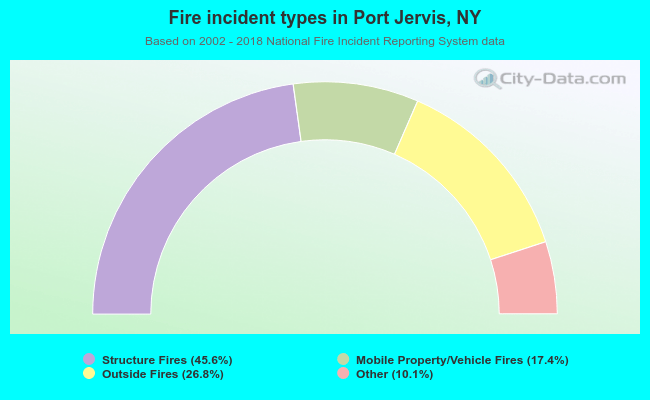 When looking into fire subcategories, the most incidents belonged to: Structure Fires (45.6%), and Outside Fires (26.8%).