Powder Springs, Georgia Submit your own pictures of this city and show them to the world
OSM Map
General Map
Google Map
MSN Map
OSM Map
General Map
Google Map
MSN Map
OSM Map
General Map
Google Map
MSN Map
OSM Map
General Map
Google Map
MSN Map
Please wait while loading the map...
Population in 2022: 17,337 (100% urban, 0% rural). Population change since 2000: +38.9%Males: 7,990 Females: 9,347
March 2022 cost of living index in Powder Springs: 101.4 (near average, U.S. average is 100) Percentage of residents living in poverty in 2022: 7.5%for White Non-Hispanic residents , 8.1% for Black residents , 4.0% for Hispanic or Latino residents , 11.1% for other race residents , 1.2% for two or more races residents )
Profiles of local businesses
Business Search - 14 Million verified businesses
Data:
Median household income ($)
Median household income (% change since 2000)
Household income diversity
Ratio of average income to average house value (%)
Ratio of average income to average rent
Median household income ($) - White
Median household income ($) - Black or African American
Median household income ($) - Asian
Median household income ($) - Hispanic or Latino
Median household income ($) - American Indian and Alaska Native
Median household income ($) - Multirace
Median household income ($) - Other Race
Median household income for houses/condos with a mortgage ($)
Median household income for apartments without a mortgage ($)
Races - White alone (%)
Races - White alone (% change since 2000)
Races - Black alone (%)
Races - Black alone (% change since 2000)
Races - American Indian alone (%)
Races - American Indian alone (% change since 2000)
Races - Asian alone (%)
Races - Asian alone (% change since 2000)
Races - Hispanic (%)
Races - Hispanic (% change since 2000)
Races - Native Hawaiian and Other Pacific Islander alone (%)
Races - Native Hawaiian and Other Pacific Islander alone (% change since 2000)
Races - Two or more races (%)
Races - Two or more races (% change since 2000)
Races - Other race alone (%)
Races - Other race alone (% change since 2000)
Racial diversity
Unemployment (%)
Unemployment (% change since 2000)
Unemployment (%) - White
Unemployment (%) - Black or African American
Unemployment (%) - Asian
Unemployment (%) - Hispanic or Latino
Unemployment (%) - American Indian and Alaska Native
Unemployment (%) - Multirace
Unemployment (%) - Other Race
Population density (people per square mile)
Population - Males (%)
Population - Females (%)
Population - Males (%) - White
Population - Males (%) - Black or African American
Population - Males (%) - Asian
Population - Males (%) - Hispanic or Latino
Population - Males (%) - American Indian and Alaska Native
Population - Males (%) - Multirace
Population - Males (%) - Other Race
Population - Females (%) - White
Population - Females (%) - Black or African American
Population - Females (%) - Asian
Population - Females (%) - Hispanic or Latino
Population - Females (%) - American Indian and Alaska Native
Population - Females (%) - Multirace
Population - Females (%) - Other Race
Coronavirus confirmed cases (Jun 19, 2024)
Deaths caused by coronavirus (Jun 19, 2024)
Coronavirus confirmed cases (per 100k population) (Jun 19, 2024)
Deaths caused by coronavirus (per 100k population) (Jun 19, 2024)
Daily increase in number of cases (Jun 19, 2024)
Weekly increase in number of cases (Jun 19, 2024)
Cases doubled (in days) (Jun 19, 2024)
Hospitalized patients (Apr 18, 2022)
Negative test results (Apr 18, 2022)
Total test results (Apr 18, 2022)
COVID Vaccine doses distributed (per 100k population) (Sep 19, 2023)
COVID Vaccine doses administered (per 100k population) (Sep 19, 2023)
COVID Vaccine doses distributed (Sep 19, 2023)
COVID Vaccine doses administered (Sep 19, 2023)
Likely homosexual households (%)
Likely homosexual households (% change since 2000)
Likely homosexual households - Lesbian couples (%)
Likely homosexual households - Lesbian couples (% change since 2000)
Likely homosexual households - Gay men (%)
Likely homosexual households - Gay men (% change since 2000)
Cost of living index
Median gross rent ($)
Median contract rent ($)
Median monthly housing costs ($)
Median house or condo value ($)
Median house or condo value ($ change since 2000)
Mean house or condo value by units in structure - 1, detached ($)
Mean house or condo value by units in structure - 1, attached ($)
Mean house or condo value by units in structure - 2 ($)
Mean house or condo value by units in structure by units in structure - 3 or 4 ($)
Mean house or condo value by units in structure - 5 or more ($)
Mean house or condo value by units in structure - Boat, RV, van, etc. ($)
Mean house or condo value by units in structure - Mobile home ($)
Median house or condo value ($) - White
Median house or condo value ($) - Black or African American
Median house or condo value ($) - Asian
Median house or condo value ($) - Hispanic or Latino
Median house or condo value ($) - American Indian and Alaska Native
Median house or condo value ($) - Multirace
Median house or condo value ($) - Other Race
Median resident age
Resident age diversity
Median resident age - Males
Median resident age - Females
Median resident age - White
Median resident age - Black or African American
Median resident age - Asian
Median resident age - Hispanic or Latino
Median resident age - American Indian and Alaska Native
Median resident age - Multirace
Median resident age - Other Race
Median resident age - Males - White
Median resident age - Males - Black or African American
Median resident age - Males - Asian
Median resident age - Males - Hispanic or Latino
Median resident age - Males - American Indian and Alaska Native
Median resident age - Males - Multirace
Median resident age - Males - Other Race
Median resident age - Females - White
Median resident age - Females - Black or African American
Median resident age - Females - Asian
Median resident age - Females - Hispanic or Latino
Median resident age - Females - American Indian and Alaska Native
Median resident age - Females - Multirace
Median resident age - Females - Other Race
Commute - mean travel time to work (minutes)
Travel time to work - Less than 5 minutes (%)
Travel time to work - Less than 5 minutes (% change since 2000)
Travel time to work - 5 to 9 minutes (%)
Travel time to work - 5 to 9 minutes (% change since 2000)
Travel time to work - 10 to 19 minutes (%)
Travel time to work - 10 to 19 minutes (% change since 2000)
Travel time to work - 20 to 29 minutes (%)
Travel time to work - 20 to 29 minutes (% change since 2000)
Travel time to work - 30 to 39 minutes (%)
Travel time to work - 30 to 39 minutes (% change since 2000)
Travel time to work - 40 to 59 minutes (%)
Travel time to work - 40 to 59 minutes (% change since 2000)
Travel time to work - 60 to 89 minutes (%)
Travel time to work - 60 to 89 minutes (% change since 2000)
Travel time to work - 90 or more minutes (%)
Travel time to work - 90 or more minutes (% change since 2000)
Marital status - Never married (%)
Marital status - Now married (%)
Marital status - Separated (%)
Marital status - Widowed (%)
Marital status - Divorced (%)
Median family income ($)
Median family income (% change since 2000)
Median non-family income ($)
Median non-family income (% change since 2000)
Median per capita income ($)
Median per capita income (% change since 2000)
Median family income ($) - White
Median family income ($) - Black or African American
Median family income ($) - Asian
Median family income ($) - Hispanic or Latino
Median family income ($) - American Indian and Alaska Native
Median family income ($) - Multirace
Median family income ($) - Other Race
Median year house/condo built
Median year apartment built
Year house built - Built 2005 or later (%)
Year house built - Built 2000 to 2004 (%)
Year house built - Built 1990 to 1999 (%)
Year house built - Built 1980 to 1989 (%)
Year house built - Built 1970 to 1979 (%)
Year house built - Built 1960 to 1969 (%)
Year house built - Built 1950 to 1959 (%)
Year house built - Built 1940 to 1949 (%)
Year house built - Built 1939 or earlier (%)
Average household size
Household density (households per square mile)
Average household size - White
Average household size - Black or African American
Average household size - Asian
Average household size - Hispanic or Latino
Average household size - American Indian and Alaska Native
Average household size - Multirace
Average household size - Other Race
Occupied housing units (%)
Vacant housing units (%)
Owner occupied housing units (%)
Renter occupied housing units (%)
Vacancy status - For rent (%)
Vacancy status - For sale only (%)
Vacancy status - Rented or sold, not occupied (%)
Vacancy status - For seasonal, recreational, or occasional use (%)
Vacancy status - For migrant workers (%)
Vacancy status - Other vacant (%)
Residents with income below the poverty level (%)
Residents with income below 50% of the poverty level (%)
Children below poverty level (%)
Poor families by family type - Married-couple family (%)
Poor families by family type - Male, no wife present (%)
Poor families by family type - Female, no husband present (%)
Poverty status for native-born residents (%)
Poverty status for foreign-born residents (%)
Poverty among high school graduates not in families (%)
Poverty among people who did not graduate high school not in families (%)
Residents with income below the poverty level (%) - White
Residents with income below the poverty level (%) - Black or African American
Residents with income below the poverty level (%) - Asian
Residents with income below the poverty level (%) - Hispanic or Latino
Residents with income below the poverty level (%) - American Indian and Alaska Native
Residents with income below the poverty level (%) - Multirace
Residents with income below the poverty level (%) - Other Race
Air pollution - Air Quality Index (AQI)
Air pollution - CO
Air pollution - NO2
Air pollution - SO2
Air pollution - Ozone
Air pollution - PM10
Air pollution - PM25
Air pollution - Pb
Crime - Murders per 100,000 population
Crime - Rapes per 100,000 population
Crime - Robberies per 100,000 population
Crime - Assaults per 100,000 population
Crime - Burglaries per 100,000 population
Crime - Thefts per 100,000 population
Crime - Auto thefts per 100,000 population
Crime - Arson per 100,000 population
Crime - City-data.com crime index
Crime - Violent crime index
Crime - Property crime index
Crime - Murders per 100,000 population (5 year average)
Crime - Rapes per 100,000 population (5 year average)
Crime - Robberies per 100,000 population (5 year average)
Crime - Assaults per 100,000 population (5 year average)
Crime - Burglaries per 100,000 population (5 year average)
Crime - Thefts per 100,000 population (5 year average)
Crime - Auto thefts per 100,000 population (5 year average)
Crime - Arson per 100,000 population (5 year average)
Crime - City-data.com crime index (5 year average)
Crime - Violent crime index (5 year average)
Crime - Property crime index (5 year average)
1996 Presidential Elections Results (%) - Democratic Party (Clinton)
1996 Presidential Elections Results (%) - Republican Party (Dole)
1996 Presidential Elections Results (%) - Other
2000 Presidential Elections Results (%) - Democratic Party (Gore)
2000 Presidential Elections Results (%) - Republican Party (Bush)
2000 Presidential Elections Results (%) - Other
2004 Presidential Elections Results (%) - Democratic Party (Kerry)
2004 Presidential Elections Results (%) - Republican Party (Bush)
2004 Presidential Elections Results (%) - Other
2008 Presidential Elections Results (%) - Democratic Party (Obama)
2008 Presidential Elections Results (%) - Republican Party (McCain)
2008 Presidential Elections Results (%) - Other
2012 Presidential Elections Results (%) - Democratic Party (Obama)
2012 Presidential Elections Results (%) - Republican Party (Romney)
2012 Presidential Elections Results (%) - Other
2016 Presidential Elections Results (%) - Democratic Party (Clinton)
2016 Presidential Elections Results (%) - Republican Party (Trump)
2016 Presidential Elections Results (%) - Other
2020 Presidential Elections Results (%) - Democratic Party (Biden)
2020 Presidential Elections Results (%) - Republican Party (Trump)
2020 Presidential Elections Results (%) - Other
Ancestries Reported - Arab (%)
Ancestries Reported - Czech (%)
Ancestries Reported - Danish (%)
Ancestries Reported - Dutch (%)
Ancestries Reported - English (%)
Ancestries Reported - French (%)
Ancestries Reported - French Canadian (%)
Ancestries Reported - German (%)
Ancestries Reported - Greek (%)
Ancestries Reported - Hungarian (%)
Ancestries Reported - Irish (%)
Ancestries Reported - Italian (%)
Ancestries Reported - Lithuanian (%)
Ancestries Reported - Norwegian (%)
Ancestries Reported - Polish (%)
Ancestries Reported - Portuguese (%)
Ancestries Reported - Russian (%)
Ancestries Reported - Scotch-Irish (%)
Ancestries Reported - Scottish (%)
Ancestries Reported - Slovak (%)
Ancestries Reported - Subsaharan African (%)
Ancestries Reported - Swedish (%)
Ancestries Reported - Swiss (%)
Ancestries Reported - Ukrainian (%)
Ancestries Reported - United States (%)
Ancestries Reported - Welsh (%)
Ancestries Reported - West Indian (%)
Ancestries Reported - Other (%)
Educational Attainment - No schooling completed (%)
Educational Attainment - Less than high school (%)
Educational Attainment - High school or equivalent (%)
Educational Attainment - Less than 1 year of college (%)
Educational Attainment - 1 or more years of college (%)
Educational Attainment - Associate degree (%)
Educational Attainment - Bachelor's degree (%)
Educational Attainment - Master's degree (%)
Educational Attainment - Professional school degree (%)
Educational Attainment - Doctorate degree (%)
School Enrollment - Nursery, preschool (%)
School Enrollment - Kindergarten (%)
School Enrollment - Grade 1 to 4 (%)
School Enrollment - Grade 5 to 8 (%)
School Enrollment - Grade 9 to 12 (%)
School Enrollment - College undergrad (%)
School Enrollment - Graduate or professional (%)
School Enrollment - Not enrolled in school (%)
School enrollment - Public schools (%)
School enrollment - Private schools (%)
School enrollment - Not enrolled (%)
Median number of rooms in houses and condos
Median number of rooms in apartments
Housing units lacking complete plumbing facilities (%)
Housing units lacking complete kitchen facilities (%)
Density of houses
Urban houses (%)
Rural houses (%)
Households with people 60 years and over (%)
Households with people 65 years and over (%)
Households with people 75 years and over (%)
Households with one or more nonrelatives (%)
Households with no nonrelatives (%)
Population in households (%)
Family households (%)
Nonfamily households (%)
Population in families (%)
Family households with own children (%)
Median number of bedrooms in owner occupied houses
Mean number of bedrooms in owner occupied houses
Median number of bedrooms in renter occupied houses
Mean number of bedrooms in renter occupied houses
Median number of vehichles in owner occupied houses
Mean number of vehichles in owner occupied houses
Median number of vehichles in renter occupied houses
Mean number of vehichles in renter occupied houses
Mortgage status - with mortgage (%)
Mortgage status - with second mortgage (%)
Mortgage status - with home equity loan (%)
Mortgage status - with both second mortgage and home equity loan (%)
Mortgage status - without a mortgage (%)
Average family size
Average family size - White
Average family size - Black or African American
Average family size - Asian
Average family size - Hispanic or Latino
Average family size - American Indian and Alaska Native
Average family size - Multirace
Average family size - Other Race
Geographical mobility - Same house 1 year ago (%)
Geographical mobility - Moved within same county (%)
Geographical mobility - Moved from different county within same state (%)
Geographical mobility - Moved from different state (%)
Geographical mobility - Moved from abroad (%)
Place of birth - Born in state of residence (%)
Place of birth - Born in other state (%)
Place of birth - Native, outside of US (%)
Place of birth - Foreign born (%)
Housing units in structures - 1, detached (%)
Housing units in structures - 1, attached (%)
Housing units in structures - 2 (%)
Housing units in structures - 3 or 4 (%)
Housing units in structures - 5 to 9 (%)
Housing units in structures - 10 to 19 (%)
Housing units in structures - 20 to 49 (%)
Housing units in structures - 50 or more (%)
Housing units in structures - Mobile home (%)
Housing units in structures - Boat, RV, van, etc. (%)
House/condo owner moved in on average (years ago)
Renter moved in on average (years ago)
Year householder moved into unit - Moved in 1999 to March 2000 (%)
Year householder moved into unit - Moved in 1995 to 1998 (%)
Year householder moved into unit - Moved in 1990 to 1994 (%)
Year householder moved into unit - Moved in 1980 to 1989 (%)
Year householder moved into unit - Moved in 1970 to 1979 (%)
Year householder moved into unit - Moved in 1969 or earlier (%)
Means of transportation to work - Drove car alone (%)
Means of transportation to work - Carpooled (%)
Means of transportation to work - Public transportation (%)
Means of transportation to work - Bus or trolley bus (%)
Means of transportation to work - Streetcar or trolley car (%)
Means of transportation to work - Subway or elevated (%)
Means of transportation to work - Railroad (%)
Means of transportation to work - Ferryboat (%)
Means of transportation to work - Taxicab (%)
Means of transportation to work - Motorcycle (%)
Means of transportation to work - Bicycle (%)
Means of transportation to work - Walked (%)
Means of transportation to work - Other means (%)
Working at home (%)
Industry diversity
Most Common Industries - Agriculture, forestry, fishing and hunting, and mining (%)
Most Common Industries - Agriculture, forestry, fishing and hunting (%)
Most Common Industries - Mining, quarrying, and oil and gas extraction (%)
Most Common Industries - Construction (%)
Most Common Industries - Manufacturing (%)
Most Common Industries - Wholesale trade (%)
Most Common Industries - Retail trade (%)
Most Common Industries - Transportation and warehousing, and utilities (%)
Most Common Industries - Transportation and warehousing (%)
Most Common Industries - Utilities (%)
Most Common Industries - Information (%)
Most Common Industries - Finance and insurance, and real estate and rental and leasing (%)
Most Common Industries - Finance and insurance (%)
Most Common Industries - Real estate and rental and leasing (%)
Most Common Industries - Professional, scientific, and management, and administrative and waste management services (%)
Most Common Industries - Professional, scientific, and technical services (%)
Most Common Industries - Management of companies and enterprises (%)
Most Common Industries - Administrative and support and waste management services (%)
Most Common Industries - Educational services, and health care and social assistance (%)
Most Common Industries - Educational services (%)
Most Common Industries - Health care and social assistance (%)
Most Common Industries - Arts, entertainment, and recreation, and accommodation and food services (%)
Most Common Industries - Arts, entertainment, and recreation (%)
Most Common Industries - Accommodation and food services (%)
Most Common Industries - Other services, except public administration (%)
Most Common Industries - Public administration (%)
Occupation diversity
Most Common Occupations - Management, business, science, and arts occupations (%)
Most Common Occupations - Management, business, and financial occupations (%)
Most Common Occupations - Management occupations (%)
Most Common Occupations - Business and financial operations occupations (%)
Most Common Occupations - Computer, engineering, and science occupations (%)
Most Common Occupations - Computer and mathematical occupations (%)
Most Common Occupations - Architecture and engineering occupations (%)
Most Common Occupations - Life, physical, and social science occupations (%)
Most Common Occupations - Education, legal, community service, arts, and media occupations (%)
Most Common Occupations - Community and social service occupations (%)
Most Common Occupations - Legal occupations (%)
Most Common Occupations - Education, training, and library occupations (%)
Most Common Occupations - Arts, design, entertainment, sports, and media occupations (%)
Most Common Occupations - Healthcare practitioners and technical occupations (%)
Most Common Occupations - Health diagnosing and treating practitioners and other technical occupations (%)
Most Common Occupations - Health technologists and technicians (%)
Most Common Occupations - Service occupations (%)
Most Common Occupations - Healthcare support occupations (%)
Most Common Occupations - Protective service occupations (%)
Most Common Occupations - Fire fighting and prevention, and other protective service workers including supervisors (%)
Most Common Occupations - Law enforcement workers including supervisors (%)
Most Common Occupations - Food preparation and serving related occupations (%)
Most Common Occupations - Building and grounds cleaning and maintenance occupations (%)
Most Common Occupations - Personal care and service occupations (%)
Most Common Occupations - Sales and office occupations (%)
Most Common Occupations - Sales and related occupations (%)
Most Common Occupations - Office and administrative support occupations (%)
Most Common Occupations - Natural resources, construction, and maintenance occupations (%)
Most Common Occupations - Farming, fishing, and forestry occupations (%)
Most Common Occupations - Construction and extraction occupations (%)
Most Common Occupations - Installation, maintenance, and repair occupations (%)
Most Common Occupations - Production, transportation, and material moving occupations (%)
Most Common Occupations - Production occupations (%)
Most Common Occupations - Transportation occupations (%)
Most Common Occupations - Material moving occupations (%)
People in Group quarters - Institutionalized population (%)
People in Group quarters - Correctional institutions (%)
People in Group quarters - Federal prisons and detention centers (%)
People in Group quarters - Halfway houses (%)
People in Group quarters - Local jails and other confinement facilities (including police lockups) (%)
People in Group quarters - Military disciplinary barracks (%)
People in Group quarters - State prisons (%)
People in Group quarters - Other types of correctional institutions (%)
People in Group quarters - Nursing homes (%)
People in Group quarters - Hospitals/wards, hospices, and schools for the handicapped (%)
People in Group quarters - Hospitals/wards and hospices for chronically ill (%)
People in Group quarters - Hospices or homes for chronically ill (%)
People in Group quarters - Military hospitals or wards for chronically ill (%)
People in Group quarters - Other hospitals or wards for chronically ill (%)
People in Group quarters - Hospitals or wards for drug/alcohol abuse (%)
People in Group quarters - Mental (Psychiatric) hospitals or wards (%)
People in Group quarters - Schools, hospitals, or wards for the mentally retarded (%)
People in Group quarters - Schools, hospitals, or wards for the physically handicapped (%)
People in Group quarters - Institutions for the deaf (%)
People in Group quarters - Institutions for the blind (%)
People in Group quarters - Orthopedic wards and institutions for the physically handicapped (%)
People in Group quarters - Wards in general hospitals for patients who have no usual home elsewhere (%)
People in Group quarters - Wards in military hospitals for patients who have no usual home elsewhere (%)
People in Group quarters - Juvenile institutions (%)
People in Group quarters - Long-term care (%)
People in Group quarters - Homes for abused, dependent, and neglected children (%)
People in Group quarters - Residential treatment centers for emotionally disturbed children (%)
People in Group quarters - Training schools for juvenile delinquents (%)
People in Group quarters - Short-term care, detention or diagnostic centers for delinquent children (%)
People in Group quarters - Type of juvenile institution unknown (%)
People in Group quarters - Noninstitutionalized population (%)
People in Group quarters - College dormitories (includes college quarters off campus) (%)
People in Group quarters - Military quarters (%)
People in Group quarters - On base (%)
People in Group quarters - Barracks, unaccompanied personnel housing (UPH), (Enlisted/Officer), ;and similar group living quarters for military personnel (%)
People in Group quarters - Transient quarters for temporary residents (%)
People in Group quarters - Military ships (%)
People in Group quarters - Group homes (%)
People in Group quarters - Homes or halfway houses for drug/alcohol abuse (%)
People in Group quarters - Homes for the mentally ill (%)
People in Group quarters - Homes for the mentally retarded (%)
People in Group quarters - Homes for the physically handicapped (%)
People in Group quarters - Other group homes (%)
People in Group quarters - Religious group quarters (%)
People in Group quarters - Dormitories (%)
People in Group quarters - Agriculture workers' dormitories on farms (%)
People in Group quarters - Job Corps and vocational training facilities (%)
People in Group quarters - Other workers' dormitories (%)
People in Group quarters - Crews of maritime vessels (%)
People in Group quarters - Other nonhousehold living situations (%)
People in Group quarters - Other noninstitutional group quarters (%)
Residents speaking English at home (%)
Residents speaking English at home - Born in the United States (%)
Residents speaking English at home - Native, born elsewhere (%)
Residents speaking English at home - Foreign born (%)
Residents speaking Spanish at home (%)
Residents speaking Spanish at home - Born in the United States (%)
Residents speaking Spanish at home - Native, born elsewhere (%)
Residents speaking Spanish at home - Foreign born (%)
Residents speaking other language at home (%)
Residents speaking other language at home - Born in the United States (%)
Residents speaking other language at home - Native, born elsewhere (%)
Residents speaking other language at home - Foreign born (%)
Class of Workers - Employee of private company (%)
Class of Workers - Self-employed in own incorporated business (%)
Class of Workers - Private not-for-profit wage and salary workers (%)
Class of Workers - Local government workers (%)
Class of Workers - State government workers (%)
Class of Workers - Federal government workers (%)
Class of Workers - Self-employed workers in own not incorporated business and Unpaid family workers (%)
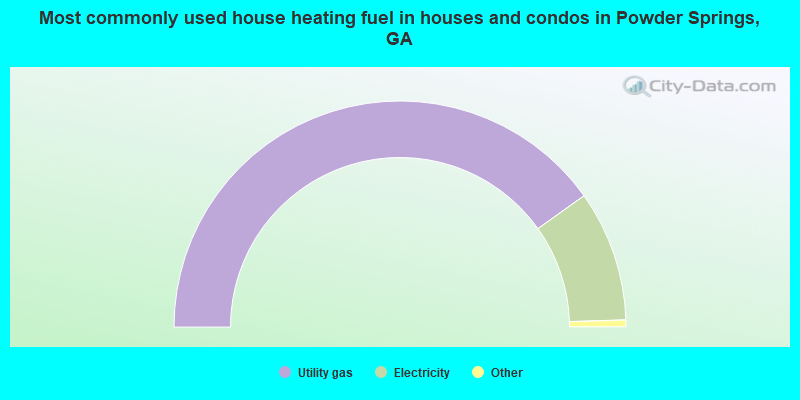
House heating fuel used in houses and condos - Utility gas (%)
House heating fuel used in houses and condos - Bottled, tank, or LP gas (%)
House heating fuel used in houses and condos - Electricity (%)
House heating fuel used in houses and condos - Fuel oil, kerosene, etc. (%)
House heating fuel used in houses and condos - Coal or coke (%)
House heating fuel used in houses and condos - Wood (%)
House heating fuel used in houses and condos - Solar energy (%)
House heating fuel used in houses and condos - Other fuel (%)
House heating fuel used in houses and condos - No fuel used (%)
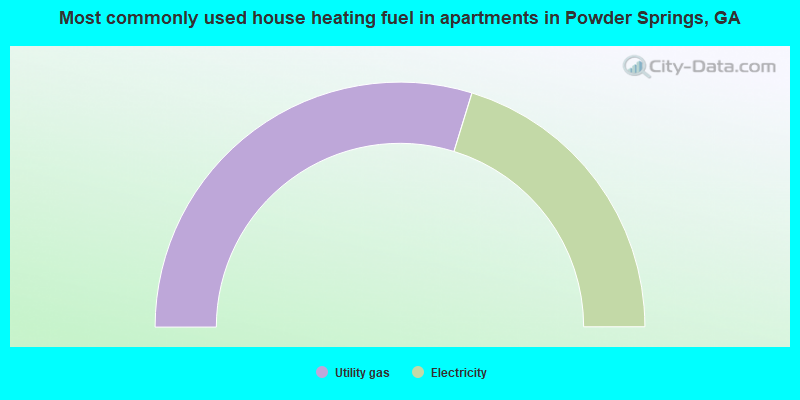
House heating fuel used in apartments - Utility gas (%)
House heating fuel used in apartments - Bottled, tank, or LP gas (%)
House heating fuel used in apartments - Electricity (%)
House heating fuel used in apartments - Fuel oil, kerosene, etc. (%)
House heating fuel used in apartments - Coal or coke (%)
House heating fuel used in apartments - Wood (%)
House heating fuel used in apartments - Solar energy (%)
House heating fuel used in apartments - Other fuel (%)
House heating fuel used in apartments - No fuel used (%)
Armed forces status - In Armed Forces (%)
Armed forces status - Civilian (%)
Armed forces status - Civilian - Veteran (%)
Armed forces status - Civilian - Nonveteran (%)
Fatal accidents locations in years 2005-2021
Fatal accidents locations in 2005
Fatal accidents locations in 2006
Fatal accidents locations in 2007
Fatal accidents locations in 2008
Fatal accidents locations in 2009
Fatal accidents locations in 2010
Fatal accidents locations in 2011
Fatal accidents locations in 2012
Fatal accidents locations in 2013
Fatal accidents locations in 2014
Fatal accidents locations in 2015
Fatal accidents locations in 2016
Fatal accidents locations in 2017
Fatal accidents locations in 2018
Fatal accidents locations in 2019
Fatal accidents locations in 2020
Fatal accidents locations in 2021
Alcohol use - People drinking some alcohol every month (%)
Alcohol use - People not drinking at all (%)
Alcohol use - Average days/month drinking alcohol
Alcohol use - Average drinks/week
Alcohol use - Average days/year people drink much
Audiometry - Average condition of hearing (%)
Audiometry - People that can hear a whisper from across a quiet room (%)
Audiometry - People that can hear normal voice from across a quiet room (%)
Audiometry - Ears ringing, roaring, buzzing (%)
Audiometry - Had a job exposure to loud noise (%)
Audiometry - Had off-work exposure to loud noise (%)
Blood Pressure & Cholesterol - Has high blood pressure (%)
Blood Pressure & Cholesterol - Checking blood pressure at home (%)
Blood Pressure & Cholesterol - Frequently checking blood cholesterol (%)
Blood Pressure & Cholesterol - Has high cholesterol level (%)
Consumer Behavior - Money monthly spent on food at supermarket/grocery store
Consumer Behavior - Money monthly spent on food at other stores
Consumer Behavior - Money monthly spent on eating out
Consumer Behavior - Money monthly spent on carryout/delivered foods
Consumer Behavior - Income spent on food at supermarket/grocery store (%)
Consumer Behavior - Income spent on food at other stores (%)
Consumer Behavior - Income spent on eating out (%)
Consumer Behavior - Income spent on carryout/delivered foods (%)
Current Health Status - General health condition (%)
Current Health Status - Blood donors (%)
Current Health Status - Has blood ever tested for HIV virus (%)
Current Health Status - Left-handed people (%)
Dermatology - People using sunscreen (%)
Diabetes - Diabetics (%)
Diabetes - Had a blood test for high blood sugar (%)
Diabetes - People taking insulin (%)
Diet Behavior & Nutrition - Diet health (%)
Diet Behavior & Nutrition - Milk product consumption (# of products/month)
Diet Behavior & Nutrition - Meals not home prepared (#/week)
Diet Behavior & Nutrition - Meals from fast food or pizza place (#/week)
Diet Behavior & Nutrition - Ready-to-eat foods (#/month)
Diet Behavior & Nutrition - Frozen meals/pizza (#/month)
Drug Use - People that ever used marijuana or hashish (%)
Drug Use - Ever used hard drugs (%)
Drug Use - Ever used any form of cocaine (%)
Drug Use - Ever used heroin (%)
Drug Use - Ever used methamphetamine (%)
Health Insurance - People covered by health insurance (%)
Kidney Conditions-Urology - Avg. # of times urinating at night
Medical Conditions - People with asthma (%)
Medical Conditions - People with anemia (%)
Medical Conditions - People with psoriasis (%)
Medical Conditions - People with overweight (%)
Medical Conditions - Elderly people having difficulties in thinking or remembering (%)
Medical Conditions - People who ever received blood transfusion (%)
Medical Conditions - People having trouble seeing even with glass/contacts (%)
Medical Conditions - People with arthritis (%)
Medical Conditions - People with gout (%)
Medical Conditions - People with congestive heart failure (%)
Medical Conditions - People with coronary heart disease (%)
Medical Conditions - People with angina pectoris (%)
Medical Conditions - People who ever had heart attack (%)
Medical Conditions - People who ever had stroke (%)
Medical Conditions - People with emphysema (%)
Medical Conditions - People with thyroid problem (%)
Medical Conditions - People with chronic bronchitis (%)
Medical Conditions - People with any liver condition (%)
Medical Conditions - People who ever had cancer or malignancy (%)
Mental Health - People who have little interest in doing things (%)
Mental Health - People feeling down, depressed, or hopeless (%)
Mental Health - People who have trouble sleeping or sleeping too much (%)
Mental Health - People feeling tired or having little energy (%)
Mental Health - People with poor appetite or overeating (%)
Mental Health - People feeling bad about themself (%)
Mental Health - People who have trouble concentrating on things (%)
Mental Health - People moving or speaking slowly or too fast (%)
Mental Health - People having thoughts they would be better off dead (%)
Oral Health - Average years since last visit a dentist
Oral Health - People embarrassed because of mouth (%)
Oral Health - People with gum disease (%)
Oral Health - General health of teeth and gums (%)
Oral Health - Average days a week using dental floss/device
Oral Health - Average days a week using mouthwash for dental problem
Oral Health - Average number of teeth
Pesticide Use - Households using pesticides to control insects (%)
Pesticide Use - Households using pesticides to kill weeds (%)
Physical Activity - People doing vigorous-intensity work activities (%)
Physical Activity - People doing moderate-intensity work activities (%)
Physical Activity - People walking or bicycling (%)
Physical Activity - People doing vigorous-intensity recreational activities (%)
Physical Activity - People doing moderate-intensity recreational activities (%)
Physical Activity - Average hours a day doing sedentary activities
Physical Activity - Average hours a day watching TV or videos
Physical Activity - Average hours a day using computer
Physical Functioning - People having limitations keeping them from working (%)
Physical Functioning - People limited in amount of work they can do (%)
Physical Functioning - People that need special equipment to walk (%)
Physical Functioning - People experiencing confusion/memory problems (%)
Physical Functioning - People requiring special healthcare equipment (%)
Prescription Medications - Average number of prescription medicines taking
Preventive Aspirin Use - Adults 40+ taking low-dose aspirin (%)
Reproductive Health - Vaginal deliveries (%)
Reproductive Health - Cesarean deliveries (%)
Reproductive Health - Deliveries resulted in a live birth (%)
Reproductive Health - Pregnancies resulted in a delivery (%)
Reproductive Health - Women breastfeeding newborns (%)
Reproductive Health - Women that had a hysterectomy (%)
Reproductive Health - Women that had both ovaries removed (%)
Reproductive Health - Women that have ever taken birth control pills (%)
Reproductive Health - Women taking birth control pills (%)
Reproductive Health - Women that have ever used Depo-Provera or injectables (%)
Reproductive Health - Women that have ever used female hormones (%)
Sexual Behavior - People 18+ that ever had sex (vaginal, anal, or oral) (%)
Sexual Behavior - Males 18+ that ever had vaginal sex with a woman (%)
Sexual Behavior - Males 18+ that ever performed oral sex on a woman (%)
Sexual Behavior - Males 18+ that ever had anal sex with a woman (%)
Sexual Behavior - Males 18+ that ever had any sex with a man (%)
Sexual Behavior - Females 18+ that ever had vaginal sex with a man (%)
Sexual Behavior - Females 18+ that ever performed oral sex on a man (%)
Sexual Behavior - Females 18+ that ever had anal sex with a man (%)
Sexual Behavior - Females 18+ that ever had any kind of sex with a woman (%)
Sexual Behavior - Average age people first had sex
Sexual Behavior - Average number of female sex partners in lifetime (males 18+)
Sexual Behavior - Average number of female vaginal sex partners in lifetime (males 18+)
Sexual Behavior - Average age people first performed oral sex on a woman (18+)
Sexual Behavior - Average number of woman performed oral sex on in lifetime (18+)
Sexual Behavior - Average number of male sex partners in lifetime (males 18+)
Sexual Behavior - Average number of male anal sex partners in lifetime (males 18+)
Sexual Behavior - Average age people first performed oral sex on a man (18+)
Sexual Behavior - Average number of male oral sex partners in lifetime (18+)
Sexual Behavior - People using protection when performing oral sex (%)
Sexual Behavior - Average number of times people have vaginal or anal sex a year
Sexual Behavior - People having sex without condom (%)
Sexual Behavior - Average number of male sex partners in lifetime (females 18+)
Sexual Behavior - Average number of male vaginal sex partners in lifetime (females 18+)
Sexual Behavior - Average number of female sex partners in lifetime (females 18+)
Sexual Behavior - Circumcised males 18+ (%)
Sleep Disorders - Average hours sleeping at night
Sleep Disorders - People that has trouble sleeping (%)
Smoking-Cigarette Use - People smoking cigarettes (%)
Taste & Smell - People 40+ having problems with smell (%)
Taste & Smell - People 40+ having problems with taste (%)
Taste & Smell - People 40+ that ever had wisdom teeth removed (%)
Taste & Smell - People 40+ that ever had tonsils teeth removed (%)
Taste & Smell - People 40+ that ever had a loss of consciousness because of a head injury (%)
Taste & Smell - People 40+ that ever had a broken nose or other serious injury to face or skull (%)
Taste & Smell - People 40+ that ever had two or more sinus infections (%)
Weight - Average height (inches)
Weight - Average weight (pounds)
Weight - Average BMI
Weight - People that are obese (%)
Weight - People that ever were obese (%)
Weight - People trying to lose weight (%)
Officers per 1,000 residents here:
1.82Georgia average:
2.63
Latest news from Powder Springs, GA collected exclusively by city-data.com from local newspapers, TV, and radio stations
Ancestries: English (6.2%), American (5.5%), Nigerian (2.9%), Haitian (2.1%), Irish (1.7%), Ethiopian (1.6%).
Current Local Time:
Land area: 6.34 square miles.
Population density: 2,735 people per square mile (average).
2,263 residents are foreign born (8.4% Latin America , 2.4% Africa ).
This city:
13.3%Georgia:
10.4%
Median real estate property taxes paid for housing units with mortgages in 2022: $2,207 (0.7%)Median real estate property taxes paid for housing units with no mortgage in 2022: $1,539 (0.7%)
Nearest city with pop. 50,000+: Marietta, GA
Nearest city with pop. 200,000+: Atlanta, GA
Nearest city with pop. 1,000,000+: Chicago, IL
Nearest cities:
Latitude: 33.87 N, Longitude: 84.68 W
Nickname or alias (official or unofficial): P-Town
Daytime population change due to commuting: -3,145 (-18.4%)Workers who live and work in this city: 2,170 (23.6%)
Property values in Powder Springs, GA
Single-family new house construction building permits:
2022: 86 buildings , average cost: $204,7002021: 118 buildings , average cost: $191,8002020: 111 buildings , average cost: $190,0002019: 63 buildings , average cost: $218,6002018: 187 buildings , average cost: $185,4002017: 162 buildings , average cost: $187,8002016: 51 buildings , average cost: $190,9002015: 54 buildings , average cost: $251,6002014: 54 buildings , average cost: $311,1002013: 16 buildings , average cost: $374,2002012: 22 buildings , average cost: $379,5002010: 23 buildings , average cost: $145,1002009: 5 buildings , average cost: $156,4002008: 49 buildings , average cost: $158,3002007: 86 buildings , average cost: $133,3002006: 129 buildings , average cost: $97,5002005: 136 buildings , average cost: $101,4002004: 135 buildings , average cost: $98,8002003: 170 buildings , average cost: $123,7002002: 238 buildings , average cost: $102,0002001: 117 buildings , average cost: $118,9002000: 109 buildings , average cost: $82,9001999: 124 buildings , average cost: $59,4001998: 102 buildings , average cost: $56,9001997: 162 buildings , average cost: $58,500Unemployment in December 2023:
Population change in the 1990s: +5,526 (+79.5%).
Most common occupations in Powder Springs, GA (%)
Both Males Females
Other office and administrative support workers, including supervisors (4.8%)
Other sales and related occupations, including supervisors (4.5%)
Other management occupations, except farmers and farm managers (4.3%)
Material recording, scheduling, dispatching, and distributing workers (4.3%)
Secretaries and administrative assistants (4.0%)
Retail sales workers, except cashiers (3.5%)
Customer service representatives (3.3%)
Other sales and related occupations, including supervisors (5.5%)
Electrical equipment mechanics and other installation, maintenance, and repair workers, including supervisors (5.1%)
Material recording, scheduling, dispatching, and distributing workers (5.0%)
Retail sales workers, except cashiers (4.9%)
Other management occupations, except farmers and farm managers (4.4%)
Driver/sales workers and truck drivers (4.2%)
Vehicle and mobile equipment mechanics, installers, and repairers (3.5%)
Secretaries and administrative assistants (7.8%)
Other office and administrative support workers, including supervisors (6.4%)
Preschool, kindergarten, elementary, and middle school teachers (6.0%)
Cashiers (4.3%)
Other management occupations, except farmers and farm managers (4.2%)
Child care workers (4.1%)
Customer service representatives (4.0%)
Tornado activity:
Powder Springs-area historical tornado activity is slightly above Georgia state average. It is 74% greater than the overall U.S. average.
On 11/22/1992, a category F4 (max. wind speeds 207-260 mph) tornado 3.8 miles away from the Powder Springs city center injured 46 people and caused between $5,000,000 and $50,000,000 in damages.
On 3/27/1994, a category F4 tornado 27.1 miles away from the city center killed 3 people and injured 20 people and caused between $5,000,000 and $50,000,000 in damages.
Earthquake activity:
Powder Springs-area historical earthquake activity is significantly above Georgia state average. It is 65% greater than the overall U.S. average. On 4/29/2003 at 08:59:39, a magnitude 4.9 (4.4 MB, 4.6 MW, 4.9 LG, Class: Light, Intensity: IV - V) earthquake occurred 69.5 miles away from the city center On 8/2/1974 at 08:52:09, a magnitude 4.9 (4.3 MB, 4.9 LG) earthquake occurred 125.9 miles away from the city center On 4/29/2003 at 08:59:39, a magnitude 4.6 (4.6 MW, Depth: 12.3 mi) earthquake occurred 69.6 miles away from Powder Springs center On 1/18/1999 at 07:00:53, a magnitude 4.8 (4.8 MB, 4.0 LG, Depth: 0.6 mi) earthquake occurred 151.7 miles away from the city center On 11/30/1973 at 07:48:41, a magnitude 4.7 (4.7 MB, 4.6 ML) earthquake occurred 139.8 miles away from Powder Springs center On 12/12/2018 at 09:14:43, a magnitude 4.4 (4.4 MW, Depth: 4.9 mi) earthquake occurred 120.8 miles away from Powder Springs center Magnitude types: regional Lg-wave magnitude (LG), body-wave magnitude (MB), local magnitude (ML), moment magnitude (MW) Natural disasters: The number of natural disasters in Cobb County (14) is near the US average (15).Major Disasters (Presidential) Declared: 9Emergencies Declared: 4Floods: 4, Tornadoes: 4, Hurricanes: 3, Storms: 3, Winter Storms: 3, Heavy Rains: 2, Winds: 2, Drought: 1, Snowfall: 1, Other: 1 (Note: some incidents may be assigned to more than one category). Hospitals and medical centers in Powder Springs: WALTON NURSING HOSPICE SERVICES INC (3401 FLORENCE CIRCLE, SUITE 200) POWDER SPRINGS NURSING AND REHAB CENTER (3460 POWDER SPRINGS ROAD)
Other hospitals and medical centers near Powder Springs: FMC DIALYSIS SERVICES SOUTH COBB (Dialysis Facility, about 2 miles away; AUSTELL, GA)
COLONIAL SPRINGS DIALYSIS (Dialysis Facility, about 3 miles away; AUSTELL, GA)
ANDERSON MILL HEALTH AND REHABILITATION CENTER (Nursing Home, about 4 miles away; AUSTELL, GA)
PRESBYTERIAN VILLAGE (Nursing Home, about 4 miles away; AUSTELL, GA)
UNIHEALTH POST-ACUTE CARE - AUSTELL (Nursing Home, about 5 miles away; AUSTELL, GA)
COBB DIALYSIS (Dialysis Facility, about 5 miles away; AUSTELL, GA)
WELLSTAR COBB HOSPITAL (about 5 miles away; AUSTELL, GA)
Amtrak station near Powder Springs: 18 miles: ATLANTA (1688 PEACHTREE ST. NW) Services: ticket office, partially wheelchair accessible, enclosed waiting area, public restrooms, public payphones, vending machines, paid short-term parking, paid long-term parking, taxi stand, public transit connection.
Colleges/universities with over 2000 students nearest to Powder Springs:
Chattahoochee Technical College (about 9 miles; Marietta, GA ; Full-time enrollment: 8,173)
Southern Polytechnic State University (about 11 miles; Marietta, GA ; FT enrollment: 5,258)
Kennesaw State University (about 14 miles; Kennesaw, GA ; FT enrollment: 21,215)
Morehouse College (about 18 miles; Atlanta, GA ; FT enrollment: 2,379)
Clark Atlanta University (about 18 miles; Atlanta, GA ; FT enrollment: 3,201)
Georgia Institute of Technology-Main Campus (about 18 miles; Atlanta, GA ; FT enrollment: 24,183)
Spelman College (about 18 miles; Atlanta, GA ; FT enrollment: 2,383)
Public high schools in Powder Springs:
Private high schools in Powder Springs: TRINITY CHAPEL ACADEMY Students: 278, Location: 4665 MACLAND RD, Grades: KG-12)
PRAISE ACADEMY Students: 270, Location: 4052 HIRAM LITHIA SPRINGS RD, Grades: PK-12)
YOUTH CHRISTIAN SCHOOL Students: 154, Location: 4967 BROWNSVILLE RD, Grades: PK-12)
Biggest public elementary/middle schools in Powder Springs: LOVINGGOOD MIDDLE SCHOOL Students: 1,272, Location: 3825 LUTHER WARD RD, Grades: 6-8)J. A. DOBBINS MIDDLE SCHOOL Students: 914, Location: 637 WILLIAMS LAKE RD, Grades: 6-8)POWDER SPRINGS ELEMENTARY SCHOOL Students: 890, Location: 4570 GRADY GRIER DR, Grades: PK-5)VAUGHAN ELEMENTARY SCHOOL Students: 858, Location: 5950 NICHOLS RD, Grades: PK-5)VARNER ELEMENTARY SCHOOL Students: 833, Location: 4761 GAYDON RD, Grades: PK-5)BESSIE L. BAGGETT ELEMENTARY Students: 829, Location: 948 WILLIAMS LAKE RD, Grades: KG-5)TAPP MIDDLE SCHOOL Students: 826, Location: 3900 MACEDONIA RD, Grades: 6-8)STILL ELEMENTARY SCHOOL Students: 746, Location: 870 CASTEEL RD, Grades: PK-5)COMPTON ELEMENTARY SCHOOL Students: 529, Location: 3450 NEW MACLAND RD, Grades: KG-5)KEMP ELEMENTARY SCHOOL Location: 865 CORNER RD, Grades: PK-5)
Private elementary/middle school in Powder Springs: JUBILEE CHRISTIAN PREPARATORY ACADEMY Students: 32, Location: 3000 MACEDONIA RD, Grades: PK-1)
See full list of schools located in Powder Springs
Notable locations in Powder Springs: (A) , Austell Police Station (B) , Powder Springs City Hall (C) , Powder Springs Branch Cobb County Public Library (D) . Display/hide their locations on the map
Shopping Centers: (1) , West Cobb Plaza Shopping Center (2) . Display/hide their locations on the map
Church in Powder Springs: (A) . Display/hide its location on the map
Cemeteries: (1) , Meadows Cemetery (2) , New Hope Cemetery (3) , Powder Springs Cemetery (4) , Powder Springs City Cemetery (5) , Powder Springs Memorial Cemetery (6) , Powder Springs Methodist Cemetery (7) . Display/hide their locations on the map
Park in Powder Springs: (1) . Display/hide its location on the map
Birthplace of: Robyn Lively - Actress, Alexander S. Clay - Politician, Gerald McRath - Football player, Morris Almond - College basketball player (Rice Owls).
Cobb County has a predicted average indoor radon screening level greater than 4 pCi/L (pico curies per liter) - Highest Potential Drinking water stations with addresses in Powder Springs and their reported violations in the past:
PAPA WHEELYS SKATING RINK (Serves PA, Population served: 25, Groundwater):
Past monitoring violations:
One routine major monitoring violation
One minor monitoring violation
Average household size: This city:
2.9 peopleGeorgia:
2.6 people
Percentage of family households: This city:
75.6%Whole state:
68.5%
Percentage of households with unmarried partners: This city:
4.9%Whole state:
5.9%
Likely homosexual households (counted as self-reported same-sex unmarried-partner households)
Lesbian couples: 0.4% of all households Gay men: 0.4% of all households
People in group quarters in Powder Springs in 2010:
180 people in nursing facilities/skilled-nursing facilities
9 people in group homes intended for adults
5 people in group homes for juveniles (non-correctional)
People in group quarters in Powder Springs in 2000:
201 people in nursing homes
23 people in other noninstitutional group quarters
17 people in homes for the mentally ill
Banks with branches in Powder Springs (2011 data):
United Community Bank: Lost Mountain Crossing Branch at 5100 Dallas Highway, branch established on 1996/03/01; Powder Springs Branch at 1220 Richard Sailors Parkway, branch established on 1997/10/30. Info updated 2009/06/23: Bank assets: $6,977.4 mil, Deposits: $6,170.1 mil, headquarters in Blairsville, GA, negative income in the last year , Commercial Lending Specialization, 106 total offices , Holding Company: United Community Banks, Inc.
PNC Bank, National Association: Powder Springs Branch at 3720 New Macland Rd, branch established on 2005/05/23. Info updated 2012/03/20: Bank assets: $263,309.6 mil, Deposits: $197,343.0 mil, headquarters in Wilmington, DE, positive income , Commercial Lending Specialization, 3085 total offices , Holding Company: Pnc Financial Services Group, Inc., The
JPMorgan Chase Bank, National Association: Sailors Road Branch at 3753 New Macland Rd., Suite 600, branch established on 2002/04/01. Info updated 2011/11/10: Bank assets: $1,811,678.0 mil, Deposits: $1,190,738.0 mil, headquarters in Columbus, OH, positive income , International Specialization, 5577 total offices , Holding Company: Jpmorgan Chase & Co.
SunTrust Bank: Lost Mountain Crossing Branch at 5100 Dallas Hiwy, branch established on 1996/09/26. Info updated 2010/05/27: Bank assets: $171,291.7 mil, Deposits: $129,833.2 mil, headquarters in Atlanta, GA, positive income , Commercial Lending Specialization, 1716 total offices , Holding Company: Suntrust Banks, Inc.
Fifth Third Bank: Varner Crossing Bank Mart Branch at 4150 Macland Road, branch established on 2009/08/27. Info updated 2009/10/05: Bank assets: $114,540.4 mil, Deposits: $89,689.1 mil, headquarters in Cincinnati, OH, positive income , Commercial Lending Specialization, 1378 total offices , Holding Company: Fifth Third Bancorp
First Citizens Bank and Trust Company, Inc.: Powder Springs Branch at 3270 Florence Road, branch established on 2005/09/12. Info updated 2011/08/24: Bank assets: $8,104.0 mil, Deposits: $6,880.8 mil, headquarters in Columbia, SC, positive income , 197 total offices , Holding Company: First Citizens Bancorporation, Inc.
Wells Fargo Bank, National Association: Powder Springs Branch at 1102 Richard D Sailors Pkwy, branch established on 1985/03/18. Info updated 2011/04/05: Bank assets: $1,161,490.0 mil, Deposits: $905,653.0 mil, headquarters in Sioux Falls, SD, positive income , 6395 total offices , Holding Company: Wells Fargo & Company
For population 15 years and over in Powder Springs:
Never married: 32.6%Now married: 49.0%Separated: 1.7%Widowed: 6.6%Divorced: 10.1% For population 25 years and over in Powder Springs:
High school or higher: 93.5%Bachelor's degree or higher: 40.1%Graduate or professional degree: 13.4%Unemployed: 3.8%Mean travel time to work (commute): 29.2 minutes
Education Gini index (Inequality in education) Here:
10.3Georgia average:
12.2
Religion statistics for Powder Springs, GA (based on Cobb County data)
Religion Adherents Congregations Evangelical Protestant 196,846 303 Catholic 76,988 7 Mainline Protestant 71,018 71 Other 15,543 49 Black Protestant 12,228 18 Orthodox 1,700 1 None 313,755 -
Source: Clifford Grammich, Kirk Hadaway, Richard Houseal, Dale E.Jones, Alexei Krindatch, Richie Stanley and Richard H.Taylor. 2012. 2010 U.S.Religion Census: Religious Congregations & Membership Study. Association of Statisticians of American Religious Bodies. Jones, Dale E., et al. 2002. Congregations and Membership in the United States 2000. Nashville, TN: Glenmary Research Center. Graphs represent county-level data
Food Environment Statistics: Number of grocery stores : 98Cobb County :
1.42 / 10,000 pop.Georgia :
1.91 / 10,000 pop.
Number of supercenters and club stores : 7This county :
0.10 / 10,000 pop.Georgia :
0.15 / 10,000 pop.
Number of convenience stores (no gas) : 24This county :
0.35 / 10,000 pop.Georgia :
0.86 / 10,000 pop.
Number of convenience stores (with gas) : 231Cobb County :
3.35 / 10,000 pop.Georgia :
5.12 / 10,000 pop.
Number of full-service restaurants : 562Cobb County :
8.16 / 10,000 pop.Georgia :
7.41 / 10,000 pop.
Adult diabetes rate : Cobb County :
8.1%Georgia :
10.4%
Adult obesity rate : Cobb County :
23.8%Georgia :
27.8%
Low-income preschool obesity rate : Health and Nutrition:
Average overall health of teeth and gums : Average BMI : Powder Springs:
29.3Georgia:
28.9
People feeling badly about themselves : People not drinking alcohol at all : Powder Springs:
10.8%Georgia:
10.8%
Average hours sleeping at night : Powder Springs:
6.7State:
6.7
Overweight people : Powder Springs:
35.4%Georgia:
33.5%
General health condition : Powder Springs:
57.7%State:
56.2%
Average condition of hearing : This city:
82.6%State:
80.8%
More about Health and Nutrition of Powder Springs, GA Residents
Local government employment and payroll (March 2022)
Function
Full-time employees
Monthly full-time payroll
Average yearly full-time wage
Part-time employees
Monthly part-time payroll
Police Protection - Officers
19 $111,423 $70,372 1 $171 Other Government Administration
11 $67,609 $73,755 7 $7,018 Solid Waste Management
11 $37,827 $41,266 0 $0 Streets and Highways
6 $26,100 $52,200 0 $0 Financial Administration
3 $17,745 $70,980 3 $2,117 Judicial and Legal
3 $17,043 $68,172 0 $0 Parks and Recreation
3 $12,845 $51,380 2 $3,893 Sewerage
2 $7,072 $42,432 0 $0 Other and Unallocable
2 $11,782 $70,692 0 $0 Police - Other
1 $3,541 $42,492 0 $0
Totals for Government
61 $312,987 $61,571 13 $13,199
Powder Springs government finances - Expenditure in 2021 (per resident):
Construction - Regular Highways: $2,137,000 ($123.26)
General - Other: $241,000 ($13.90)Central Staff Services: $206,000 ($11.88)Current Operations - Central Staff Services: $3,259,000 ($187.98)
Police Protection: $2,276,000 ($131.28)Regular Highways: $2,255,000 ($130.07)Solid Waste Management: $1,295,000 ($74.70)Financial Administration: $648,000 ($37.38)General - Other: $623,000 ($35.93)Parks and Recreation: $434,000 ($25.03)Judicial and Legal Services: $313,000 ($18.05)General Public Buildings: $77,000 ($4.44)General - Interest on Debt: $640,000 ($36.92)
Other Capital Outlay - General - Other: $1,461,000 ($84.27)
Police Protection: $296,000 ($17.07)General Public Building: $30,000 ($1.73)Financial Administration: $8,000 ($0.46)
Powder Springs government finances - Revenue in 2021 (per resident):
Charges - Solid Waste Management: $1,419,000 ($81.85)
Regular Highways: $566,000 ($32.65)Sewerage: $530,000 ($30.57)Other: $325,000 ($18.75)Local Intergovernmental - General Local Government Support: $3,830,000 ($220.91)
Other: $1,493,000 ($86.12)Miscellaneous - Fines and Forfeits: $555,000 ($32.01)
Sale of Property: $254,000 ($14.65)General Revenue - Other: $230,000 ($13.27)Interest Earnings: $8,000 ($0.46)Rents: $2,000 ($0.12)Donations From Private Sources: $1,000 ($0.06)State Intergovernmental - Other: $1,134,000 ($65.41)
Housing and Community Development: $8,000 ($0.46)Tax - Property: $5,253,000 ($302.99)
Insurance Premiums Sales: $1,120,000 ($64.60)Public Utilities Sales: $758,000 ($43.72)Occupation and Business License - Other: $423,000 ($24.40)Alcoholic Beverage Sales: $272,000 ($15.69)Other License: $260,000 ($15.00)Alcoholic Beverage License: $67,000 ($3.86)Other Selective Sales: $1,000 ($0.06)
Powder Springs government finances - Debt in 2021 (per resident):
Long Term Debt - Outstanding Unspecified Public Purpose: $25,733,000 ($1484.28)
Beginning Outstanding - Unspecified Public Purpose: $16,008,000 ($923.34)Issue, Unspecified Public Purpose: $14,629,000 ($843.80)Retired Unspecified Public Purpose: $4,904,000 ($282.86)
Powder Springs government finances - Cash and Securities in 2021 (per resident):
Bond Funds - Cash and Securities: $11,829,000 ($682.30)
Other Funds - Cash and Securities: $23,373,000 ($1348.16)
10.27% of this county's 2021 resident taxpayers lived in other counties in 2020 ($69,386 average adjusted gross income )
Here:
10.27%Georgia average:
10.21%
0.01% of residents moved from foreign countries ($96 average AGI )Cobb County:
0.01%Georgia average:
0.04%
Top counties from which taxpayers relocated into this county between 2020 and 2021:
10.33% of this county's 2020 resident taxpayers moved to other counties in 2021 ($75,526 average adjusted gross income )
Here:
10.33%Georgia average:
9.60%
0.03% of residents moved to foreign countries ($156 average AGI )Cobb County:
0.03%Georgia average:
0.03%
Top counties to which taxpayers relocated from this county between 2020 and 2021:
Businesses in Powder Springs, GA
Name Count Name Count
AT&T 1 KFC 1 Advance Auto Parts 3 Kroger 2 AutoZone 1 McDonald's 2 Baskin-Robbins 1 Penske 1 Blockbuster 2 Pizza Hut 1 CVS 1 Publix Super Markets 2 Dairy Queen 1 Rite Aid 1 Domino's Pizza 1 Taco Bell 1 FedEx 5 U-Haul 3 GNC 2 UPS 4 Goodwill 1 Waffle House 2 H&R Block 2 Walgreens 2 Home Depot 1 Wendy's 2
Strongest AM radio stations in Powder Springs:
WMLB (1160 AM; 50 kW; EAST POINT, GA; Owner: ATLANTA AREA BROADCASTING, INC.)
WDWD (590 AM; 5 kW; ATLANTA, GA; Owner: ABC, INC.)
WAOS (1600 AM; 20 kW; AUSTELL, GA; Owner: LA FAVORITA, INC.)
WFTD (1080 AM; daytime; 50 kW; MARIETTA, GA; Owner: PRIETO ENTERPRISES, INC.)
WAZX (1550 AM; 50 kW; SMYRNA, GA; Owner: GA-MEX BROADCASTING, INC.)
WGST (640 AM; 50 kW; ATLANTA, GA; Owner: CITICASTERS LICENSES, L.P.)
WAOK (1380 AM; 50 kW; ATLANTA, GA; Owner: INFINITY BROADCASTING OPERATIONS, INC.)
WCNN (680 AM; 50 kW; NORTH ATLANTA, GA; Owner: DICKEY BROADCASTING COMPANY)
WSB (750 AM; 50 kW; ATLANTA, GA; Owner: CXR HOLDINGS, INC.)
WQXI (790 AM; 28 kW; ATLANTA, GA; Owner: JEFFERSON-PILOT COMMUNICATIONS COMPANY OF GEORGIA)
WGUN (1010 AM; 50 kW; ATLANTA, GA; Owner: WGUN, INC.)
WGKA (1190 AM; 25 kW; ATLANTA, GA; Owner: SALEM MEDIA OF GEORGIA, INC.)
WKNG (1060 AM; daytime; 50 kW; TALLAPOOSA, GA; Owner: WKNG, INC.)
Strongest FM radio stations in Powder Springs:
WWWQ (100.5 FM; ANNISTON, AL; Owner: WNNX LICO, INC.)
WNNX (99.7 FM; ATLANTA, GA; Owner: WNNX LICO, INC.)
WRFG (89.3 FM; ATLANTA, GA; Owner: RADIO FREE GEORGIA BROADCASTING FOUNDATION INC)
WKHX-FM (101.5 FM; MARIETTA, GA; Owner: ABC, INC.)
WKLS (96.1 FM; ATLANTA, GA; Owner: CITICASTERS LICENSES, L.P.)
WLTM (94.9 FM; ATLANTA, GA; Owner: CITICASTERS LICENSES, L.P.)
WSB-FM (98.5 FM; ATLANTA, GA; Owner: CXR HOLDINGS, INC.)
WSTR (94.1 FM; SMYRNA, GA; Owner: JEFFERSON-PILOT COMMUNICATIONS COMPANY OF GEORGIA)
WVEE (103.3 FM; ATLANTA, GA; Owner: INFINITY BROADCASTING OPERATIONS, INC.)
WZGC (92.9 FM; ATLANTA, GA; Owner: INFINITY BROADCASTING CORP. OF ATLANTA)
WLCL (105.7 FM; CANTON, GA; Owner: CHEROKEE BROADCASTING CO., INC.)
W265BD (100.9 FM; WOODSTOCK, GA; Owner: IMMANUEL BROADCASTING NETWORK, INC.)
WCCV (91.7 FM; CARTERSVILLE, GA; Owner: IMMANUEL BROADCASTING NETWORK, INC.)
W214AS (90.7 FM; WALESKA, GA; Owner: CALVARY CHAPEL OF TWIN FALLS, INC.)
W221AW (92.1 FM; NORTH CANTON, GA; Owner: IMMANUEL BROADCASTING NETWORK, INC.)
WAMJ (102.5 FM; MABLETON, GA; Owner: NEW MABLETON BROADCASTING CORPORATION)
WALR-FM (104.1 FM; LA GRANGE, GA; Owner: CXR HOLDINGS, INC.)
WABE (90.1 FM; ATLANTA, GA; Owner: BOARD OF EDUCATION, CITY OF ATLANTA)
WJCK (88.3 FM; PIEDMONT, AL; Owner: IMMANUEL BROADCASTING NETWORK, INC.)
WHTA (107.9 FM; HAMPTON, GA; Owner: RADIO ONE LICENSES, LLC)
TV broadcast stations around Powder Springs:
WUVG (Channel 34; ATHENS, GA; Owner: UNIVISION ATLANTA LLC)
WAGA (Channel 5; ATLANTA, GA; Owner: FOX TELEVISION STATIONS, INC.)
WSB-TV (Channel 2; ATLANTA, GA; Owner: WSB-TV HOLDINGS, INC.)
WXIA-TV (Channel 11; ATLANTA, GA; Owner: GANNETT GEORGIA, L.P.)
WANN-LP (Channel 32; ATLANTA, GA; Owner: PRISM BROADCASTING NETWORK, INC.)
WDTA-LP (Channel 53; FAYETTEVILLE, GA; Owner: WORD OF GOD FELLOWSHIP, INC.)
WATL (Channel 36; ATLANTA, GA; Owner: WATL, LLC)
WTBS (Channel 17; ATLANTA, GA; Owner: SUPERSTATION, INC.)
WGCL-TV (Channel 46; ATLANTA, GA; Owner: MEREDITH CORPORATION)
WHSG (Channel 63; MONROE, GA; Owner: TRINITY BROADCASTING NETWORK)
WUPA (Channel 69; ATLANTA, GA; Owner: VIACOM STATIONS GROUP OF ATLANTA INC.)
WTHC-LP (Channel 42; ATLANTA, GA; Owner: THE ATLANTA CHANNEL, INC.)
WSKC-LP (Channel 59; ATLANTA, GA; Owner: KM LPTV OF ATLANTA, L.L.C.)
WPBA (Channel 30; ATLANTA, GA; Owner: BOARD OF EDUCATION OF THE CITY OF ATLANTA)
WANX-LP (Channel 26; ATLANTA, GA; Owner: PRISM BROADCASTING NETWORK, INC.)
WIRE-CA (Channel 40; ATLANTA, GA; Owner: COMMERCIAL BROADCASTING CORP.)
W24AL (Channel 24; ATLANTA, GA; Owner: VENTANA TELEVISION, INC.)
W04DB (Channel 4; ATLANTA, GA; Owner: VVILPTV, INC.)
WATC (Channel 57; ATLANTA, GA; Owner: COMMUNITY TELEVISION, INC.)
WPXA (Channel 14; ROME, GA; Owner: PAXSON ATLANTA LICENSE, INC.)
W38CU (Channel 38; ATLANTA, GA; Owner: KOREAN AMERICAN TV BROADCASTING CORP.)
National Bridge Inventory (NBI) Statistics 44 Number of bridges502ft / 153m Total length $52,483,000 Total costs451,269 Total average daily traffic7,169 Total average daily truck traffic
New bridges - historical statistics
1 1920-1929 1 1940-1949 2 1950-1959 2 1960-1969 4 1970-1979 7 1980-1989 14 1990-1999 7 2000-2009 3 2010-2019
See full National Bridge Inventory statistics for Powder Springs, GA
FCC Registered Antenna Towers: 143 (
See the full list of FCC Registered Antenna Towers in Powder Springs )
FCC Registered Private Land Mobile Towers: 1
PIER 13, Lat: 33.834139 Lon: -84.676000, Call Sign: WQFI669, Assigned Frequencies: 913.000 MHz, Grant Date: 07/25/2006, Expiration Date: 07/25/2016, Cancellation Date: 09/10/2016, Certifier: Tony J Morris, Registrant: Transportation Technology Center Inc, 55500 Dot Road, Pueblo, CO 81001, Phone: (719) 584-0514, Fax: (719) 584-7145, Email:
FCC Registered Broadcast Land Mobile Towers: 6
Powder Springs, Brownville Rd Rr Crossing @ Mp 129.70h (Lat: 33.859611 Lon: -84.686333), Type: Bant, Structure height: 2.5 m, Overall height: 3.1 m, Call Sign: WPVB526, Licensee ID: L00008014, Assigned Frequencies: 160.950 MHz, 161.535 MHz, Grant Date: 03/17/2012, Expiration Date: 06/12/2022, Cancellation Date: 02/18/2022, Certifier: Jerry R Celio, Registrant: Norfolk Southern Railway Company, 650 West Peachtree St, Nw, Box 41, Atlanta, GA 30308, Phone: (404) 660-4050, Fax: (404) 582-6209, Email:
4023 Powder Springs Rd Sw (Lat: 33.859444 Lon: -84.683889), Call Sign: WPWG710, Assigned Frequencies: 154.540 MHz, 33.1600 MHz, 154.515 MHz, 30.8400 MHz, 35.0200 MHz, 31.2400 MHz, 151.895 MHz, 33.4000 MHz, Grant Date: 11/13/2002, Expiration Date: 11/13/2012, Cancellation Date: 01/19/2013, Certifier: Remona Barbour, Registrant: Kfc National Management Company, Inc., 5200 Commerce Crossings, Louisville, KY 40299, Phone: (502) 874-6961, Fax: (502) 874-6173, Email:
Lat: 33.927889 Lon: -84.663861, Call Sign: WQPX878, Assigned Frequencies: 451.762 MHz, 456.412 MHz, 456.537 MHz, 467.462 MHz, 456.712 MHz, Grant Date: 08/19/2022, Expiration Date: 09/13/2032, Certifier: Gail Marchant, Registrant: Cobb County Schools, 650 South Cobb Drive, Marietta, GA 30060, Phone: (678) 594-8620, Email:
Lat: 33.964917 Lon: -84.698222, Call Sign: WQYF313, Assigned Frequencies: 451.287 MHz, 451.487 MHz, 451.737 MHz, 452.137 MHz, Grant Date: 09/08/2016, Expiration Date: 09/08/2026, Certifier: Steve Keller, Registrant: Radio One, Inc., 4405 International Blvd.. Suite B-118, Norcross, GA 30093, Phone: (678) 218-9900, Fax: (678) 218-9903, Email:
Lat: 33.853667 Lon: -84.680722, Call Sign: WRPT645, Assigned Frequencies: 72.1000 MHz, Grant Date: 03/15/2022, Expiration Date: 03/15/2032, Certifier: Steve Hardin, Registrant: Primex Wireless, Inc., 965 S Wells St, Lake Geneva, WI 53147, Phone: (262) 729-4858, Email:
Lat: 33.900111 Lon: -84.691500, Call Sign: WRYC899, Assigned Frequencies: 467.212 MHz, Grant Date: 07/25/2023, Expiration Date: 07/25/2033, Certifier: Kolt M Bloxson, Registrant: Innovation Wireless, 11869 Teale St, Culver City, CA 90230, Phone: (888) 559-5565, Fax: (310) 482-3480, Email:
FCC Registered Microwave Towers: 12 (
See the full list of FCC Registered Microwave Towers in this town )
FCC Registered Amateur Radio Licenses: 254 (
See the full list of FCC Registered Amateur Radio Licenses in Powder Springs )
FAA Registered Aircraft: 30 (
See the full list of FAA Registered Aircraft in Powder Springs )
Home Mortgage Disclosure Act Aggregated Statistics For Year 2009(Based on 4 partial tracts) A) FHA, FSA/RHS & VA B) Conventional C) Refinancings D) Home Improvement Loans F) Non-occupant Loans on Number Average Value Number Average Value Number Average Value Number Average Value Number Average Value
LOANS ORIGINATED 84 $153,150 39 $169,690 160 $161,062 6 $79,517 18 $145,658 APPLICATIONS APPROVED, NOT ACCEPTED 4 $146,258 2 $154,405 21 $159,734 1 $43,860 3 $118,830 APPLICATIONS DENIED 22 $137,029 7 $203,557 116 $149,064 14 $35,984 13 $161,919 APPLICATIONS WITHDRAWN 22 $139,968 6 $192,908 84 $154,151 4 $64,323 6 $103,967 FILES CLOSED FOR INCOMPLETENESS 3 $210,610 1 $154,070 19 $167,028 1 $71,480 1 $88,590
Aggregated Statistics For Year 2008(Based on 4 partial tracts) A) FHA, FSA/RHS & VA B) Conventional C) Refinancings D) Home Improvement Loans F) Non-occupant Loans on G) Loans On Manufactured Number Average Value Number Average Value Number Average Value Number Average Value Number Average Value Number Average Value
LOANS ORIGINATED 79 $166,353 72 $179,936 155 $146,739 15 $58,495 31 $131,450 0 $0 APPLICATIONS APPROVED, NOT ACCEPTED 7 $153,540 9 $156,842 28 $136,409 5 $95,240 1 $110,540 1 $43,640 APPLICATIONS DENIED 17 $140,501 23 $139,251 171 $157,796 41 $57,201 21 $157,469 0 $0 APPLICATIONS WITHDRAWN 19 $171,855 16 $210,234 72 $154,907 6 $80,925 2 $168,495 0 $0 FILES CLOSED FOR INCOMPLETENESS 3 $138,620 5 $176,174 10 $146,836 1 $23,890 2 $95,880 0 $0
Aggregated Statistics For Year 2007(Based on 4 partial tracts) A) FHA, FSA/RHS & VA B) Conventional C) Refinancings D) Home Improvement Loans F) Non-occupant Loans on G) Loans On Manufactured Number Average Value Number Average Value Number Average Value Number Average Value Number Average Value Number Average Value
LOANS ORIGINATED 39 $173,384 214 $149,287 230 $134,853 26 $44,759 62 $126,365 0 $0 APPLICATIONS APPROVED, NOT ACCEPTED 1 $210,450 36 $139,064 67 $142,855 4 $78,818 12 $154,812 0 $0 APPLICATIONS DENIED 8 $149,430 74 $150,412 274 $148,923 41 $44,991 41 $124,036 2 $174,705 APPLICATIONS WITHDRAWN 6 $183,808 41 $174,006 117 $149,680 10 $115,212 13 $115,052 0 $0 FILES CLOSED FOR INCOMPLETENESS 2 $136,810 13 $157,319 22 $143,924 1 $200,250 5 $88,058 0 $0
Aggregated Statistics For Year 2006(Based on 4 partial tracts) A) FHA, FSA/RHS & VA B) Conventional C) Refinancings D) Home Improvement Loans F) Non-occupant Loans on G) Loans On Manufactured Number Average Value Number Average Value Number Average Value Number Average Value Number Average Value Number Average Value
LOANS ORIGINATED 28 $164,724 403 $123,116 304 $116,664 42 $49,140 101 $102,402 0 $0 APPLICATIONS APPROVED, NOT ACCEPTED 2 $173,185 50 $127,468 66 $116,078 7 $33,936 13 $82,439 1 $141,090 APPLICATIONS DENIED 9 $160,596 145 $122,715 283 $137,262 70 $47,438 44 $117,282 2 $31,570 APPLICATIONS WITHDRAWN 8 $148,331 69 $140,075 171 $141,660 15 $63,681 22 $114,380 0 $0 FILES CLOSED FOR INCOMPLETENESS 0 $0 20 $105,538 51 $148,052 1 $95,860 1 $138,990 0 $0
Aggregated Statistics For Year 2005(Based on 4 partial tracts) A) FHA, FSA/RHS & VA B) Conventional C) Refinancings D) Home Improvement Loans E) Loans on Dwellings For 5+ Families F) Non-occupant Loans on G) Loans On Manufactured Number Average Value Number Average Value Number Average Value Number Average Value Number Average Value Number Average Value Number Average Value
LOANS ORIGINATED 31 $166,769 439 $113,267 324 $120,481 43 $41,218 1 $76,090 107 $93,659 1 $51,250 APPLICATIONS APPROVED, NOT ACCEPTED 3 $186,983 50 $112,006 57 $124,595 12 $51,637 0 $0 7 $99,704 0 $0 APPLICATIONS DENIED 8 $146,464 103 $120,873 235 $135,659 51 $35,341 0 $0 24 $97,248 2 $60,375 APPLICATIONS WITHDRAWN 3 $136,393 61 $117,244 149 $136,231 20 $153,014 0 $0 17 $100,231 0 $0 FILES CLOSED FOR INCOMPLETENESS 0 $0 16 $98,596 77 $148,494 1 $89,150 0 $0 3 $122,593 0 $0
Aggregated Statistics For Year 2004(Based on 4 partial tracts) A) FHA, FSA/RHS & VA B) Conventional C) Refinancings D) Home Improvement Loans F) Non-occupant Loans on G) Loans On Manufactured Number Average Value Number Average Value Number Average Value Number Average Value Number Average Value Number Average Value
LOANS ORIGINATED 44 $154,170 364 $130,454 361 $123,627 30 $44,445 84 $97,077 1 $18,950 APPLICATIONS APPROVED, NOT ACCEPTED 4 $154,918 38 $123,514 73 $131,584 5 $37,936 11 $88,331 2 $54,070 APPLICATIONS DENIED 9 $134,750 71 $115,796 236 $128,256 53 $37,329 24 $91,761 1 $46,120 APPLICATIONS WITHDRAWN 8 $142,706 52 $127,491 119 $130,270 10 $84,264 12 $112,666 0 $0 FILES CLOSED FOR INCOMPLETENESS 2 $146,970 20 $113,312 67 $137,415 4 $66,645 8 $91,012 1 $149,220
Aggregated Statistics For Year 2003(Based on 4 partial tracts) A) FHA, FSA/RHS & VA B) Conventional C) Refinancings D) Home Improvement Loans F) Non-occupant Loans on Number Average Value Number Average Value Number Average Value Number Average Value Number Average Value
LOANS ORIGINATED 55 $143,046 271 $124,597 660 $122,593 9 $28,871 73 $102,781 APPLICATIONS APPROVED, NOT ACCEPTED 0 $0 27 $122,886 78 $122,978 4 $26,040 6 $92,723 APPLICATIONS DENIED 5 $136,768 45 $130,163 222 $116,239 24 $28,480 20 $104,486 APPLICATIONS WITHDRAWN 6 $138,835 36 $129,417 127 $125,392 2 $34,330 11 $111,712 FILES CLOSED FOR INCOMPLETENESS 1 $125,250 13 $157,466 36 $125,092 1 $38,630 4 $106,402
Aggregated Statistics For Year 2002(Based on 2 partial tracts) A) FHA, FSA/RHS & VA B) Conventional C) Refinancings D) Home Improvement Loans F) Non-occupant Loans on Number Average Value Number Average Value Number Average Value Number Average Value Number Average Value
LOANS ORIGINATED 16 $150,576 29 $141,970 72 $124,927 2 $29,730 6 $107,942 APPLICATIONS APPROVED, NOT ACCEPTED 0 $0 3 $130,657 10 $120,942 1 $13,440 0 $0 APPLICATIONS DENIED 1 $118,680 4 $127,200 21 $111,821 3 $29,823 1 $67,920 APPLICATIONS WITHDRAWN 1 $158,550 2 $161,910 13 $114,500 1 $9,040 0 $0 FILES CLOSED FOR INCOMPLETENESS 0 $0 1 $116,130 7 $134,311 0 $0 0 $0
Aggregated Statistics For Year 2001(Based on 2 partial tracts) A) FHA, FSA/RHS & VA B) Conventional C) Refinancings D) Home Improvement Loans F) Non-occupant Loans on Number Average Value Number Average Value Number Average Value Number Average Value Number Average Value
LOANS ORIGINATED 20 $139,202 31 $135,599 65 $116,907 5 $20,028 5 $117,638 APPLICATIONS APPROVED, NOT ACCEPTED 0 $0 2 $95,500 7 $114,907 2 $26,425 0 $0 APPLICATIONS DENIED 2 $141,050 3 $130,427 24 $96,038 5 $17,826 0 $0 APPLICATIONS WITHDRAWN 2 $122,160 2 $82,345 11 $96,871 2 $38,130 0 $0 FILES CLOSED FOR INCOMPLETENESS 0 $0 1 $127,840 4 $98,545 0 $0 0 $0
Aggregated Statistics For Year 2000(Based on 2 partial tracts) A) FHA, FSA/RHS & VA B) Conventional C) Refinancings D) Home Improvement Loans F) Non-occupant Loans on Number Average Value Number Average Value Number Average Value Number Average Value Number Average Value
LOANS ORIGINATED 18 $124,561 22 $115,768 16 $80,384 6 $26,117 3 $82,753 APPLICATIONS APPROVED, NOT ACCEPTED 0 $0 2 $82,925 5 $82,382 2 $23,760 0 $0 APPLICATIONS DENIED 2 $91,620 5 $93,670 13 $89,323 5 $18,590 1 $49,260 APPLICATIONS WITHDRAWN 1 $82,290 3 $99,713 8 $69,511 1 $19,360 0 $0 FILES CLOSED FOR INCOMPLETENESS 0 $0 1 $116,940 4 $87,418 0 $0 0 $0
Aggregated Statistics For Year 1999(Based on 3 partial tracts) A) FHA, FSA/RHS & VA B) Conventional C) Refinancings D) Home Improvement Loans F) Non-occupant Loans on Number Average Value Number Average Value Number Average Value Number Average Value Number Average Value
LOANS ORIGINATED 156 $114,241 164 $110,800 197 $86,718 27 $21,916 22 $71,193 APPLICATIONS APPROVED, NOT ACCEPTED 4 $105,640 13 $99,687 47 $119,136 20 $25,739 3 $62,567 APPLICATIONS DENIED 18 $115,935 46 $86,692 117 $77,498 51 $23,725 7 $66,511 APPLICATIONS WITHDRAWN 6 $109,695 30 $105,337 81 $75,076 6 $42,783 3 $54,663 FILES CLOSED FOR INCOMPLETENESS 2 $115,845 6 $74,992 25 $91,400 0 $0 1 $71,660
Detailed HMDA statistics for the following Tracts:
0315.01
, 0315.04 , 0315.05
Private Mortgage Insurance Companies Aggregated Statistics For Year 2009(Based on 4 partial tracts) A) Conventional B) Refinancings C) Non-occupant Loans on Number Average Value Number Average Value Number Average Value
LOANS ORIGINATED 5 $178,414 6 $177,733 1 $138,020 APPLICATIONS APPROVED, NOT ACCEPTED 5 $184,632 6 $195,027 1 $169,900 APPLICATIONS DENIED 0 $0 1 $254,630 0 $0 APPLICATIONS WITHDRAWN 0 $0 3 $325,917 0 $0 FILES CLOSED FOR INCOMPLETENESS 0 $0 0 $0 0 $0
Aggregated Statistics For Year 2008(Based on 4 partial tracts) A) Conventional B) Refinancings C) Non-occupant Loans on Number Average Value Number Average Value Number Average Value
LOANS ORIGINATED 42 $188,521 23 $174,737 10 $112,203 APPLICATIONS APPROVED, NOT ACCEPTED 18 $198,388 13 $180,302 2 $200,240 APPLICATIONS DENIED 6 $212,182 3 $223,240 3 $152,133 APPLICATIONS WITHDRAWN 2 $205,375 1 $121,280 1 $49,890 FILES CLOSED FOR INCOMPLETENESS 3 $104,243 1 $230,960 2 $92,730
Aggregated Statistics For Year 2007(Based on 4 partial tracts) A) Conventional B) Refinancings C) Non-occupant Loans on Number Average Value Number Average Value Number Average Value
LOANS ORIGINATED 81 $166,624 33 $160,416 13 $120,988 APPLICATIONS APPROVED, NOT ACCEPTED 14 $167,081 6 $149,607 1 $261,720 APPLICATIONS DENIED 0 $0 0 $0 0 $0 APPLICATIONS WITHDRAWN 3 $141,383 3 $142,750 2 $139,980 FILES CLOSED FOR INCOMPLETENESS 0 $0 0 $0 0 $0
Aggregated Statistics For Year 2006(Based on 4 partial tracts) A) Conventional B) Refinancings C) Non-occupant Loans on Number Average Value Number Average Value Number Average Value
LOANS ORIGINATED 50 $168,807 24 $152,991 5 $136,428 APPLICATIONS APPROVED, NOT ACCEPTED 5 $157,968 7 $145,250 0 $0 APPLICATIONS DENIED 0 $0 1 $98,200 0 $0 APPLICATIONS WITHDRAWN 2 $142,410 3 $143,900 2 $119,630 FILES CLOSED FOR INCOMPLETENESS 0 $0 0 $0 0 $0
Aggregated Statistics For Year 2005(Based on 4 partial tracts) A) Conventional B) Refinancings C) Non-occupant Loans on Number Average Value Number Average Value Number Average Value
LOANS ORIGINATED 40 $157,740 27 $160,085 5 $110,592 APPLICATIONS APPROVED, NOT ACCEPTED 7 $160,454 6 $178,755 1 $74,820 APPLICATIONS DENIED 1 $105,630 0 $0 0 $0 APPLICATIONS WITHDRAWN 1 $284,730 3 $156,850 0 $0 FILES CLOSED FOR INCOMPLETENESS 0 $0 0 $0 0 $0
Aggregated Statistics For Year 2004(Based on 4 partial tracts) A) Conventional B) Refinancings C) Non-occupant Loans on Number Average Value Number Average Value Number Average Value
LOANS ORIGINATED 46 $145,145 35 $149,060 10 $94,343 APPLICATIONS APPROVED, NOT ACCEPTED 13 $157,528 8 $153,988 3 $142,117 APPLICATIONS DENIED 1 $66,310 0 $0 1 $66,310 APPLICATIONS WITHDRAWN 3 $154,240 2 $99,095 1 $66,480 FILES CLOSED FOR INCOMPLETENESS 1 $85,500 1 $106,910 1 $100,340
Aggregated Statistics For Year 2003(Based on 4 partial tracts) A) Conventional B) Refinancings C) Non-occupant Loans on Number Average Value Number Average Value Number Average Value
LOANS ORIGINATED 75 $141,537 111 $141,737 20 $116,443 APPLICATIONS APPROVED, NOT ACCEPTED 10 $136,956 17 $133,686 4 $123,165 APPLICATIONS DENIED 4 $141,658 1 $146,960 2 $106,720 APPLICATIONS WITHDRAWN 4 $146,020 8 $130,814 1 $66,510 FILES CLOSED FOR INCOMPLETENESS 0 $0 1 $83,470 0 $0
Aggregated Statistics For Year 2002(Based on 2 partial tracts) A) Conventional B) Refinancings C) Non-occupant Loans on Number Average Value Number Average Value Number Average Value
LOANS ORIGINATED 14 $157,442 14 $137,756 2 $149,510 APPLICATIONS APPROVED, NOT ACCEPTED 1 $172,340 2 $152,640 0 $0 APPLICATIONS DENIED 0 $0 1 $81,010 0 $0 APPLICATIONS WITHDRAWN 0 $0 1 $155,770 0 $0 FILES CLOSED FOR INCOMPLETENESS 0 $0 0 $0 0 $0
Aggregated Statistics For Year 2001(Based on 2 partial tracts) A) Conventional B) Refinancings C) Non-occupant Loans on Number Average Value Number Average Value Number Average Value
LOANS ORIGINATED 13 $164,382 9 $136,762 1 $148,240 APPLICATIONS APPROVED, NOT ACCEPTED 1 $146,150 1 $118,220 0 $0 APPLICATIONS DENIED 0 $0 0 $0 0 $0 APPLICATIONS WITHDRAWN 0 $0 0 $0 0 $0 FILES CLOSED FOR INCOMPLETENESS 0 $0 0 $0 0 $0
Aggregated Statistics For Year 2000(Based on 2 partial tracts) A) Conventional B) Refinancings Number Average Value Number Average Value
LOANS ORIGINATED 9 $140,007 1 $140,700 APPLICATIONS APPROVED, NOT ACCEPTED 1 $179,990 0 $0 APPLICATIONS DENIED 0 $0 0 $0 APPLICATIONS WITHDRAWN 0 $0 0 $0 FILES CLOSED FOR INCOMPLETENESS 0 $0 0 $0
Aggregated Statistics For Year 1999(Based on 3 partial tracts) A) Conventional B) Refinancings C) Non-occupant Loans on Number Average Value Number Average Value Number Average Value
LOANS ORIGINATED 81 $119,531 36 $100,944 8 $79,708 APPLICATIONS APPROVED, NOT ACCEPTED 7 $113,240 4 $99,078 0 $0 APPLICATIONS DENIED 3 $122,187 2 $89,850 0 $0 APPLICATIONS WITHDRAWN 2 $100,275 1 $53,760 0 $0 FILES CLOSED FOR INCOMPLETENESS 1 $75,350 0 $0 0 $0
Detailed PMIC statistics for the following Tracts:
0315.01
, 0315.04 , 0315.05
Most common first names in Powder Springs, GA among deceased individuals Name Count Lived (average)
James 67 73.7 years Mary 58 78.6 years William 54 71.3 years Robert 50 73.4 years John 35 77.0 years Charles 30 69.9 years Betty 29 74.3 years Dorothy 23 79.8 years Richard 20 73.8 years Helen 19 83.0 years
Most common last names in Powder Springs, GA among deceased individuals Last name Count Lived (average)
Smith 32 71.8 years Jones 23 71.6 years Williams 22 72.4 years Brown 18 71.8 years Sanders 16 81.7 years Davis 13 69.2 years Morris 12 77.8 years Johnson 12 69.1 years Turner 12 73.6 years Taylor 12 77.6 years
Powder Springs compared to Georgia state average:
Unemployed percentage significantly below state average. Black race population percentage above state average. Hispanic race population percentage above state average. Foreign-born population percentage above state average. Renting percentage below state average. Length of stay since moving in significantly above state average. House age below state average. Percentage of population with a bachelor's degree or higher above state average. Powder Springs on our top lists :
#56 on the list of "Top 101 cities with the smallest racial income disparities between White and Black householders (with at least 2,000 householders)"
#60 on the list of "Top 101 cities with the most residents born in Africa, n.e.c. (population 500+)"
#64 on the list of "Top 101 cities with largest percentage of females in occupations: management occupations (population 5,000+)"
#22 on the list of "Top 101 counties with the lowest average weight of females"
#23 on the list of "Top 101 counties with the best general health status score of residents (1-5), 3 years of data"
#25 on the list of "Top 101 counties with the most Evangelical Protestant adherents"
#43 on the list of "Top 101 counties with the most Mainline Protestant adherents"
#50 on the list of "Top 101 counties with the lowest number of deaths per 1000 residents 2007-2013 (pop. 50,000+)"
Top Patent Applicants
Jonathan Kirschner (20)
Jonathan K. Stiles (14)
Timothy Biedrzycki (11)
Shailesh Singh (9)
Charles K. Young (8)
Juan Alberto Galindo Gonzalez (7)
Kim W. Robinson (6)
Robert W. Bond (6)
Brett Stanton Haisty (4)
Leonard M. Cooper (4)
Total of 224 patent applications in 2008-2024.
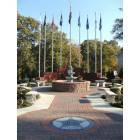

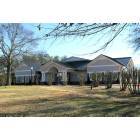
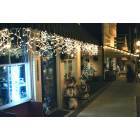
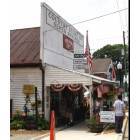
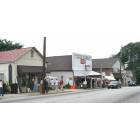
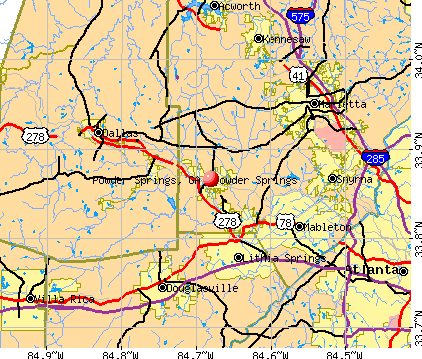


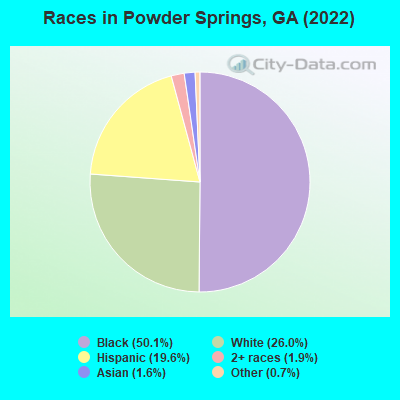
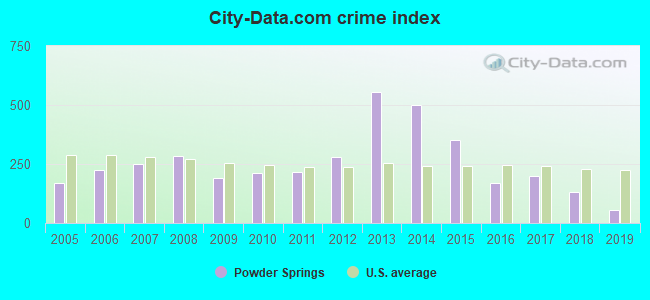
 Recent articles from our blog. Our writers, many of them Ph.D. graduates or candidates, create easy-to-read articles on a wide variety of topics.

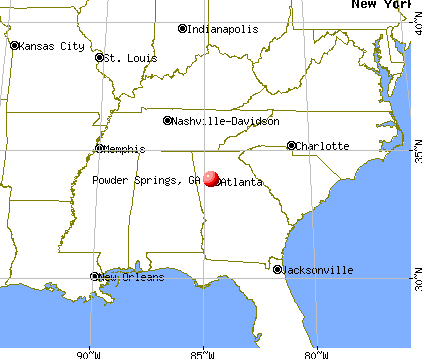
 (10.0 miles
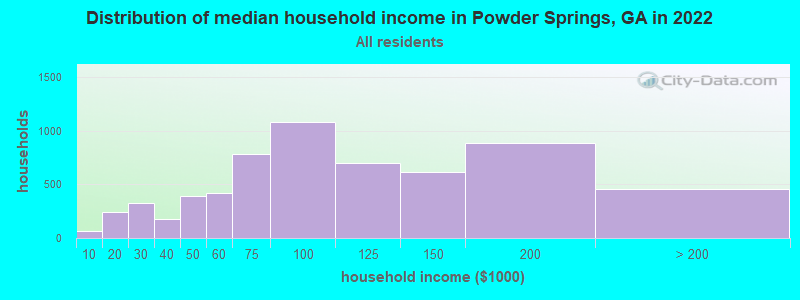
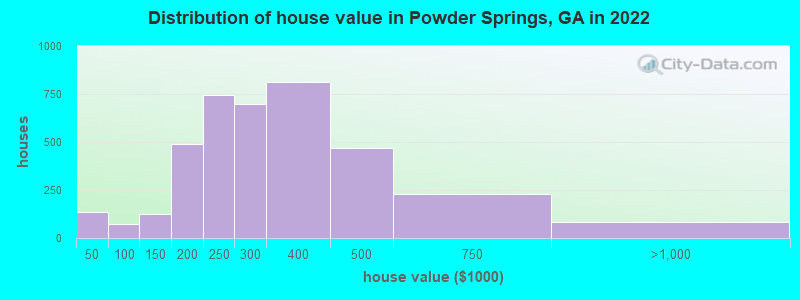

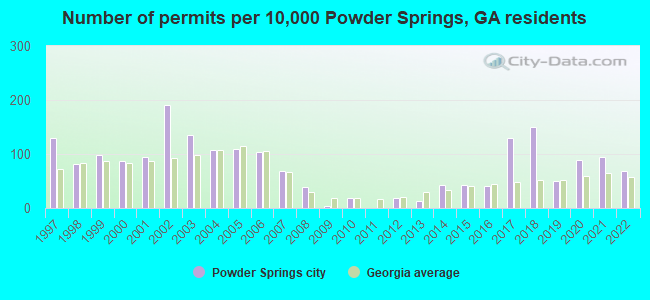
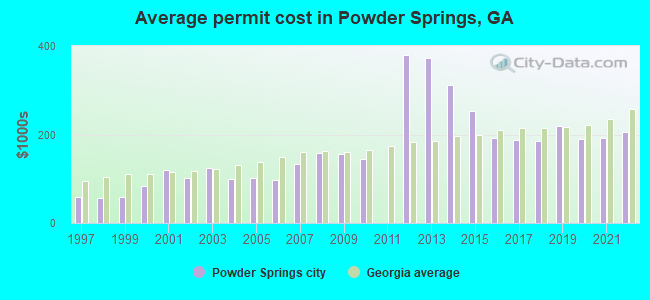
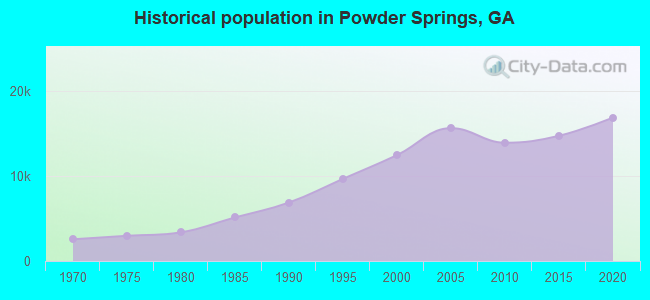
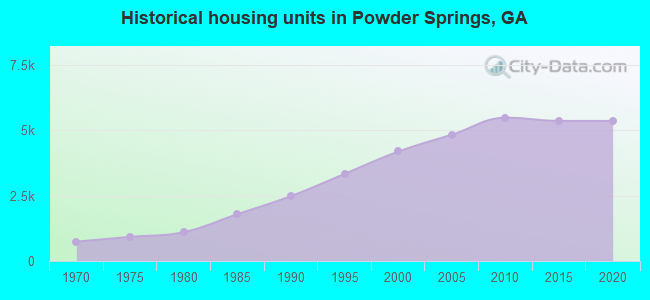
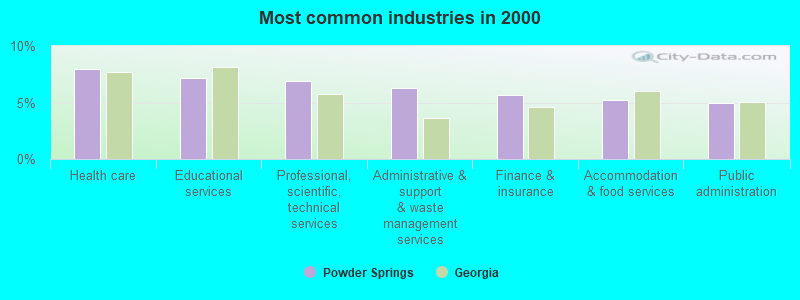
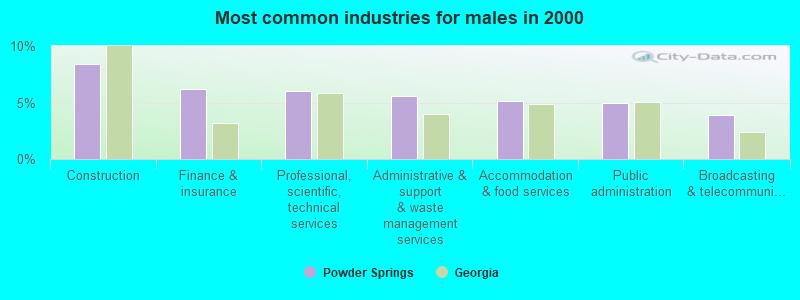
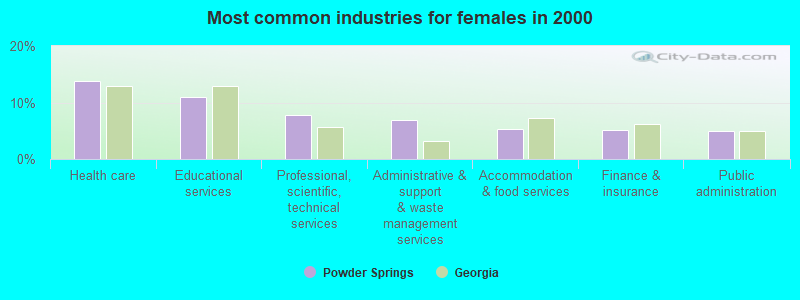
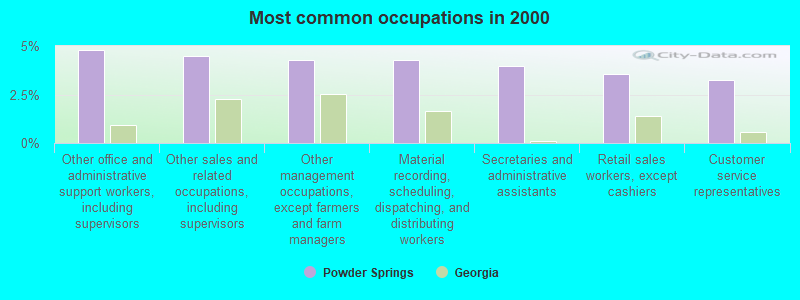
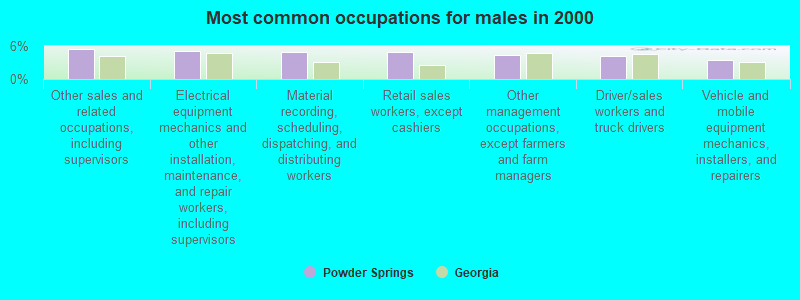
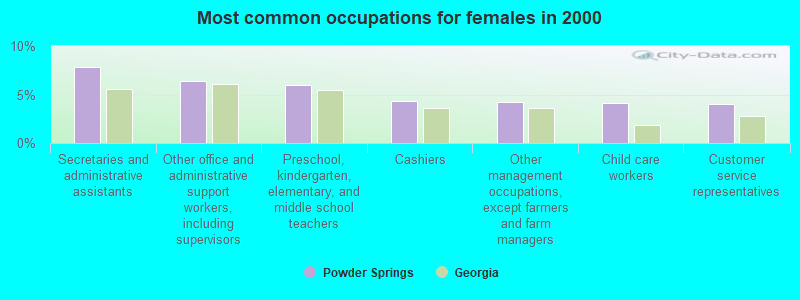
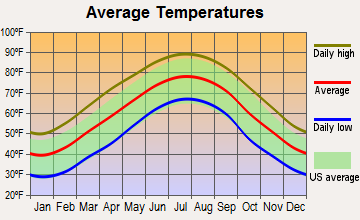


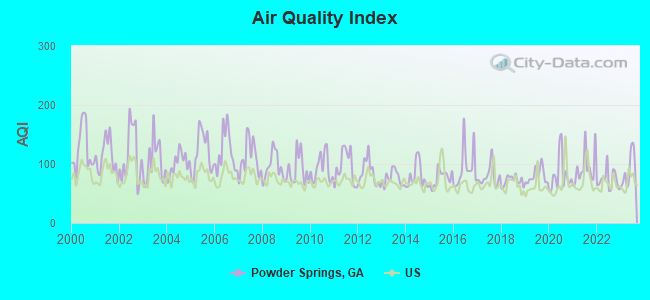
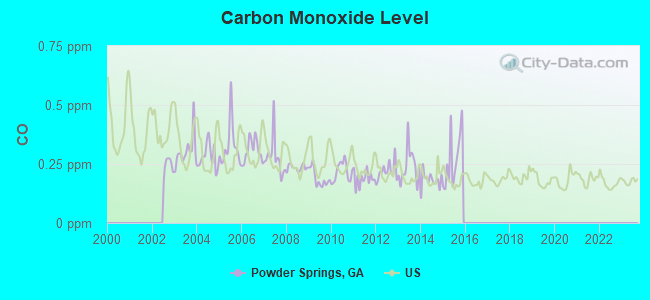
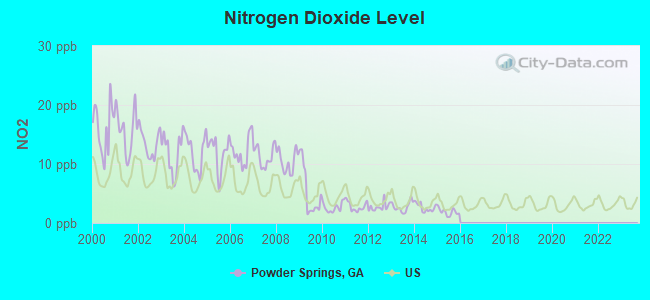
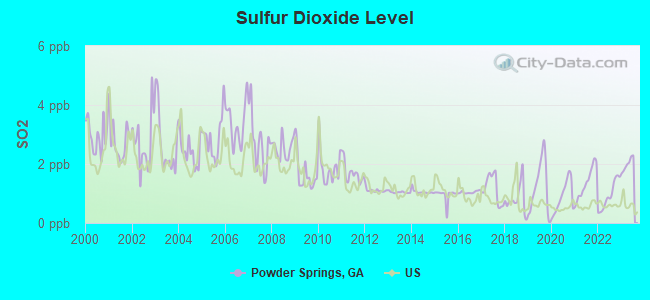
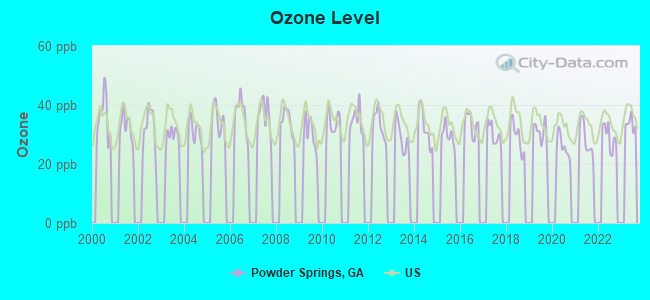
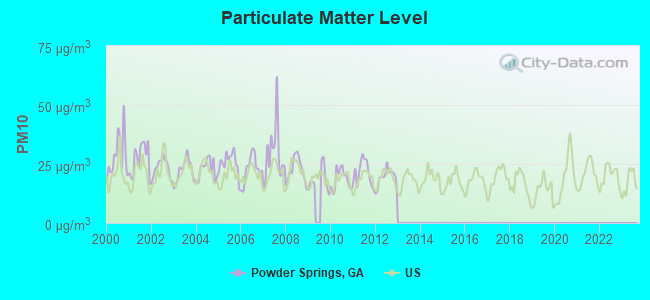
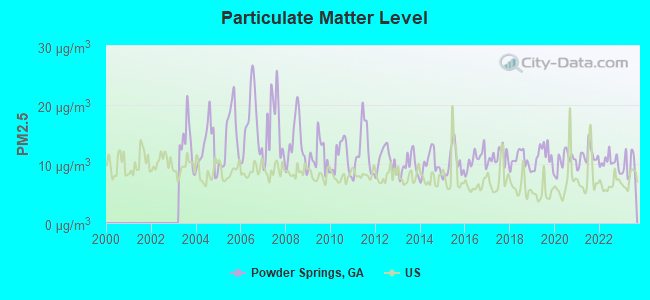
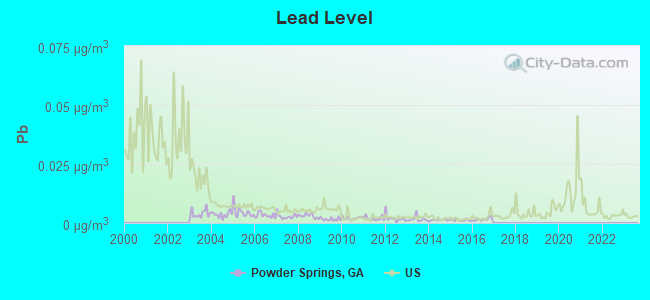

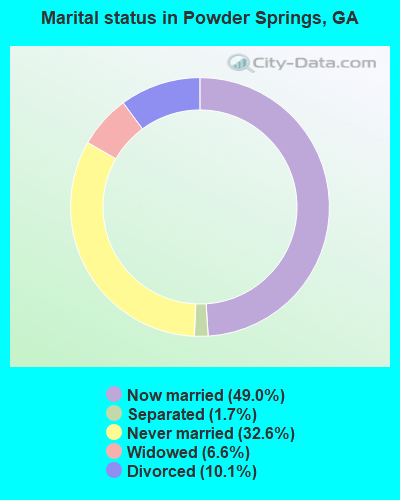
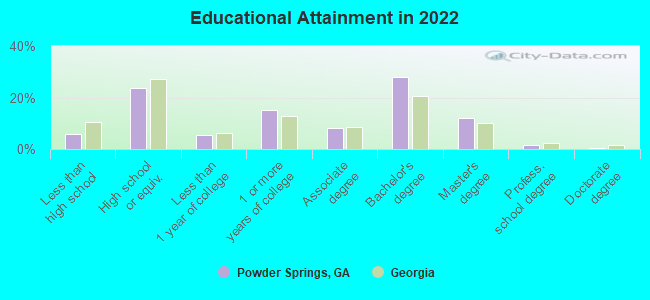
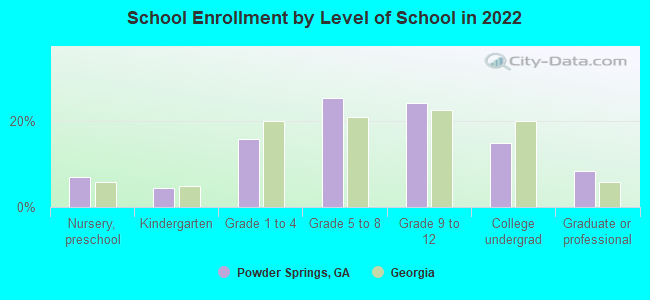
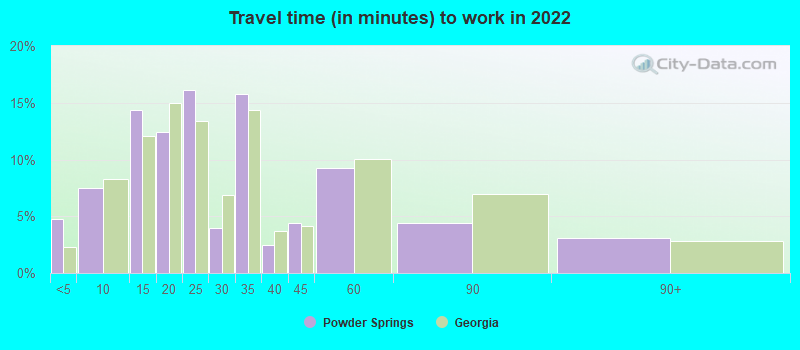
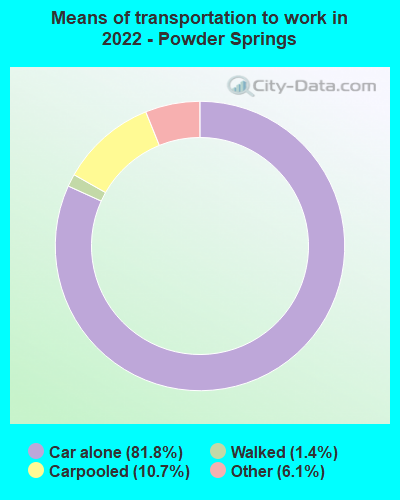
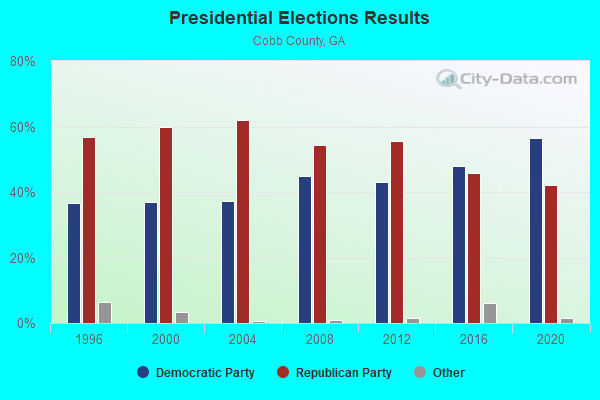
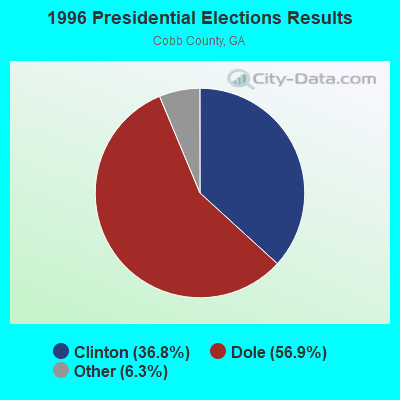
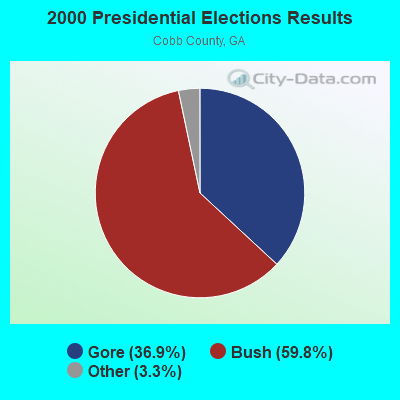
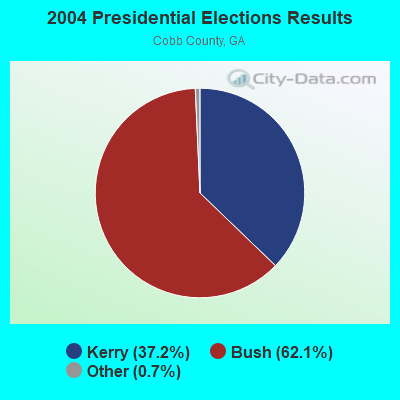

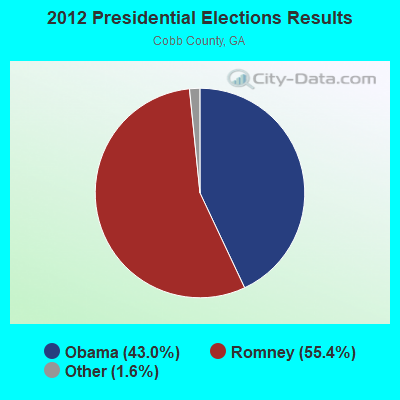
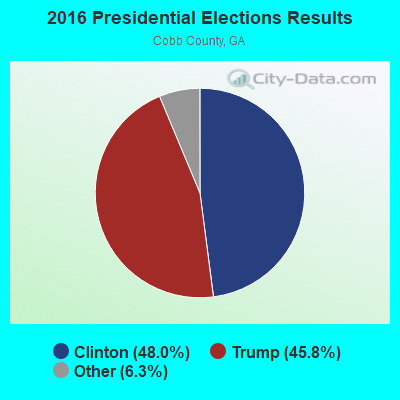
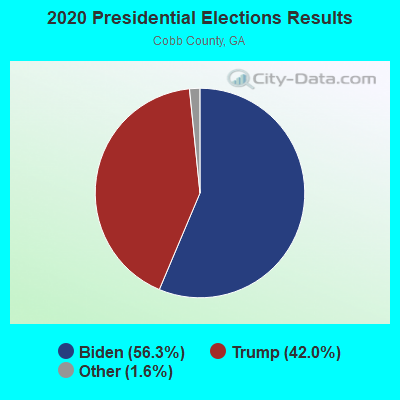
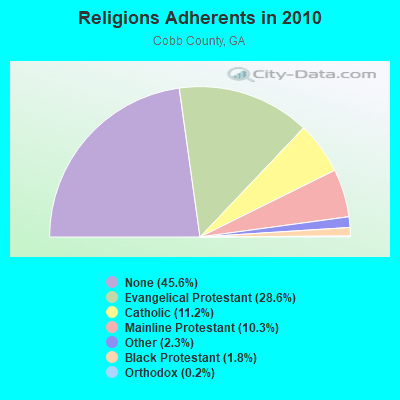
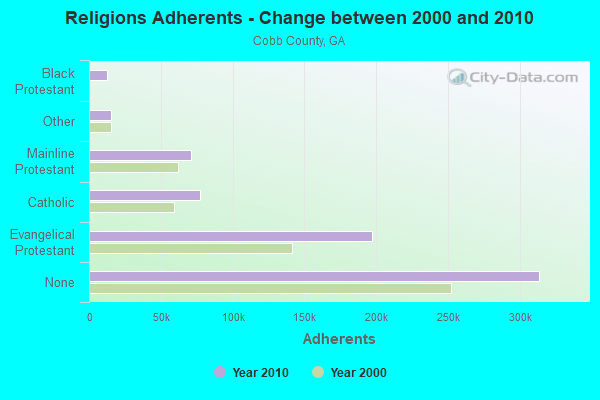
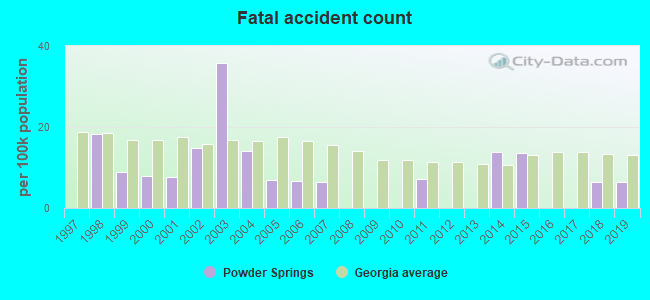
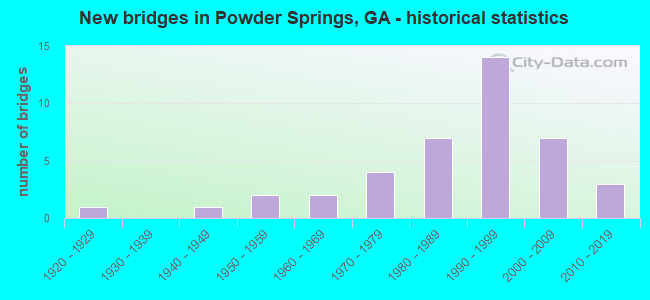
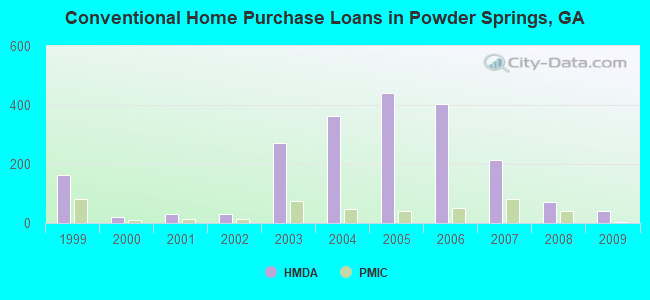
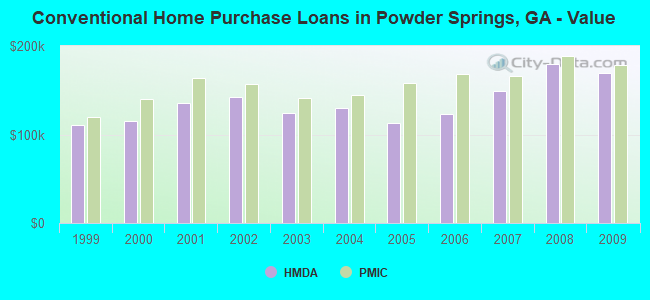
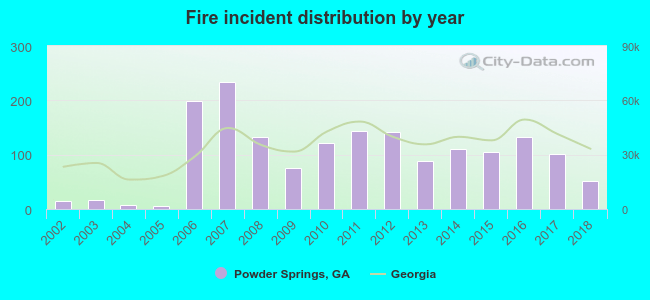 Based on the data from the years 2002 - 2018 the average number of fires per year is 99. The highest number of reported fires - 234 took place in 2007, and the least - 5 in 2005. The data has a growing trend.
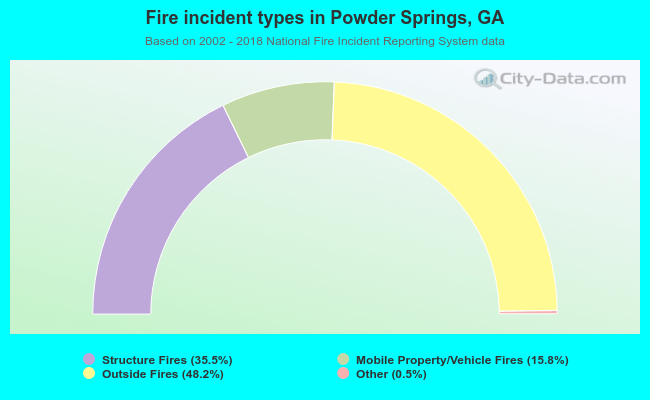 When looking into fire subcategories, the most reports belonged to: Outside Fires (48.2%), and Structure Fires (35.5%).