Robinson, Texas Submit your own pictures of this city and show them to the world
OSM Map
General Map
Google Map
MSN Map
OSM Map
General Map
Google Map
MSN Map
OSM Map
General Map
Google Map
MSN Map
OSM Map
General Map
Google Map
MSN Map
Please wait while loading the map...
Population in 2022: 12,923 (62% urban, 38% rural). Population change since 2000: +64.7%Males: 6,836 Females: 6,087
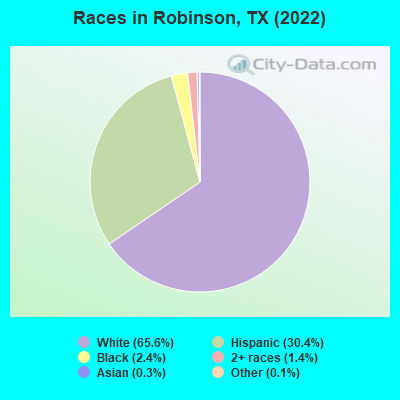
March 2022 cost of living index in Robinson: 86.1 (less than average, U.S. average is 100) Percentage of residents living in poverty in 2022: 2.1%for White Non-Hispanic residents , 3.6% for Black residents , 1.0% for Hispanic or Latino residents , 0.7% for two or more races residents )
Profiles of local businesses
Business Search - 14 Million verified businesses
Data:
Median household income ($)
Median household income (% change since 2000)
Household income diversity
Ratio of average income to average house value (%)
Ratio of average income to average rent
Median household income ($) - White
Median household income ($) - Black or African American
Median household income ($) - Asian
Median household income ($) - Hispanic or Latino
Median household income ($) - American Indian and Alaska Native
Median household income ($) - Multirace
Median household income ($) - Other Race
Median household income for houses/condos with a mortgage ($)
Median household income for apartments without a mortgage ($)
Races - White alone (%)
Races - White alone (% change since 2000)
Races - Black alone (%)
Races - Black alone (% change since 2000)
Races - American Indian alone (%)
Races - American Indian alone (% change since 2000)
Races - Asian alone (%)
Races - Asian alone (% change since 2000)
Races - Hispanic (%)
Races - Hispanic (% change since 2000)
Races - Native Hawaiian and Other Pacific Islander alone (%)
Races - Native Hawaiian and Other Pacific Islander alone (% change since 2000)
Races - Two or more races (%)
Races - Two or more races (% change since 2000)
Races - Other race alone (%)
Races - Other race alone (% change since 2000)
Racial diversity
Unemployment (%)
Unemployment (% change since 2000)
Unemployment (%) - White
Unemployment (%) - Black or African American
Unemployment (%) - Asian
Unemployment (%) - Hispanic or Latino
Unemployment (%) - American Indian and Alaska Native
Unemployment (%) - Multirace
Unemployment (%) - Other Race
Population density (people per square mile)
Population - Males (%)
Population - Females (%)
Population - Males (%) - White
Population - Males (%) - Black or African American
Population - Males (%) - Asian
Population - Males (%) - Hispanic or Latino
Population - Males (%) - American Indian and Alaska Native
Population - Males (%) - Multirace
Population - Males (%) - Other Race
Population - Females (%) - White
Population - Females (%) - Black or African American
Population - Females (%) - Asian
Population - Females (%) - Hispanic or Latino
Population - Females (%) - American Indian and Alaska Native
Population - Females (%) - Multirace
Population - Females (%) - Other Race
Coronavirus confirmed cases (Jun 19, 2024)
Deaths caused by coronavirus (Jun 19, 2024)
Coronavirus confirmed cases (per 100k population) (Jun 19, 2024)
Deaths caused by coronavirus (per 100k population) (Jun 19, 2024)
Daily increase in number of cases (Jun 19, 2024)
Weekly increase in number of cases (Jun 19, 2024)
Cases doubled (in days) (Jun 19, 2024)
Hospitalized patients (Apr 18, 2022)
Negative test results (Apr 18, 2022)
Total test results (Apr 18, 2022)
COVID Vaccine doses distributed (per 100k population) (Sep 19, 2023)
COVID Vaccine doses administered (per 100k population) (Sep 19, 2023)
COVID Vaccine doses distributed (Sep 19, 2023)
COVID Vaccine doses administered (Sep 19, 2023)
Likely homosexual households (%)
Likely homosexual households (% change since 2000)
Likely homosexual households - Lesbian couples (%)
Likely homosexual households - Lesbian couples (% change since 2000)
Likely homosexual households - Gay men (%)
Likely homosexual households - Gay men (% change since 2000)
Cost of living index
Median gross rent ($)
Median contract rent ($)
Median monthly housing costs ($)
Median house or condo value ($)
Median house or condo value ($ change since 2000)
Mean house or condo value by units in structure - 1, detached ($)
Mean house or condo value by units in structure - 1, attached ($)
Mean house or condo value by units in structure - 2 ($)
Mean house or condo value by units in structure by units in structure - 3 or 4 ($)
Mean house or condo value by units in structure - 5 or more ($)
Mean house or condo value by units in structure - Boat, RV, van, etc. ($)
Mean house or condo value by units in structure - Mobile home ($)
Median house or condo value ($) - White
Median house or condo value ($) - Black or African American
Median house or condo value ($) - Asian
Median house or condo value ($) - Hispanic or Latino
Median house or condo value ($) - American Indian and Alaska Native
Median house or condo value ($) - Multirace
Median house or condo value ($) - Other Race
Median resident age
Resident age diversity
Median resident age - Males
Median resident age - Females
Median resident age - White
Median resident age - Black or African American
Median resident age - Asian
Median resident age - Hispanic or Latino
Median resident age - American Indian and Alaska Native
Median resident age - Multirace
Median resident age - Other Race
Median resident age - Males - White
Median resident age - Males - Black or African American
Median resident age - Males - Asian
Median resident age - Males - Hispanic or Latino
Median resident age - Males - American Indian and Alaska Native
Median resident age - Males - Multirace
Median resident age - Males - Other Race
Median resident age - Females - White
Median resident age - Females - Black or African American
Median resident age - Females - Asian
Median resident age - Females - Hispanic or Latino
Median resident age - Females - American Indian and Alaska Native
Median resident age - Females - Multirace
Median resident age - Females - Other Race
Commute - mean travel time to work (minutes)
Travel time to work - Less than 5 minutes (%)
Travel time to work - Less than 5 minutes (% change since 2000)
Travel time to work - 5 to 9 minutes (%)
Travel time to work - 5 to 9 minutes (% change since 2000)
Travel time to work - 10 to 19 minutes (%)
Travel time to work - 10 to 19 minutes (% change since 2000)
Travel time to work - 20 to 29 minutes (%)
Travel time to work - 20 to 29 minutes (% change since 2000)
Travel time to work - 30 to 39 minutes (%)
Travel time to work - 30 to 39 minutes (% change since 2000)
Travel time to work - 40 to 59 minutes (%)
Travel time to work - 40 to 59 minutes (% change since 2000)
Travel time to work - 60 to 89 minutes (%)
Travel time to work - 60 to 89 minutes (% change since 2000)
Travel time to work - 90 or more minutes (%)
Travel time to work - 90 or more minutes (% change since 2000)
Marital status - Never married (%)
Marital status - Now married (%)
Marital status - Separated (%)
Marital status - Widowed (%)
Marital status - Divorced (%)
Median family income ($)
Median family income (% change since 2000)
Median non-family income ($)
Median non-family income (% change since 2000)
Median per capita income ($)
Median per capita income (% change since 2000)
Median family income ($) - White
Median family income ($) - Black or African American
Median family income ($) - Asian
Median family income ($) - Hispanic or Latino
Median family income ($) - American Indian and Alaska Native
Median family income ($) - Multirace
Median family income ($) - Other Race
Median year house/condo built
Median year apartment built
Year house built - Built 2005 or later (%)
Year house built - Built 2000 to 2004 (%)
Year house built - Built 1990 to 1999 (%)
Year house built - Built 1980 to 1989 (%)
Year house built - Built 1970 to 1979 (%)
Year house built - Built 1960 to 1969 (%)
Year house built - Built 1950 to 1959 (%)
Year house built - Built 1940 to 1949 (%)
Year house built - Built 1939 or earlier (%)
Average household size
Household density (households per square mile)
Average household size - White
Average household size - Black or African American
Average household size - Asian
Average household size - Hispanic or Latino
Average household size - American Indian and Alaska Native
Average household size - Multirace
Average household size - Other Race
Occupied housing units (%)
Vacant housing units (%)
Owner occupied housing units (%)
Renter occupied housing units (%)
Vacancy status - For rent (%)
Vacancy status - For sale only (%)
Vacancy status - Rented or sold, not occupied (%)
Vacancy status - For seasonal, recreational, or occasional use (%)
Vacancy status - For migrant workers (%)
Vacancy status - Other vacant (%)
Residents with income below the poverty level (%)
Residents with income below 50% of the poverty level (%)
Children below poverty level (%)
Poor families by family type - Married-couple family (%)
Poor families by family type - Male, no wife present (%)
Poor families by family type - Female, no husband present (%)
Poverty status for native-born residents (%)
Poverty status for foreign-born residents (%)
Poverty among high school graduates not in families (%)
Poverty among people who did not graduate high school not in families (%)
Residents with income below the poverty level (%) - White
Residents with income below the poverty level (%) - Black or African American
Residents with income below the poverty level (%) - Asian
Residents with income below the poverty level (%) - Hispanic or Latino
Residents with income below the poverty level (%) - American Indian and Alaska Native
Residents with income below the poverty level (%) - Multirace
Residents with income below the poverty level (%) - Other Race
Air pollution - Air Quality Index (AQI)
Air pollution - CO
Air pollution - NO2
Air pollution - SO2
Air pollution - Ozone
Air pollution - PM10
Air pollution - PM25
Air pollution - Pb
Crime - Murders per 100,000 population
Crime - Rapes per 100,000 population
Crime - Robberies per 100,000 population
Crime - Assaults per 100,000 population
Crime - Burglaries per 100,000 population
Crime - Thefts per 100,000 population
Crime - Auto thefts per 100,000 population
Crime - Arson per 100,000 population
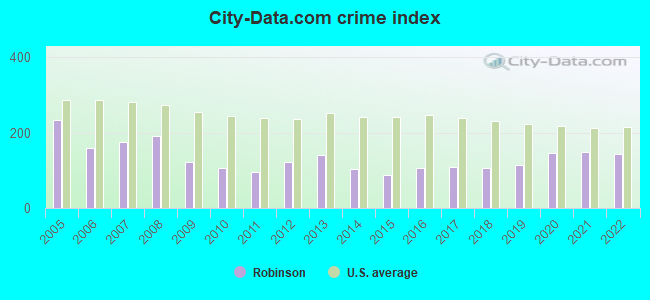
Crime - City-data.com crime index
Crime - Violent crime index
Crime - Property crime index
Crime - Murders per 100,000 population (5 year average)
Crime - Rapes per 100,000 population (5 year average)
Crime - Robberies per 100,000 population (5 year average)
Crime - Assaults per 100,000 population (5 year average)
Crime - Burglaries per 100,000 population (5 year average)
Crime - Thefts per 100,000 population (5 year average)
Crime - Auto thefts per 100,000 population (5 year average)
Crime - Arson per 100,000 population (5 year average)
Crime - City-data.com crime index (5 year average)
Crime - Violent crime index (5 year average)
Crime - Property crime index (5 year average)
1996 Presidential Elections Results (%) - Democratic Party (Clinton)
1996 Presidential Elections Results (%) - Republican Party (Dole)
1996 Presidential Elections Results (%) - Other
2000 Presidential Elections Results (%) - Democratic Party (Gore)
2000 Presidential Elections Results (%) - Republican Party (Bush)
2000 Presidential Elections Results (%) - Other
2004 Presidential Elections Results (%) - Democratic Party (Kerry)
2004 Presidential Elections Results (%) - Republican Party (Bush)
2004 Presidential Elections Results (%) - Other
2008 Presidential Elections Results (%) - Democratic Party (Obama)
2008 Presidential Elections Results (%) - Republican Party (McCain)
2008 Presidential Elections Results (%) - Other
2012 Presidential Elections Results (%) - Democratic Party (Obama)
2012 Presidential Elections Results (%) - Republican Party (Romney)
2012 Presidential Elections Results (%) - Other
2016 Presidential Elections Results (%) - Democratic Party (Clinton)
2016 Presidential Elections Results (%) - Republican Party (Trump)
2016 Presidential Elections Results (%) - Other
2020 Presidential Elections Results (%) - Democratic Party (Biden)
2020 Presidential Elections Results (%) - Republican Party (Trump)
2020 Presidential Elections Results (%) - Other
Ancestries Reported - Arab (%)
Ancestries Reported - Czech (%)
Ancestries Reported - Danish (%)
Ancestries Reported - Dutch (%)
Ancestries Reported - English (%)
Ancestries Reported - French (%)
Ancestries Reported - French Canadian (%)
Ancestries Reported - German (%)
Ancestries Reported - Greek (%)
Ancestries Reported - Hungarian (%)
Ancestries Reported - Irish (%)
Ancestries Reported - Italian (%)
Ancestries Reported - Lithuanian (%)
Ancestries Reported - Norwegian (%)
Ancestries Reported - Polish (%)
Ancestries Reported - Portuguese (%)
Ancestries Reported - Russian (%)
Ancestries Reported - Scotch-Irish (%)
Ancestries Reported - Scottish (%)
Ancestries Reported - Slovak (%)
Ancestries Reported - Subsaharan African (%)
Ancestries Reported - Swedish (%)
Ancestries Reported - Swiss (%)
Ancestries Reported - Ukrainian (%)
Ancestries Reported - United States (%)
Ancestries Reported - Welsh (%)
Ancestries Reported - West Indian (%)
Ancestries Reported - Other (%)
Educational Attainment - No schooling completed (%)
Educational Attainment - Less than high school (%)
Educational Attainment - High school or equivalent (%)
Educational Attainment - Less than 1 year of college (%)
Educational Attainment - 1 or more years of college (%)
Educational Attainment - Associate degree (%)
Educational Attainment - Bachelor's degree (%)
Educational Attainment - Master's degree (%)
Educational Attainment - Professional school degree (%)
Educational Attainment - Doctorate degree (%)
School Enrollment - Nursery, preschool (%)
School Enrollment - Kindergarten (%)
School Enrollment - Grade 1 to 4 (%)
School Enrollment - Grade 5 to 8 (%)
School Enrollment - Grade 9 to 12 (%)
School Enrollment - College undergrad (%)
School Enrollment - Graduate or professional (%)
School Enrollment - Not enrolled in school (%)
School enrollment - Public schools (%)
School enrollment - Private schools (%)
School enrollment - Not enrolled (%)
Median number of rooms in houses and condos
Median number of rooms in apartments
Housing units lacking complete plumbing facilities (%)
Housing units lacking complete kitchen facilities (%)
Density of houses
Urban houses (%)
Rural houses (%)
Households with people 60 years and over (%)
Households with people 65 years and over (%)
Households with people 75 years and over (%)
Households with one or more nonrelatives (%)
Households with no nonrelatives (%)
Population in households (%)
Family households (%)
Nonfamily households (%)
Population in families (%)
Family households with own children (%)
Median number of bedrooms in owner occupied houses
Mean number of bedrooms in owner occupied houses
Median number of bedrooms in renter occupied houses
Mean number of bedrooms in renter occupied houses
Median number of vehichles in owner occupied houses
Mean number of vehichles in owner occupied houses
Median number of vehichles in renter occupied houses
Mean number of vehichles in renter occupied houses
Mortgage status - with mortgage (%)
Mortgage status - with second mortgage (%)
Mortgage status - with home equity loan (%)
Mortgage status - with both second mortgage and home equity loan (%)
Mortgage status - without a mortgage (%)
Average family size
Average family size - White
Average family size - Black or African American
Average family size - Asian
Average family size - Hispanic or Latino
Average family size - American Indian and Alaska Native
Average family size - Multirace
Average family size - Other Race
Geographical mobility - Same house 1 year ago (%)
Geographical mobility - Moved within same county (%)
Geographical mobility - Moved from different county within same state (%)
Geographical mobility - Moved from different state (%)
Geographical mobility - Moved from abroad (%)
Place of birth - Born in state of residence (%)
Place of birth - Born in other state (%)
Place of birth - Native, outside of US (%)
Place of birth - Foreign born (%)
Housing units in structures - 1, detached (%)
Housing units in structures - 1, attached (%)
Housing units in structures - 2 (%)
Housing units in structures - 3 or 4 (%)
Housing units in structures - 5 to 9 (%)
Housing units in structures - 10 to 19 (%)
Housing units in structures - 20 to 49 (%)
Housing units in structures - 50 or more (%)
Housing units in structures - Mobile home (%)
Housing units in structures - Boat, RV, van, etc. (%)
House/condo owner moved in on average (years ago)
Renter moved in on average (years ago)
Year householder moved into unit - Moved in 1999 to March 2000 (%)
Year householder moved into unit - Moved in 1995 to 1998 (%)
Year householder moved into unit - Moved in 1990 to 1994 (%)
Year householder moved into unit - Moved in 1980 to 1989 (%)
Year householder moved into unit - Moved in 1970 to 1979 (%)
Year householder moved into unit - Moved in 1969 or earlier (%)
Means of transportation to work - Drove car alone (%)
Means of transportation to work - Carpooled (%)
Means of transportation to work - Public transportation (%)
Means of transportation to work - Bus or trolley bus (%)
Means of transportation to work - Streetcar or trolley car (%)
Means of transportation to work - Subway or elevated (%)
Means of transportation to work - Railroad (%)
Means of transportation to work - Ferryboat (%)
Means of transportation to work - Taxicab (%)
Means of transportation to work - Motorcycle (%)
Means of transportation to work - Bicycle (%)
Means of transportation to work - Walked (%)
Means of transportation to work - Other means (%)
Working at home (%)
Industry diversity
Most Common Industries - Agriculture, forestry, fishing and hunting, and mining (%)
Most Common Industries - Agriculture, forestry, fishing and hunting (%)
Most Common Industries - Mining, quarrying, and oil and gas extraction (%)
Most Common Industries - Construction (%)
Most Common Industries - Manufacturing (%)
Most Common Industries - Wholesale trade (%)
Most Common Industries - Retail trade (%)
Most Common Industries - Transportation and warehousing, and utilities (%)
Most Common Industries - Transportation and warehousing (%)
Most Common Industries - Utilities (%)
Most Common Industries - Information (%)
Most Common Industries - Finance and insurance, and real estate and rental and leasing (%)
Most Common Industries - Finance and insurance (%)
Most Common Industries - Real estate and rental and leasing (%)
Most Common Industries - Professional, scientific, and management, and administrative and waste management services (%)
Most Common Industries - Professional, scientific, and technical services (%)
Most Common Industries - Management of companies and enterprises (%)
Most Common Industries - Administrative and support and waste management services (%)
Most Common Industries - Educational services, and health care and social assistance (%)
Most Common Industries - Educational services (%)
Most Common Industries - Health care and social assistance (%)
Most Common Industries - Arts, entertainment, and recreation, and accommodation and food services (%)
Most Common Industries - Arts, entertainment, and recreation (%)
Most Common Industries - Accommodation and food services (%)
Most Common Industries - Other services, except public administration (%)
Most Common Industries - Public administration (%)
Occupation diversity
Most Common Occupations - Management, business, science, and arts occupations (%)
Most Common Occupations - Management, business, and financial occupations (%)
Most Common Occupations - Management occupations (%)
Most Common Occupations - Business and financial operations occupations (%)
Most Common Occupations - Computer, engineering, and science occupations (%)
Most Common Occupations - Computer and mathematical occupations (%)
Most Common Occupations - Architecture and engineering occupations (%)
Most Common Occupations - Life, physical, and social science occupations (%)
Most Common Occupations - Education, legal, community service, arts, and media occupations (%)
Most Common Occupations - Community and social service occupations (%)
Most Common Occupations - Legal occupations (%)
Most Common Occupations - Education, training, and library occupations (%)
Most Common Occupations - Arts, design, entertainment, sports, and media occupations (%)
Most Common Occupations - Healthcare practitioners and technical occupations (%)
Most Common Occupations - Health diagnosing and treating practitioners and other technical occupations (%)
Most Common Occupations - Health technologists and technicians (%)
Most Common Occupations - Service occupations (%)
Most Common Occupations - Healthcare support occupations (%)
Most Common Occupations - Protective service occupations (%)
Most Common Occupations - Fire fighting and prevention, and other protective service workers including supervisors (%)
Most Common Occupations - Law enforcement workers including supervisors (%)
Most Common Occupations - Food preparation and serving related occupations (%)
Most Common Occupations - Building and grounds cleaning and maintenance occupations (%)
Most Common Occupations - Personal care and service occupations (%)
Most Common Occupations - Sales and office occupations (%)
Most Common Occupations - Sales and related occupations (%)
Most Common Occupations - Office and administrative support occupations (%)
Most Common Occupations - Natural resources, construction, and maintenance occupations (%)
Most Common Occupations - Farming, fishing, and forestry occupations (%)
Most Common Occupations - Construction and extraction occupations (%)
Most Common Occupations - Installation, maintenance, and repair occupations (%)
Most Common Occupations - Production, transportation, and material moving occupations (%)
Most Common Occupations - Production occupations (%)
Most Common Occupations - Transportation occupations (%)
Most Common Occupations - Material moving occupations (%)
People in Group quarters - Institutionalized population (%)
People in Group quarters - Correctional institutions (%)
People in Group quarters - Federal prisons and detention centers (%)
People in Group quarters - Halfway houses (%)
People in Group quarters - Local jails and other confinement facilities (including police lockups) (%)
People in Group quarters - Military disciplinary barracks (%)
People in Group quarters - State prisons (%)
People in Group quarters - Other types of correctional institutions (%)
People in Group quarters - Nursing homes (%)
People in Group quarters - Hospitals/wards, hospices, and schools for the handicapped (%)
People in Group quarters - Hospitals/wards and hospices for chronically ill (%)
People in Group quarters - Hospices or homes for chronically ill (%)
People in Group quarters - Military hospitals or wards for chronically ill (%)
People in Group quarters - Other hospitals or wards for chronically ill (%)
People in Group quarters - Hospitals or wards for drug/alcohol abuse (%)
People in Group quarters - Mental (Psychiatric) hospitals or wards (%)
People in Group quarters - Schools, hospitals, or wards for the mentally retarded (%)
People in Group quarters - Schools, hospitals, or wards for the physically handicapped (%)
People in Group quarters - Institutions for the deaf (%)
People in Group quarters - Institutions for the blind (%)
People in Group quarters - Orthopedic wards and institutions for the physically handicapped (%)
People in Group quarters - Wards in general hospitals for patients who have no usual home elsewhere (%)
People in Group quarters - Wards in military hospitals for patients who have no usual home elsewhere (%)
People in Group quarters - Juvenile institutions (%)
People in Group quarters - Long-term care (%)
People in Group quarters - Homes for abused, dependent, and neglected children (%)
People in Group quarters - Residential treatment centers for emotionally disturbed children (%)
People in Group quarters - Training schools for juvenile delinquents (%)
People in Group quarters - Short-term care, detention or diagnostic centers for delinquent children (%)
People in Group quarters - Type of juvenile institution unknown (%)
People in Group quarters - Noninstitutionalized population (%)
People in Group quarters - College dormitories (includes college quarters off campus) (%)
People in Group quarters - Military quarters (%)
People in Group quarters - On base (%)
People in Group quarters - Barracks, unaccompanied personnel housing (UPH), (Enlisted/Officer), ;and similar group living quarters for military personnel (%)
People in Group quarters - Transient quarters for temporary residents (%)
People in Group quarters - Military ships (%)
People in Group quarters - Group homes (%)
People in Group quarters - Homes or halfway houses for drug/alcohol abuse (%)
People in Group quarters - Homes for the mentally ill (%)
People in Group quarters - Homes for the mentally retarded (%)
People in Group quarters - Homes for the physically handicapped (%)
People in Group quarters - Other group homes (%)
People in Group quarters - Religious group quarters (%)
People in Group quarters - Dormitories (%)
People in Group quarters - Agriculture workers' dormitories on farms (%)
People in Group quarters - Job Corps and vocational training facilities (%)
People in Group quarters - Other workers' dormitories (%)
People in Group quarters - Crews of maritime vessels (%)
People in Group quarters - Other nonhousehold living situations (%)
People in Group quarters - Other noninstitutional group quarters (%)
Residents speaking English at home (%)
Residents speaking English at home - Born in the United States (%)
Residents speaking English at home - Native, born elsewhere (%)
Residents speaking English at home - Foreign born (%)
Residents speaking Spanish at home (%)
Residents speaking Spanish at home - Born in the United States (%)
Residents speaking Spanish at home - Native, born elsewhere (%)
Residents speaking Spanish at home - Foreign born (%)
Residents speaking other language at home (%)
Residents speaking other language at home - Born in the United States (%)
Residents speaking other language at home - Native, born elsewhere (%)
Residents speaking other language at home - Foreign born (%)
Class of Workers - Employee of private company (%)
Class of Workers - Self-employed in own incorporated business (%)
Class of Workers - Private not-for-profit wage and salary workers (%)
Class of Workers - Local government workers (%)
Class of Workers - State government workers (%)
Class of Workers - Federal government workers (%)
Class of Workers - Self-employed workers in own not incorporated business and Unpaid family workers (%)
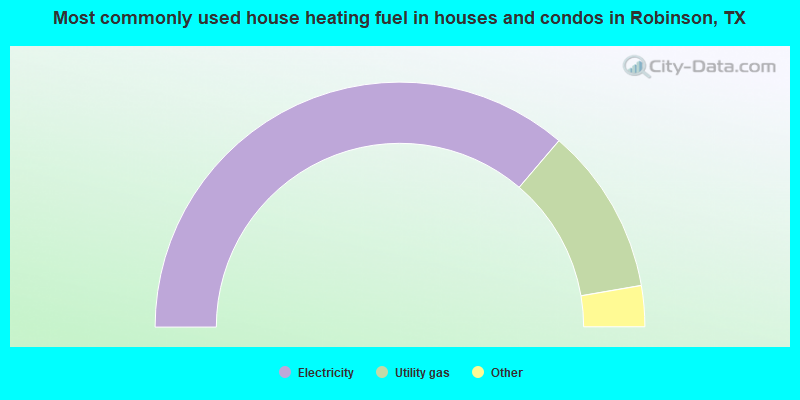
House heating fuel used in houses and condos - Utility gas (%)
House heating fuel used in houses and condos - Bottled, tank, or LP gas (%)
House heating fuel used in houses and condos - Electricity (%)
House heating fuel used in houses and condos - Fuel oil, kerosene, etc. (%)
House heating fuel used in houses and condos - Coal or coke (%)
House heating fuel used in houses and condos - Wood (%)
House heating fuel used in houses and condos - Solar energy (%)
House heating fuel used in houses and condos - Other fuel (%)
House heating fuel used in houses and condos - No fuel used (%)
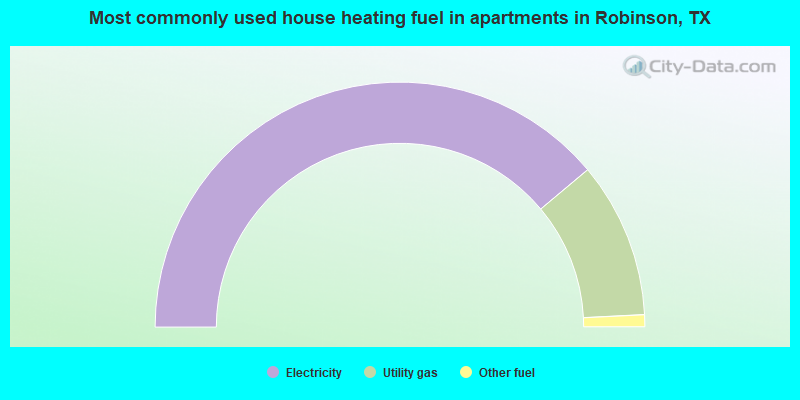
House heating fuel used in apartments - Utility gas (%)
House heating fuel used in apartments - Bottled, tank, or LP gas (%)
House heating fuel used in apartments - Electricity (%)
House heating fuel used in apartments - Fuel oil, kerosene, etc. (%)
House heating fuel used in apartments - Coal or coke (%)
House heating fuel used in apartments - Wood (%)
House heating fuel used in apartments - Solar energy (%)
House heating fuel used in apartments - Other fuel (%)
House heating fuel used in apartments - No fuel used (%)
Armed forces status - In Armed Forces (%)
Armed forces status - Civilian (%)
Armed forces status - Civilian - Veteran (%)
Armed forces status - Civilian - Nonveteran (%)
Fatal accidents locations in years 2005-2021
Fatal accidents locations in 2005
Fatal accidents locations in 2006
Fatal accidents locations in 2007
Fatal accidents locations in 2008
Fatal accidents locations in 2009
Fatal accidents locations in 2010
Fatal accidents locations in 2011
Fatal accidents locations in 2012
Fatal accidents locations in 2013
Fatal accidents locations in 2014
Fatal accidents locations in 2015
Fatal accidents locations in 2016
Fatal accidents locations in 2017
Fatal accidents locations in 2018
Fatal accidents locations in 2019
Fatal accidents locations in 2020
Fatal accidents locations in 2021
Alcohol use - People drinking some alcohol every month (%)
Alcohol use - People not drinking at all (%)
Alcohol use - Average days/month drinking alcohol
Alcohol use - Average drinks/week
Alcohol use - Average days/year people drink much
Audiometry - Average condition of hearing (%)
Audiometry - People that can hear a whisper from across a quiet room (%)
Audiometry - People that can hear normal voice from across a quiet room (%)
Audiometry - Ears ringing, roaring, buzzing (%)
Audiometry - Had a job exposure to loud noise (%)
Audiometry - Had off-work exposure to loud noise (%)
Blood Pressure & Cholesterol - Has high blood pressure (%)
Blood Pressure & Cholesterol - Checking blood pressure at home (%)
Blood Pressure & Cholesterol - Frequently checking blood cholesterol (%)
Blood Pressure & Cholesterol - Has high cholesterol level (%)
Consumer Behavior - Money monthly spent on food at supermarket/grocery store
Consumer Behavior - Money monthly spent on food at other stores
Consumer Behavior - Money monthly spent on eating out
Consumer Behavior - Money monthly spent on carryout/delivered foods
Consumer Behavior - Income spent on food at supermarket/grocery store (%)
Consumer Behavior - Income spent on food at other stores (%)
Consumer Behavior - Income spent on eating out (%)
Consumer Behavior - Income spent on carryout/delivered foods (%)
Current Health Status - General health condition (%)
Current Health Status - Blood donors (%)
Current Health Status - Has blood ever tested for HIV virus (%)
Current Health Status - Left-handed people (%)
Dermatology - People using sunscreen (%)
Diabetes - Diabetics (%)
Diabetes - Had a blood test for high blood sugar (%)
Diabetes - People taking insulin (%)
Diet Behavior & Nutrition - Diet health (%)
Diet Behavior & Nutrition - Milk product consumption (# of products/month)
Diet Behavior & Nutrition - Meals not home prepared (#/week)
Diet Behavior & Nutrition - Meals from fast food or pizza place (#/week)
Diet Behavior & Nutrition - Ready-to-eat foods (#/month)
Diet Behavior & Nutrition - Frozen meals/pizza (#/month)
Drug Use - People that ever used marijuana or hashish (%)
Drug Use - Ever used hard drugs (%)
Drug Use - Ever used any form of cocaine (%)
Drug Use - Ever used heroin (%)
Drug Use - Ever used methamphetamine (%)
Health Insurance - People covered by health insurance (%)
Kidney Conditions-Urology - Avg. # of times urinating at night
Medical Conditions - People with asthma (%)
Medical Conditions - People with anemia (%)
Medical Conditions - People with psoriasis (%)
Medical Conditions - People with overweight (%)
Medical Conditions - Elderly people having difficulties in thinking or remembering (%)
Medical Conditions - People who ever received blood transfusion (%)
Medical Conditions - People having trouble seeing even with glass/contacts (%)
Medical Conditions - People with arthritis (%)
Medical Conditions - People with gout (%)
Medical Conditions - People with congestive heart failure (%)
Medical Conditions - People with coronary heart disease (%)
Medical Conditions - People with angina pectoris (%)
Medical Conditions - People who ever had heart attack (%)
Medical Conditions - People who ever had stroke (%)
Medical Conditions - People with emphysema (%)
Medical Conditions - People with thyroid problem (%)
Medical Conditions - People with chronic bronchitis (%)
Medical Conditions - People with any liver condition (%)
Medical Conditions - People who ever had cancer or malignancy (%)
Mental Health - People who have little interest in doing things (%)
Mental Health - People feeling down, depressed, or hopeless (%)
Mental Health - People who have trouble sleeping or sleeping too much (%)
Mental Health - People feeling tired or having little energy (%)
Mental Health - People with poor appetite or overeating (%)
Mental Health - People feeling bad about themself (%)
Mental Health - People who have trouble concentrating on things (%)
Mental Health - People moving or speaking slowly or too fast (%)
Mental Health - People having thoughts they would be better off dead (%)
Oral Health - Average years since last visit a dentist
Oral Health - People embarrassed because of mouth (%)
Oral Health - People with gum disease (%)
Oral Health - General health of teeth and gums (%)
Oral Health - Average days a week using dental floss/device
Oral Health - Average days a week using mouthwash for dental problem
Oral Health - Average number of teeth
Pesticide Use - Households using pesticides to control insects (%)
Pesticide Use - Households using pesticides to kill weeds (%)
Physical Activity - People doing vigorous-intensity work activities (%)
Physical Activity - People doing moderate-intensity work activities (%)
Physical Activity - People walking or bicycling (%)
Physical Activity - People doing vigorous-intensity recreational activities (%)
Physical Activity - People doing moderate-intensity recreational activities (%)
Physical Activity - Average hours a day doing sedentary activities
Physical Activity - Average hours a day watching TV or videos
Physical Activity - Average hours a day using computer
Physical Functioning - People having limitations keeping them from working (%)
Physical Functioning - People limited in amount of work they can do (%)
Physical Functioning - People that need special equipment to walk (%)
Physical Functioning - People experiencing confusion/memory problems (%)
Physical Functioning - People requiring special healthcare equipment (%)
Prescription Medications - Average number of prescription medicines taking
Preventive Aspirin Use - Adults 40+ taking low-dose aspirin (%)
Reproductive Health - Vaginal deliveries (%)
Reproductive Health - Cesarean deliveries (%)
Reproductive Health - Deliveries resulted in a live birth (%)
Reproductive Health - Pregnancies resulted in a delivery (%)
Reproductive Health - Women breastfeeding newborns (%)
Reproductive Health - Women that had a hysterectomy (%)
Reproductive Health - Women that had both ovaries removed (%)
Reproductive Health - Women that have ever taken birth control pills (%)
Reproductive Health - Women taking birth control pills (%)
Reproductive Health - Women that have ever used Depo-Provera or injectables (%)
Reproductive Health - Women that have ever used female hormones (%)
Sexual Behavior - People 18+ that ever had sex (vaginal, anal, or oral) (%)
Sexual Behavior - Males 18+ that ever had vaginal sex with a woman (%)
Sexual Behavior - Males 18+ that ever performed oral sex on a woman (%)
Sexual Behavior - Males 18+ that ever had anal sex with a woman (%)
Sexual Behavior - Males 18+ that ever had any sex with a man (%)
Sexual Behavior - Females 18+ that ever had vaginal sex with a man (%)
Sexual Behavior - Females 18+ that ever performed oral sex on a man (%)
Sexual Behavior - Females 18+ that ever had anal sex with a man (%)
Sexual Behavior - Females 18+ that ever had any kind of sex with a woman (%)
Sexual Behavior - Average age people first had sex
Sexual Behavior - Average number of female sex partners in lifetime (males 18+)
Sexual Behavior - Average number of female vaginal sex partners in lifetime (males 18+)
Sexual Behavior - Average age people first performed oral sex on a woman (18+)
Sexual Behavior - Average number of woman performed oral sex on in lifetime (18+)
Sexual Behavior - Average number of male sex partners in lifetime (males 18+)
Sexual Behavior - Average number of male anal sex partners in lifetime (males 18+)
Sexual Behavior - Average age people first performed oral sex on a man (18+)
Sexual Behavior - Average number of male oral sex partners in lifetime (18+)
Sexual Behavior - People using protection when performing oral sex (%)
Sexual Behavior - Average number of times people have vaginal or anal sex a year
Sexual Behavior - People having sex without condom (%)
Sexual Behavior - Average number of male sex partners in lifetime (females 18+)
Sexual Behavior - Average number of male vaginal sex partners in lifetime (females 18+)
Sexual Behavior - Average number of female sex partners in lifetime (females 18+)
Sexual Behavior - Circumcised males 18+ (%)
Sleep Disorders - Average hours sleeping at night
Sleep Disorders - People that has trouble sleeping (%)
Smoking-Cigarette Use - People smoking cigarettes (%)
Taste & Smell - People 40+ having problems with smell (%)
Taste & Smell - People 40+ having problems with taste (%)
Taste & Smell - People 40+ that ever had wisdom teeth removed (%)
Taste & Smell - People 40+ that ever had tonsils teeth removed (%)
Taste & Smell - People 40+ that ever had a loss of consciousness because of a head injury (%)
Taste & Smell - People 40+ that ever had a broken nose or other serious injury to face or skull (%)
Taste & Smell - People 40+ that ever had two or more sinus infections (%)
Weight - Average height (inches)
Weight - Average weight (pounds)
Weight - Average BMI
Weight - People that are obese (%)
Weight - People that ever were obese (%)
Weight - People trying to lose weight (%)
According to our research of Texas and other state lists, there were 12 registered sex offenders living in Robinson, Texas as of June 19, 2024 . The ratio of all residents to sex offenders in Robinson is 963 to 1.The ratio of registered sex offenders to all residents in this city is lower than the state average.
Officers per 1,000 residents here:
1.80Texas average:
2.07
Latest news from Robinson, TX collected exclusively by city-data.com from local newspapers, TV, and radio stations
Ancestries: German (15.4%), American (8.7%), English (7.4%), Irish (6.9%), British (2.8%), Czech (2.7%).
Current Local Time:
Land area: 31.6 square miles.
Population density: 410 people per square mile (low).
586 residents are foreign born (3.3% Latin America , 1.0% Europe ).
This city:
4.6%Texas:
17.1%
Median real estate property taxes paid for housing units with mortgages in 2022: $4,847 (1.6%)Median real estate property taxes paid for housing units with no mortgage in 2022: $3,526 (1.4%)
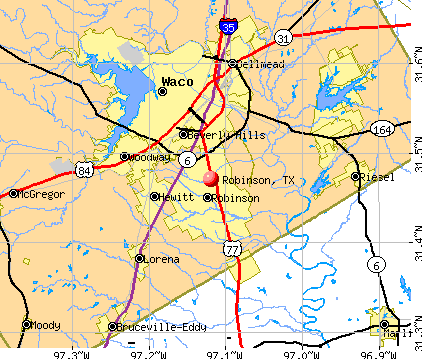
Nearest city with pop. 50,000+: Waco, TX
Nearest city with pop. 200,000+: Arlington, TX
Nearest city with pop. 1,000,000+: Dallas, TX
Nearest cities:
Latitude: 31.47 N, Longitude: 97.12 W
Daytime population change due to commuting: -3,214 (-25.2%)Workers who live and work in this city: 940 (15.8%)
Area code commonly used in this area: 254
Single-family new house construction building permits:
2022: 25 buildings , average cost: $256,2002021: 82 buildings , average cost: $217,5002020: 89 buildings , average cost: $253,0002019: 60 buildings , average cost: $235,4002018: 61 buildings , average cost: $195,2002017: 42 buildings , average cost: $214,6002016: 49 buildings , average cost: $214,9002015: 25 buildings , average cost: $132,0002014: 41 buildings , average cost: $167,6002013: 51 buildings , average cost: $174,2002012: 76 buildings , average cost: $132,8002011: 85 buildings , average cost: $148,4002010: 88 buildings , average cost: $153,4002009: 57 buildings , average cost: $156,4002008: 81 buildings , average cost: $148,3002007: 136 buildings , average cost: $125,1002006: 126 buildings , average cost: $146,4002005: 282 buildings , average cost: $117,6002004: 135 buildings , average cost: $119,2002003: 96 buildings , average cost: $117,6002002: 54 buildings , average cost: $130,8002001: 55 buildings , average cost: $136,0002000: 72 buildings , average cost: $120,2001999: 71 buildings , average cost: $112,7001998: 63 buildings , average cost: $114,7001997: 69 buildings , average cost: $101,300Unemployment in December 2023:
Population change in the 1990s: +832 (+11.9%).
Most common occupations in Robinson, TX (%)
Both Males Females
Other office and administrative support workers, including supervisors (5.4%)
Other management occupations, except farmers and farm managers (5.1%)
Other production occupations, including supervisors (5.1%)
Driver/sales workers and truck drivers (4.9%)
Preschool, kindergarten, elementary, and middle school teachers (4.6%)
Building and grounds cleaning and maintenance occupations (3.6%)
Retail sales workers, except cashiers (3.5%)
Driver/sales workers and truck drivers (9.3%)
Other production occupations, including supervisors (7.9%)
Electrical equipment mechanics and other installation, maintenance, and repair workers, including supervisors (6.2%)
Other sales and related occupations, including supervisors (5.0%)
Other management occupations, except farmers and farm managers (5.0%)
Material recording, scheduling, dispatching, and distributing workers (3.7%)
Building and grounds cleaning and maintenance occupations (3.5%)
Other office and administrative support workers, including supervisors (8.5%)
Preschool, kindergarten, elementary, and middle school teachers (7.6%)
Information and record clerks, except customer service representatives (6.6%)
Secretaries and administrative assistants (6.2%)
Other management occupations, except farmers and farm managers (5.2%)
Retail sales workers, except cashiers (4.6%)
Building and grounds cleaning and maintenance occupations (3.7%)
Tornado activity:
Robinson-area historical tornado activity is slightly above Texas state average. It is 80% greater than the overall U.S. average.
On 5/11/1953, a category F5 (max. wind speeds 261-318 mph) tornado 5.8 miles away from the Robinson city center killed 114 people and injured 597 people and caused between $5,000,000 and $50,000,000 in damages.
On 5/6/1973, a category F5 tornado 22.5 miles away from the city center .
Earthquake activity:
Robinson-area historical earthquake activity is significantly above Texas state average. It is 322% greater than the overall U.S. average. On 11/6/2011 at 03:53:10, a magnitude 5.7 (5.7 MW, Depth: 3.2 mi, Class: Moderate, Intensity: VI - VII) earthquake occurred 281.7 miles away from Robinson center On 6/16/1978 at 11:46:54, a magnitude 5.3 (4.4 MB, 4.6 UK, 5.3 ML) earthquake occurred 239.0 miles away from the city center On 9/3/2016 at 12:02:44, a magnitude 5.8 (5.8 MW, Depth: 3.5 mi) earthquake occurred 342.9 miles away from Robinson center On 5/17/2012 at 08:12:00, a magnitude 4.8 (4.8 MW, Depth: 3.1 mi, Class: Light, Intensity: IV - V) earthquake occurred 164.9 miles away from the city center On 10/20/2011 at 12:24:41, a magnitude 4.8 (4.8 MW, Depth: 3.1 mi) earthquake occurred 189.1 miles away from Robinson center On 4/14/1995 at 00:32:56, a magnitude 5.7 (5.6 MB, 5.7 MS, 5.7 MW, Depth: 11.1 mi) earthquake occurred 379.9 miles away from Robinson center Magnitude types: body-wave magnitude (MB), local magnitude (ML), surface-wave magnitude (MS), moment magnitude (MW) Natural disasters: The number of natural disasters in McLennan County (20) is greater than the US average (15).Major Disasters (Presidential) Declared: 9Emergencies Declared: 10Floods: 6, Storms: 6, Hurricanes: 5, Tornadoes: 5, Fires: 4, Explosions: 2, Winds: 2, Other: 2 (Note: some incidents may be assigned to more than one category). Hospitals and medical centers in Robinson: ROBINSON NURSING CENTER (305 SOUTH ANDREWS)
Other hospitals and medical centers near Robinson: WEST WARD GROUP HOME (Hospital, about 1 miles away; WACO, TX)
SENIOR CARE OF HEWITT (Nursing Home, about 6 miles away; HEWITT, TX)
AMEDISYS HOME HEALTH OF WACO (Home Health Center, about 6 miles away; WACO, TX)
TEXAS HOME HEALTH HOSPICE (Hospital, about 6 miles away; WACO, TX)
ROYAL MANOR (Nursing Home, about 6 miles away; WACO, TX)
GREENVIEW MANOR (Nursing Home, about 6 miles away; WACO, TX)
JEFFREY PLACE HEALTHCARE CENTER (Nursing Home, about 6 miles away; WACO, TX)
Amtrak station near Robinson: 17 miles: MCGREGOR (1 AMTRAK BLVD.) Services: fully wheelchair accessible, enclosed waiting area, public restrooms, public payphones, vending machines, free short-term parking, free long-term parking, call for taxi service.
Colleges/universities with over 2000 students nearest to Robinson:
Baylor University (about 6 miles; Waco, TX ; Full-time enrollment: 14,800)
McLennan Community College (about 9 miles; Waco, TX ; FT enrollment: 6,673)
Texas State Technical College-Waco (about 12 miles; Waco, TX ; FT enrollment: 4,210)
Temple College (about 31 miles; Temple, TX ; FT enrollment: 3,796)
University of Mary Hardin-Baylor (about 35 miles; Belton, TX ; FT enrollment: 2,885)
Hill College (about 38 miles; Hillsboro, TX ; FT enrollment: 2,968)
Central Texas College (about 48 miles; Killeen, TX ; FT enrollment: 15,911)
Public high schools in Robinson: ROBINSON EL Students: 671, Location: 151 PEPLOW, Grades: 1-10)ROBINSON H S Students: 562, Location: 700 W TATE, Grades: 9-12)Public elementary/middle schools in Robinson: ROBINSON J H Students: 316, Location: 410 W LYNDALE, Grades: 6-8)ROBINSON PRI Students: 310, Location: 541 N OLD ROBINSON RD, Grades: PK-1)ROBINSON INT Students: 293, Location: 500 W LYNDALE AVE, Grades: 4-5)See full list of schools located in Robinson
Notable locations in Robinson: (A) , Robinson Volunteer Fire Department Station 1 (B) , Robinson Volunteer Fire Department Station 2 (C) . Display/hide their locations on the map
Churches in Robinson include: (A) , Mount Zion Church (B) , Saint Pauls Church (C) , First Baptist Church of Robinson (D) , Sonrise Baptist Church (E) , Saint Paul Missionary Baptist Church (F) , Youngblood Memorial Presbyterian Church (G) , Bethel Methodist Church of Robinson (H) , Church of Christ (I) . Display/hide their locations on the map
Cemeteries: (1) , Waco Memorial Park (2) , Chapel Hill Memorial Park (3) , Christian Cemetery (4) , Saint Pauls Memorial Cemetery (5) . Display/hide their locations on the map
Reservoirs: (A) , Soil Conservation Service Site 2 Reservoir (B) , Soil Conservation Service Site 3 Reservoir (C) , Soil Conservation Service Site 6 Reservoir (D) , Soil Conservation Service Site 4 Reservoir (E) , Soil Conservation Service Site 7 Reservoir (F) . Display/hide their locations on the map
Creeks: (A) , North Flat Creek (B) , Crow Creek (C) . Display/hide their locations on the map
McLennan County has a predicted average indoor radon screening level less than 2 pCi/L (pico curies per liter) - Low Potential Average household size: This city:
2.8 peopleTexas:
2.8 people
Percentage of family households: This city:
79.8%Whole state:
69.9%
Percentage of households with unmarried partners: This city:
4.0%Whole state:
6.0%
Likely homosexual households (counted as self-reported same-sex unmarried-partner households)
Lesbian couples: 0.3% of all households Gay men: 0.3% of all households
6 people in group homes intended for adults in 2010people in homes for the mentally ill in 2000
Banks with branches in Robinson (2011 data):
Fidelity Bank of Texas: Robinson Branch at 410 South Robinson Drive, branch established on 1985/03/18. Info updated 2008/04/11: Bank assets: $80.5 mil, Deposits: $71.4 mil, headquarters in Waco, TX, positive income , Commercial Lending Specialization, 2 total offices , Holding Company: Fidelity Bancshares, Inc.
For population 15 years and over in Robinson:
Never married: 30.9%Now married: 56.7%Separated: 0.4%Widowed: 5.3%Divorced: 6.7% For population 25 years and over in Robinson:
High school or higher: 89.9%Bachelor's degree or higher: 22.2%Graduate or professional degree: 7.1%Unemployed: 1.9%Mean travel time to work (commute): 18.8 minutes
Education Gini index (Inequality in education) Here:
11.2Texas average:
14.0
Religion statistics for Robinson, TX (based on McLennan County data)
Religion Adherents Congregations Evangelical Protestant 82,151 269 Catholic 27,864 14 Mainline Protestant 22,333 59 Other 7,894 14 Black Protestant 3,855 21 Orthodox 160 1 None 90,649 -
Source: Clifford Grammich, Kirk Hadaway, Richard Houseal, Dale E.Jones, Alexei Krindatch, Richie Stanley and Richard H.Taylor. 2012. 2010 U.S.Religion Census: Religious Congregations & Membership Study. Association of Statisticians of American Religious Bodies. Jones, Dale E., et al. 2002. Congregations and Membership in the United States 2000. Nashville, TN: Glenmary Research Center. Graphs represent county-level data
Food Environment Statistics: Number of grocery stores : 22McLennan County :
0.97 / 10,000 pop.State :
1.47 / 10,000 pop.
Number of supercenters and club stores : 3This county :
0.13 / 10,000 pop.Texas :
0.14 / 10,000 pop.
Number of convenience stores (no gas) : 25This county :
1.10 / 10,000 pop.Texas :
1.11 / 10,000 pop.
Number of convenience stores (with gas) : 115This county :
5.05 / 10,000 pop.Texas :
3.95 / 10,000 pop.
Number of full-service restaurants : 127McLennan County :
5.57 / 10,000 pop.State :
6.13 / 10,000 pop.
Adult diabetes rate : McLennan County :
10.1%Texas :
8.9%
Low-income preschool obesity rate : McLennan County :
12.6%Texas :
15.7%
Health and Nutrition: Healthy diet rate : This city:
52.0%State:
48.6%
Average overall health of teeth and gums : People feeling badly about themselves : Robinson:
21.1%Texas:
20.6%
People not drinking alcohol at all : Average hours sleeping at night : Overweight people : This city:
36.2%Texas:
33.1%
General health condition : This city:
58.2%Texas:
56.2%
Average condition of hearing : Robinson:
78.7%Texas:
80.7%
More about Health and Nutrition of Robinson, TX Residents
Local government employment and payroll (March 2022)
Function
Full-time employees
Monthly full-time payroll
Average yearly full-time wage
Part-time employees
Monthly part-time payroll
Police Protection - Officers
24 $135,353 $67,677 0 $0 Other and Unallocable
14 $64,044 $54,895 0 $0 Streets and Highways
8 $36,299 $54,449 0 $0 Water Supply
8 $45,113 $67,670 0 $0 Other Government Administration
5 $31,230 $74,952 0 $0 Sewerage
5 $19,224 $46,138 0 $0 Financial Administration
5 $27,735 $66,564 0 $0 Police - Other
3 $14,253 $57,012 0 $0 Judicial and Legal
2 $10,082 $60,492 3 $6,058
Totals for Government
74 $383,333 $62,162 3 $6,058
Robinson government finances - Expenditure in 2017 (per resident):
Current Operations - Police Protection: $2,051,000 ($158.71)
Water Utilities: $1,709,000 ($132.24)General - Other: $854,000 ($66.08)Sewerage: $765,000 ($59.20)Solid Waste Management: $682,000 ($52.77)Central Staff Services: $641,000 ($49.60)Judicial and Legal Services: $519,000 ($40.16)Local Fire Protection: $258,000 ($19.96)General Public Buildings: $131,000 ($10.14)Financial Administration: $123,000 ($9.52)General - Interest on Debt: $352,000 ($27.24)
Intergovernmental to Local - Other - Sewerage: $182,000 ($14.08)
Other - Health - Other: $16,000 ($1.24)Total Salaries and Wages: $2,548,000 ($197.17)
Water Utilities - Interest on Debt: $422,000 ($32.65)
Robinson government finances - Revenue in 2017 (per resident):
Charges - Sewerage: $1,273,000 ($98.51)
Solid Waste Management: $600,000 ($46.43)Miscellaneous - Fines and Forfeits: $214,000 ($16.56)
Rents: $122,000 ($9.44)General Revenue - Other: $82,000 ($6.35)Interest Earnings: $73,000 ($5.65)Revenue - Water Utilities: $3,323,000 ($257.14)
Tax - Property: $2,698,000 ($208.78)
General Sales and Gross Receipts: $1,205,000 ($93.24)Public Utilities Sales: $610,000 ($47.20)Other License: $77,000 ($5.96)
Robinson government finances - Debt in 2017 (per resident):
Long Term Debt - Beginning Outstanding - Unspecified Public Purpose: $15,705,000 ($1215.28)
Outstanding Unspecified Public Purpose: $14,063,000 ($1088.21)Retired Unspecified Public Purpose: $1,642,000 ($127.06)
Robinson government finances - Cash and Securities in 2017 (per resident):
Bond Funds - Cash and Securities: $5,406,000 ($418.32)
Other Funds - Cash and Securities: $4,072,000 ($315.10)
Sinking Funds - Cash and Securities: $433,000 ($33.51)
Businesses in Robinson, TX
Name Count Name Count
Curves 1 SONIC Drive-In 1 Dairy Queen 1 Subway 2 Days Inn 1 UPS 1 McDonald's 1 Wendy's 1
Strongest AM radio stations in Robinson:
KRZI (1580 AM; 10 kW; WACO, TX; Owner: VAN D. GOODALL, JR.)
KRZX (1660 AM; 10 kW; WACO, TX; Owner: VAN D. GOODALL, JR.)
KBBW (1010 AM; 10 kW; WACO-MARLIN, TX; Owner: AMERICAN BROADCASTING OF TEXAS)
KWTX (1230 AM; 1 kW; WACO, TX; Owner: CAPSTAR TX LIMITED PARTNERSHIP)
WBAP (820 AM; 50 kW; FORT WORTH, TX; Owner: WBAP-KSCS OPERATING, LTD.)
KESS (1270 AM; 50 kW; FORT WORTH, TX; Owner: KESS-AM LICENSE CORP.)
KAHZ (1360 AM; 50 kW; HURST, TX)
KRLD (1080 AM; 50 kW; DALLAS, TX; Owner: TEXAS INFINITY BROADCASTING L.P.)
KZMP (1540 AM; 50 kW; UNIVERSITY PARK, TX; Owner: ENTRAVISION HOLDINGS, LLC)
KFXR (1190 AM; 50 kW; DALLAS, TX; Owner: CLEAR CHANNEL BROADCASTING LICENSES, INC.)
KSKY (660 AM; 20 kW; BALCH SPRINGS, TX; Owner: BISON MEDIA, INC.)
KTKR (760 AM; 50 kW; SAN ANTONIO, TX; Owner: CCB TEXAS LICENSES, L.P.)
KKYX (680 AM; 50 kW; SAN ANTONIO, TX; Owner: CXR HOLDINGS, INC.)
Strongest FM radio stations in Robinson:
KWBU-FM (103.3 FM; WACO, TX; Owner: BRAZOS VALLEY PUBLIC BROADCASTING FOUNDATION)
KBCT (94.5 FM; WACO, TX; Owner: KENNELWOOD BCST/G COMPANY, INC.)
WACO-FM (99.9 FM; WACO, TX; Owner: CAPSTAR TX LIMITED PARTNERSHIP)
KWTX-FM (97.5 FM; WACO, TX; Owner: CAPSTAR TX LIMITED PARTNERSHIP)
KLRK (92.9 FM; MARLIN, TX; Owner: VAN D. GOODALL, JR.)
KBGO (95.7 FM; WACO, TX; Owner: CAPSTAR TX LIMITED PARTNERSHIP)
KBDE (89.9 FM; TEMPLE, TX; Owner: AMERICAN FAMILY ASSOCIATION)
KNCT-FM (91.3 FM; KILLEEN, TX; Owner: CENTRAL TEXAS COLLEGE)
KLTD (101.7 FM; TEMPLE, TX; Owner: CUMULUS LICENSING CORP.)
KBRQ (102.5 FM; HILLSBORO, TX; Owner: CHASE RADIO PROPERTIES, L.L.C.)
K221DF (92.1 FM; WACO, ETC., TX; Owner: JAKE E. KING AND JOHN S. LATOUR)
TV broadcast stations around Robinson:
KWBU-TV (Channel 34; WACO, TX; Owner: BRAZOS VALLEY PUBLIC BROADCASTING FOUNDATION)
KCEN-TV (Channel 6; TEMPLE, TX; Owner: CHANNEL 6, INC.)
KXXV (Channel 25; WACO, TX; Owner: CENTEX TELEVISION LIMITED PARTNERSHIP)
KWKT (Channel 44; WACO, TX; Owner: COMCORP OF TEXAS LICENSE CORP.)
KWTX-TV (Channel 10; WACO, TX; Owner: KWTX-KBTX LICENSEE CORP.)
KNCT (Channel 46; BELTON, TX; Owner: CENTRAL TEXAS COLLEGE)
K38FN (Channel 38; WACO, TX; Owner: NATIONAL MINORITY T.V., INC.)
National Bridge Inventory (NBI) Statistics 61 Number of bridges1,293ft / 394m Total length $15,356,000 Total costs1,147,339 Total average daily traffic251,924 Total average daily truck traffic
New bridges - historical statistics
5 1930-1939 5 1960-1969 7 1970-1979 6 1980-1989 4 1990-1999 19 2000-2009 15 2010-2019
See full National Bridge Inventory statistics for Robinson, TX
FCC Registered Cell Phone Towers: 1 (
See the full list of FCC Registered Cell Phone Towers in Robinson )
FCC Registered Antenna Towers: 43 (
See the full list of FCC Registered Antenna Towers )
FCC Registered Broadcast Land Mobile Towers: 3
L1, Lat: 31.469056 Lon: -97.116111, Call Sign: KNFY803, Assigned Frequencies: 159.735 MHz, 160.020 MHz, 160.185 MHz, Grant Date: 03/08/2012, Expiration Date: 05/06/2022, Cancellation Date: 07/09/2022, Certifier: Dale Pattillo, Registrant: Bearcom Operating LP, 111 W. Lyndale Dr., Dallas, TX 75355-9001, Phone: (214) 765-7328, Fax: (214) 355-4971, Email:
Lat: 31.465833 Lon: -97.120222, Call Sign: WQNB495, Assigned Frequencies: 72.3000 MHz, Grant Date: 12/02/2010, Expiration Date: 12/02/2020, Cancellation Date: 02/06/2021, Certifier: David Wrzesinski, Registrant: Primex Wireless, Inc., 965 Wells Street, Lake Geneva, WI 53147, Phone: (800) 537-0464Lat: 31.465833 Lon: -97.120222, Call Sign: WRYH856, Assigned Frequencies: 72.3000 MHz, Grant Date: 08/11/2023, Expiration Date: 08/11/2033, Certifier: David Wrzesinski, Registrant: Primex Wireless, Inc., 965 S Wells St., Lake Geneva, WI 53147, Phone: (262) 729-4858, Email:
FCC Registered Microwave Towers: 7
WAC0104, 402 W. Moonlight Drive (Lat: 31.455972 Lon: -97.115972), Type: Pole, Structure height: 48.8 m, Overall height: 49 m, Call Sign: WQAW419, Licensee ID: L01728370, Assigned Frequencies: 10637.5 MHz, Grant Date: 08/18/2004, Expiration Date: 08/18/2014, Cancellation Date: 09/13/2013, Certifier: Joseph M Sandri Jr., Registrant: Fibertower Network Services, Corp., Debtor-In-Possession, 1875 Eye Street, Nw, 5th Floor, Room 505, Washington, DC 20006, Phone: (202) 223-1028, Email:
TX-WCO015A, 503 Hwy. 77 N (Lat: 31.480861 Lon: -97.119389), Type: Pole, Structure height: 45.1 m, Overall height: 51.2 m, Call Sign: WQDW727, Assigned Frequencies: 11385.0 MHz, 17915.0 MHz, 11265.0 MHz, 17815.0 MHz, Grant Date: 10/20/2015, Expiration Date: 11/17/2025, Cancellation Date: 08/08/2018, Certifier: Nadja S Sodos-Wallace, Registrant: Sprint Corporation, 12502 Sunrise Valley Drive, M/S: Varesa0209, Reston, VA 20196, Phone: (800) 572-8256, Fax: (703) 433-4483, Email:
AU54XC226, Au54xc226 (Lat: 31.426639 Lon: -97.101444), Type: Ltower, Structure height: 76.2 m, Overall height: 78.9 m, Call Sign: WQOM937, Assigned Frequencies: 11225.0 MHz, 11265.0 MHz, 11055.0 MHz, 11095.0 MHz, 11225.0 MHz, 11265.0 MHz, 11055.0 MHz, 11095.0 MHz, 11225.0 MHz, 11265.0 MHz... (+14 more), Grant Date: 02/16/2022, Expiration Date: 11/22/2031, Cancellation Date: 12/12/2022, Certifier: David Werblow, Registrant: T-Mobile Usa, Inc., 12920 Se 38th St, Bellevue, WA 98006, Phone: (425) 383-8401, Fax: (425) 383-4840, Email:
WA01401A, 751 South Robinson Drive (Robison #309005) (Lat: 31.461556 Lon: -97.112222), Type: Ltower, Structure height: 77.7 m, Overall height: 80.2 m, Call Sign: WQWS294, Assigned Frequencies: 6034.15 MHz, 6034.15 MHz, 6034.15 MHz, 6034.15 MHz, 6034.15 MHz, 6034.15 MHz, 6034.15 MHz, 6034.15 MHz, Grant Date: 11/04/2015, Expiration Date: 11/04/2025, Cancellation Date: 07/14/2022, Certifier: David Werblow, Registrant: T-Mobile Usa, Inc., 12920 Se 38th Street, Bellevue, WA 98006, Phone: (425) 383-8401, Fax: (425) 383-4040, Email:
Robinson, 751 South Robinson Drive (Robison #309005) (Lat: 31.461556 Lon: -97.112222), Type: Ltower, Structure height: 77.7 m, Overall height: 80.2 m, Call Sign: WQZE228, Assigned Frequencies: 17980.0 MHz, 17980.0 MHz, 17980.0 MHz, 17980.0 MHz, 17980.0 MHz, 17980.0 MHz, 17980.0 MHz, 17980.0 MHz, 17980.0 MHz, 17980.0 MHz... (+42 more), Grant Date: 04/19/2017, Expiration Date: 04/19/2027, Certifier: Derrick Brown, Registrant: Amg Technology Investment Group, LLC, 95 Parker Oaks Lane, Hudson Oaks, TX 76087, Phone: (855) 698-5465, Email:
WA02029S, Au54xc226 (Lat: 31.426639 Lon: -97.101444), Type: Ltower, Structure height: 76.2 m, Overall height: 78.9 m, Call Sign: WRPT546, Assigned Frequencies: 10935.0 MHz, 10975.0 MHz, 10935.0 MHz, 10975.0 MHz, 10935.0 MHz, 10975.0 MHz, 10935.0 MHz, 10975.0 MHz, 10935.0 MHz, 10975.0 MHz... (+22 more), Grant Date: 03/15/2022, Expiration Date: 03/15/2032, Cancellation Date: 05/12/2023, Certifier: Jenny Knopf, Registrant: T-Mobile Usa, Inc., 12920 Se 38th Street, Bellevue, WA 98006, Phone: (425) 383-8401, Fax: (425) 383-4040, Email:
AUWCO00047A, 400 Fm3148 (Lat: 31.455861 Lon: -97.116056), Type: Mtower, Structure height: 44 m, Call Sign: WRXU828, Assigned Frequencies: 11545.0 MHz, 11545.0 MHz, 11545.0 MHz, 11545.0 MHz, 11545.0 MHz, 11545.0 MHz, 11545.0 MHz, 11545.0 MHz, 11545.0 MHz, 11545.0 MHz, 11545.0 MHz, 11545.0 MHz, Grant Date: 06/29/2023, Expiration Date: 06/29/2033, Certifier: Alison A Minea, Registrant: Dish Wireless L.L.C., 9601 S Meridan Blvd, Englewood, CO 80112, Phone: (202) 463-3709, Email:
FCC Registered Amateur Radio Licenses: 32 (
See the full list of FCC Registered Amateur Radio Licenses in Robinson )
FAA Registered Aircraft: 11 (
See the full list of FAA Registered Aircraft in Robinson )
Home Mortgage Disclosure Act Aggregated Statistics For Year 2009(Based on 1 full and 2 partial tracts) A) FHA, FSA/RHS & VA B) Conventional C) Refinancings D) Home Improvement Loans F) Non-occupant Loans on Number Average Value Number Average Value Number Average Value Number Average Value Number Average Value
LOANS ORIGINATED 39 $142,024 54 $133,452 99 $132,256 9 $24,311 20 $85,344 APPLICATIONS APPROVED, NOT ACCEPTED 3 $217,740 1 $102,000 11 $112,968 3 $11,200 0 $0 APPLICATIONS DENIED 1 $215,450 5 $135,452 34 $121,201 9 $22,057 1 $120,000 APPLICATIONS WITHDRAWN 9 $141,652 7 $136,244 13 $201,462 2 $36,370 4 $315,285 FILES CLOSED FOR INCOMPLETENESS 0 $0 1 $157,950 4 $176,955 1 $79,000 2 $151,450
Aggregated Statistics For Year 2008(Based on 1 full and 2 partial tracts) A) FHA, FSA/RHS & VA B) Conventional C) Refinancings D) Home Improvement Loans F) Non-occupant Loans on G) Loans On Manufactured Number Average Value Number Average Value Number Average Value Number Average Value Number Average Value Number Average Value
LOANS ORIGINATED 54 $131,507 68 $140,787 51 $128,313 19 $56,483 23 $154,863 1 $41,000 APPLICATIONS APPROVED, NOT ACCEPTED 2 $127,715 7 $133,500 10 $119,234 4 $11,415 0 $0 0 $0 APPLICATIONS DENIED 4 $115,855 12 $102,702 45 $107,487 26 $43,150 2 $129,060 0 $0 APPLICATIONS WITHDRAWN 7 $110,581 6 $179,573 24 $104,086 8 $68,938 0 $0 0 $0 FILES CLOSED FOR INCOMPLETENESS 1 $214,000 2 $178,055 1 $122,510 0 $0 0 $0 0 $0
Aggregated Statistics For Year 2007(Based on 1 full and 2 partial tracts) A) FHA, FSA/RHS & VA B) Conventional C) Refinancings D) Home Improvement Loans F) Non-occupant Loans on G) Loans On Manufactured Number Average Value Number Average Value Number Average Value Number Average Value Number Average Value Number Average Value
LOANS ORIGINATED 29 $131,756 110 $109,446 55 $107,587 31 $39,521 14 $69,204 2 $60,765 APPLICATIONS APPROVED, NOT ACCEPTED 0 $0 7 $83,904 7 $137,717 7 $59,884 0 $0 0 $0 APPLICATIONS DENIED 4 $132,835 30 $106,669 66 $111,450 28 $72,128 7 $150,314 2 $26,500 APPLICATIONS WITHDRAWN 3 $145,483 11 $115,483 42 $112,883 4 $111,000 2 $48,500 0 $0 FILES CLOSED FOR INCOMPLETENESS 0 $0 4 $145,222 8 $173,656 0 $0 0 $0 0 $0
Aggregated Statistics For Year 2006(Based on 1 full and 2 partial tracts) A) FHA, FSA/RHS & VA B) Conventional C) Refinancings D) Home Improvement Loans E) Loans on Dwellings For 5+ Families F) Non-occupant Loans on G) Loans On Manufactured Number Average Value Number Average Value Number Average Value Number Average Value Number Average Value Number Average Value Number Average Value
LOANS ORIGINATED 21 $132,724 176 $94,443 71 $114,842 19 $32,729 1 $95,760 25 $91,044 1 $65,880 APPLICATIONS APPROVED, NOT ACCEPTED 0 $0 14 $111,350 10 $127,082 2 $43,555 0 $0 0 $0 0 $0 APPLICATIONS DENIED 4 $114,022 32 $96,273 75 $117,594 27 $35,501 0 $0 3 $55,080 1 $43,680 APPLICATIONS WITHDRAWN 3 $181,570 15 $100,401 54 $115,204 5 $30,584 0 $0 1 $89,700 0 $0 FILES CLOSED FOR INCOMPLETENESS 0 $0 2 $62,200 19 $116,321 0 $0 0 $0 1 $66,000 0 $0
Aggregated Statistics For Year 2005(Based on 1 full and 2 partial tracts) A) FHA, FSA/RHS & VA B) Conventional C) Refinancings D) Home Improvement Loans F) Non-occupant Loans on G) Loans On Manufactured Number Average Value Number Average Value Number Average Value Number Average Value Number Average Value Number Average Value
LOANS ORIGINATED 30 $128,354 156 $109,556 91 $104,154 24 $56,083 33 $128,550 3 $88,183 APPLICATIONS APPROVED, NOT ACCEPTED 1 $30,000 14 $94,911 16 $83,369 3 $15,133 2 $45,990 2 $25,520 APPLICATIONS DENIED 2 $88,925 41 $85,981 59 $91,083 20 $49,424 6 $101,875 7 $68,033 APPLICATIONS WITHDRAWN 3 $73,237 20 $110,804 61 $127,188 12 $207,492 5 $103,254 1 $218,270 FILES CLOSED FOR INCOMPLETENESS 0 $0 5 $98,670 44 $116,352 0 $0 0 $0 0 $0
Aggregated Statistics For Year 2004(Based on 1 full and 2 partial tracts) A) FHA, FSA/RHS & VA B) Conventional C) Refinancings D) Home Improvement Loans F) Non-occupant Loans on G) Loans On Manufactured Number Average Value Number Average Value Number Average Value Number Average Value Number Average Value Number Average Value
LOANS ORIGINATED 30 $121,529 127 $100,455 119 $89,867 22 $33,401 40 $85,142 1 $75,670 APPLICATIONS APPROVED, NOT ACCEPTED 3 $103,213 16 $94,944 18 $80,668 1 $8,000 6 $93,777 1 $33,690 APPLICATIONS DENIED 3 $142,600 17 $80,448 74 $75,250 14 $24,439 4 $79,732 3 $44,667 APPLICATIONS WITHDRAWN 3 $94,833 11 $109,540 39 $88,401 3 $49,290 0 $0 0 $0 FILES CLOSED FOR INCOMPLETENESS 0 $0 3 $135,343 47 $87,187 1 $49,290 2 $88,090 0 $0
Aggregated Statistics For Year 2003(Based on 1 full and 2 partial tracts) A) FHA, FSA/RHS & VA B) Conventional C) Refinancings D) Home Improvement Loans F) Non-occupant Loans on Number Average Value Number Average Value Number Average Value Number Average Value Number Average Value
LOANS ORIGINATED 24 $100,877 102 $97,884 223 $84,810 24 $27,098 18 $61,986 APPLICATIONS APPROVED, NOT ACCEPTED 3 $89,393 4 $114,952 16 $80,649 5 $25,138 2 $68,330 APPLICATIONS DENIED 4 $76,202 8 $86,412 105 $85,739 6 $18,498 4 $57,960 APPLICATIONS WITHDRAWN 2 $79,850 5 $64,702 75 $86,735 1 $41,240 0 $0 FILES CLOSED FOR INCOMPLETENESS 0 $0 2 $136,100 8 $89,799 0 $0 1 $41,540
Aggregated Statistics For Year 2002(Based on 1 full and 2 partial tracts) A) FHA, FSA/RHS & VA B) Conventional C) Refinancings D) Home Improvement Loans F) Non-occupant Loans on Number Average Value Number Average Value Number Average Value Number Average Value Number Average Value
LOANS ORIGINATED 27 $103,071 61 $99,740 112 $84,358 11 $27,565 15 $71,478 APPLICATIONS APPROVED, NOT ACCEPTED 0 $0 7 $108,673 14 $70,987 5 $15,386 1 $46,000 APPLICATIONS DENIED 2 $113,385 5 $45,492 41 $59,864 6 $11,408 3 $31,770 APPLICATIONS WITHDRAWN 0 $0 4 $81,848 47 $76,985 0 $0 2 $71,115 FILES CLOSED FOR INCOMPLETENESS 0 $0 0 $0 5 $51,814 0 $0 0 $0
Aggregated Statistics For Year 2001(Based on 1 full and 2 partial tracts) A) FHA, FSA/RHS & VA B) Conventional C) Refinancings D) Home Improvement Loans F) Non-occupant Loans on Number Average Value Number Average Value Number Average Value Number Average Value Number Average Value
LOANS ORIGINATED 30 $88,935 72 $90,965 91 $77,818 19 $40,520 5 $88,838 APPLICATIONS APPROVED, NOT ACCEPTED 2 $88,365 17 $65,232 17 $69,386 1 $39,930 2 $27,435 APPLICATIONS DENIED 2 $89,545 29 $50,273 29 $62,442 11 $19,899 4 $71,045 APPLICATIONS WITHDRAWN 2 $90,150 6 $145,595 31 $68,367 2 $21,670 0 $0 FILES CLOSED FOR INCOMPLETENESS 1 $21,120 3 $32,417 7 $82,724 1 $25,030 0 $0
Aggregated Statistics For Year 2000(Based on 1 full and 2 partial tracts) A) FHA, FSA/RHS & VA B) Conventional C) Refinancings D) Home Improvement Loans F) Non-occupant Loans on Number Average Value Number Average Value Number Average Value Number Average Value Number Average Value
LOANS ORIGINATED 35 $87,235 75 $81,683 39 $71,361 11 $21,113 8 $51,842 APPLICATIONS APPROVED, NOT ACCEPTED 1 $77,000 8 $69,000 6 $72,537 6 $17,282 1 $17,600 APPLICATIONS DENIED 0 $0 25 $47,843 20 $69,637 5 $22,092 1 $51,930 APPLICATIONS WITHDRAWN 4 $80,022 8 $103,594 17 $71,862 2 $13,000 1 $11,000 FILES CLOSED FOR INCOMPLETENESS 1 $86,000 2 $71,535 4 $62,250 0 $0 0 $0
Aggregated Statistics For Year 1999(Based on 1 full and 2 partial tracts) A) FHA, FSA/RHS & VA B) Conventional C) Refinancings D) Home Improvement Loans E) Loans on Dwellings For 5+ Families F) Non-occupant Loans on Number Average Value Number Average Value Number Average Value Number Average Value Number Average Value Number Average Value
LOANS ORIGINATED 23 $77,999 64 $73,570 61 $68,283 22 $19,275 1 $648,740 12 $54,908 APPLICATIONS APPROVED, NOT ACCEPTED 1 $55,720 11 $54,159 6 $73,142 2 $29,055 0 $0 0 $0 APPLICATIONS DENIED 2 $60,920 45 $48,000 16 $47,377 9 $15,028 0 $0 3 $58,163 APPLICATIONS WITHDRAWN 1 $66,590 8 $58,060 23 $55,504 1 $6,590 0 $0 1 $59,700 FILES CLOSED FOR INCOMPLETENESS 0 $0 3 $75,420 5 $73,628 0 $0 0 $0 0 $0
Detailed HMDA statistics for the following Tracts:
0020.00
, 0037.01 , 0037.03
Private Mortgage Insurance Companies Aggregated Statistics For Year 2009(Based on 1 full and 2 partial tracts) A) Conventional B) Refinancings Number Average Value Number Average Value
LOANS ORIGINATED 4 $202,495 4 $181,080 APPLICATIONS APPROVED, NOT ACCEPTED 2 $102,145 1 $235,870 APPLICATIONS DENIED 2 $100,315 1 $142,000 APPLICATIONS WITHDRAWN 0 $0 1 $117,690 FILES CLOSED FOR INCOMPLETENESS 0 $0 0 $0
Aggregated Statistics For Year 2008(Based on 1 full and 2 partial tracts) A) Conventional B) Refinancings C) Non-occupant Loans on Number Average Value Number Average Value Number Average Value
LOANS ORIGINATED 30 $142,341 5 $181,530 2 $195,005 APPLICATIONS APPROVED, NOT ACCEPTED 8 $160,224 1 $97,170 0 $0 APPLICATIONS DENIED 2 $123,085 0 $0 1 $114,060 APPLICATIONS WITHDRAWN 0 $0 0 $0 0 $0 FILES CLOSED FOR INCOMPLETENESS 0 $0 0 $0 0 $0
Aggregated Statistics For Year 2007(Based on 1 full and 2 partial tracts) A) Conventional B) Refinancings C) Non-occupant Loans on Number Average Value Number Average Value Number Average Value
LOANS ORIGINATED 33 $150,168 7 $149,857 3 $97,340 APPLICATIONS APPROVED, NOT ACCEPTED 1 $90,410 0 $0 0 $0 APPLICATIONS DENIED 0 $0 1 $141,000 0 $0 APPLICATIONS WITHDRAWN 1 $91,530 0 $0 0 $0 FILES CLOSED FOR INCOMPLETENESS 0 $0 0 $0 0 $0
Aggregated Statistics For Year 2006(Based on 1 full and 2 partial tracts) A) Conventional B) Refinancings Number Average Value Number Average Value
LOANS ORIGINATED 24 $117,454 6 $172,477 APPLICATIONS APPROVED, NOT ACCEPTED 5 $139,410 0 $0 APPLICATIONS DENIED 0 $0 0 $0 APPLICATIONS WITHDRAWN 1 $49,290 0 $0 FILES CLOSED FOR INCOMPLETENESS 0 $0 0 $0
Aggregated Statistics For Year 2005(Based on 1 full and 2 partial tracts) A) Conventional B) Refinancings C) Non-occupant Loans on Number Average Value Number Average Value Number Average Value
LOANS ORIGINATED 32 $123,233 12 $151,692 8 $128,164 APPLICATIONS APPROVED, NOT ACCEPTED 2 $107,500 4 $146,325 3 $174,683 APPLICATIONS DENIED 0 $0 1 $222,500 1 $222,500 APPLICATIONS WITHDRAWN 1 $120,400 2 $166,170 2 $166,170 FILES CLOSED FOR INCOMPLETENESS 0 $0 0 $0 0 $0
Aggregated Statistics For Year 2004(Based on 1 full and 2 partial tracts) A) Conventional B) Refinancings C) Non-occupant Loans on Number Average Value Number Average Value Number Average Value
LOANS ORIGINATED 19 $116,434 17 $139,694 10 $125,191 APPLICATIONS APPROVED, NOT ACCEPTED 4 $116,168 2 $150,500 1 $55,000 APPLICATIONS DENIED 0 $0 0 $0 0 $0 APPLICATIONS WITHDRAWN 0 $0 0 $0 0 $0 FILES CLOSED FOR INCOMPLETENESS 0 $0 0 $0 0 $0
Aggregated Statistics For Year 2003(Based on 1 full and 2 partial tracts) A) Conventional B) Refinancings C) Non-occupant Loans on Number Average Value Number Average Value Number Average Value
LOANS ORIGINATED 27 $123,364 12 $126,256 3 $102,577 APPLICATIONS APPROVED, NOT ACCEPTED 1 $109,860 0 $0 0 $0 APPLICATIONS DENIED 1 $99,390 1 $104,000 1 $41,540 APPLICATIONS WITHDRAWN 2 $118,275 4 $80,710 0 $0 FILES CLOSED FOR INCOMPLETENESS 0 $0 0 $0 0 $0
Aggregated Statistics For Year 2002(Based on 1 full and 2 partial tracts) A) Conventional B) Refinancings Number Average Value Number Average Value
LOANS ORIGINATED 19 $110,506 6 $130,142 APPLICATIONS APPROVED, NOT ACCEPTED 3 $75,847 1 $229,090 APPLICATIONS DENIED 1 $55,000 0 $0 APPLICATIONS WITHDRAWN 1 $80,270 0 $0 FILES CLOSED FOR INCOMPLETENESS 0 $0 0 $0
Aggregated Statistics For Year 2001(Based on 1 full and 2 partial tracts) A) Conventional B) Refinancings C) Non-occupant Loans on Number Average Value Number Average Value Number Average Value
LOANS ORIGINATED 21 $92,753 7 $121,227 1 $60,000 APPLICATIONS APPROVED, NOT ACCEPTED 4 $128,385 1 $123,540 0 $0 APPLICATIONS DENIED 1 $150,680 1 $123,220 0 $0 APPLICATIONS WITHDRAWN 1 $42,480 1 $97,000 0 $0 FILES CLOSED FOR INCOMPLETENESS 0 $0 0 $0 0 $0
Aggregated Statistics For Year 2000(Based on 1 full and 2 partial tracts) A) Conventional B) Refinancings Number Average Value Number Average Value
LOANS ORIGINATED 24 $95,749 5 $96,986 APPLICATIONS APPROVED, NOT ACCEPTED 3 $126,033 2 $139,155 APPLICATIONS DENIED 1 $87,310 0 $0 APPLICATIONS WITHDRAWN 1 $150,680 0 $0 FILES CLOSED FOR INCOMPLETENESS 0 $0 0 $0
Aggregated Statistics For Year 1999(Based on 1 full and 2 partial tracts) A) Conventional B) Refinancings C) Non-occupant Loans on Number Average Value Number Average Value Number Average Value
LOANS ORIGINATED 24 $91,600 16 $111,901 2 $41,260 APPLICATIONS APPROVED, NOT ACCEPTED 1 $78,610 2 $115,275 0 $0 APPLICATIONS DENIED 1 $56,710 0 $0 0 $0 APPLICATIONS WITHDRAWN 2 $89,960 0 $0 0 $0 FILES CLOSED FOR INCOMPLETENESS 0 $0 0 $0 0 $0
Detailed PMIC statistics for the following Tracts:
0020.00
, 0037.01 , 0037.03 Robinson compared to Texas state average:
Unemployed percentage significantly below state average. Black race population percentage significantly below state average. Median age above state average. Foreign-born population percentage below state average. Renting percentage below state average.
#74 on the list of "Top 101 cities with largest percentage of females in occupations: construction and extraction occupations (population 5,000+)"
#8 on the list of "Top 101 counties with the lowest Nitrogen Dioxide air pollution readings in 2012 (ppm)"
#18 on the list of "Top 101 counties with the lowest Sulfur Oxides Annual air pollution readings in 2012 (µg/m3 )"
#79 on the list of "Top 101 counties with the lowest percentage of residents relocating to foreign countries in 2011"
#88 on the list of "Top 101 counties with the most Evangelical Protestant congregations"
#101 on the list of "Top 101 counties with the most Evangelical Protestant adherents"
Top Patent Applicants
Dilson Santos Rodrigues (3)
Jordan Beckhusen (2)
Kyle C. Hiner (1)
Jonathan David Stalnaker (1)
Rebecca Rameriz (1)
Total of 8 patent applications in 2008-2024.


 Recent articles from our blog. Our writers, many of them Ph.D. graduates or candidates, create easy-to-read articles on a wide variety of topics.

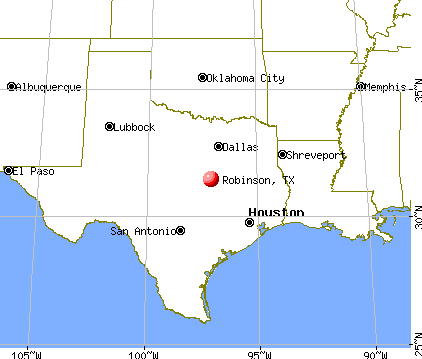
 (6.0 miles
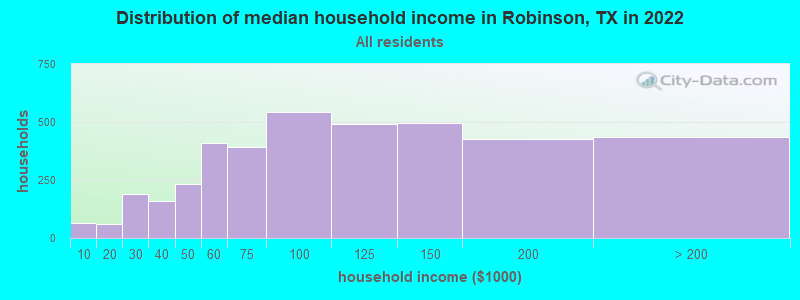
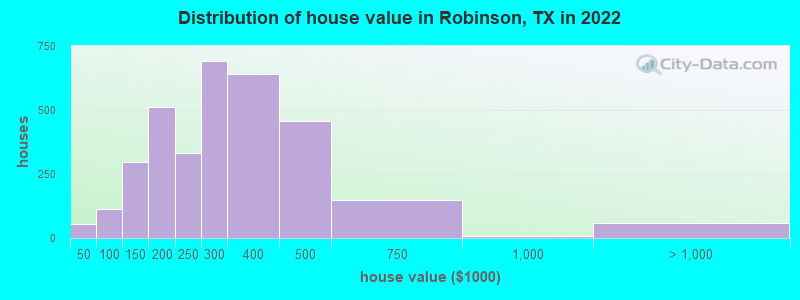

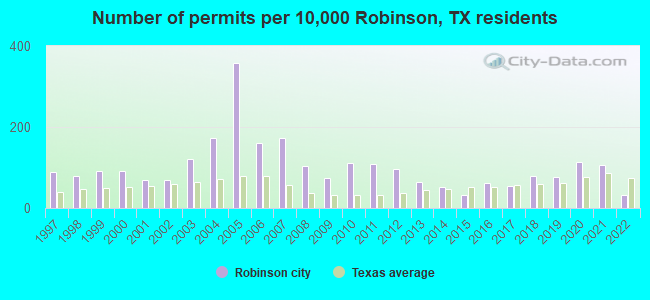
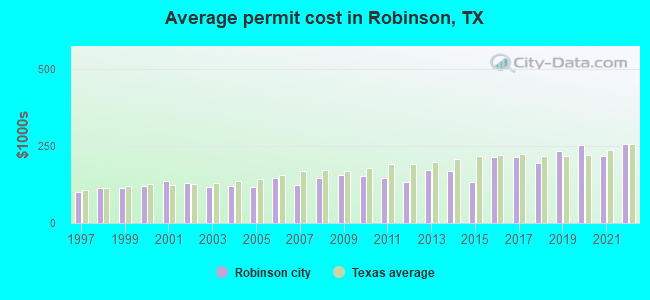
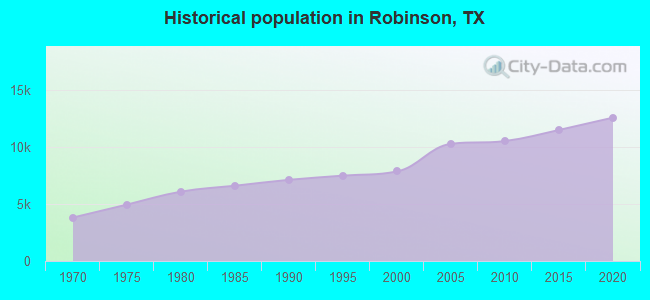
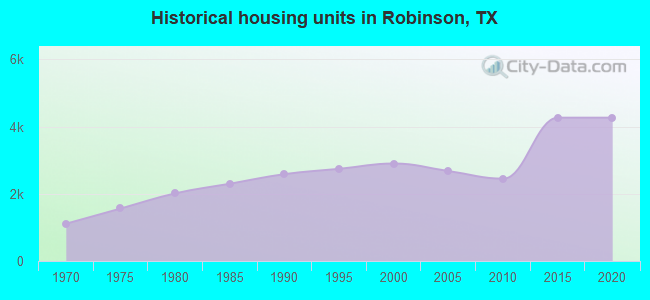
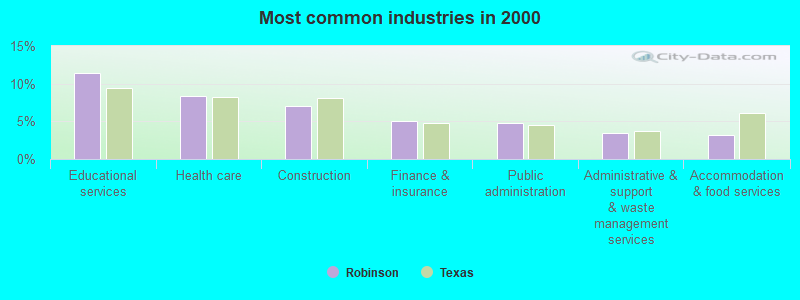

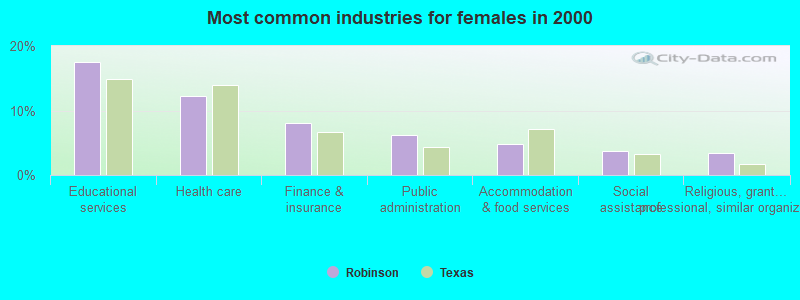
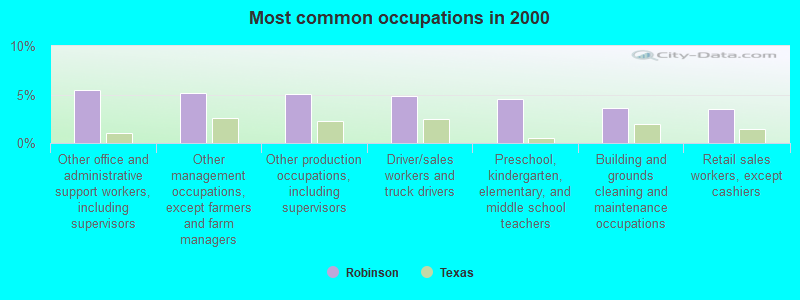
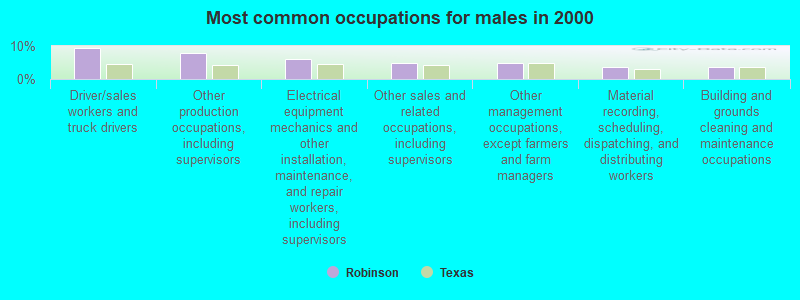
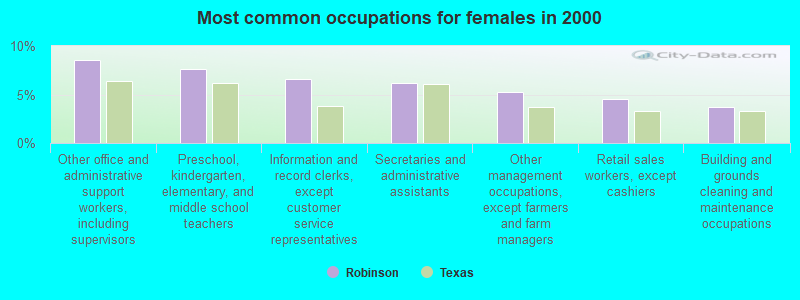


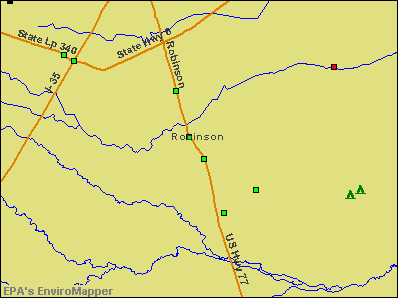

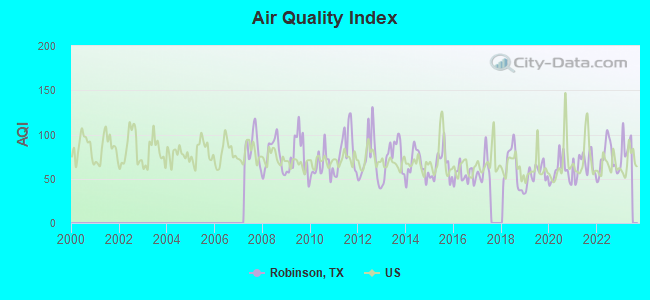
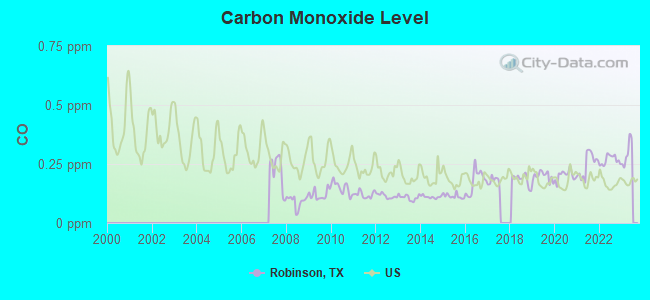
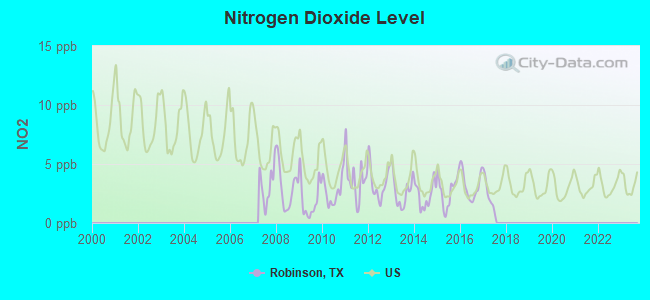
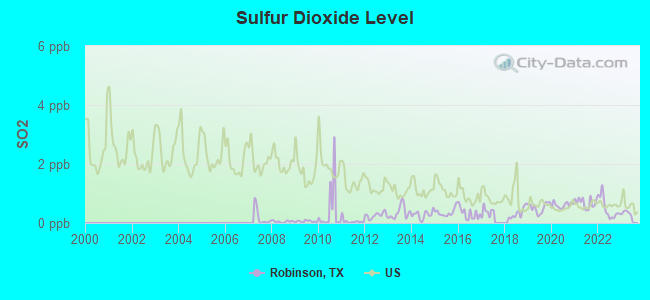
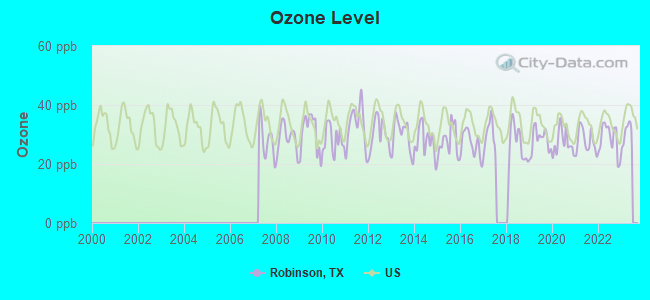
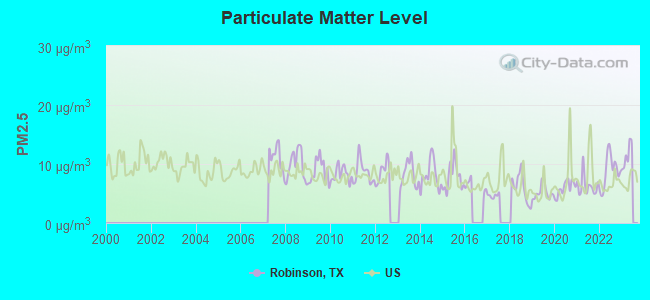

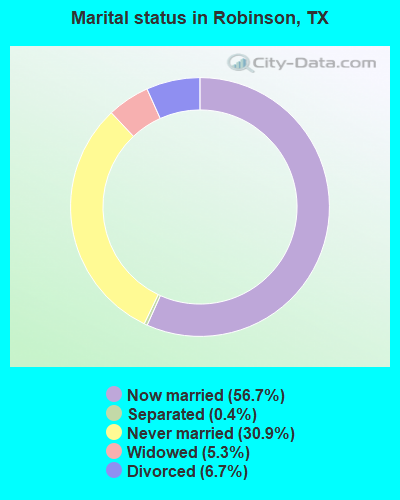
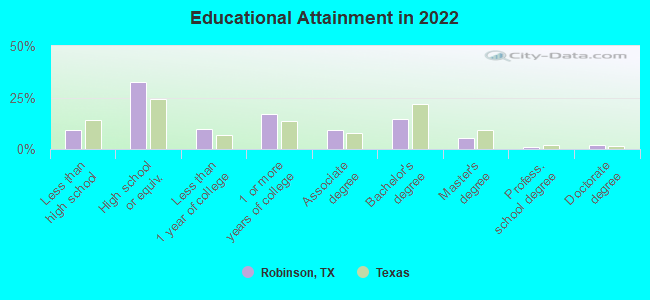
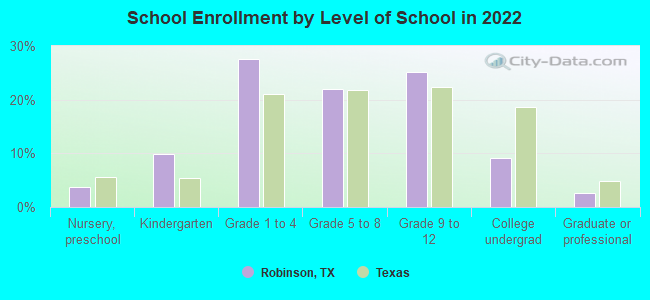
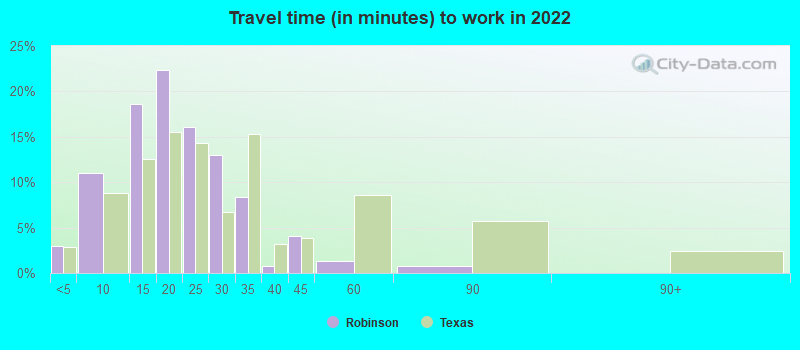
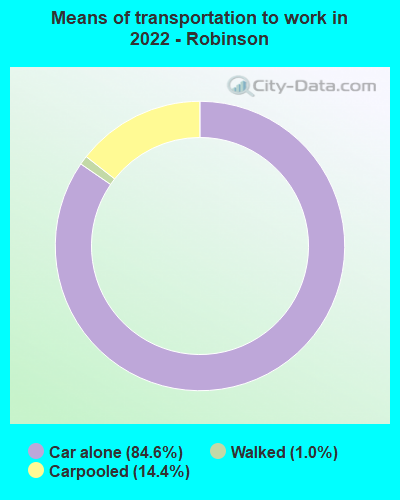
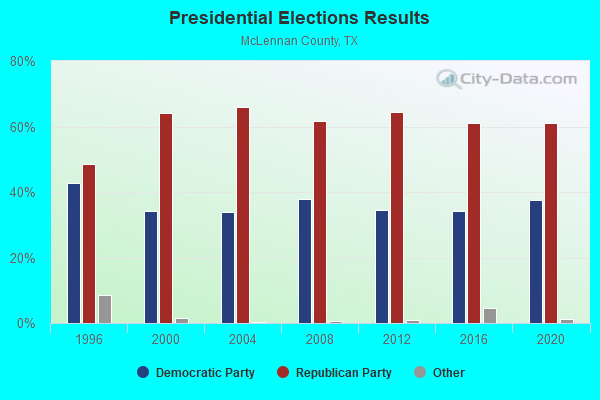
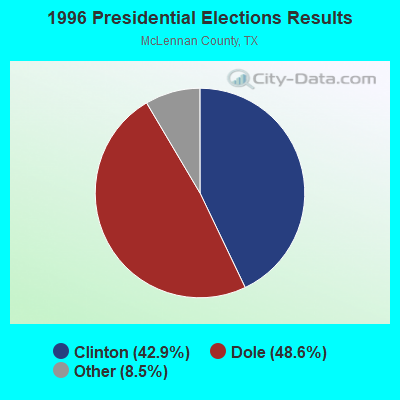
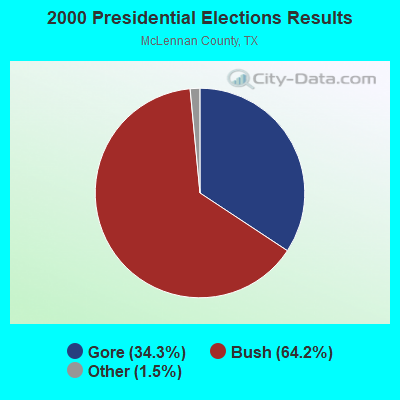
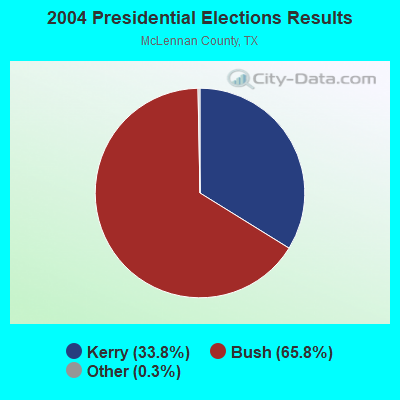
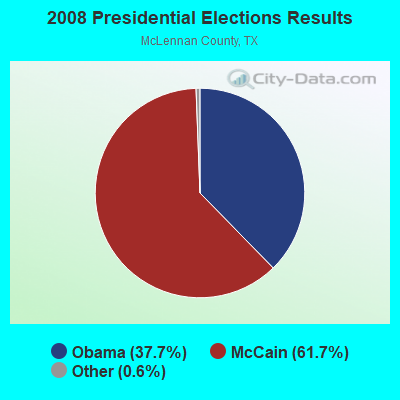
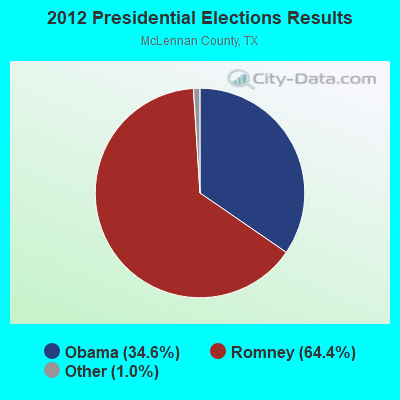
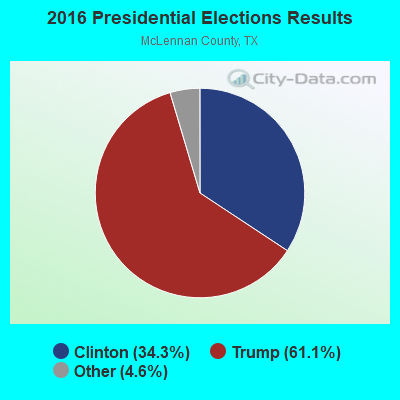
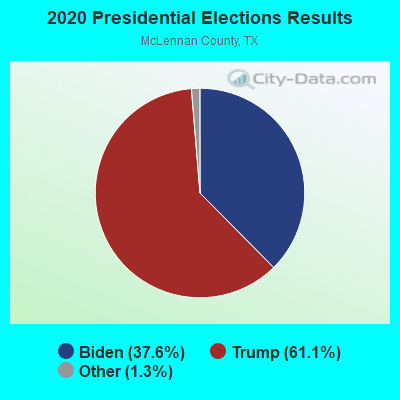
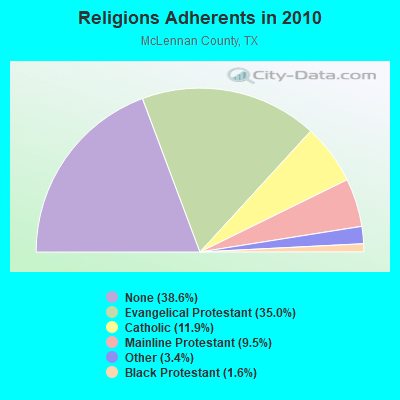
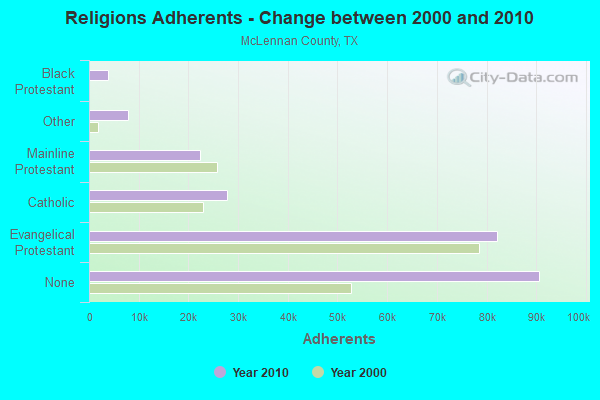
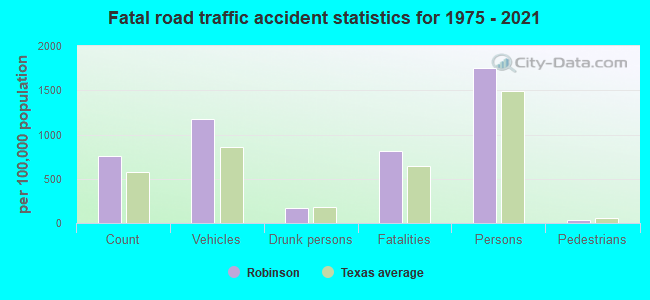
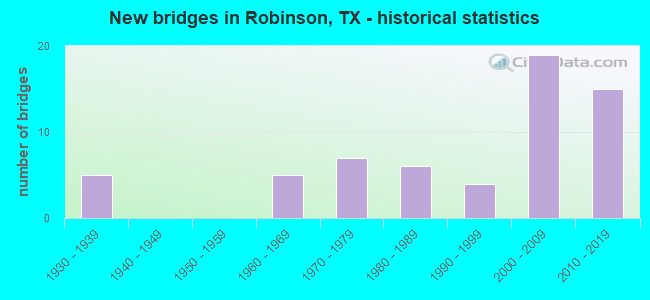
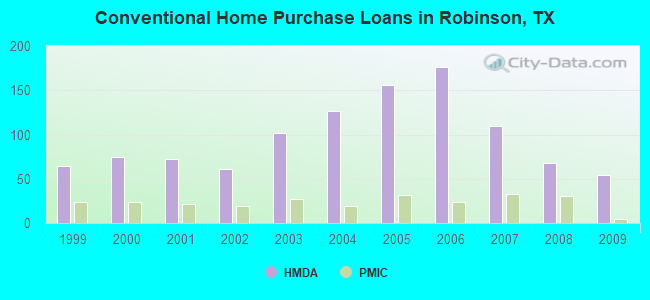
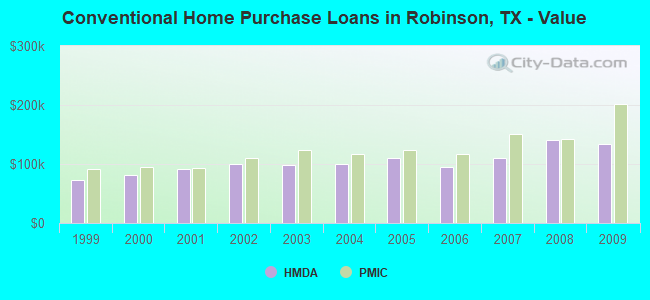
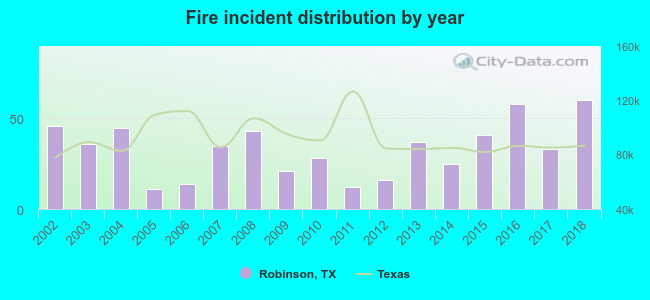 According to the data from the years 2002 - 2018 the average number of fires per year is 33. The highest number of fires - 60 took place in 2018, and the least - 11 in 2005. The data has a rising trend.
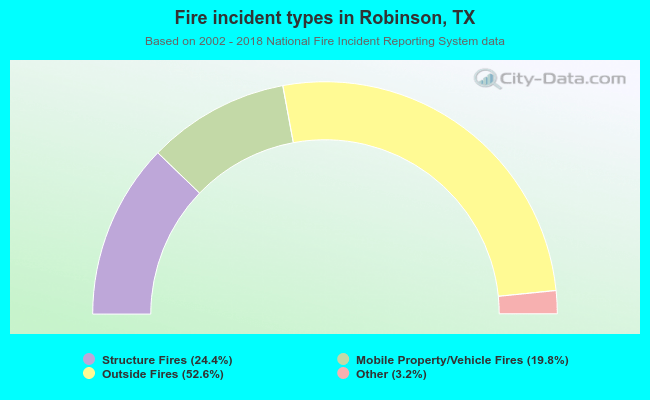 When looking into fire subcategories, the most incidents belonged to: Outside Fires (52.6%), and Structure Fires (24.4%).