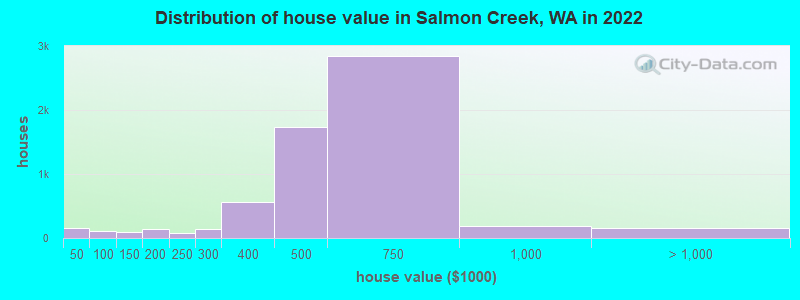
Estimated median house or condo value in 2022: $537,569 (it was $160,200 in 2000)
Salmon Creek:
$537,569
WA:
$569,500
Mean prices in 2022:all housing units: $600,868; detached houses: $640,286; townhouses or other attached units: $387,806; in 2-unit structures: $276,060; in 3-to-4-unit structures: $256,213; in 5-or-more-unit structures: $443,986; mobile homes: $253,186; occupied boats, rvs, vans, etc.: $34,609
Median gross rent in 2022: $1,483.
March 2022 cost of living index in Salmon Creek: 103.0 (near average, U.S. average is 100)
Percentage of residents living in poverty in 2022: 8.1%
(4.9% for White Non-Hispanic residents, 21.8% for Black residents, 21.4% for Hispanic or Latino residents, 100.0% for Native Hawaiian and other Pacific Islander residents, 29.1% for other race residents, 15.6% for two or more races residents)
Latest news from Salmon Creek, WA collected exclusively by city-data.com from local newspapers, TV, and radio stations
Ancestries: German (12.3%), English (9.4%), Irish (8.3%), American (7.1%), European (6.7%), Scottish (3.2%).
Current Local Time: PST time zone
Elevation: 180 feet
Land area: 6.27 square miles.
Population density: 3,139 people per square mile (average).
1,959 residents are foreign born (3.3% Asia, 3.1% Latin America, 1.7% Europe).
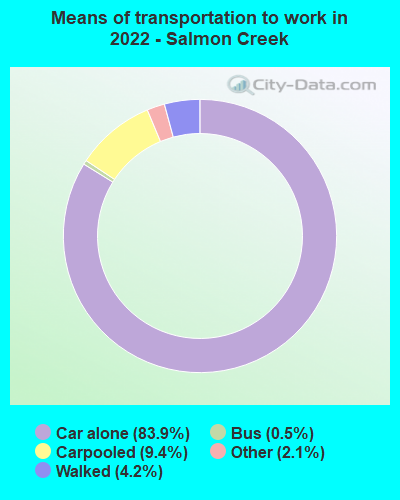
This place:
9.4%
Washington:
14.9%
Median real estate property taxes paid for housing units with mortgages in 2022: $4,438 (0.8%) Median real estate property taxes paid for housing units with no mortgage in 2022: $4,253 (0.9%)
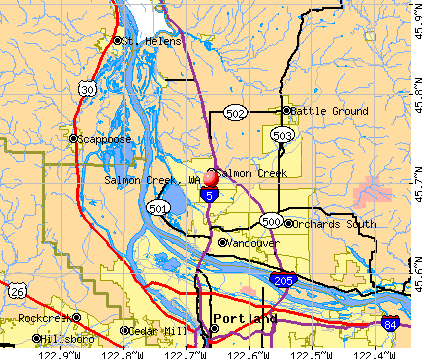
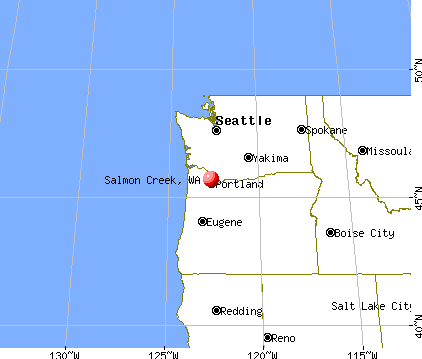
Nearest city with pop. 50,000+: Vancouver, WA (5.7 miles , pop. 143,560).
Nearest city with pop. 200,000+: Portland, OR (12.6 miles , pop. 529,121).
Nearest city with pop. 1,000,000+: Los Angeles, CA (834.9 miles , pop. 3,694,820).
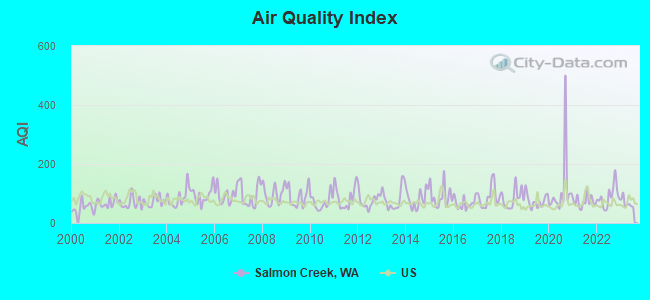
Air Quality Index (AQI) level in 2023 was 67.7. This is about average.
City:
67.7
U.S.:
72.6
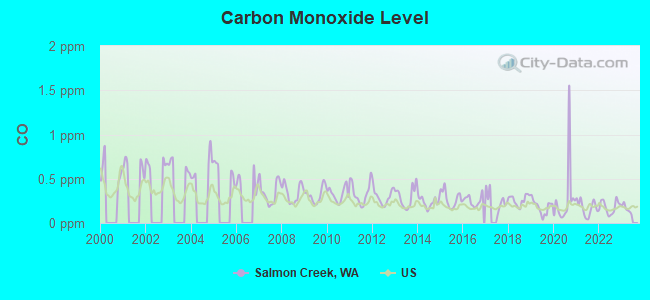
Carbon Monoxide (CO) [ppm] level in 2022 was 0.181. This is better than average.Closest monitor was 5.2 miles away from the city center.
City:
0.181
U.S.:
0.251
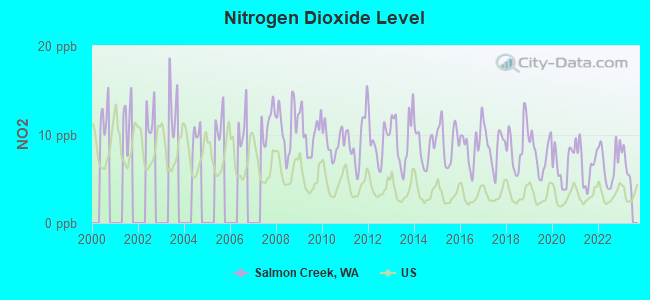
Nitrogen Dioxide (NO2) [ppb] level in 2022 was 6.68. This is worse than average.Closest monitor was 9.3 miles away from the city center.
City:
6.68
U.S.:
5.11
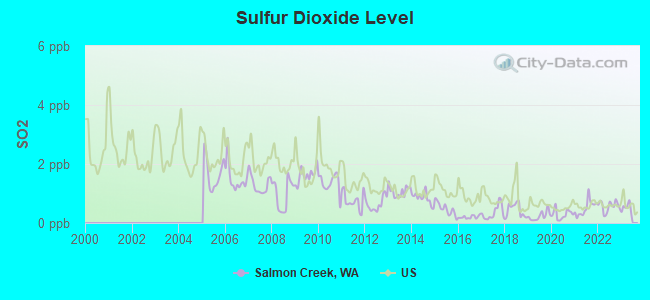
Sulfur Dioxide (SO2) [ppb] level in 2022 was 0.569. This is significantly better than average.Closest monitor was 5.3 miles away from the city center.
City:
0.569
U.S.:
1.515
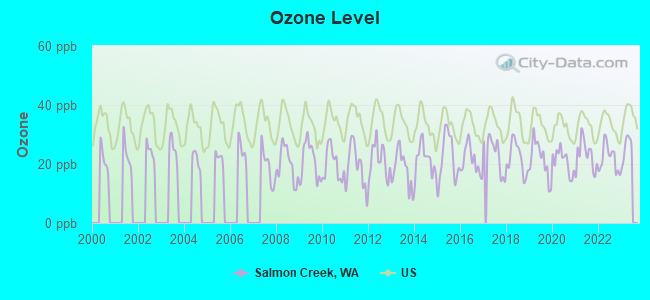
Ozone [ppb] level in 2022 was 21.8. This is significantly better than average.Closest monitor was 1.1 miles away from the city center.
City:
21.8
U.S.:
33.3
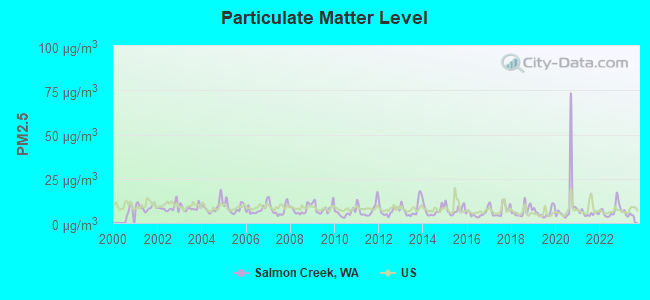
Particulate Matter (PM2.5) [µg/m3] level in 2023 was 5.01. This is significantly better than average.Closest monitor was 5.1 miles away from the city center.
City:
5.01
U.S.:
8.11
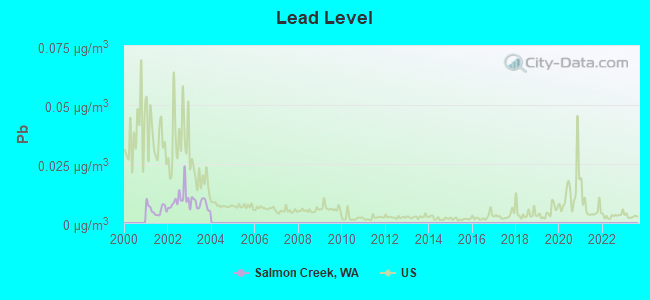
Lead (Pb) [µg/m3] level in 2003 was 0.00810. This is about average.Closest monitor was 5.3 miles away from the city center.
City:
0.00810
U.S.:
0.00931
Earthquake activity:
Salmon Creek-area historical earthquake activity is significantly above Washington state average. It is 1488% greater than the overall U.S. average.
On 4/13/1949 at 19:55:42, a magnitude 7.0 (7.0 UK, Class: Major, Intensity: VIII - XII) earthquake occurred 107.1 miles away from the city center, causing $80,000,000 total damage On 2/28/2001 at 18:54:32, a magnitude 6.8 (6.5 MB, 6.6 MS, 6.8 MW, Class: Strong, Intensity: VII - IX) earthquake occurred 95.9 miles away from the city center, causing $2,000,000,000 total damage and $305,000,000 insured losses On 2/28/2001 at 18:54:32, a magnitude 6.8 (6.8 MD, Depth: 32.2 mi) earthquake occurred 99.9 miles away from the city center On 4/29/1965 at 15:28:43, a magnitude 6.6 (6.6 UK) earthquake occurred 112.6 miles away from the city center, causing $28,000,000 total damage On 1/31/1922 at 13:17:28, a magnitude 7.6 (7.6 UK) earthquake occurred 375.6 miles away from the city center On 11/8/1980 at 10:27:34, a magnitude 7.2 (6.2 MB, 7.2 MS, 7.2 MW, 7.0 ML) earthquake occurred 328.3 miles away from the city center Magnitude types: body-wave magnitude (MB), duration magnitude (MD), local magnitude (ML), surface-wave magnitude (MS), moment magnitude (MW)
Natural disasters:
The number of natural disasters in Clark County (13) is near the US average (15). Major Disasters (Presidential) Declared: 12 Emergencies Declared: 1
Causes of natural disasters: Floods: 7, Mudslides: 4, Storms: 4, Winter Storms: 4, Landslides: 3, Winds: 2, Earthquake: 1, Heavy Rain: 1, Hurricane: 1, Snow: 1, Tornado: 1, Volcanic Eruption: 1, Other: 1 (Note: some incidents may be assigned to more than one category).
Hospitals and medical centers near Salmon Creek:
PNRS SALMON CREEK (Dialysis Facility, about 2 miles away; VANCOUVER, WA)
LEGACY SALMON CREEK MEDICAL CENTER Acute Care Hospitals (about 2 miles away; VANCOUVER, WA)
MANORCARE HEALTH SERVICES - SALMON CREEK (Nursing Home, about 2 miles away; VANCOUVER, WA)
DISCOVERY NURSING AND REHAB OF VANCOUVER (Nursing Home, about 4 miles away; VANCOUVER, WA)
WHISPERING PINES CARE CENTER (Nursing Home, about 4 miles away; VANCOUVER, WA)
OREGON-WASHINGTON PYTHIAN HOME (Nursing Home, about 4 miles away; VANCOUVER, WA)
HERITAGE HEALTH AND REHABILITATION CENTER (Nursing Home, about 5 miles away; VANCOUVER, WA)
Amtrak stations near Salmon Creek:
6 miles: VANCOUVER (FOOT OF W. 11TH ST.) . Services: ticket office, fully wheelchair accessible, enclosed waiting area, public restrooms, public payphones, vending machines, free short-term parking, free long-term parking, call for taxi service.
13 miles: PORTLAND (800 NW 6TH AVE.) . Services: ticket office, fully wheelchair accessible, enclosed waiting area, public restrooms, public payphones, full-service food facilities, paid short-term parking, paid long-term parking, call for car rental service, taxi stand, intercity bus service, public transit connection.
Colleges/universities with over 2000 students nearest to Salmon Creek:
Clark College (about 5 miles; Vancouver, WA; Full-time enrollment: 9,330)
Concordia University-Portland (about 10 miles; Portland, OR; FT enrollment: 3,996)
University of Portland (about 10 miles; Portland, OR; FT enrollment: 4,030)
Portland State University (about 14 miles; Portland, OR; FT enrollment: 21,450)
Lewis & Clark College (about 18 miles; Portland, OR; FT enrollment: 2,864)
Mt Hood Community College (about 19 miles; Gresham, OR; FT enrollment: 11,847)
Portland Community College (about 19 miles; Portland, OR; FT enrollment: 23,600)
User-submitted facts and corrections:
Washington State University - Vancouver Campus (No. Salmon Creek)
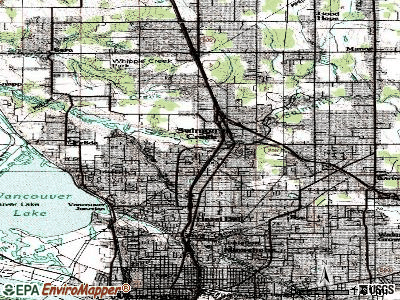
Notable locations in Salmon Creek: Clark County Fire District 6 Station 3 - Salmon Creek (A), The Church of Jesus Christ of Latter Day Saints Family History Center (B), Salmon Creek Christian Day Care Center (C). Display/hide their locations on the map
Churches in Salmon Creek include: Faith Baptist Church (A), Saint John Lutheran Church (B), Salmon Creek Foursquare Church (C), Salmon Creek United Methodist Church (D). Display/hide their locations on the map
Clark County has a predicted average indoor radon screening level greater than 4 pCi/L (pico curies per liter) - Highest Potential
Average household size:
This place:
2.6 people
Washington:
2.5 people
Percentage of family households:
This place:
71.7%
Whole state:
64.4%
Percentage of households with unmarried partners:
This place:
6.3%
Whole state:
7.7%
Likely homosexual households (counted as self-reported same-sex unmarried-partner households)
Lesbian couples: 0.5% of all households
Gay men: 0.4% of all households
30 people in group homes intended for adults in 2010
4 people in nursing facilities/skilled-nursing facilities in 2010
21 people in other group homes in 2000
2 people in other noninstitutional group quarters in 2000
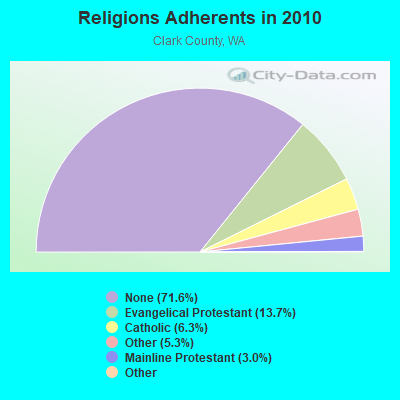
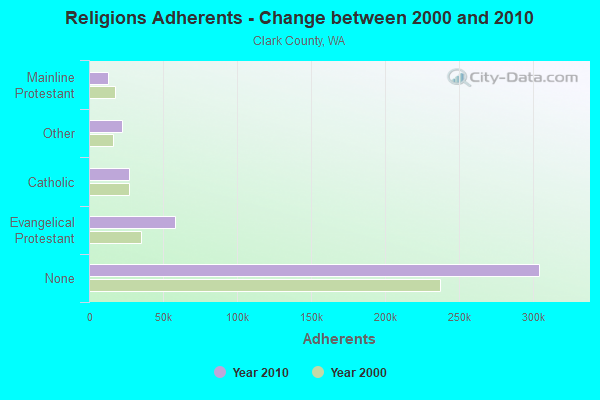
Religion statistics for Salmon Creek, WA (based on Clark County data)
Religion
Adherents
Congregations
Evangelical Protestant
58,413
191
Catholic
26,886
9
Other
22,590
60
Mainline Protestant
12,633
37
Black Protestant
378
2
Orthodox
61
1
None
304,402
-
Source: Clifford Grammich, Kirk Hadaway, Richard Houseal, Dale E.Jones, Alexei Krindatch, Richie Stanley and Richard H.Taylor. 2012. 2010 U.S.Religion Census: Religious Congregations & Membership Study. Association of Statisticians of American Religious Bodies. Jones, Dale E., et al. 2002. Congregations and Membership in the United States 2000. Nashville, TN: Glenmary Research Center. Graphs represent county-level data
Travis Feldsher, East Of The Intersection Of Ne 10th Ave And Ne 136th St. (Lat: 45.719667 Lon: -122.659306), Type: 13.7, Overall height: 7.6 m, Registrant: Day Wireless Systems, Dwssites@daywireless.Com, , 22169 Milwa-ukie, Phone: (503) 659-1240
Travis Feldsher, East Of The Intersection Of Ne 10th Ave And Ne 136th St. (Lat: 45.719667 Lon: -122.659306), Type: 13.7, Overall height: 7.6 m, Registrant: Day Wireless Systems, Dwssites@daywireless.Com, , 22169 Milwa-ukie, Phone: (503) 659-1240
FCC Registered Microwave Towers:
1
OR-POR321A, 3510 Ne 99th Street (Lat: 45.693389 Lon: -122.634444), Type: Tank, Structure height: 24.4 m, Call Sign: WQIR237, Assigned Frequencies: 19375.0 MHz, 23025.0 MHz, 19475.0 MHz, 23125.0 MHz, 23175.0 MHz, 23275.0 MHz, Grant Date: 04/18/2008, Expiration Date: 04/18/2018, Cancellation Date: 10/27/2017, Certifier: Nadja S Sodos-Wallace, Registrant: Sprint Corporation, 12502 Sunrise Valley Drive, M/S: Varesa0209, Reston, VA 20196, Phone: (800) 572-8256, Fax: (703) 433-4483, Email:
Home Mortgage Disclosure Act Aggregated Statistics For Year 2009 (Based on 2 full and 2 partial tracts)
A) FHA, FSA/RHS & VA Home Purchase Loans
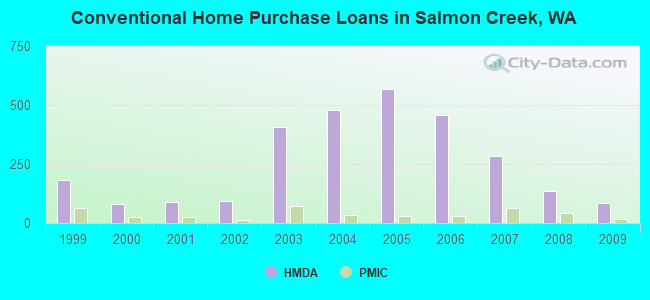
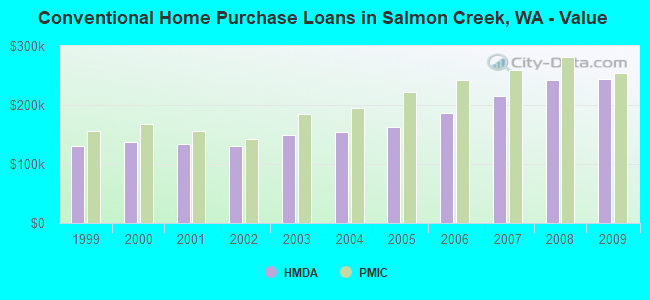
B) Conventional Home Purchase Loans
C) Refinancings
D) Home Improvement Loans
F) Non-occupant Loans on < 5 Family Dwellings (A B C & D)
G) Loans On Manufactured Home Dwelling (A B C & D)
Number
Average Value
Number
Average Value
Number
Average Value
Number
Average Value
Number
Average Value
Number
Average Value
LOANS ORIGINATED
101
$217,282
85
$244,370
626
$208,073
14
$145,634
36
$265,091
4
$175,692
APPLICATIONS APPROVED, NOT ACCEPTED
3
$224,017
8
$174,038
73
$233,065
6
$120,123
5
$187,126
2
$64,640
APPLICATIONS DENIED
14
$219,896
10
$184,136
138
$227,080
5
$55,016
7
$164,737
1
$147,000
APPLICATIONS WITHDRAWN
14
$186,470
9
$213,781
102
$234,889
2
$119,210
9
$183,878
1
$79,000
FILES CLOSED FOR INCOMPLETENESS
0
$0
2
$203,080
31
$236,682
0
$0
2
$192,500
0
$0
Aggregated Statistics For Year 2008 (Based on 2 full and 2 partial tracts)
A) FHA, FSA/RHS & VA Home Purchase Loans
B) Conventional Home Purchase Loans
C) Refinancings
D) Home Improvement Loans
E) Loans on Dwellings For 5+ Families
F) Non-occupant Loans on < 5 Family Dwellings (A B C & D)
G) Loans On Manufactured Home Dwelling (A B C & D)
Number
Average Value
Number
Average Value
Number
Average Value
Number
Average Value
Number
Average Value
Number
Average Value
Number
Average Value
LOANS ORIGINATED
59
$244,412
135
$242,561
339
$213,111
20
$103,428
1
$2,800,000
34
$173,901
5
$144,636
APPLICATIONS APPROVED, NOT ACCEPTED
9
$227,850
29
$221,026
72
$225,728
3
$173,130
0
$0
4
$196,352
3
$90,150
APPLICATIONS DENIED
15
$248,268
31
$256,757
185
$241,754
27
$102,522
0
$0
12
$252,571
6
$133,058
APPLICATIONS WITHDRAWN
4
$184,718
14
$308,995
67
$229,810
3
$57,957
0
$0
7
$187,277
0
$0
FILES CLOSED FOR INCOMPLETENESS
1
$149,620
7
$148,847
13
$221,905
2
$23,565
0
$0
2
$256,125
0
$0
Aggregated Statistics For Year 2007 (Based on 2 full and 2 partial tracts)
A) FHA, FSA/RHS & VA Home Purchase Loans
B) Conventional Home Purchase Loans
C) Refinancings
D) Home Improvement Loans
E) Loans on Dwellings For 5+ Families
F) Non-occupant Loans on < 5 Family Dwellings (A B C & D)
G) Loans On Manufactured Home Dwelling (A B C & D)
Number
Average Value
Number
Average Value
Number
Average Value
Number
Average Value
Number
Average Value
Number
Average Value
Number
Average Value
LOANS ORIGINATED
10
$290,608
284
$215,908
402
$203,133
40
$103,490
1
$1,020,000
48
$186,477
1
$17,330
APPLICATIONS APPROVED, NOT ACCEPTED
1
$150,000
49
$193,835
89
$215,140
9
$68,347
0
$0
12
$233,507
1
$58,180
APPLICATIONS DENIED
2
$202,690
47
$226,542
218
$212,206
27
$132,106
0
$0
15
$154,433
2
$107,500
APPLICATIONS WITHDRAWN
1
$342,870
28
$208,790
79
$209,128
14
$195,311
0
$0
9
$206,387
1
$164,480
FILES CLOSED FOR INCOMPLETENESS
0
$0
7
$153,041
25
$208,005
3
$114,610
0
$0
1
$144,430
0
$0
Aggregated Statistics For Year 2006 (Based on 2 full and 2 partial tracts)
A) FHA, FSA/RHS & VA Home Purchase Loans
B) Conventional Home Purchase Loans
C) Refinancings
D) Home Improvement Loans
E) Loans on Dwellings For 5+ Families
F) Non-occupant Loans on < 5 Family Dwellings (A B C & D)
G) Loans On Manufactured Home Dwelling (A B C & D)
Number
Average Value
Number
Average Value
Number
Average Value
Number
Average Value
Number
Average Value
Number
Average Value
Number
Average Value
LOANS ORIGINATED
18
$240,951
458
$186,681
550
$186,232
64
$96,873
1
$1,688,000
88
$177,024
4
$141,250
APPLICATIONS APPROVED, NOT ACCEPTED
1
$199,020
76
$179,283
103
$183,261
10
$71,650
1
$437,560
22
$174,665
1
$13,000
APPLICATIONS DENIED
3
$208,333
97
$167,938
195
$177,032
22
$112,145
0
$0
19
$174,110
7
$100,366
APPLICATIONS WITHDRAWN
1
$165,250
66
$186,370
145
$192,059
5
$80,942
0
$0
15
$168,011
3
$128,637
FILES CLOSED FOR INCOMPLETENESS
0
$0
12
$169,056
40
$189,899
2
$167,500
0
$0
1
$105,000
1
$190,000
Aggregated Statistics For Year 2005 (Based on 2 full and 2 partial tracts)
A) FHA, FSA/RHS & VA Home Purchase Loans
B) Conventional Home Purchase Loans
C) Refinancings
D) Home Improvement Loans
E) Loans on Dwellings For 5+ Families
F) Non-occupant Loans on < 5 Family Dwellings (A B C & D)
G) Loans On Manufactured Home Dwelling (A B C & D)
Number
Average Value
Number
Average Value
Number
Average Value
Number
Average Value
Number
Average Value
Number
Average Value
Number
Average Value
LOANS ORIGINATED
16
$174,160
567
$163,043
642
$167,335
63
$113,871
3
$1,282,000
110
$143,260
7
$104,981
APPLICATIONS APPROVED, NOT ACCEPTED
0
$0
70
$162,934
101
$159,911
6
$36,247
0
$0
12
$172,640
1
$24,140
APPLICATIONS DENIED
1
$168,950
96
$150,889
240
$156,682
44
$73,258
0
$0
18
$158,754
8
$73,525
APPLICATIONS WITHDRAWN
2
$127,340
79
$152,317
218
$167,944
15
$159,817
0
$0
21
$145,871
0
$0
FILES CLOSED FOR INCOMPLETENESS
0
$0
15
$152,415
43
$190,732
3
$139,923
0
$0
3
$211,803
0
$0
Aggregated Statistics For Year 2004 (Based on 2 full and 2 partial tracts)
A) FHA, FSA/RHS & VA Home Purchase Loans
B) Conventional Home Purchase Loans
C) Refinancings
D) Home Improvement Loans
E) Loans on Dwellings For 5+ Families
F) Non-occupant Loans on < 5 Family Dwellings (A B C & D)
G) Loans On Manufactured Home Dwelling (A B C & D)
Number
Average Value
Number
Average Value
Number
Average Value
Number
Average Value
Number
Average Value
Number
Average Value
Number
Average Value
LOANS ORIGINATED
26
$163,665
478
$153,941
561
$151,068
32
$71,918
1
$2,210,570
81
$141,931
9
$107,991
APPLICATIONS APPROVED, NOT ACCEPTED
2
$133,960
54
$126,904
91
$149,507
7
$38,707
0
$0
5
$138,208
2
$103,650
APPLICATIONS DENIED
6
$153,153
53
$126,287
219
$149,822
27
$39,893
0
$0
23
$122,811
6
$127,903
APPLICATIONS WITHDRAWN
4
$179,195
46
$154,748
174
$154,991
7
$95,607
0
$0
14
$108,140
1
$149,050
FILES CLOSED FOR INCOMPLETENESS
2
$195,880
6
$167,388
22
$183,347
2
$55,040
0
$0
1
$86,650
0
$0
Aggregated Statistics For Year 2003 (Based on 2 full and 2 partial tracts)
A) FHA, FSA/RHS & VA Home Purchase Loans
B) Conventional Home Purchase Loans
C) Refinancings
D) Home Improvement Loans
E) Loans on Dwellings For 5+ Families
F) Non-occupant Loans on < 5 Family Dwellings (A B C & D)
Number
Average Value
Number
Average Value
Number
Average Value
Number
Average Value
Number
Average Value
Number
Average Value
LOANS ORIGINATED
62
$161,144
407
$148,908
1,377
$140,381
19
$25,624
3
$2,366,000
97
$116,001
APPLICATIONS APPROVED, NOT ACCEPTED
5
$147,342
36
$133,285
134
$147,330
7
$29,564
0
$0
14
$126,908
APPLICATIONS DENIED
9
$130,698
51
$118,987
217
$148,266
25
$25,199
0
$0
18
$130,091
APPLICATIONS WITHDRAWN
6
$165,710
25
$144,222
180
$157,196
4
$66,512
0
$0
13
$117,379
FILES CLOSED FOR INCOMPLETENESS
0
$0
5
$144,696
36
$139,263
3
$31,793
0
$0
1
$107,370
Aggregated Statistics For Year 2002 (Based on 1 full tract)
A) FHA, FSA/RHS & VA Home Purchase Loans
B) Conventional Home Purchase Loans
C) Refinancings
D) Home Improvement Loans
F) Non-occupant Loans on < 5 Family Dwellings (A B C & D)
Number
Average Value
Number
Average Value
Number
Average Value
Number
Average Value
Number
Average Value
LOANS ORIGINATED
14
$148,143
94
$131,319
269
$126,424
6
$14,500
25
$92,000
APPLICATIONS APPROVED, NOT ACCEPTED
1
$168,000
4
$122,500
35
$140,571
1
$20,000
1
$10,000
APPLICATIONS DENIED
1
$118,000
8
$78,000
57
$113,772
6
$13,667
8
$75,250
APPLICATIONS WITHDRAWN
1
$90,000
4
$104,500
50
$125,800
2
$31,000
0
$0
FILES CLOSED FOR INCOMPLETENESS
0
$0
3
$94,000
11
$174,636
0
$0
0
$0
Aggregated Statistics For Year 2001 (Based on 1 full tract)
A) FHA, FSA/RHS & VA Home Purchase Loans
B) Conventional Home Purchase Loans
C) Refinancings
D) Home Improvement Loans
E) Loans on Dwellings For 5+ Families
F) Non-occupant Loans on < 5 Family Dwellings (A B C & D)
Number
Average Value
Number
Average Value
Number
Average Value
Number
Average Value
Number
Average Value
Number
Average Value
LOANS ORIGINATED
27
$143,704
87
$134,586
214
$133,112
11
$32,000
1
$34,000
25
$120,520
APPLICATIONS APPROVED, NOT ACCEPTED
1
$130,000
4
$112,750
23
$122,522
4
$55,500
0
$0
2
$96,000
APPLICATIONS DENIED
2
$148,500
8
$81,000
32
$137,094
6
$26,333
1
$525,000
2
$99,500
APPLICATIONS WITHDRAWN
1
$167,000
12
$137,750
56
$149,268
6
$32,333
0
$0
7
$107,429
FILES CLOSED FOR INCOMPLETENESS
1
$171,000
0
$0
7
$119,143
0
$0
0
$0
1
$109,000
Aggregated Statistics For Year 2000 (Based on 1 full tract)
A) FHA, FSA/RHS & VA Home Purchase Loans
B) Conventional Home Purchase Loans
C) Refinancings
D) Home Improvement Loans
E) Loans on Dwellings For 5+ Families
F) Non-occupant Loans on < 5 Family Dwellings (A B C & D)
Number
Average Value
Number
Average Value
Number
Average Value
Number
Average Value
Number
Average Value
Number
Average Value
LOANS ORIGINATED
22
$139,000
80
$136,512
40
$107,725
7
$21,429
2
$24,000
6
$96,667
APPLICATIONS APPROVED, NOT ACCEPTED
0
$0
10
$82,000
10
$67,600
6
$14,333
0
$0
0
$0
APPLICATIONS DENIED
0
$0
19
$67,895
17
$117,059
7
$33,714
0
$0
1
$102,000
APPLICATIONS WITHDRAWN
1
$119,000
12
$187,000
17
$93,765
0
$0
0
$0
1
$143,000
FILES CLOSED FOR INCOMPLETENESS
0
$0
2
$100,000
3
$153,000
0
$0
0
$0
0
$0
Aggregated Statistics For Year 1999 (Based on 1 full and 3 partial tracts)
A) FHA, FSA/RHS & VA Home Purchase Loans
B) Conventional Home Purchase Loans
C) Refinancings
D) Home Improvement Loans
E) Loans on Dwellings For 5+ Families
F) Non-occupant Loans on < 5 Family Dwellings (A B C & D)


 Recent articles from our blog. Our writers, many of them Ph.D. graduates or candidates, create easy-to-read articles on a wide variety of topics.

 (5.7 miles