Estimated zip code population in 2022: 1,908 Zip code population in 2010: 2,137 Zip code population in 2000: 1,941
Houses and condos: 1,765 Renter-occupied apartments: 123
% of renters here:
11%
State:
38%
March 2022 cost of living index in zip code 79734: 81.7 (low, U.S. average is 100)
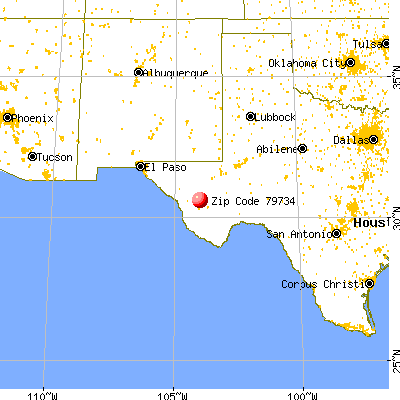
Land area: 1293.8 sq. mi. Water area: 0.0 sq. mi.
Population density: 1 people per square mile
(very low).
OSM Map
General Map
Google Map
MSN Map
OSM Map
General Map
Google Map
MSN Map
OSM Map
General Map
Google Map
MSN Map
OSM Map
General Map
Google Map
MSN Map
Please wait while loading the map...
Real estate property taxes paid for housing units in 2022:
This zip code:
0.7% ($1,418)
Texas:
1.5% ($4,050)
Median real estate property taxes paid for housing units with mortgages in 2022: $3,318 (1.3%) Median real estate property taxes paid for housing units with no mortgage in 2022: $1,308 (0.7%)
Averages for the 2020 tax year for zip code 79734, filed in 2021:
Average Adjusted Gross Income (AGI) in 2020: $73,683 (Individual Income Tax Returns)
Here:
$73,683
State:
$77,054
Salary/wage: $46,071 (reported on 69.7% of returns)
Here:
$46,071
State:
$62,766
(% of AGI for various income ranges: 1162.9% for AGIs below $25k, 3788.6% for AGIs $25k-50k, 6068.6% for AGIs $50k-75k, 9138.0% for AGIs $75k-100k, 13160.0% for AGIs $100k-200k)
Taxable interest for individuals: $1,976 (reported on 37.1% of returns)
This zip code:
$1,976
Texas:
$2,665
(% of AGI for various income ranges: 24.1% for AGIs below $25k, 68.6% for AGIs $25k-50k, 75.7% for AGIs $50k-75k, 64.0% for AGIs $75k-100k, 321.4% for AGIs $100k-200k)
Ordinary dividends: $7,971 (reported on 23.6% of returns)
Here:
$7,971
State:
$10,044
(% of AGI for various income ranges: 51.2% for AGIs below $25k, 122.1% for AGIs $25k-50k, 271.4% for AGIs $50k-75k, 196.0% for AGIs $75k-100k, 677.1% for AGIs $100k-200k)
Net capital gain/loss in AGI: +$33,362 (reported on 23.6% of returns)
Here:
+$33,362
State:
+$39,590
(% of AGI for various income ranges: 17.6% for AGIs below $25k, 95.0% for AGIs $25k-50k, 328.6% for AGIs $50k-75k, 156.0% for AGIs $75k-100k, 1495.7% for AGIs $100k-200k)
Profit/loss from business: +$10,964 (reported on 24.7% of returns)
Here:
+$10,964
State:
+$10,888
(% of AGI for various income ranges: 290.0% for AGIs below $25k, 79.3% for AGIs $25k-50k, 427.1% for AGIs $50k-75k, 696.0% for AGIs $75k-100k, 1658.6% for AGIs $100k-200k)
Taxable individual retirement arrangement distribution: $18,883 (reported on 13.5% of returns)
79734:
$18,883
Texas:
$24,740
(% of AGI for various income ranges: 162.4% for AGIs below $25k, 775.7% for AGIs $50k-75k, 2067.1% for AGIs $100k-200k)
Total itemized deductions: $49,450 (reported on 4.5% of returns)
Here:
$49,450
State:
$40,428
(% of AGI for various income ranges: 2825.7% for AGIs $100k-200k)
Charity contributions: $37,233 (reported on 3.4% of returns)
Here:
$37,233
State:
$18,201
(% of AGI for various income ranges: 1595.7% for AGIs $100k-200k)
Taxes paid: $6,025 (reported on 4.5% of returns)
79734:
$6,025
State:
$7,821
(% of AGI for various income ranges: 344.3% for AGIs $100k-200k)
Earned income credit: $2,014 (reported on 15.7% of returns)
Here:
$2,014
State:
$2,584
(% of AGI for various income ranges: 95.3% for AGIs below $25k, 85.7% for AGIs $25k-50k)
Percentage of individuals using paid preparers for their 2020 taxes: 89.9%
Here:
90%
State:
92%
(% for various income ranges: 89.7% for AGIs below $25k, 90.5% for AGIs $25k-50k, 84.6% for AGIs $50k-75k, 88.9% for AGIs $75k-100k, 92.3% for AGIs $100k-200k, 100.0% for AGIs over 200k)
Averages for the 2012 tax year for zip code 79734, filed in 2013:
Average Adjusted Gross Income (AGI) in 2012: $55,176 (Individual Income Tax Returns)
Here:
$55,176
State:
$65,384
Salary/wage: $37,672 (reported on 77.2% of returns)
Here:
$37,672
State:
$52,524
(% of AGI for various income ranges: 73.4% for AGIs below $25k, 71.7% for AGIs $25k-50k, 66.7% for AGIs $50k-75k, 48.6% for AGIs $75k-100k, 73.3% for AGIs $100k-200k)
Taxable interest for individuals: $1,300 (reported on 33.7% of returns)
This zip code:
$1,300
Texas:
$2,372
(% of AGI for various income ranges: 2.0% for AGIs below $25k, 0.9% for AGIs $25k-50k, 0.9% for AGIs $50k-75k, 0.6% for AGIs $75k-100k, 1.0% for AGIs $100k-200k)
Ordinary dividends: $5,289 (reported on 20.7% of returns)
Here:
$5,289
State:
$9,721
(% of AGI for various income ranges: 2.1% for AGIs below $25k, 1.6% for AGIs $25k-50k, 1.6% for AGIs $50k-75k, 1.8% for AGIs $75k-100k, 4.5% for AGIs $100k-200k)
Net capital gain/loss in AGI: +$25,847 (reported on 18.5% of returns)
Here:
+$25,847
State:
+$35,319
(% of AGI for various income ranges: 0.4% for AGIs $25k-50k, 2.2% for AGIs $50k-75k, 3.0% for AGIs $75k-100k, 34.3% for AGIs $100k-200k)
Profit/loss from business: +$9,196 (reported on 25.0% of returns)
Here:
+$9,196
State:
+$13,732
(% of AGI for various income ranges: 7.8% for AGIs below $25k, 6.3% for AGIs $25k-50k, 4.1% for AGIs $50k-75k, 5.6% for AGIs $75k-100k, 4.3% for AGIs $100k-200k)
Taxable individual retirement arrangement distribution: $23,844 (reported on 9.8% of returns)
79734:
$23,844
Texas:
$19,511
(% of AGI for various income ranges: 2.5% for AGIs $25k-50k, 8.0% for AGIs $50k-75k, 11.1% for AGIs $100k-200k)
Total itemized deductions: $22,739 (22% of AGI, reported on 19.6% of returns)
Here:
$22,739
State:
$24,724
Here:
21.8% of AGI
State:
15.9% of AGI
(% of AGI for various income ranges: 11.9% for AGIs $25k-50k, 8.2% for AGIs $50k-75k, 10.4% for AGIs $75k-100k, 14.1% for AGIs $100k-200k)
Charity contributions: $7,180 (reported on 16.3% of returns)
Here:
$7,180
State:
$6,808
(% of AGI for various income ranges: 1.1% for AGIs $25k-50k, 1.4% for AGIs $50k-75k, 2.9% for AGIs $75k-100k, 5.6% for AGIs $100k-200k)
Taxes paid: $4,728 (reported on 19.6% of returns)
79734:
$4,728
State:
$6,921
(% of AGI for various income ranges: 1.8% for AGIs $25k-50k, 1.8% for AGIs $50k-75k, 2.2% for AGIs $75k-100k, 3.4% for AGIs $100k-200k)
Earned income credit: $2,123 (reported on 14.1% of returns)
Here:
$2,123
State:
$2,570
(% of AGI for various income ranges: 4.5% for AGIs below $25k, 1.0% for AGIs $25k-50k)
Percentage of individuals using paid preparers for their 2012 taxes: 57.6%
Here:
58%
State:
51%
(% for various income ranges: 55.9% for AGIs below $25k, 56.0% for AGIs $25k-50k, 61.5% for AGIs $50k-75k, 55.6% for AGIs $75k-100k, 55.6% for AGIs $100k-200k, 100.0% for AGIs over 200k)
Averages for the 2004 tax year for zip code 79734, filed in 2005:
Average Adjusted Gross Income (AGI) in 2004: $39,459 (Individual Income Tax Returns)
Here:
$39,459
State:
$47,881
Salary/wage: $29,434 (reported on 76.0% of returns)
Here:
$29,434
State:
$41,947
(% of AGI for various income ranges: 889.2% for AGIs below $10k, 80.2% for AGIs $10k-25k, 65.8% for AGIs $25k-50k, 58.5% for AGIs $50k-75k, 64.5% for AGIs $75k-100k, 32.0% for AGIs over 100k)
Taxable interest for individuals: $1,507 (reported on 39.5% of returns)
This zip code:
$1,507
Texas:
$2,255
(% of AGI for various income ranges: 53.0% for AGIs below $10k, 3.1% for AGIs $10k-25k, 1.7% for AGIs $25k-50k, 1.3% for AGIs $50k-75k, 0.9% for AGIs $75k-100k, 0.8% for AGIs over 100k)
Taxable dividends: $3,908 (reported on 22.1% of returns)
Here:
$3,908
State:
$4,261
(% of AGI for various income ranges: 103.6% for AGIs below $10k, 0.9% for AGIs $10k-25k, 1.3% for AGIs $25k-50k, 1.4% for AGIs $50k-75k, 3.0% for AGIs $75k-100k, 2.5% for AGIs over 100k)
Net capital gain/loss: +$15,921 (reported on 20.0% of returns)
Here:
+$15,921
State:
+$16,110
(% of AGI for various income ranges: 236.1% for AGIs below $10k, 1.4% for AGIs $10k-25k, 3.2% for AGIs $25k-50k, 1.7% for AGIs $50k-75k, 1.5% for AGIs $75k-100k, 18.0% for AGIs over 100k)
Profit/loss from business: +$6,586 (reported on 25.1% of returns)
Here:
+$6,586
State:
+$11,013
(% of AGI for various income ranges: 56.6% for AGIs below $10k, 3.6% for AGIs $10k-25k, 4.1% for AGIs $25k-50k, 5.0% for AGIs $50k-75k, 7.8% for AGIs $75k-100k, 2.1% for AGIs over 100k)
IRA payment deduction: $3,636 (reported on 2.5% of returns)
79734:
$3,636
Texas:
$3,120
Total itemized deductions: $18,215 (19% of AGI, reported on 16.9% of returns)
Here:
$18,215
State:
$19,631
Here:
19.4% of AGI
State:
18.9% of AGI
(% of AGI for various income ranges: 8.2% for AGIs $10k-25k, 7.6% for AGIs $25k-50k, 9.2% for AGIs $50k-75k, 10.3% for AGIs $75k-100k, 6.0% for AGIs over 100k)
Charity contributions deductions: $4,299 (4% of AGI, reported on 15.2% of returns)
Here:
$4,299
State:
$4,753
Here:
4.4% of AGI
State:
4.2% of AGI
(% of AGI for various income ranges: 1.4% for AGIs $10k-25k, 1.9% for AGIs $25k-50k, 1.5% for AGIs $50k-75k, 2.3% for AGIs $75k-100k, 1.4% for AGIs over 100k)
Total tax: $7,214 (reported on 69.2% of returns)
79734:
$7,214
State:
$9,058
(% of AGI for various income ranges: 34.9% for AGIs below $10k, 3.5% for AGIs $10k-25k, 7.3% for AGIs $25k-50k, 9.4% for AGIs $50k-75k, 11.2% for AGIs $75k-100k, 21.5% for AGIs over 100k)
Earned income credit: $1,669 (reported on 19.8% of returns)
Here:
$1,669
State:
$2,024
Percentage of individuals using paid preparers for their 2004 taxes: 55.9%
Here:
56%
State:
57%
(% for various income ranges: 52.7% for AGIs below $10k, 60.1% for AGIs $10k-25k, 51.5% for AGIs $25k-50k, 52.7% for AGIs $50k-75k, 54.7% for AGIs $75k-100k, 72.9% for AGIs over 100k)
Likely homosexual households (counted as self-reported same-sex unmarried-partner households)
Lesbian couples: 0.3% of all households
Gay men: 0.0% of all households
Household received Food Stamps/SNAP in the past 12 months: 179 Household did not receive Food Stamps/SNAP in the past 12 months: 901
Women who had a birth in the past 12 months: 35 (21 now married, 13 unmarried) Women who did not have a birth in the past 12 months: 233 (103 now married, 130 unmarried)
Housing units in zip code 79734 with a mortgage: 247 Median monthly owner costs for units with a mortgage: $1,551 Median monthly owner costs for units without a mortgage: $323
Residents with income below the poverty level in 2022:
This zip code:
26.0%
Whole state:
14.0%
Residents with income below 50% of the poverty level in 2022:
This zip code:
11.3%
Whole state:
7.4%
Median number of rooms in houses and condos:
Here:
5.6
State:
6.3
Median number of rooms in apartments:
Here:
2.2
State:
4.0
Notable locations in this zip code not listed on our city pages
Notable locations in zip code 79734: Cherry Canyon Ranch (A), Company Windmill (B), Cowden Ranch (C), Deer Camp (D), Garden Windmill (E), Gearhart Ranch (F), Goat Mountain Windmill (G), Gomez Windmill (H), H O Canyon Windmill (I), House Log Windmill (J), J N Camp (K), Jeff Ranch (L), Jess Windmill (M), K C Ranch (N), Kelly Ranch (O), Kennedy Windmill (P), Leonard Camp Windmill (Q), Limpia Windmill (R), Little Hell Windmill (S), Long X Ranch (T). Display/hide their locations on the map
Lakes and reservoirs: Pine Peak Lake (A), T and P Lake (B), Blue Hole (C), Prude Tank (D), Saint Augustine Tank (E), Owl Tank (F), Olds Tank (G), Walker Tank (H). Display/hide their locations on the map
Streams, rivers, and creeks: Barillos Creek (A), Cienega Creek (B), Chihuahua Creek (C), Lone Tree Creek (D), Right Hand Creek (E), Olds Creek (F), Merrill Fork (G), Kokernot Creek (H), Indian Creek (I). Display/hide their locations on the map
In group quarters: 41 (-1 institutionalized population)
Size of family households: 330 2-persons, 50 3-persons, 9 4-persons, 20 5-persons, 73 6-persons
Size of nonfamily households: 502 1-person, 108 2-persons
149 married couples with children.
114 single-parent households (114 women).
85.3% of residents of 79734 zip code speak English at home.
13.2% of residents speak Spanish at home (26% very well, 20% well, 55% not well).
0.8% of residents speak other Indo-European language at home (53% very well, 27% well, 20% not well).
1.2% of residents speak other language at home (100% very well).
Foreign born population: 234 (12.3%) (69.1% of them are naturalized citizens)
This zip code:
12.3%
Whole state:
17.2%
56%Honduras
30%Sweden
4%Romania
2%United Kingdom, excluding England and Scotland
1%Bosnia and Herzegovina
27%English
11%American
6%Scotch-Irish
4%German
4%Swedish
3%Norwegian
2%Irish
Year of entry for the foreign-born population
852010 or later
152000 to 2009
01990 to 1999
139Before 1990
Housing units lacking complete plumbing facilities: 10.2% Housing units lacking complete kitchen facilities: 8.1%
52.0%Electricity
29.9%Bottled, tank, or LP gas
12.3%Utility gas
5.9%Wood
Population in 1990: 1,607. Population change in the 1990s: +334 (+20.8%).
Place of birth for U.S.-born residents:
This state: 1,274
Northeast: 87
Midwest: 121
South: 120
West: 53
53% of the 79734 zip code residents lived in the same house 5 years ago. Out of people who lived in different houses, 22% lived in this county. Out of people who lived in different counties, 50% lived in Texas.
92% of the 79734 zip code residents lived in the same house 1 year ago. Out of people who lived in different houses, 15% moved from this county. Out of people who lived in different houses, 89% moved from different county within same state.
Private vs. public school enrollment:
Students in private schools in grades 1 to 8 (elementary and middle school):
Here:
0.0%
Texas:
8.8%
Students in private schools in grades 9 to 12 (high school): 7
Here:
7.1%
Texas:
8.0%
Occupation by median earnings in the past 12 months ($)
90,338Management occupations
79,122Sales and related occupations
54,984Education, training, and library occupations
54,935Life, physical, and social science occupations
11,527Food preparation and serving related occupations
Companies with federal contracts located in this zip code:
PRUDE RANCH, INC (HWY 118, 6 MILES N OF FT in FORT DAVIS, TX; small business) : $13,562 in 4 contractsfrom 2003 to 2004
$10,431 with Army for Lodging - Hotel/Motel. Signed on 2004-01-26. Completion date: 2004-02-22.
$9,487, same as above.Signed on 2003-10-21. Completion date: 2003-10-26.
-$2,205, same as above.Signed on 2003-10-27. Completion date: 2003-10-26.
-$4,151, same as above.Signed on 2004-02-24. Completion date: 2004-02-22.
FORT DAVIS VOLUNTARY FIRE DEPA (201 COURT ST in FORT DAVIS, TX; small business) 17 employees, $0 revenue.
$8,000 with National Park Service for Fire Fighting Equipment. Signed on 2002-03-15. Completion date: 2002-06-15.
Top industries in this zip code by the number of employees in 2005:
88 people in residential treatment centers for juveniles (non-correctional)
People in group quarters in 2000:
68 people in homes for abused, dependent, and neglected children
Fatal accident statistics in 2014:
Fatal accident count: 1
Vehicles involved in fatal accidents: 1
Fatal accidents caused by drunken drivers: 0
Fatalities: 1
Persons involved in fatal accidents: 1
Pedestrians involved in fatal accidents: 0
Fatal accident statistics in 2013:
Fatal accident count: 3
Vehicles involved in fatal accidents: 3
Fatal accidents caused by drunken drivers: 0
Fatalities: 3
Persons involved in fatal accidents: 7
Pedestrians involved in fatal accidents: 0
2005 - 2018 National Fire Incident Reporting System (NFIRS) incidents
Based on the data from the years 2005 - 2018 the average number of fire incidents per year is 33. The highest number of reported fire incidents - 60 took place in 2010, and the least - 6 in 2013. The data has a declining trend.
When looking into fire subcategories, the most incidents belonged to: Outside Fires (82.7%), and Structure Fires (13.2%).
Fire incident types reported to NFIRS in Zip Code 79734


 Nearest zip codes: 79718, 79843, 79780, 79785, 79831, 79854.


 : $13,562 in 4 contracts from 2003 to 2004


 Based on the data from the years 2005 - 2018 the average number of fire incidents per year is 33. The highest number of reported fire incidents - 60 took place in 2010, and the least - 6 in 2013. The data has a declining trend.
 When looking into fire subcategories, the most incidents belonged to: Outside Fires (82.7%), and Structure Fires (13.2%).