
Andrey Kamenov, Ph.D. Probability and Statistics
Today we’ll take a look at the seasonality of peer-to-peer lending. Thanks to data provided by Prosper, we can perform a quantitative analysis of loan charge-off times and find if there are any seasonal patterns present.
First, let’s take a look at the lifespan distribution of defaulted loans. We see that the default rates increase significantly during the first several months, with the largest number of defaults registered in the eighth and ninth months after origination.

The median of the above distribution is 14 months. Considering that a loan is charged off once the payment is four months late, this means that more than half of all defaulted loans missed the payment during the first year.
To find out if there are any seasonal patterns in loan default rates, we should take the fact that the total number of Prosper loans has been rapidly growing during the past five years into account. That means that almost every quarter saw more new loans than the previous one, so it is essential to remove any trend before dealing with the data.
Another consideration is the fact that different months have different numbers of days. This is especially important for February (of course). To remove the background noise and make seasonal patterns more clear, we have adjusted the numbers accordingly.
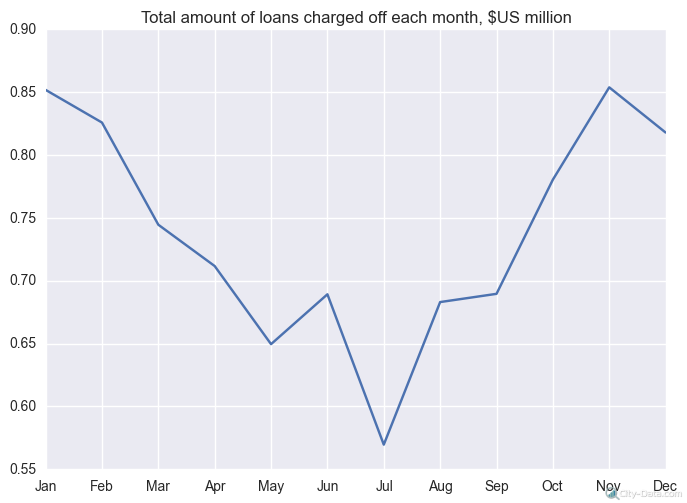
In the above chart, we can see how the total number of charged-off loans (gross principal loss, to be precise) changes from month to month. From this chart, the pattern seems to be quite clear: Fewer loans are charged off in the middle of the year, but the number increases rapidly toward the end of the year.
To verify this, we created one more chart. It appears that the patterns are slightly different for employed (including part-time) borrowers from other categories (self-employed and non-employed/retired borrowers).

We can see that there is a difference of around 10 percent between different quarters. As suggested by the confidence intervals shown above, as well as the statistical tests we have run on the data (F-test for equality of means), the seasonal patterns shown above are indeed significant.
About Andrey Kamenov
Andrey Kamenov, Ph.D. Probability and Statistics
Andrey Kamenov is a data scientist working for Advameg Inc. His background includes teaching statistics, stochastic processes and financial mathematics in Moscow State University and working for a hedge fund. His academic interests range from statistical data analysis to optimal stopping theory. Andrey also enjoys his hobbies of photography, reading and powerlifting.
Other posts by Andrey Kamenov: