Alvin, Texas
Submit your own pictures of this city and show them to the world
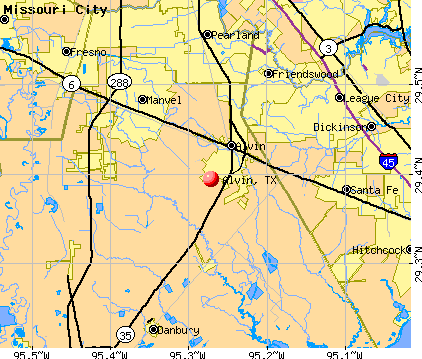
- OSM Map
- General Map
- Google Map
- MSN Map
Population change since 2000: +31.7%
 |
| Males: 13,512 | |
| Females: 14,693 |
| Median resident age: | 34.0 years |
| Texas median age: | 35.6 years |
Zip codes: 77511, 77515, 77534, 77541, 77577, 77578, 77583, 77584.
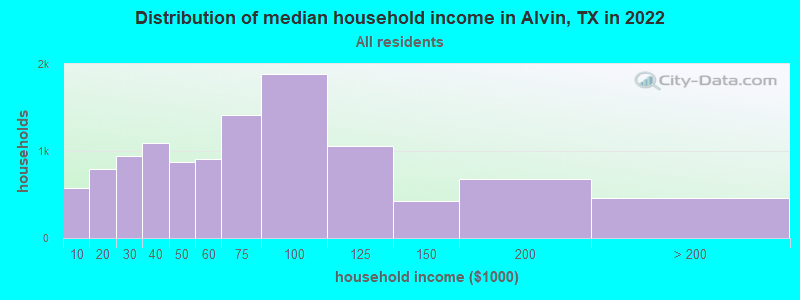
Alvin Zip Code Map| Alvin: | $63,895 |
| TX: | $72,284 |
Estimated per capita income in 2022: $28,309 (it was $17,016 in 2000)
Alvin city income, earnings, and wages data
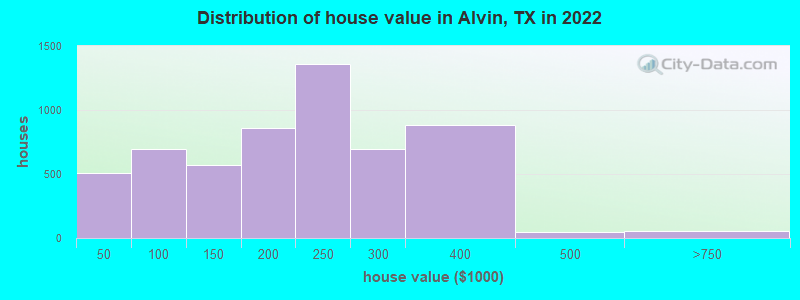
Estimated median house or condo value in 2022: $211,988 (it was $68,000 in 2000)
| Alvin: | $211,988 |
| TX: | $275,400 |
Mean prices in 2022: all housing units: $297,473; detached houses: $320,906; townhouses or other attached units: $322,794; in 2-unit structures: $221,664; in 3-to-4-unit structures: $204,531; in 5-or-more-unit structures: $323,952; mobile homes: $91,715; occupied boats, rvs, vans, etc.: $97,688
Median gross rent in 2022: $1,120.
(10.3% for White Non-Hispanic residents, 5.0% for Black residents, 10.5% for Hispanic or Latino residents, 20.5% for other race residents, 6.1% for two or more races residents)
Detailed information about poverty and poor residents in Alvin, TX


Compare current foreclosures in Alvin, TX:
| Photo | Address | Area | Beds / Baths | Price | Details |
|---|---|---|---|---|---|

|
#1
County Road 557
Alvin, TX 77511
|
1,791 sq. feet
|
2 baths 3 beds |
$304,900
|
show details |

|
#2
Briar Oak Ct
Alvin, TX 77511
|
2,167 sq. feet
|
2 baths 4 beds |
show details | |

|
#3
Stallion Rdg
Alvin, TX 77511
|
2,421 sq. feet
|
2 baths 4 beds |
show details | |

|
#4
Tallow St
Alvin, TX 77511
|
1,969 sq. feet
|
2 baths - beds |
show details | |

|
#5
Quail Run Dr
Alvin, TX 77511
|
1,552 sq. feet
|
2 baths - beds |
show details | |

|
#6
County Road 936c
Alvin, TX 77511
|
2,471 sq. feet
|
2 baths - beds |
show details | |

|
#7
County Road 941
Alvin, TX 77511
|
1,848 sq. feet
|
2 baths - beds |
show details | |

|
#8
County Road 937e
Alvin, TX 77511
|
2,120 sq. feet
|
2 baths - beds |
show details | |

|
#9
County Road 166
Alvin, TX 77511
|
3,648 sq. feet
|
3 baths - beds |
show details | |

|
#10
Jephson Dr
Alvin, TX 77511
|
1,284 sq. feet
|
1 baths - beds |
show details |
| Photo | Address | Area | Beds / Baths | Price | Details |
|---|---|---|---|---|---|

|
#11
Mcgrath Dr
Alvin, TX 77511
|
1,691 sq. feet
|
2 baths - beds |
show details | |

|
#12
W Jordan St
Alvin, TX 77511
|
1,236 sq. feet
|
1 baths - beds |
show details | |

|
#13
Surrey Oak Ct
Alvin, TX 77511
|
2,009 sq. feet
|
2 baths - beds |
show details | |

|
#14
Coventry Ln
Alvin, TX 77511
|
1,943 sq. feet
|
2 baths - beds |
show details | |

|
#15
W Sealy St
Alvin, TX 77511
|
1,997 sq. feet
|
2 baths - beds |
show details | |

|
#16
County Road 185
Alvin, TX 77511
|
2,099 sq. feet
|
2 baths - beds |
show details | |

|
#17
County Road 191
Alvin, TX 77511
|
- sq. feet
|
- baths - beds |
show details | |

|
#18
Statesman Dr
Alvin, TX 77511
|
2,028 sq. feet
|
2 baths - beds |
show details | |

|
#19
S Park Dr
Alvin, TX 77511
|
1,104 sq. feet
|
1 baths - beds |
show details | |

|
#20
Pin Oak Rd
Alvin, TX 77511
|
2,010 sq. feet
|
2 baths - beds |
show details |
| Photo | Address | Area | Beds / Baths | Price | Details |
|---|---|---|---|---|---|

|
#21
Washington Ave
Alvin, TX 77511
|
- sq. feet
|
- baths - beds |
show details | |

|
#22
Barras St
Alvin, TX 77511
|
2,735 sq. feet
|
- baths - beds |
show details | |

|
#23
County Road 62
Alvin, TX 77511
|
- sq. feet
|
- baths - beds |
show details | |

|
#24
County Road 669e
Alvin, TX 77511
|
1,344 sq. feet
|
- baths - beds |
show details | |

|
#25
Mcgrath Dr
Alvin, TX 77511
|
- sq. feet
|
- baths - beds |
show details | |

|
#26
Alluvial Cir
Alvin, TX 77511
|
- sq. feet
|
- baths - beds |
show details | |

|
#27
County Road 284
Alvin, TX 77511
|
- sq. feet
|
- baths - beds |
show details | |

|
#28
Wickwillow Ln
Alvin, TX 77511
|
- sq. feet
|
- baths - beds |
show details | |

|
#29
Fm 1462 Rd
Alvin, TX 77511
|
1,560 sq. feet
|
- baths - beds |
show details | |

|
#30
Allison St
Alvin, TX 77511
|
- sq. feet
|
- baths - beds |
show details |
| Photo | Address | Area | Beds / Baths | Price | Details |
|---|---|---|---|---|---|

|
#31
Merlot Dr
Alvin, TX 77511
|
- sq. feet
|
- baths - beds |
show details | |

|
#32
Stallion Rdg
Alvin, TX 77511
|
2,018 sq. feet
|
- baths - beds |
show details | |

|
#33
Steed Bluff Dr
Alvin, TX 77511
|
- sq. feet
|
- baths - beds |
show details | |

|
#34
S Bypass 35, Apt 501
Alvin, TX 77511
|
- sq. feet
|
- baths - beds |
show details | |

|
#35
S Highway 35
Alvin, TX 77511
|
- sq. feet
|
- baths - beds |
show details | |

|
#36
Troon Dr
Alvin, TX 77511
|
- sq. feet
|
- baths - beds |
show details | |

|
#37
1/2 Elton Rd
Alvin, TX 77511
|
- sq. feet
|
- baths - beds |
show details | |

|
Check over 1 million property listings on Foreclosure.com!
|
browse all offers | |||


- 13,13046.4%Hispanic
- 12,12042.8%White alone
- 1,7846.3%Black alone
- 7172.5%Two or more races
- 3461.2%Asian alone
- 420.1%American Indian alone
- 410.1%Other race alone
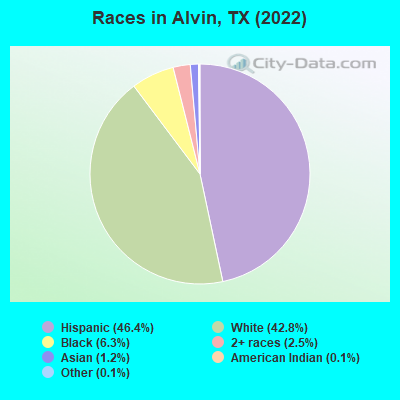
Races in Alvin detailed stats: ancestries, foreign born residents, place of birth
According to our research of Texas and other state lists, there were 140 registered sex offenders living in Alvin, Texas as of April 27, 2024.
The ratio of all residents to sex offenders in Alvin is 191 to 1.
Type |
2009 |
2010 |
2011 |
2012 |
2013 |
2014 |
2015 |
2016 |
2017 |
2018 |
2019 |
2020 |
2021 |
2022 |
|---|---|---|---|---|---|---|---|---|---|---|---|---|---|---|
| Murders (per 100,000) | 2 (8.7) | 0 (0.0) | 2 (8.1) | 0 (0.0) | 1 (4.0) | 1 (4.0) | 0 (0.0) | 0 (0.0) | 1 (3.8) | 1 (3.7) | 1 (3.7) | 0 (0.0) | 0 (0.0) | 0 (0.0) |
| Rapes (per 100,000) | 5 (21.7) | 5 (20.6) | 9 (36.4) | 11 (43.7) | 10 (39.8) | 21 (83.2) | 11 (42.6) | 17 (65.1) | 21 (79.3) | 17 (63.4) | 25 (92.1) | 20 (74.0) | 14 (51.0) | 12 (42.9) |
| Robberies (per 100,000) | 14 (60.8) | 20 (82.5) | 12 (48.5) | 13 (51.7) | 15 (59.7) | 17 (67.3) | 4 (15.5) | 10 (38.3) | 13 (49.1) | 11 (41.0) | 12 (44.2) | 13 (48.1) | 10 (36.4) | 8 (28.6) |
| Assaults (per 100,000) | 32 (139.1) | 20 (82.5) | 32 (129.3) | 38 (151.1) | 27 (107.5) | 28 (110.9) | 29 (112.2) | 29 (111.1) | 14 (52.9) | 28 (104.5) | 27 (99.4) | 53 (196.2) | 45 (163.9) | 53 (189.5) |
| Burglaries (per 100,000) | 153 (664.8) | 174 (717.9) | 166 (670.8) | 149 (592.6) | 117 (465.9) | 100 (396.0) | 102 (394.7) | 86 (329.5) | 83 (313.3) | 48 (179.1) | 80 (294.6) | 70 (259.1) | 72 (262.3) | 67 (239.5) |
| Thefts (per 100,000) | 492 (2,138) | 544 (2,245) | 551 (2,227) | 502 (1,996) | 513 (2,043) | 559 (2,214) | 574 (2,221) | 495 (1,897) | 342 (1,291) | 370 (1,381) | 513 (1,889) | 607 (2,247) | 567 (2,066) | 368 (1,316) |
| Auto thefts (per 100,000) | 47 (204.2) | 26 (107.3) | 41 (165.7) | 24 (95.4) | 38 (151.3) | 38 (150.5) | 33 (127.7) | 64 (245.2) | 60 (226.5) | 49 (182.8) | 74 (272.5) | 58 (214.7) | 64 (233.2) | 46 (164.4) |
| Arson (per 100,000) | 4 (17.4) | 2 (8.3) | 5 (20.2) | 2 (8.0) | 0 (0.0) | 0 (0.0) | 1 (3.9) | 2 (7.7) | 1 (3.8) | 1 (3.7) | 7 (25.8) | 3 (11.1) | 3 (10.9) | 1 (3.6) |
| City-Data.com crime index | 229.2 | 206.4 | 234.9 | 209.7 | 205.7 | 245.1 | 187.8 | 204.4 | 188.0 | 173.8 | 232.1 | 238.1 | 204.2 | 163.3 |
The City-Data.com crime index weighs serious crimes and violent crimes more heavily. Higher means more crime, U.S. average is 246.1. It adjusts for the number of visitors and daily workers commuting into cities.
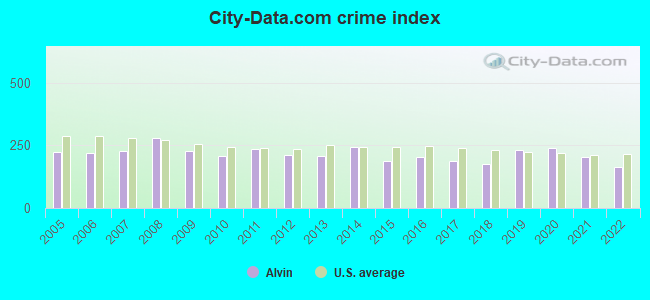
Crime rate in Alvin detailed stats: murders, rapes, robberies, assaults, burglaries, thefts, arson
Full-time law enforcement employees in 2021, including police officers: 83 (53 officers - 45 male; 8 female).
| Officers per 1,000 residents here: | 1.93 |
| Texas average: | 2.07 |
 Recent articles from our blog. Our writers, many of them Ph.D. graduates or candidates, create easy-to-read articles on a wide variety of topics.

 | Westward Expansion (194 replies) |
| Looks Like the Alvin Freeway Will Finally Be Built (16 replies) |
| Cityhood Movement? (38 replies) |
| Displaced Texan Ready to Be Back in the Lone Star State...Waxahachie? Alvin? McKinney? (7 replies) |
| Alvin Texas, fixing to be more expensive (7 replies) |
| Best Subdivision Pearland/Alvin (1 reply) |
Latest news from Alvin, TX collected exclusively by city-data.com from local newspapers, TV, and radio stations
Ancestries: English (7.1%), German (6.9%), American (5.0%), Irish (2.5%), Czech (1.1%).
Current Local Time: CST time zone
Land area: 16.4 square miles.
Population density: 1,716 people per square mile (low).
3,276 residents are foreign born (10.2% Latin America).
| This city: | 11.6% |
| Texas: | 17.1% |
Median real estate property taxes paid for housing units with mortgages in 2022: $4,252 (1.8%)
Median real estate property taxes paid for housing units with no mortgage in 2022: $2,388 (1.4%)
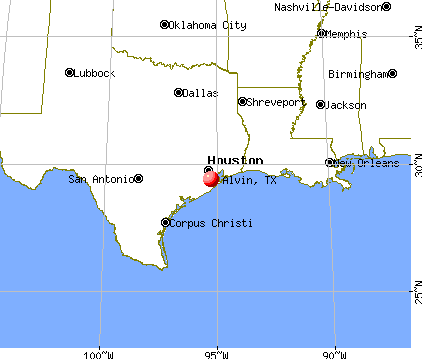
Nearest city with pop. 50,000+: Pasadena, TX  (20.4 miles , pop. 141,674).
Nearest city with pop. 200,000+: Houston, TX (26.4 miles , pop. 1,953,631).
Nearest cities:
), ), ), )Latitude: 29.39 N, Longitude: 95.27 W
Daytime population change due to commuting: -317 (-1.1%)
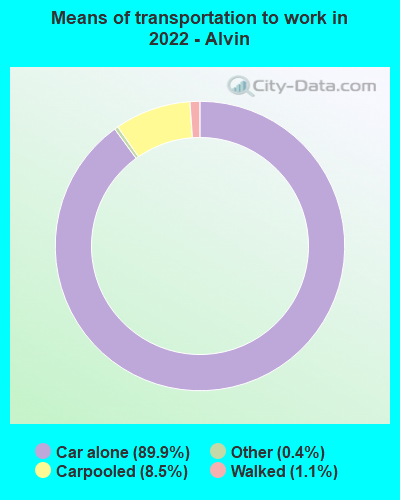
Workers who live and work in this city: 4,864 (35.1%)
Area codes: 281, 832
Alvin tourist attractions:
Alvin, Texas accommodation & food services, waste management - Economy and Business Data
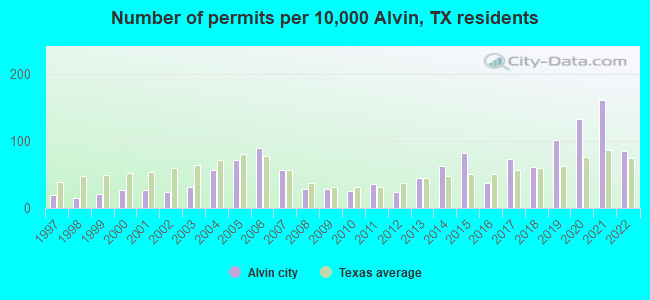
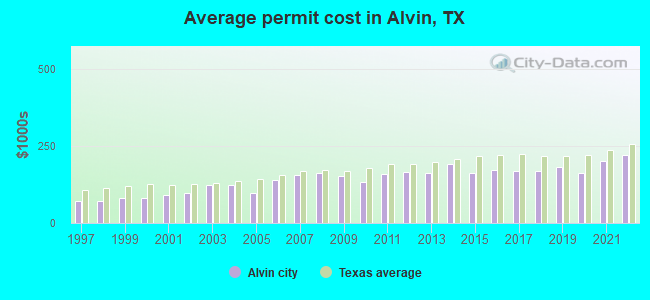
Single-family new house construction building permits:
- 2022: 183 buildings, average cost: $221,300
- 2021: 345 buildings, average cost: $203,000
- 2020: 283 buildings, average cost: $163,700
- 2019: 217 buildings, average cost: $183,300
- 2018: 130 buildings, average cost: $168,900
- 2017: 156 buildings, average cost: $167,600
- 2016: 79 buildings, average cost: $170,900
- 2015: 175 buildings, average cost: $163,900
- 2014: 132 buildings, average cost: $191,300
- 2013: 96 buildings, average cost: $164,400
- 2012: 51 buildings, average cost: $166,600
- 2011: 78 buildings, average cost: $159,200
- 2010: 53 buildings, average cost: $133,600
- 2009: 62 buildings, average cost: $153,900
- 2008: 61 buildings, average cost: $163,200
- 2007: 122 buildings, average cost: $156,800
- 2006: 191 buildings, average cost: $140,900
- 2005: 151 buildings, average cost: $98,400
- 2004: 123 buildings, average cost: $124,600
- 2003: 68 buildings, average cost: $122,600
- 2002: 51 buildings, average cost: $98,000
- 2001: 57 buildings, average cost: $90,900
- 2000: 58 buildings, average cost: $80,600
- 1999: 45 buildings, average cost: $81,300
- 1998: 33 buildings, average cost: $72,500
- 1997: 40 buildings, average cost: $71,800
| Here: | 4.6% |
| Texas: | 3.5% |
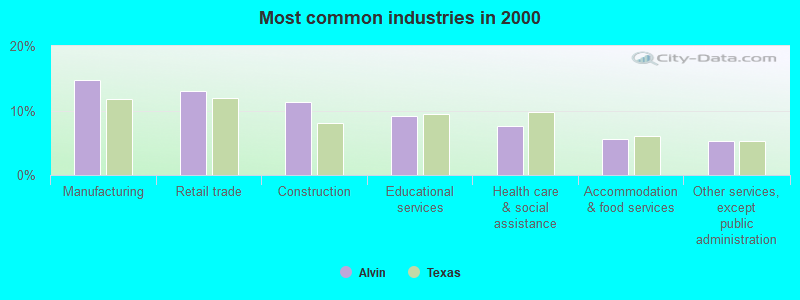
- Construction (11.4%)
- Educational services (9.2%)
- Accommodation & food services (5.6%)
- Chemicals (5.5%)
- Health care (5.5%)
- Professional, scientific, technical services (4.9%)
- Public administration (4.3%)
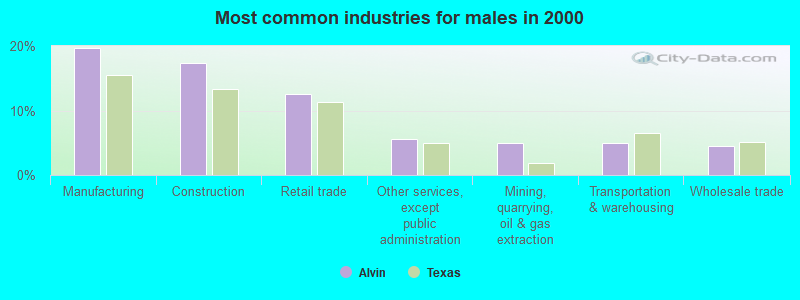
- Construction (17.3%)
- Chemicals (8.1%)
- Mining, quarrying, oil & gas extraction (4.9%)
- Public administration (4.5%)
- Professional, scientific, technical services (4.1%)
- Educational services (3.9%)
- Repair & maintenance (3.9%)
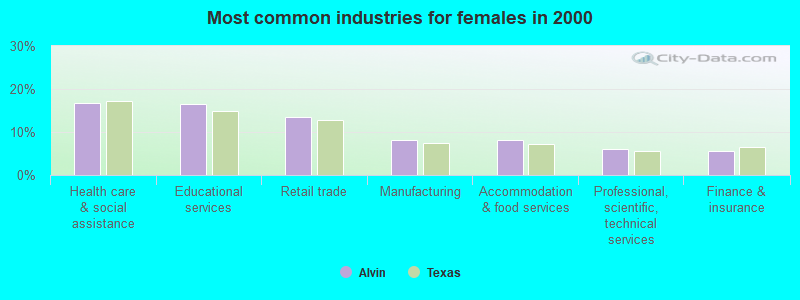
- Educational services (16.4%)
- Health care (11.7%)
- Accommodation & food services (8.0%)
- Professional, scientific, technical services (6.1%)
- Finance & insurance (5.5%)
- Social assistance (5.2%)
- Department & other general merchandise stores (4.5%)
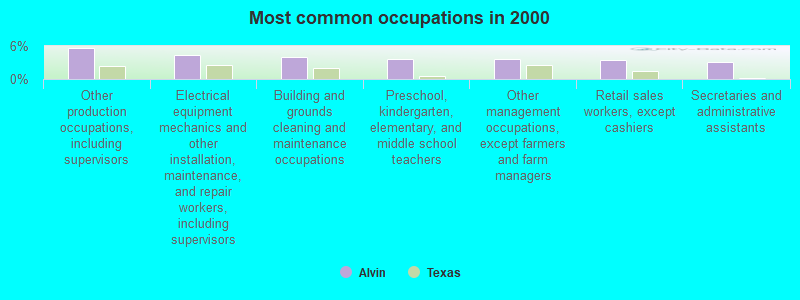
- Other production occupations, including supervisors (5.7%)
- Electrical equipment mechanics and other installation, maintenance, and repair workers, including supervisors (4.4%)
- Building and grounds cleaning and maintenance occupations (4.0%)
- Preschool, kindergarten, elementary, and middle school teachers (3.6%)
- Other management occupations, except farmers and farm managers (3.6%)
- Retail sales workers, except cashiers (3.5%)
- Secretaries and administrative assistants (3.2%)
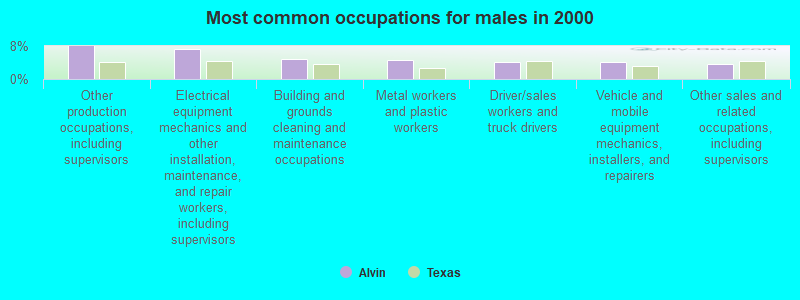
- Other production occupations, including supervisors (8.0%)
- Electrical equipment mechanics and other installation, maintenance, and repair workers, including supervisors (7.3%)
- Building and grounds cleaning and maintenance occupations (4.8%)
- Metal workers and plastic workers (4.5%)
- Driver/sales workers and truck drivers (4.1%)
- Vehicle and mobile equipment mechanics, installers, and repairers (4.1%)
- Other sales and related occupations, including supervisors (3.7%)

- Secretaries and administrative assistants (7.3%)
- Preschool, kindergarten, elementary, and middle school teachers (7.0%)
- Other office and administrative support workers, including supervisors (5.8%)
- Other management occupations, except farmers and farm managers (4.6%)
- Child care workers (4.2%)
- Cashiers (3.8%)
- Retail sales workers, except cashiers (3.8%)
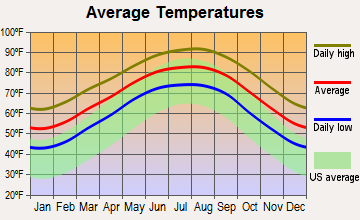
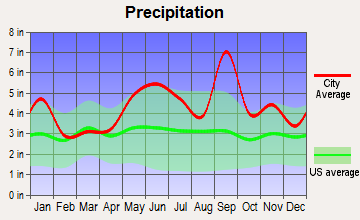
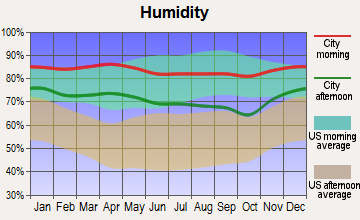
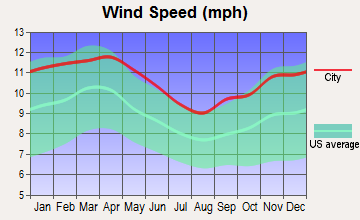
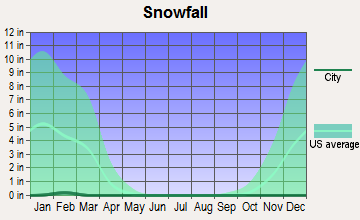
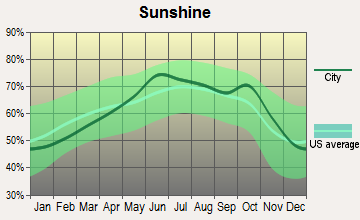
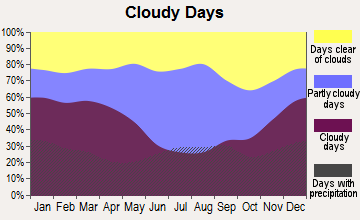
Average climate in Alvin, Texas
Based on data reported by over 4,000 weather stations
|
|

(lower is better)
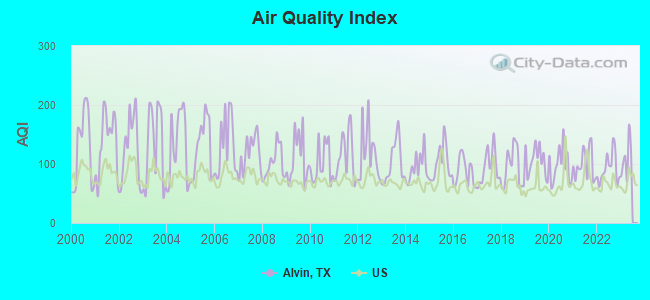
Air Quality Index (AQI) level in 2022 was 92.9. This is worse than average.
| City: | 92.9 |
| U.S.: | 72.6 |
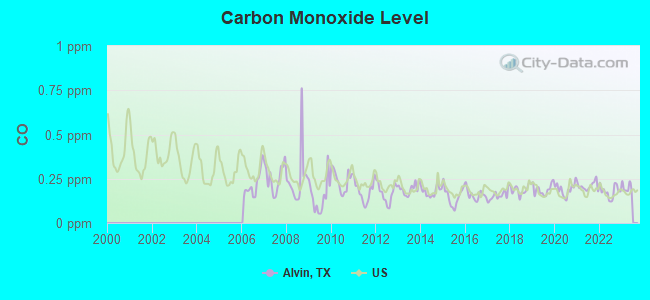
Carbon Monoxide (CO) [ppm] level in 2022 was 0.177. This is significantly better than average. Closest monitor was 15.1 miles away from the city center.
| City: | 0.177 |
| U.S.: | 0.251 |
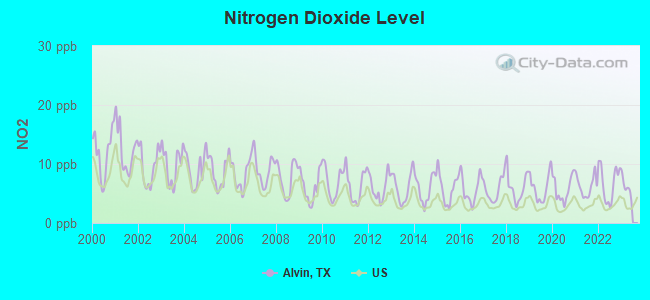
Nitrogen Dioxide (NO2) [ppb] level in 2022 was 6.74. This is worse than average. Closest monitor was 2.2 miles away from the city center.
| City: | 6.74 |
| U.S.: | 5.11 |
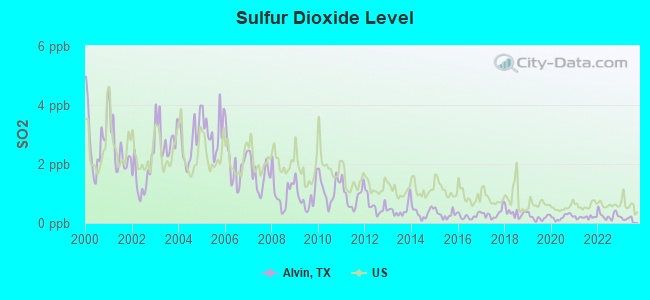
Sulfur Dioxide (SO2) [ppb] level in 2022 was 0.260. This is significantly better than average. Closest monitor was 2.2 miles away from the city center.
| City: | 0.260 |
| U.S.: | 1.515 |
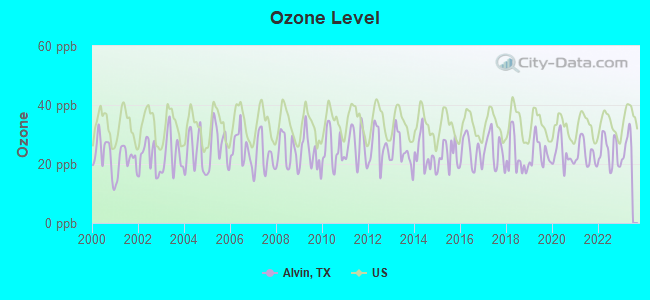
Ozone [ppb] level in 2022 was 24.2. This is better than average. Closest monitor was 11.4 miles away from the city center.
| City: | 24.2 |
| U.S.: | 33.3 |
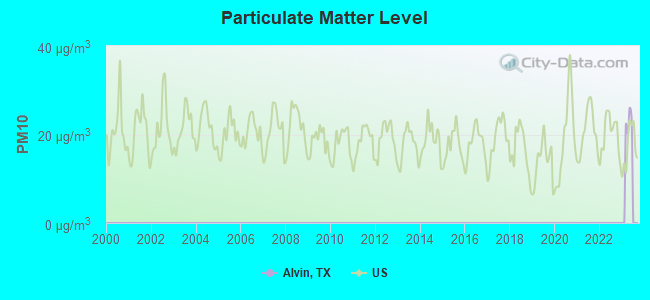
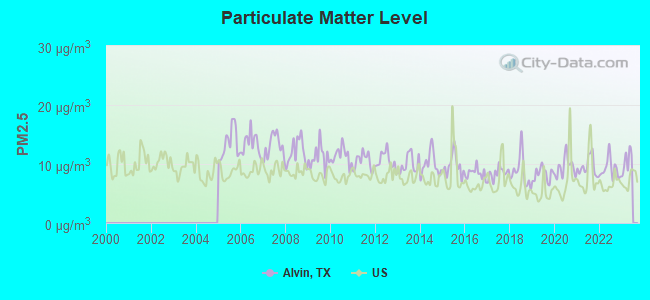
Particulate Matter (PM2.5) [µg/m3] level in 2022 was 9.15. This is about average. Closest monitor was 12.6 miles away from the city center.
| City: | 9.15 |
| U.S.: | 8.11 |
Tornado activity:
Alvin-area historical tornado activity is slightly above Texas state average. It is 63% greater than the overall U.S. average.
On 11/21/1992, a category F4 (max. wind speeds 207-260 mph) tornado 23.3 miles away from the Alvin city center injured 16 people and caused between $50,000,000 and $500,000,000 in damages.
On 9/12/1961, a category F4 tornado 30.1 miles away from the city center killed 8 people and injured 200 people.
Earthquake activity:
Alvin-area historical earthquake activity is significantly above Texas state average. It is 41% smaller than the overall U.S. average.On 10/20/2011 at 12:24:41, a magnitude 4.8 (4.8 MW, Depth: 3.1 mi, Class: Light, Intensity: IV - V) earthquake occurred 173.5 miles away from Alvin center
On 5/17/2012 at 08:12:00, a magnitude 4.8 (4.8 MW, Depth: 3.1 mi) earthquake occurred 183.2 miles away from Alvin center
On 4/9/1993 at 12:29:19, a magnitude 4.3 (4.1 MB, 4.3 LG, Depth: 3.1 mi) earthquake occurred 177.0 miles away from Alvin center
On 9/2/2013 at 23:51:15, a magnitude 4.3 (4.3 MW, Depth: 2.9 mi) earthquake occurred 181.1 miles away from the city center
On 9/2/2013 at 21:52:38, a magnitude 4.2 (4.2 MW, Depth: 3.0 mi) earthquake occurred 183.3 miles away from the city center
On 1/25/2013 at 07:01:19, a magnitude 4.1 (4.1 MB, Depth: 3.1 mi) earthquake occurred 179.1 miles away from the city center
Magnitude types: regional Lg-wave magnitude (LG), body-wave magnitude (MB), moment magnitude (MW)
Natural disasters:
The number of natural disasters in Brazoria County (26) is a lot greater than the US average (15).Major Disasters (Presidential) Declared: 18
Emergencies Declared: 6
Causes of natural disasters: Storms: 12, Floods: 10, Hurricanes: 10, Tornadoes: 5, Tropical Storms: 2, Winds: 2, Fire: 1, Flash Flood: 1, Other: 1 (Note: some incidents may be assigned to more than one category).

Main business address for: TEAM INC (SERVICES-MISCELLANEOUS REPAIR SERVICES).
Hospitals and medical centers in Alvin:
- ALVIN MEDICAL CENTER (301 MEDIC LANE)
- HIGHLAND GROUP HOME (1304 HIGHLAND)
- TOVREA (802 TOVREA)
- ALVIN CONVALESCENT CENTER (416 NORTH SHIRLEY STREET)
- COLUMBIA ALVIN MEDICAL HOS (301 MEDIC LANE)
- LAUREL COURT (3830 MUSTANG ROAD)
- WINCHESTER LODGE HEALTHCARE CENTER (1112 SMITH DR)
- WINCHESTER LODGE NURSING HOME (1112 SMITH DR)
- ALVIN DIALYSIS CENTER (2625 S LOOP 35 STE 154)
- HOUSE CALLS HOME HEALTH (218 WEST COOMBS)
Airports and heliports located in Alvin:
- Alvin Airpark Airport (6R5) (Runways: 3, Itinerant Ops: 100, Local Ops: 2,600)
- J-D Ranch Airport (3TS3) (Runways: 1)
- Minard Pegasus Airport (TE09) (Runways: 1)
- Amoco Heliport (TA74)
- D W C Heliport (1TA3)
College/University in Alvin:
Other colleges/universities with over 2000 students near Alvin:
- College of the Mainland (about 17 miles; Texas City, TX; Full-time enrollment: 2,739)
- University of Houston-Clear Lake (about 17 miles; Houston, TX; FT enrollment: 5,833)
- San Jacinto Community College (about 21 miles; Pasadena, TX; FT enrollment: 13,517)
- The University of Texas Health Science Center at Houston (about 23 miles; Houston, TX; FT enrollment: 3,023)
- University of Houston (about 23 miles; Houston, TX; FT enrollment: 31,888)
- Texas Southern University (about 24 miles; Houston, TX; FT enrollment: 7,053)
- Rice University (about 24 miles; Houston, TX; FT enrollment: 6,713)
Public high schools in Alvin:
- ALVIN H S (Students: 756, Location: 802 S JOHNSON ST, Grades: PK-12)
- ASSETS (Students: 223, Location: 605 W HOUSE ST, Grades: 9-12)
- BRAZORIA CO J J A E P (Students: 6, Location: 301 E HOUSE ST, Grades: 9-10)
Private high school in Alvin:
Biggest public elementary/middle schools in Alvin:
- HOOD-CASE EL (Students: 754, Location: 1450 HTS RD, Grades: PK-5)
- ALVIN PRI (Students: 716, Location: 2200 W PARK, Grades: PK-2)
- G W HARBY J H (Students: 665, Location: 1500 HTS RD, Grades: 6-8)
- FAIRVIEW J H (Students: 648, Location: 2600 CR 190, Grades: 6-8)
- SAVANNAH LAKES EL (Students: 646, Location: 301 E HOUSE ST, Grades: PK-5)
- MARK TWAIN EL (Students: 640, Location: 345 KENDALL CREST DR, Grades: PK-5)
- R L STEVENSON PRI (Students: 627, Location: 4715 MUSTANG RD, Grades: PK-2)
- MELBA PASSMORE EL (Students: 625, Location: 600 E KOST RD, Grades: PK-5)
- ALVIN EL (Students: 598, Location: 1910 ROSHARON RD, Grades: 3-5)
- LONGFELLOW EL (Students: 505, Location: 610 E CLEMENS ST, Grades: PK-5)
Points of interest:
Notable locations in Alvin: Alvin Volunteer Fire Department Station 1 (A), Alvin Volunteer Fire Department Station 2 (B), Alvin Police Department (C), Alvin Museum (D), Alvin Volunteer Fire Department Station 3 (E). Display/hide their locations on the map
Shopping Centers: Fairway Plaza Shopping Center (1), Highland Square Shopping Center (2), Meadow Park Shopping Center (3), Ready Center Shopping Center (4). Display/hide their locations on the map
Main business address in Alvin: TEAM INC (A). Display/hide its location on the map
Churches in Alvin include: Rice Church (A), South Park Church (B), The First Presbyterian Church of Alvin (C), Alvin Church of the Nazarene (D), Church of Christ (E), Saint John Baptist Church (F), Primera Iglesia Bautista Church (G), Kings Row Baptist Church (H), Bayou Drive Baptist Church (I). Display/hide their locations on the map
Lake: Cox Lake (A). Display/hide its location on the map
Streams, rivers, and creeks: Willow Bayou (A), Dry Bayou (B). Display/hide their locations on the map
Parks in Alvin include: Newman Park (1), Morgan Park (2), Alvin Memorial Stadium (3). Display/hide their locations on the map
Tourist attractions: Bayou Wildlife Park (Cultural Attractions- Events- & Facilities; 5050 Fm 517 Rd) (1), Alvin City - City Hall (Cultural Attractions- Events- & Facilities; 216 West Sealy Street) (2), Alvin Action Center (Amusement & Theme Parks; 309 West Sealy Street) (3). Display/hide their approximate locations on the map
Hotels: Alvin Motel (406 East Highway 6) (1), Comfort Inn (1535 South Loop 35) (2), Comfort Inn Alvin (1535 South Bypass 35) (3), Best Western Alvin Inn (1470 South 35 Bypass) (4). Display/hide their approximate locations on the map
Courts: Alvin-City - Municipal Court (216 West Sealy Street) (1), Brazoria-County - Tax Assessor & Collector- Tax Sub-Office (6685 North Highway 35) (2). Display/hide their approximate locations on the map
Birthplace of: Austin Miller - Film actor, George Layne - 2005 NFL player (Atlanta Falcons, born: Oct 9, 1978), Gary Keithley - Football player, Hunter Schmidt - College football player (Sam Houston St. Bearkats).
Drinking water stations with addresses in Alvin and their reported violations in the past:
PT FOOD MART (Population served: 185, Groundwater):Past health violations:WEE MART (Population served: 150, Groundwater):Past monitoring violations:
- MCL, Monthly (TCR) - In AUG-2008, Contaminant: Coliform. Follow-up actions: St Compliance achieved (AUG-31-2008), St Violation/Reminder Notice (JAN-26-2011)
- Monitoring and Reporting (DBP) - Between JAN-2007 and MAR-2007, Contaminant: Chlorine. Follow-up actions: St Public Notif requested (JUL-19-2007), St Violation/Reminder Notice (JUL-19-2007), St Public Notif received (AUG-03-2007), St Compliance achieved (JAN-21-2011)
- Monitoring and Reporting (DBP) - Between OCT-2006 and DEC-2006, Contaminant: Chlorine. Follow-up actions: St Public Notif requested (JUL-19-2007), St Violation/Reminder Notice (JUL-19-2007), St Compliance achieved (JAN-21-2011)
- Monitoring and Reporting (DBP) - Between JUL-2006 and SEP-2006, Contaminant: Chlorine. Follow-up actions: St Public Notif requested (JUL-19-2007), St Violation/Reminder Notice (JUL-19-2007), St Compliance achieved (JAN-21-2011)
- Monitoring and Reporting (DBP) - Between APR-2006 and JUN-2006, Contaminant: Chlorine. Follow-up actions: St Public Notif requested (JUL-19-2007), St Violation/Reminder Notice (JUL-19-2007), St Compliance achieved (JAN-21-2011)
- Monitoring and Reporting (DBP) - Between JAN-2006 and MAR-2006, Contaminant: Chlorine. Follow-up actions: St Public Notif requested (JUL-19-2007), St Violation/Reminder Notice (JUL-19-2007), St Compliance achieved (JAN-21-2011)
- One routine major monitoring violation
- 4 other older monitoring violations
Past health violations:KWIK E MART (Population served: 150, Groundwater):Past monitoring violations:
- MCL, Monthly (TCR) - In SEP-2013, Contaminant: Coliform. Follow-up actions: St Public Notif requested (SEP-25-2013), St Violation/Reminder Notice (SEP-25-2013), St Public Notif received (OCT-09-2013), St Compliance achieved (JUL-31-2014)
- MCL, Monthly (TCR) - In FEB-2013, Contaminant: Coliform. Follow-up actions: St Public Notif requested (FEB-13-2013), St Violation/Reminder Notice (FEB-13-2013), St Public Notif received (FEB-25-2013), St Compliance achieved (APR-01-2013)
- One minor monitoring violation
- One regular monitoring violation
Past monitoring violations:SALT GRASS KOUNTRY 1 (Population served: 100, Groundwater):
- 4 routine major monitoring violations
Past monitoring violations:ROOSTERS ORANGE BAR (Population served: 85, Groundwater):
- Monitoring, Repeat Major (TCR) - In SEP-2012, Contaminant: Coliform (TCR). Follow-up actions: St Violation/Reminder Notice (NOV-27-2012), St Public Notif requested (NOV-27-2012)
- 5 routine major monitoring violations
Past health violations:RED OAKS (Population served: 50, Groundwater):Past monitoring violations:
- MCL, Monthly (TCR) - In AUG-2012, Contaminant: Coliform. Follow-up actions: St Public Notif requested (AUG-31-2012), St Violation/Reminder Notice (AUG-31-2012), St Formal NOV issued (SEP-17-2012), St Public Notif received (SEP-28-2012), St Compliance achieved (OCT-01-2012), St AO (w/penalty) issued (JUN-03-2013)
- MCL, Acute (TCR) - In MAY-2012, Contaminant: Coliform. Follow-up actions: St Public Notif requested (JUN-04-2012), St Boil Water Order (JUN-04-2012), St Violation/Reminder Notice (JUN-04-2012), St Public Notif received (JUN-07-2012), St Formal NOV issued (SEP-17-2012), St Compliance achieved (OCT-01-2012), St AO (w/penalty) issued (JUN-03-2013)
- MCL, Monthly (TCR) - In SEP-2006, Contaminant: Coliform. Follow-up actions: St Public Notif requested (OCT-02-2006), St Violation/Reminder Notice (OCT-02-2006), St Public Notif received (NOV-01-2006), St Compliance achieved (APR-01-2007)
- Monitoring, Source Water (GWR) - In AUG-01-2012, Contaminant: E. COLI. Follow-up actions: St Public Notif requested (OCT-31-2012), St Violation/Reminder Notice (OCT-31-2012), St Formal NOV issued (AUG-22-2014)
- 4 routine major monitoring violations
- 4 minor monitoring violations
- 11 regular monitoring violations
Past monitoring violations:MONSANTO PARK CHOCOLATE BAYOU (Population served: 40, Groundwater):
- Monitoring, Source Water (GWR) - In FEB-01-2013, Contaminant: E. COLI. Follow-up actions: St Violation/Reminder Notice (MAY-07-2013), St Public Notif requested (MAY-07-2013), St Compliance achieved (JUL-31-2013), St Public Notif received (JAN-22-2014)
- Monitoring, Repeat Major (TCR) - In FEB-2013, Contaminant: Coliform (TCR). Follow-up actions: St Violation/Reminder Notice (APR-01-2013), St Public Notif requested (APR-01-2013), St Public Notif received (JAN-22-2014)
- Monitoring, Source Water (GWR) - In JUL-01-2011, Contaminant: E. COLI. Follow-up actions: St Violation/Reminder Notice (AUG-25-2011), St Public Notif requested (AUG-25-2011), St Public Notif received (NOV-08-2011), St Compliance achieved (JUL-31-2013)
Past health violations:Past monitoring violations:
- MCL, Monthly (TCR) - In JUN-2012, Contaminant: Coliform. Follow-up actions: St Public Notif requested (JUN-12-2012), St Violation/Reminder Notice (JUN-12-2012), St Public Notif received (JUN-22-2012)
- 5 routine major monitoring violations
Drinking water stations with addresses in Alvin that have no violations reported:
- COLUMBUS CLUB ASSOCIATION OF ALVIN (Population served: 150, Primary Water Source Type: Groundwater)
- SPIN IN MARKET 11 (Population served: 150, Primary Water Source Type: Groundwater)
- SAMS COUNTRY STORE (Population served: 100, Primary Water Source Type: Groundwater)
- CRISTO PARA TODOS CHURCH (Population served: 80, Primary Water Source Type: Groundwater)
- ROZIS MINI MART 3 (Population served: 50, Primary Water Source Type: Groundwater)
| This city: | 2.8 people |
| Texas: | 2.8 people |
| This city: | 70.4% |
| Whole state: | 69.9% |
| This city: | 7.5% |
| Whole state: | 6.0% |
Likely homosexual households (counted as self-reported same-sex unmarried-partner households)
- Lesbian couples: 0.4% of all households
- Gay men: 0.2% of all households
People in group quarters in Alvin in 2010:
- 15 people in nursing facilities/skilled-nursing facilities
- 12 people in group homes intended for adults
- 6 people in in-patient hospice facilities
- 3 people in other noninstitutional facilities
People in group quarters in Alvin in 2000:
- 176 people in nursing homes
- 12 people in homes for the mentally retarded
- 2 people in homes or halfway houses for drug/alcohol abuse
Banks with most branches in Alvin (2011 data):
- Wells Fargo Bank, National Association: Alvin Branch at 2900 South Gordon, branch established on 2003/02/20; Alvin Branch at 102 West Sealy, branch established on 1999/08/30. Info updated 2011/04/05: Bank assets: $1,161,490.0 mil, Deposits: $905,653.0 mil, headquarters in Sioux Falls, SD, positive income, 6395 total offices, Holding Company: Wells Fargo & Company
- HomeTown Bank, National Association: Hometown Bank Of Alvin Branch at 1050 North Bypass 35, branch established on 2007/04/02. Info updated 2006/11/03: Bank assets: $426.0 mil, Deposits: $384.5 mil, headquarters in Galveston, TX, positive income, Commercial Lending Specialization, 6 total offices, Holding Company: Moody Bancshares, Inc.
- Texas First Bank: Alvin Branch at 2625 South Loop 35, branch established on 2010/01/01. Info updated 2011/05/16: Bank assets: $692.5 mil, Deposits: $616.8 mil, headquarters in Texas City, TX, positive income, Commercial Lending Specialization, 20 total offices, Holding Company: Texas Independent Bancshares, Inc.
- The Moody National Bank: Alvin Banking Center Branch at 1450 Fm 1462 Rd, branch established on 2007/05/01. Info updated 2006/11/03: Bank assets: $856.2 mil, Deposits: $712.3 mil, headquarters in Galveston, TX, positive income, Commercial Lending Specialization, 21 total offices, Holding Company: Moody Bancshares, Inc.
- Texas Advantage Community Bank, National Association: at 1701 Fairway Plaza, Suite 18, branch established on 2006/12/18. Info updated 2007/09/28: Bank assets: $81.6 mil, Deposits: $75.1 mil, local headquarters, positive income, Commercial Lending Specialization, 2 total offices
- Regions Bank: Alvin Branch at 221 South Gordon Street, branch established on 1906/01/01. Info updated 2011/02/24: Bank assets: $123,368.2 mil, Deposits: $98,301.3 mil, headquarters in Birmingham, AL, positive income, Commercial Lending Specialization, 1778 total offices, Holding Company: Regions Financial Corporation
- Woodforest National Bank: Alvin Wal-Mart Branch at 400 S. Bypass 35, branch established on 2001/05/16. Info updated 2011/05/10: Bank assets: $3,488.9 mil, Deposits: $3,097.6 mil, headquarters in Houston, TX, positive income, Commercial Lending Specialization, 766 total offices, Holding Company: Woodforest Financial Group Employee Stock Ownership Plan (With 401(K) Provisions)
- Compass Bank: Alvin Branch at 2432 S. Gordon, branch established on 1953/07/10. Info updated 2011/02/24: Bank assets: $63,107.0 mil, Deposits: $46,232.4 mil, headquarters in Birmingham, AL, negative income in the last year, Commercial Lending Specialization, 720 total offices, Holding Company: Banco Bilbao Vizcaya Argentaria, S.A.
- First National Bank of Alvin: First National Bank Of Alvin at State Hwy. 6 And State Hwy 35 Bypass, branch established on 1960/08/01. Info updated 2006/11/03: Bank assets: $111.0 mil, Deposits: $90.7 mil, local headquarters, positive income, 2 total offices, Holding Company: Coastal Bancshares, Inc.
For population 15 years and over in Alvin:
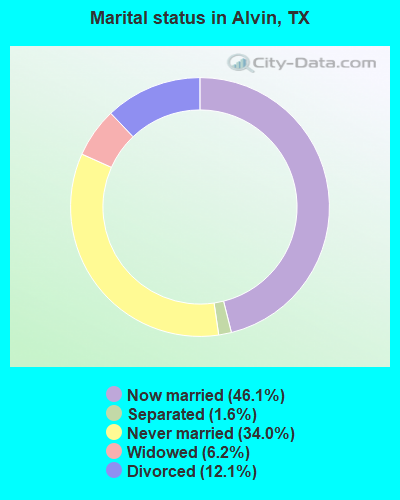
- Never married: 34.0%
- Now married: 46.1%
- Separated: 1.6%
- Widowed: 6.2%
- Divorced: 12.1%
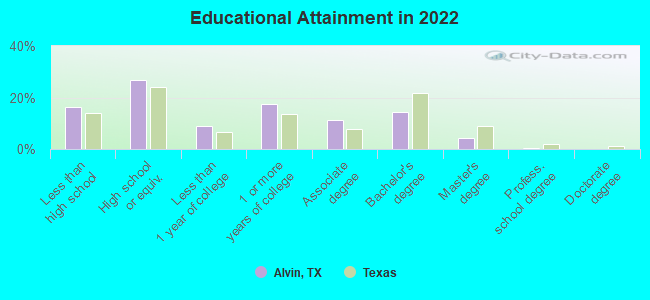
For population 25 years and over in Alvin:
- High school or higher: 83.8%
- Bachelor's degree or higher: 18.2%
- Graduate or professional degree: 4.7%
- Unemployed: 5.7%
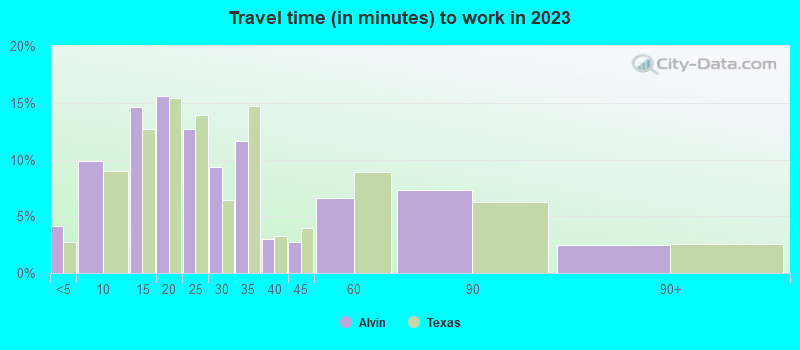
- Mean travel time to work (commute): 28.0 minutes
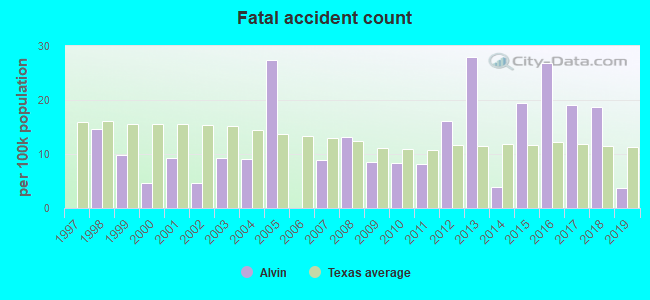
| Here: | 15.1 |
| Texas average: | 14.0 |
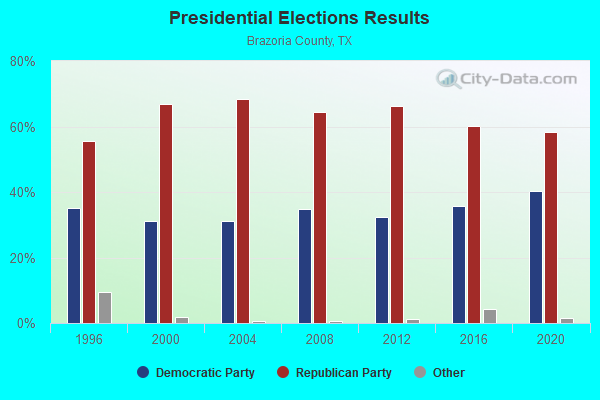
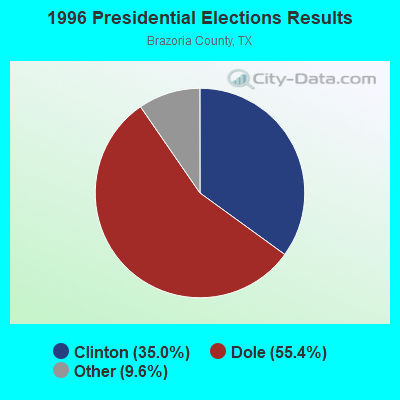

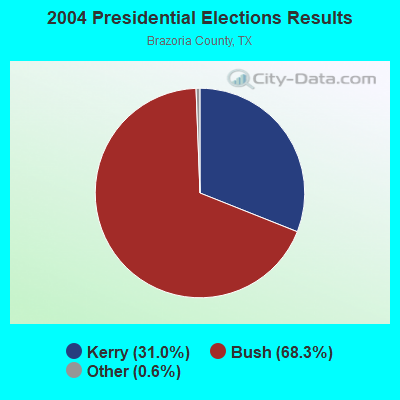
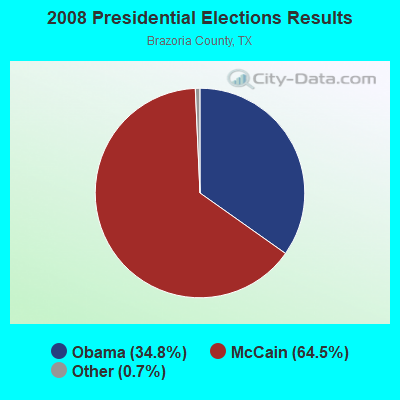
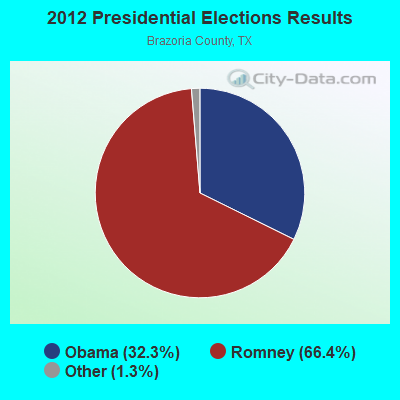
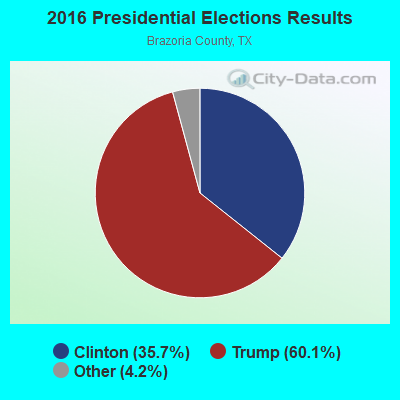
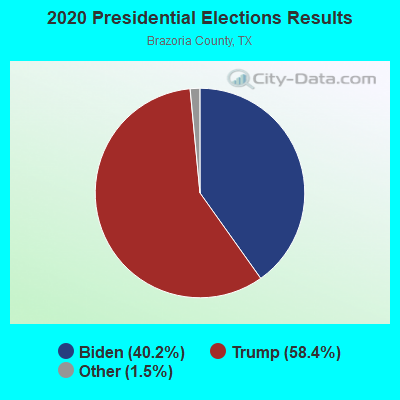
Graphs represent county-level data. Detailed 2008 Election Results
Religion statistics for Alvin, TX (based on Brazoria County data)
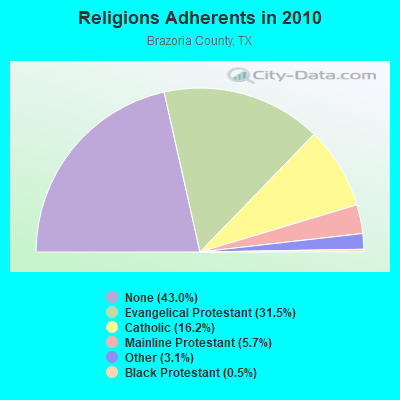
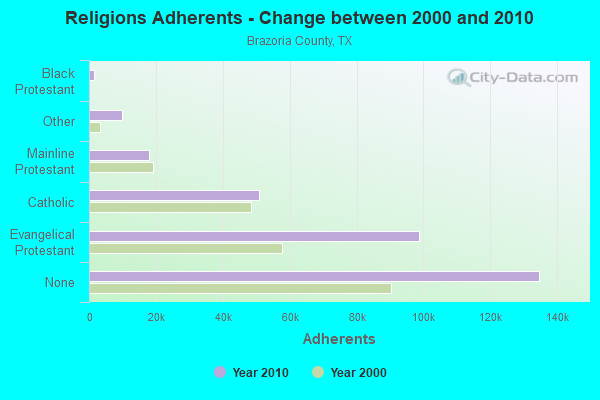
| Religion | Adherents | Congregations |
|---|---|---|
| Evangelical Protestant | 98,539 | 226 |
| Catholic | 50,863 | 12 |
| Mainline Protestant | 17,854 | 45 |
| Other | 9,752 | 19 |
| Black Protestant | 1,454 | 13 |
| Orthodox | - | - |
| None | 134,704 | - |
Food Environment Statistics:
| Brazoria County: | 0.99 / 10,000 pop. |
| Texas: | 1.47 / 10,000 pop. |
| Here: | 0.20 / 10,000 pop. |
| Texas: | 0.14 / 10,000 pop. |
| Brazoria County: | 1.13 / 10,000 pop. |
| Texas: | 1.11 / 10,000 pop. |
| Brazoria County: | 4.13 / 10,000 pop. |
| Texas: | 3.95 / 10,000 pop. |
| Brazoria County: | 4.50 / 10,000 pop. |
| Texas: | 6.13 / 10,000 pop. |
| Brazoria County: | 9.6% |
| Texas: | 8.9% |
| Brazoria County: | 29.1% |
| State: | 26.6% |
| Here: | 15.7% |
| Texas: | 15.7% |
Health and Nutrition:
| Alvin: | 48.0% |
| State: | 48.6% |
| This city: | 45.9% |
| Texas: | 47.4% |
| Alvin: | 28.8 |
| Texas: | 28.5 |
| This city: | 21.5% |
| Texas: | 20.6% |
| Alvin: | 10.7% |
| Texas: | 10.3% |
| Alvin: | 6.8 |
| State: | 6.8 |
| Alvin: | 33.7% |
| State: | 33.1% |
| Alvin: | 55.6% |
| Texas: | 56.2% |
| Here: | 80.0% |
| Texas: | 80.7% |
More about Health and Nutrition of Alvin, TX Residents
| Local government employment and payroll (March 2022) | |||||
| Function | Full-time employees | Monthly full-time payroll | Average yearly full-time wage | Part-time employees | Monthly part-time payroll |
|---|---|---|---|---|---|
| Police Protection - Officers | 53 | $356,410 | $80,697 | 0 | $0 |
| Streets and Highways | 29 | $114,607 | $47,424 | 0 | $0 |
| Health | 27 | $130,935 | $58,193 | 11 | $17,022 |
| Police - Other | 22 | $95,079 | $51,861 | 0 | $0 |
| Financial Administration | 15 | $73,269 | $58,615 | 0 | $0 |
| Water Supply | 13 | $60,184 | $55,554 | 0 | $0 |
| Sewerage | 13 | $49,425 | $45,623 | 0 | $0 |
| Parks and Recreation | 12 | $53,242 | $53,242 | 6 | $4,743 |
| Other and Unallocable | 11 | $45,053 | $49,149 | 0 | $0 |
| Judicial and Legal | 9 | $45,580 | $60,773 | 0 | $0 |
| Other Government Administration | 6 | $46,931 | $93,862 | 8 | $5,646 |
| Fire - Other | 5 | $29,033 | $69,679 | 3 | $5,039 |
| Welfare | 2 | $7,424 | $44,544 | 1 | $706 |
| Totals for Government | 217 | $1,107,173 | $61,226 | 29 | $33,156 |
Alvin government finances - Expenditure in 2017 (per resident):
- Construction - Regular Highways: $1,903,000 ($67.47)
General - Other: $55,000 ($1.95)
- Current Operations - Police Protection: $6,417,000 ($227.51)
Water Utilities: $3,167,000 ($112.29)
Sewerage: $2,330,000 ($82.61)
Solid Waste Management: $2,240,000 ($79.42)
Regular Highways: $2,185,000 ($77.47)
Health - Other: $1,914,000 ($67.86)
Parks and Recreation: $1,594,000 ($56.51)
Central Staff Services: $1,185,000 ($42.01)
Judicial and Legal Services: $660,000 ($23.40)
General - Other: $491,000 ($17.41)
Financial Administration: $440,000 ($15.60)
Protective Inspection and Regulation - Other: $293,000 ($10.39)
Local Fire Protection: $131,000 ($4.64)
Libraries: $111,000 ($3.94)
Miscellaneous Commercial Activities - Other: $44,000 ($1.56)
- Other Capital Outlay - Sewerage: $784,000 ($27.80)
Health - Other: $82,000 ($2.91)
General - Other: $33,000 ($1.17)
- Total Salaries and Wages: $12,834,000 ($455.03)
- Water Utilities - Interest on Debt: $1,330,000 ($47.15)
Alvin government finances - Revenue in 2017 (per resident):
- Charges - Sewerage: $3,762,000 ($133.38)
Solid Waste Management: $2,781,000 ($98.60)
Hospital Public: $1,591,000 ($56.41)
Other: $807,000 ($28.61)
Parks and Recreation: $128,000 ($4.54)
- Federal Intergovernmental - Other: $52,000 ($1.84)
- Local Intergovernmental - General Local Government Support: $247,000 ($8.76)
- Miscellaneous - Fines and Forfeits: $517,000 ($18.33)
General Revenue - Other: $76,000 ($2.69)
Interest Earnings: $62,000 ($2.20)
Rents: $20,000 ($0.71)
- Revenue - Water Utilities: $3,502,000 ($124.16)
- State Intergovernmental - General Local Government Support: $37,000 ($1.31)
Other: $9,000 ($0.32)
- Tax - Property: $9,249,000 ($327.92)
General Sales and Gross Receipts: $6,564,000 ($232.72)
Public Utilities Sales: $1,776,000 ($62.97)
Occupation and Business License - Other: $731,000 ($25.92)
Other Selective Sales: $729,000 ($25.85)
Amusements License: $13,000 ($0.46)
Alcoholic Beverage License: $1,000 ($0.04)
Motor Vehicle License: $1,000 ($0.04)
Alvin government finances - Debt in 2017 (per resident):
- Long Term Debt - Beginning Outstanding - Unspecified Public Purpose: $33,255,000 ($1179.05)
Outstanding Unspecified Public Purpose: $30,303,000 ($1074.38)
Retired Unspecified Public Purpose: $2,952,000 ($104.66)
Alvin government finances - Cash and Securities in 2017 (per resident):
- Bond Funds - Cash and Securities: $7,165,000 ($254.03)
- Other Funds - Cash and Securities: $22,985,000 ($814.93)
9.23% of this county's 2021 resident taxpayers lived in other counties in 2020 ($61,623 average adjusted gross income)
| Here: | 9.23% |
| Texas average: | 8.12% |
0.01% of residents moved from foreign countries ($81 average AGI)
Brazoria County: 0.01% Texas average: 0.04%
Top counties from which taxpayers relocated into this county between 2020 and 2021:
| from Harris County, TX | |
| from Fort Bend County, TX | |
| from Galveston County, TX |
7.66% of this county's 2020 resident taxpayers moved to other counties in 2021 ($65,675 average adjusted gross income)
| Here: | 7.66% |
| Texas average: | 7.40% |
0.02% of residents moved to foreign countries ($135 average AGI)
Brazoria County: 0.02% Texas average: 0.03%
Top counties to which taxpayers relocated from this county between 2020 and 2021:
| to Harris County, TX | |
| to Fort Bend County, TX | |
| to Galveston County, TX |
| Businesses in Alvin, TX | ||||
| Name | Count | Name | Count | |
|---|---|---|---|---|
| AT&T | 1 | Little Caesars Pizza | 1 | |
| Ace Hardware | 1 | MasterBrand Cabinets | 2 | |
| Advance Auto Parts | 1 | McDonald's | 2 | |
| AutoZone | 1 | Nike | 2 | |
| Best Western | 1 | Office Depot | 1 | |
| Blockbuster | 1 | Payless | 1 | |
| CVS | 1 | Penske | 1 | |
| Chevrolet | 1 | Pizza Hut | 1 | |
| Church's Chicken | 1 | Popeyes | 1 | |
| Cricket Wireless | 4 | RadioShack | 1 | |
| Decora Cabinetry | 2 | SONIC Drive-In | 1 | |
| Domino's Pizza | 1 | Sears | 1 | |
| FedEx | 4 | Starbucks | 1 | |
| GNC | 1 | Super 8 | 1 | |
| H&R Block | 2 | T-Mobile | 2 | |
| Holiday Inn | 1 | Taco Bell | 1 | |
| Home Depot | 1 | Toyota | 1 | |
| Jack In The Box | 2 | U-Haul | 2 | |
| KFC | 1 | UPS | 6 | |
| Knights Inn | 1 | Walmart | 1 | |
| Kroger | 1 | YMCA | 1 | |
| La Quinta | 1 | |||
Strongest AM radio stations in Alvin:
- KTEK (1110 AM; daytime; 2 kW; ALVIN, TX; Owner: SOUTH TEXAS BROADCASTING, INC.)
- KILE (1560 AM; 50 kW; BELLAIRE, TX; Owner: THE RAFTT CORPORATION)
- KTRH (740 AM; 50 kW; HOUSTON, TX; Owner: AMFM TEXAS LICENSES LIMITED PARTNERSHIP)
- KGOL (1180 AM; 50 kW; HUMBLE, TX; Owner: ENTRAVISION HOLDINGS, LLC)
- KYST (920 AM; 5 kW; TEXAS CITY, TX; Owner: HISPANIC BROADCASTING, INC.)
- KEYH (850 AM; 10 kW; HOUSTON, TX; Owner: LIBERMAN BROADCASTING OF HOUSTON LICENSE CORP.)
- KHCB (1400 AM; 1 kW; GALVESTON, TX; Owner: HOUSTON CHRISTIAN BROADCASTERS, INC.)
- KLAT (1010 AM; 10 kW; HOUSTON, TX; Owner: TICHENOR LICENSE CORPORATION ("TLC"))
- KXYZ (1320 AM; 5 kW; HOUSTON, TX; Owner: BLAYA INC.)
- KPRC (950 AM; 5 kW; HOUSTON, TX; Owner: CCB TEXAS LICENSES, L.P.)
- KSEV (700 AM; 15 kW; TOMBALL, TX; Owner: LIBERMAN BROADCASTING OF HOUSTON LICENSE CORP.)
- KCOH (1430 AM; 5 kW; HOUSTON, TX; Owner: KCOH, INC.)
- KILT (610 AM; 5 kW; HOUSTON, TX; Owner: TEXAS INFINITY BROADCASTING L.P.)
Strongest FM radio stations in Alvin:
- KLDE (107.5 FM; LAKE JACKSON, TX; Owner: CXR HOLDINGS, INC.)
- KOVE-FM (106.5 FM; GALVESTON, TX; Owner: HBC LICENSE CORPORATION)
- KACC (89.7 FM; ALVIN, TX; Owner: ALVIN COMMUNITY COLLEGE)
- KRTS (92.1 FM; SEABROOK, TX; Owner: KRTS, INC.)
- KRBE (104.1 FM; HOUSTON, TX; Owner: KRBE LICO, INC.)
- KUHF (88.7 FM; HOUSTON, TX; Owner: UNIVERSITY OF HOUSTON SYSTEM)
- KBXX (97.9 FM; HOUSTON, TX; Owner: RADIO ONE LICENSES, LLC)
- KHJZ-FM (95.7 FM; HOUSTON, TX; Owner: TEXAS INFINITY BROADCASTING L.P.)
- KHMX (96.5 FM; HOUSTON, TX; Owner: CITICASTERS LICENSES, L.P.)
- KILT-FM (100.3 FM; HOUSTON, TX; Owner: TEXAS INFINITY BROADCASTING L.P.)
- KKBQ-FM (92.9 FM; PASADENA, TX; Owner: CXR HOLDINGS, INC.)
- KLOL (101.1 FM; HOUSTON, TX; Owner: AMFM TEXAS LICENSES LIMITED PARTNERSHIP)
- KODA (99.1 FM; HOUSTON, TX; Owner: AMFM TEXAS LICENSES LIMITED PARTNERSHIP)
- KTBZ-FM (94.5 FM; HOUSTON, TX; Owner: AMFM TEXAS LICENSES LIMITED PARTNERSHIP)
- KKRW (93.7 FM; HOUSTON, TX; Owner: CAPSTAR TX LIMITED PARTNERSHIP)
- KHCB-FM (105.7 FM; HOUSTON, TX; Owner: HOUSTON CHRISTIAN BROADCASTERS, INC.)
- KPTY (104.9 FM; MISSOURI CITY, TX; Owner: TICHENOR LICENSE CORPORATION ("TLC"))
- KMJQ (102.1 FM; HOUSTON, TX; Owner: RADIO ONE LICENSES, LLC)
- KLTN (102.9 FM; HOUSTON, TX; Owner: HBC HOUSTON LICENSE CORPORATION)
- KJIC (90.5 FM; SANTA FE, TX; Owner: COMMUNITY RADIO, INC.)
TV broadcast stations around Alvin:
- KLTJ (Channel 22; GALVESTON, TX; Owner: WORD OF GOD FELLOWSHIP, INC.)
- KJIB-LP (Channel 5; CLEAR LAKE CITY, TX; Owner: FAR EASTERN TELECASTERS)
- KTMD (Channel 48; GALVESTON, TX; Owner: TELEMUNDO OF TEXAS PARTNERSHIP, LP)
- KAZH (Channel 57; BAYTOWN, TX; Owner: KAZH LICENSE, LLC)
- KHOU-TV (Channel 11; HOUSTON, TX; Owner: KHOU-TV, L.P.)
- KPRC-TV (Channel 2; HOUSTON, TX; Owner: POST-NEWSWEEK STATIONS, HOUSTON, LP)
- KXLN-TV (Channel 45; ROSENBERG, TX; Owner: KXLN LICENSE PARTNERSHIP, L.P.)
- KNWS-TV (Channel 51; KATY, TX; Owner: JOHNSON BROADCASTING, INC.)
- KZJL (Channel 61; HOUSTON, TX; Owner: KZJL LICENSE CORP.)
- KETH (Channel 14; HOUSTON, TX; Owner: COMMUNITY EDUCATIONAL TV, INC.)
- KHWB (Channel 39; HOUSTON, TX; Owner: KHWB, INC.)
- KRIV (Channel 26; HOUSTON, TX; Owner: FOX TELEVISION STATIONS, INC.)
- KTBU (Channel 55; CONROE, TX; Owner: HUMANITY INTERESTED MEDIA, INC.)
- KTXH (Channel 20; HOUSTON, TX; Owner: FOX TELEVISION STATIONS, INC.)
- KTRK-TV (Channel 13; HOUSTON, TX; Owner: KTRK TELEVISION, INC.)
- KPXB (Channel 49; CONROE, TX; Owner: PAXSON HOUSTON LICENSE, INC.)
- KFTH (Channel 67; ALVIN, TX; Owner: TELEFUTURA HOUSTON LLC)
- KUHT (Channel 8; HOUSTON, TX; Owner: UNIVERSITY OF HOUSTON SYSTEM)
- KVDO-LP (Channel 69; CLEAR LAKE, TX; Owner: FAR EASTERN TELECASTERS)
- KBPX-LP (Channel 33; HOUSTON, TX; Owner: PAXSON COMMUNICATIONS LPTV, INC.)
- KHMV-LP (Channel 28; HOUSTON, TX; Owner: PAPPAS TELECASTING OF THE GULF COAST, A CALIFORNIA LP)
- KVIT-LP (Channel 28; VICTORIA, TX; Owner: CLUB COMMUNICATIONS)
- KVVV-LP (Channel 53; HOUSTON, TX; Owner: KAZH LICENSE, LLC)
- KVQT-LP (Channel 24; HOUSTON, TX; Owner: C. DOWEN JOHNSON)
- K30CV (Channel 30; HOUSTON, TX; Owner: BROADCASTING SYSTEMS, INC.)
- National Bridge Inventory (NBI) Statistics
- 120Number of bridges
- 1,952ft / 595mTotal length
- $3,764,000Total costs
- 756,369Total average daily traffic
- 65,059Total average daily truck traffic
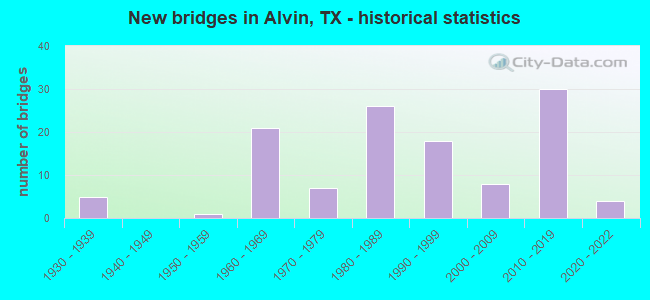
- New bridges - historical statistics
- 51930-1939
- 11950-1959
- 211960-1969
- 71970-1979
- 261980-1989
- 181990-1999
- 82000-2009
- 302010-2019
- 42020-2022
FCC Registered Antenna Towers: 431 (See the full list of FCC Registered Antenna Towers)
FCC Registered Commercial Land Mobile Towers: 2 (See the full list of FCC Registered Commercial Land Mobile Towers in Alvin, TX)
FCC Registered Private Land Mobile Towers: 7 (See the full list of FCC Registered Private Land Mobile Towers)
FCC Registered Broadcast Land Mobile Towers: 44 (See the full list of FCC Registered Broadcast Land Mobile Towers)
FCC Registered Microwave Towers: 1,308 (See the full list of FCC Registered Microwave Towers in this town)
FCC Registered Paging Towers: 20 (See the full list of FCC Registered Paging Towers)
FCC Registered Maritime Coast & Aviation Ground Towers: 2 (See the full list of FCC Registered Maritime Coast & Aviation Ground Towers)
FCC Registered Amateur Radio Licenses: 309 (See the full list of FCC Registered Amateur Radio Licenses in Alvin)
FAA Registered Aircraft: 56 (See the full list of FAA Registered Aircraft in Alvin)
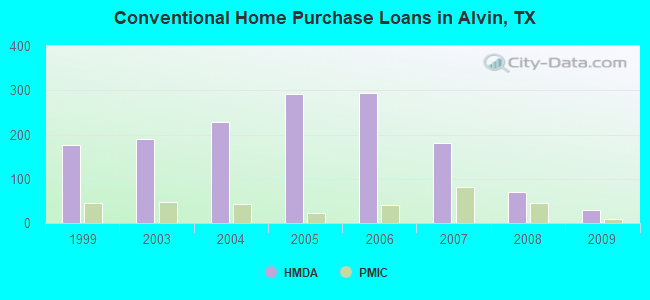
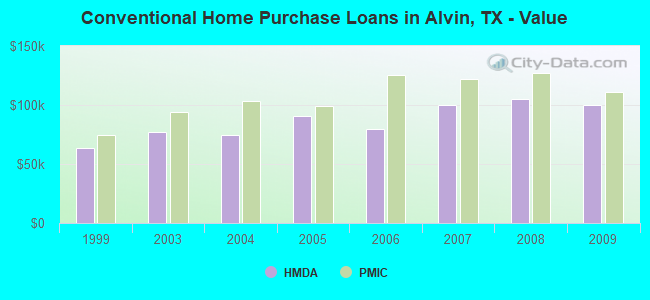
| Home Mortgage Disclosure Act Aggregated Statistics For Year 2009 (Based on 2 full and 4 partial tracts) | ||||||||||||||
| A) FHA, FSA/RHS & VA Home Purchase Loans | B) Conventional Home Purchase Loans | C) Refinancings | D) Home Improvement Loans | E) Loans on Dwellings For 5+ Families | F) Non-occupant Loans on < 5 Family Dwellings (A B C & D) | G) Loans On Manufactured Home Dwelling (A B C & D) | ||||||||
|---|---|---|---|---|---|---|---|---|---|---|---|---|---|---|
| Number | Average Value | Number | Average Value | Number | Average Value | Number | Average Value | Number | Average Value | Number | Average Value | Number | Average Value | |
| LOANS ORIGINATED | 96 | $130,156 | 30 | $99,975 | 92 | $116,023 | 18 | $19,162 | 4 | $1,301,440 | 12 | $52,962 | 2 | $49,890 |
| APPLICATIONS APPROVED, NOT ACCEPTED | 5 | $129,296 | 3 | $79,640 | 18 | $118,207 | 2 | $29,550 | 0 | $0 | 1 | $39,900 | 0 | $0 |
| APPLICATIONS DENIED | 9 | $140,453 | 12 | $75,359 | 57 | $119,236 | 27 | $20,791 | 0 | $0 | 7 | $71,460 | 9 | $36,403 |
| APPLICATIONS WITHDRAWN | 21 | $142,284 | 9 | $106,156 | 28 | $143,301 | 3 | $38,187 | 0 | $0 | 4 | $168,848 | 1 | $152,390 |
| FILES CLOSED FOR INCOMPLETENESS | 1 | $179,090 | 3 | $53,297 | 7 | $112,369 | 2 | $15,115 | 0 | $0 | 2 | $32,055 | 1 | $53,740 |
Detailed HMDA statistics for the following Tracts: 6606.00 , 6611.00, 6612.00, 6613.00, 6614.00, 6616.00
| Private Mortgage Insurance Companies Aggregated Statistics For Year 2009 (Based on 2 full and 4 partial tracts) | ||||
| A) Conventional Home Purchase Loans | B) Refinancings | |||
|---|---|---|---|---|
| Number | Average Value | Number | Average Value | |
| LOANS ORIGINATED | 9 | $111,404 | 3 | $185,483 |
| APPLICATIONS APPROVED, NOT ACCEPTED | 3 | $139,813 | 2 | $107,460 |
| APPLICATIONS DENIED | 1 | $166,370 | 0 | $0 |
| APPLICATIONS WITHDRAWN | 2 | $108,325 | 0 | $0 |
| FILES CLOSED FOR INCOMPLETENESS | 0 | $0 | 0 | $0 |
Detailed PMIC statistics for the following Tracts: 6606.00 , 6611.00, 6612.00, 6613.00, 6614.00, 6616.00
2004 - 2018 National Fire Incident Reporting System (NFIRS) incidents
- Fire incident types reported to NFIRS in Alvin, TX
- 1,75858.6%Outside Fires
- 75325.1%Structure Fires
- 38412.8%Mobile Property/Vehicle Fires
- 1053.5%Other
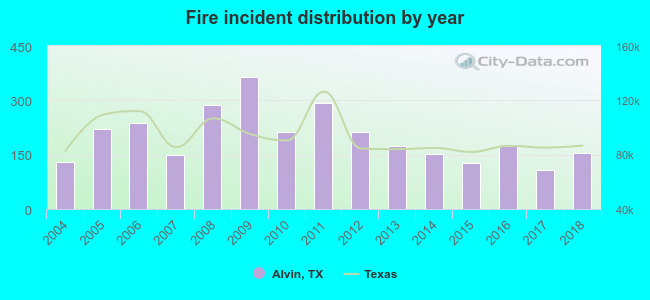 Based on the data from the years 2004 - 2018 the average number of fires per year is 200. The highest number of reported fires - 364 took place in 2009, and the least - 108 in 2017. The data has an increasing trend.
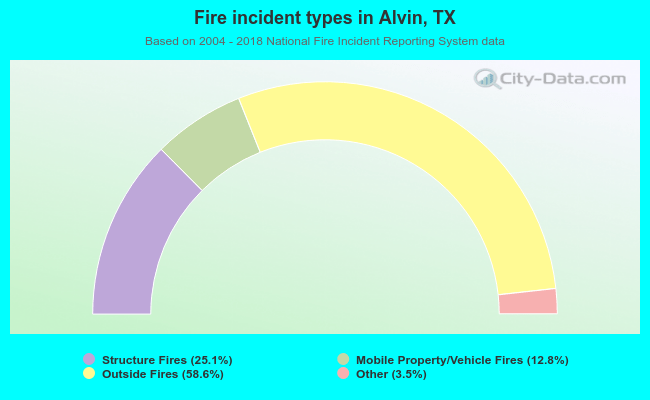 When looking into fire subcategories, the most incidents belonged to: Outside Fires (58.6%), and Structure Fires (25.1%).
Fire-safe hotels and motels in Alvin, Texas:
- Americas Best Value Inn & Suites, 1588 South Loop 35, Alvin, Texas 77511 , Phone: (281) 331-0335, Fax: (281) 585-3352
- Holiday Inn Express & Suites, 900 South Loop 35, Alvin, Texas 77511 , Phone: (281) 968-7296, Fax: (281) 968-7296
- La Quinta Inns And Suites, 880 S Loop 35, Alvin, Texas 77511 , Phone: (281) 585-3900, Fax: (281) 585-3901
- Bestwestern Alvin Inn, 1470 South Byp 35, Alvin, Texas 77511 , Phone: (281) 331-4545, Fax: (281) 585-3737
- Alvin Extended Stay, 406 East Hwy 6, Alvin, Texas 77511 , Phone: (281) 968-7800, Fax: (281) 968-7245
| Most common first names in Alvin, TX among deceased individuals | ||
| Name | Count | Lived (average) |
|---|---|---|
| John | 157 | 70.7 years |
| James | 142 | 70.5 years |
| Mary | 119 | 76.8 years |
| William | 116 | 72.3 years |
| Robert | 109 | 70.0 years |
| George | 85 | 73.0 years |
| Charles | 65 | 69.6 years |
| Margaret | 51 | 78.5 years |
| Ruth | 49 | 77.3 years |
| Dorothy | 47 | 73.7 years |
| Most common last names in Alvin, TX among deceased individuals | ||
| Last name | Count | Lived (average) |
|---|---|---|
| Smith | 75 | 71.7 years |
| Williams | 57 | 74.0 years |
| Miller | 39 | 73.2 years |
| Jones | 37 | 74.6 years |
| Garcia | 37 | 73.0 years |
| Moore | 35 | 77.2 years |
| Johnson | 34 | 72.2 years |
| Brown | 33 | 69.2 years |
| Martin | 31 | 73.7 years |
| Wilson | 30 | 74.4 years |
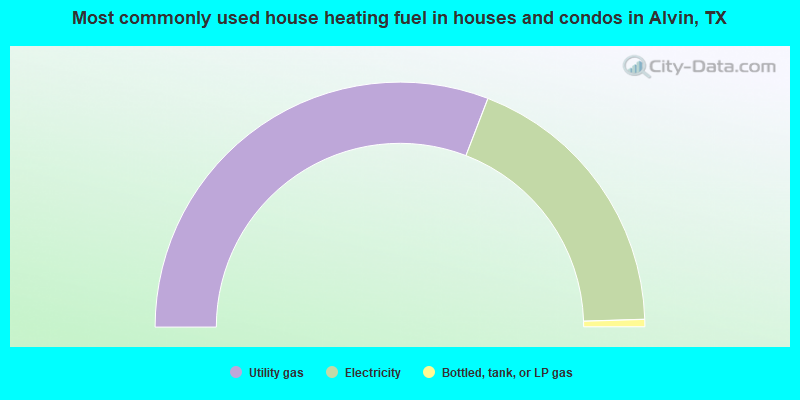
- 61.7%Utility gas
- 37.3%Electricity
- 1.0%Bottled, tank, or LP gas
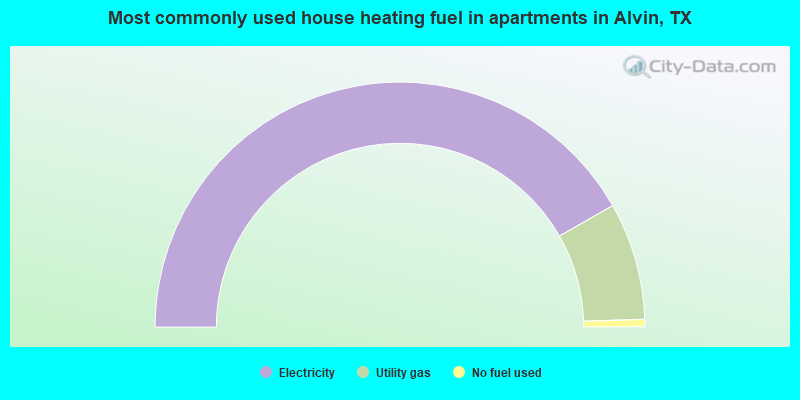
- 83.5%Electricity
- 15.5%Utility gas
- 1.0%No fuel used
Alvin compared to Texas state average:
- Unemployed percentage below state average.
- Length of stay since moving in above state average.

|
|
Total of 95 patent applications in 2008-2024.