Estimated zip code population in 2022: 92,793
Zip code population in 2010: 70,228
Zip code population in 2000: 29,441
Houses and condos: 33,002
Renter-occupied apartments: 7,758
% of renters here:
25%State:
38%
March 2022 cost of living index in zip code 77584: 93.6
(less than average, U.S. average is 100)
Land area: 32.1
sq. mi.
Water area: 0.1
sq. mi.
Population density: 2,891 people per square mile (average).
OSM Map
General Map
Google Map
MSN Map
OSM Map
General Map
Google Map
MSN Map
OSM Map
General Map
Google Map
MSN Map
OSM Map
General Map
Google Map
MSN Map
Please wait while loading the map...
Real estate property taxes paid for housing units in 2022:
This zip code:
2.0% ($7,627)Texas:
1.5% ($4,050)
Median real estate property taxes paid for housing units with mortgages in 2022: $8,239 (2.1%)
Median real estate property taxes paid for housing units with no mortgage in 2022: $6,604 (1.9%)
Profiles of local businesses
Business Search - 14 Million verified businesses
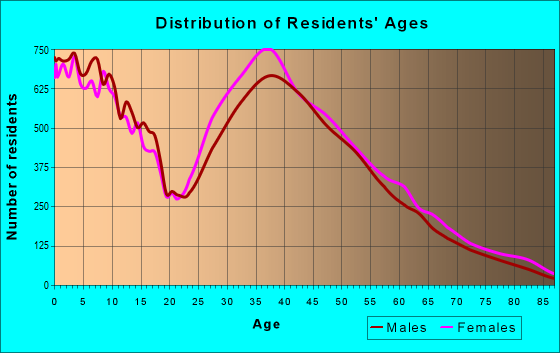
Males: 45,206 Females: 47,586
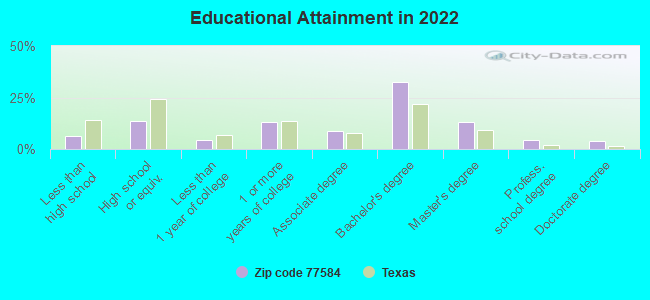
For population 25 years and over in 77584:
High school or higher: 95.6%Bachelor's degree or higher: 55.0%Graduate or professional degree: 21.6%Unemployed: 3.3%Mean travel time to work (commute): 33.8 minutes
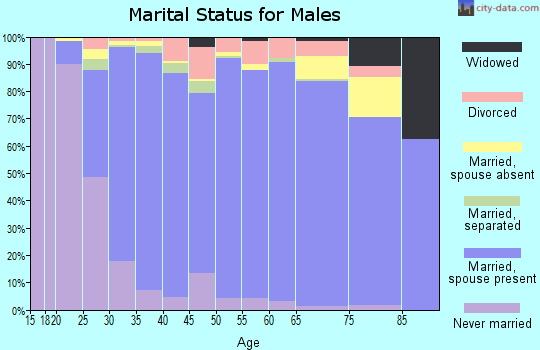
For population 15 years and over in 77584:
Never married: 28.6%Now married: 58.9%Separated: 1.0%Widowed: 4.0%Divorced: 7.5%
Zip code 77584 compared to state average:
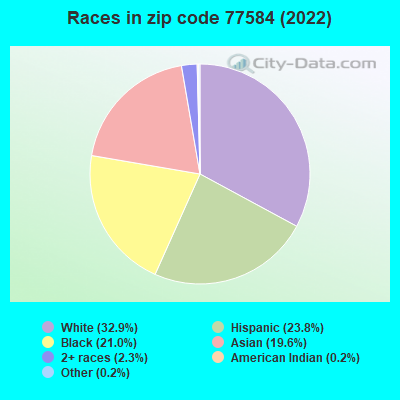
Median household income above state average. Black race population percentage above state average. Renting percentage below state average. Length of stay since moving in above state average. Number of rooms per house above state average. House age significantly below state average. Percentage of population with a bachelor's degree or higher above state average. 30,546 32.9% White 22,069 23.8% Hispanic or Latino 19,464 21.0% Black 18,212 19.6% Asian 2,114 2.3% Two or more races 210 0.2% American Indian 174 0.2% Some other race
Data:
Median household income ($)
Median household income (% change since 2000)
Household income diversity
Ratio of average income to average house value (%)
Ratio of average income to average rent
Median household income ($) - White
Median household income ($) - Black or African American
Median household income ($) - Asian
Median household income ($) - Hispanic or Latino
Median household income ($) - American Indian and Alaska Native
Median household income ($) - Multirace
Median household income ($) - Other Race
Median household income for houses/condos with a mortgage ($)
Median household income for apartments without a mortgage ($)
Races - White alone (%)
Races - White alone (% change since 2000)
Races - Black alone (%)
Races - Black alone (% change since 2000)
Races - American Indian alone (%)
Races - American Indian alone (% change since 2000)
Races - Asian alone (%)
Races - Asian alone (% change since 2000)
Races - Hispanic (%)
Races - Hispanic (% change since 2000)
Races - Native Hawaiian and Other Pacific Islander alone (%)
Races - Native Hawaiian and Other Pacific Islander alone (% change since 2000)
Races - Two or more races (%)
Races - Two or more races (% change since 2000)
Races - Other race alone (%)
Races - Other race alone (% change since 2000)
Racial diversity
Unemployment (%)
Unemployment (% change since 2000)
Unemployment (%) - White
Unemployment (%) - Black or African American
Unemployment (%) - Asian
Unemployment (%) - Hispanic or Latino
Unemployment (%) - American Indian and Alaska Native
Unemployment (%) - Multirace
Unemployment (%) - Other Race
Population density (people per square mile)
Population - Males (%)
Population - Females (%)
Population - Males (%) - White
Population - Males (%) - Black or African American
Population - Males (%) - Asian
Population - Males (%) - Hispanic or Latino
Population - Males (%) - American Indian and Alaska Native
Population - Males (%) - Multirace
Population - Males (%) - Other Race
Population - Females (%) - White
Population - Females (%) - Black or African American
Population - Females (%) - Asian
Population - Females (%) - Hispanic or Latino
Population - Females (%) - American Indian and Alaska Native
Population - Females (%) - Multirace
Population - Females (%) - Other Race
Coronavirus confirmed cases (Apr 27, 2024)
Deaths caused by coronavirus (Apr 27, 2024)
Coronavirus confirmed cases (per 100k population) (Apr 27, 2024)
Deaths caused by coronavirus (per 100k population) (Apr 27, 2024)
Daily increase in number of cases (Apr 27, 2024)
Weekly increase in number of cases (Apr 27, 2024)
Cases doubled (in days) (Apr 27, 2024)
Hospitalized patients (Apr 18, 2022)
Negative test results (Apr 18, 2022)
Total test results (Apr 18, 2022)
COVID Vaccine doses distributed (per 100k population) (Sep 19, 2023)
COVID Vaccine doses administered (per 100k population) (Sep 19, 2023)
COVID Vaccine doses distributed (Sep 19, 2023)
COVID Vaccine doses administered (Sep 19, 2023)
Likely homosexual households (%)
Likely homosexual households (% change since 2000)
Likely homosexual households - Lesbian couples (%)
Likely homosexual households - Lesbian couples (% change since 2000)
Likely homosexual households - Gay men (%)
Likely homosexual households - Gay men (% change since 2000)
Cost of living index
Median gross rent ($)
Median contract rent ($)
Median monthly housing costs ($)
Median house or condo value ($)
Median house or condo value ($ change since 2000)
Mean house or condo value by units in structure - 1, detached ($)
Mean house or condo value by units in structure - 1, attached ($)
Mean house or condo value by units in structure - 2 ($)
Mean house or condo value by units in structure by units in structure - 3 or 4 ($)
Mean house or condo value by units in structure - 5 or more ($)
Mean house or condo value by units in structure - Boat, RV, van, etc. ($)
Mean house or condo value by units in structure - Mobile home ($)
Median house or condo value ($) - White
Median house or condo value ($) - Black or African American
Median house or condo value ($) - Asian
Median house or condo value ($) - Hispanic or Latino
Median house or condo value ($) - American Indian and Alaska Native
Median house or condo value ($) - Multirace
Median house or condo value ($) - Other Race
Median resident age
Resident age diversity
Median resident age - Males
Median resident age - Females
Median resident age - White
Median resident age - Black or African American
Median resident age - Asian
Median resident age - Hispanic or Latino
Median resident age - American Indian and Alaska Native
Median resident age - Multirace
Median resident age - Other Race
Median resident age - Males - White
Median resident age - Males - Black or African American
Median resident age - Males - Asian
Median resident age - Males - Hispanic or Latino
Median resident age - Males - American Indian and Alaska Native
Median resident age - Males - Multirace
Median resident age - Males - Other Race
Median resident age - Females - White
Median resident age - Females - Black or African American
Median resident age - Females - Asian
Median resident age - Females - Hispanic or Latino
Median resident age - Females - American Indian and Alaska Native
Median resident age - Females - Multirace
Median resident age - Females - Other Race
Commute - mean travel time to work (minutes)
Travel time to work - Less than 5 minutes (%)
Travel time to work - Less than 5 minutes (% change since 2000)
Travel time to work - 5 to 9 minutes (%)
Travel time to work - 5 to 9 minutes (% change since 2000)
Travel time to work - 10 to 19 minutes (%)
Travel time to work - 10 to 19 minutes (% change since 2000)
Travel time to work - 20 to 29 minutes (%)
Travel time to work - 20 to 29 minutes (% change since 2000)
Travel time to work - 30 to 39 minutes (%)
Travel time to work - 30 to 39 minutes (% change since 2000)
Travel time to work - 40 to 59 minutes (%)
Travel time to work - 40 to 59 minutes (% change since 2000)
Travel time to work - 60 to 89 minutes (%)
Travel time to work - 60 to 89 minutes (% change since 2000)
Travel time to work - 90 or more minutes (%)
Travel time to work - 90 or more minutes (% change since 2000)
Marital status - Never married (%)
Marital status - Now married (%)
Marital status - Separated (%)
Marital status - Widowed (%)
Marital status - Divorced (%)
Median family income ($)
Median family income (% change since 2000)
Median non-family income ($)
Median non-family income (% change since 2000)
Median per capita income ($)
Median per capita income (% change since 2000)
Median family income ($) - White
Median family income ($) - Black or African American
Median family income ($) - Asian
Median family income ($) - Hispanic or Latino
Median family income ($) - American Indian and Alaska Native
Median family income ($) - Multirace
Median family income ($) - Other Race
Median year house/condo built
Median year apartment built
Year house built - Built 2005 or later (%)
Year house built - Built 2000 to 2004 (%)
Year house built - Built 1990 to 1999 (%)
Year house built - Built 1980 to 1989 (%)
Year house built - Built 1970 to 1979 (%)
Year house built - Built 1960 to 1969 (%)
Year house built - Built 1950 to 1959 (%)
Year house built - Built 1940 to 1949 (%)
Year house built - Built 1939 or earlier (%)
Average household size
Household density (households per square mile)
Average household size - White
Average household size - Black or African American
Average household size - Asian
Average household size - Hispanic or Latino
Average household size - American Indian and Alaska Native
Average household size - Multirace
Average household size - Other Race
Occupied housing units (%)
Vacant housing units (%)
Owner occupied housing units (%)
Renter occupied housing units (%)
Vacancy status - For rent (%)
Vacancy status - For sale only (%)
Vacancy status - Rented or sold, not occupied (%)
Vacancy status - For seasonal, recreational, or occasional use (%)
Vacancy status - For migrant workers (%)
Vacancy status - Other vacant (%)
Residents with income below the poverty level (%)
Residents with income below 50% of the poverty level (%)
Children below poverty level (%)
Poor families by family type - Married-couple family (%)
Poor families by family type - Male, no wife present (%)
Poor families by family type - Female, no husband present (%)
Poverty status for native-born residents (%)
Poverty status for foreign-born residents (%)
Poverty among high school graduates not in families (%)
Poverty among people who did not graduate high school not in families (%)
Residents with income below the poverty level (%) - White
Residents with income below the poverty level (%) - Black or African American
Residents with income below the poverty level (%) - Asian
Residents with income below the poverty level (%) - Hispanic or Latino
Residents with income below the poverty level (%) - American Indian and Alaska Native
Residents with income below the poverty level (%) - Multirace
Residents with income below the poverty level (%) - Other Race
Air pollution - Air Quality Index (AQI)
Air pollution - CO
Air pollution - NO2
Air pollution - SO2
Air pollution - Ozone
Air pollution - PM10
Air pollution - PM25
Air pollution - Pb
Crime - Murders per 100,000 population
Crime - Rapes per 100,000 population
Crime - Robberies per 100,000 population
Crime - Assaults per 100,000 population
Crime - Burglaries per 100,000 population
Crime - Thefts per 100,000 population
Crime - Auto thefts per 100,000 population
Crime - Arson per 100,000 population
Crime - City-data.com crime index
Crime - Violent crime index
Crime - Property crime index
Crime - Murders per 100,000 population (5 year average)
Crime - Rapes per 100,000 population (5 year average)
Crime - Robberies per 100,000 population (5 year average)
Crime - Assaults per 100,000 population (5 year average)
Crime - Burglaries per 100,000 population (5 year average)
Crime - Thefts per 100,000 population (5 year average)
Crime - Auto thefts per 100,000 population (5 year average)
Crime - Arson per 100,000 population (5 year average)
Crime - City-data.com crime index (5 year average)
Crime - Violent crime index (5 year average)
Crime - Property crime index (5 year average)
1996 Presidential Elections Results (%) - Democratic Party (Clinton)
1996 Presidential Elections Results (%) - Republican Party (Dole)
1996 Presidential Elections Results (%) - Other
2000 Presidential Elections Results (%) - Democratic Party (Gore)
2000 Presidential Elections Results (%) - Republican Party (Bush)
2000 Presidential Elections Results (%) - Other
2004 Presidential Elections Results (%) - Democratic Party (Kerry)
2004 Presidential Elections Results (%) - Republican Party (Bush)
2004 Presidential Elections Results (%) - Other
2008 Presidential Elections Results (%) - Democratic Party (Obama)
2008 Presidential Elections Results (%) - Republican Party (McCain)
2008 Presidential Elections Results (%) - Other
2012 Presidential Elections Results (%) - Democratic Party (Obama)
2012 Presidential Elections Results (%) - Republican Party (Romney)
2012 Presidential Elections Results (%) - Other
2016 Presidential Elections Results (%) - Democratic Party (Clinton)
2016 Presidential Elections Results (%) - Republican Party (Trump)
2016 Presidential Elections Results (%) - Other
2020 Presidential Elections Results (%) - Democratic Party (Biden)
2020 Presidential Elections Results (%) - Republican Party (Trump)
2020 Presidential Elections Results (%) - Other
Ancestries Reported - Arab (%)
Ancestries Reported - Czech (%)
Ancestries Reported - Danish (%)
Ancestries Reported - Dutch (%)
Ancestries Reported - English (%)
Ancestries Reported - French (%)
Ancestries Reported - French Canadian (%)
Ancestries Reported - German (%)
Ancestries Reported - Greek (%)
Ancestries Reported - Hungarian (%)
Ancestries Reported - Irish (%)
Ancestries Reported - Italian (%)
Ancestries Reported - Lithuanian (%)
Ancestries Reported - Norwegian (%)
Ancestries Reported - Polish (%)
Ancestries Reported - Portuguese (%)
Ancestries Reported - Russian (%)
Ancestries Reported - Scotch-Irish (%)
Ancestries Reported - Scottish (%)
Ancestries Reported - Slovak (%)
Ancestries Reported - Subsaharan African (%)
Ancestries Reported - Swedish (%)
Ancestries Reported - Swiss (%)
Ancestries Reported - Ukrainian (%)
Ancestries Reported - United States (%)
Ancestries Reported - Welsh (%)
Ancestries Reported - West Indian (%)
Ancestries Reported - Other (%)
Educational Attainment - No schooling completed (%)
Educational Attainment - Less than high school (%)
Educational Attainment - High school or equivalent (%)
Educational Attainment - Less than 1 year of college (%)
Educational Attainment - 1 or more years of college (%)
Educational Attainment - Associate degree (%)
Educational Attainment - Bachelor's degree (%)
Educational Attainment - Master's degree (%)
Educational Attainment - Professional school degree (%)
Educational Attainment - Doctorate degree (%)
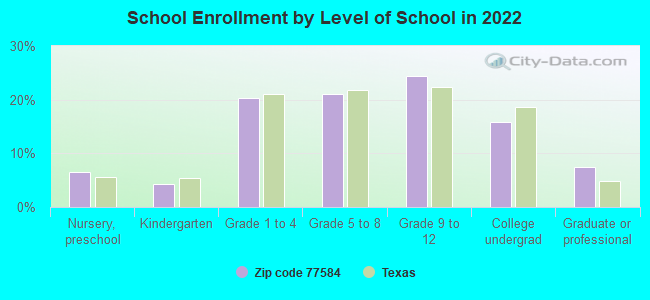
School Enrollment - Nursery, preschool (%)
School Enrollment - Kindergarten (%)
School Enrollment - Grade 1 to 4 (%)
School Enrollment - Grade 5 to 8 (%)
School Enrollment - Grade 9 to 12 (%)
School Enrollment - College undergrad (%)
School Enrollment - Graduate or professional (%)
School Enrollment - Not enrolled in school (%)
School enrollment - Public schools (%)
School enrollment - Private schools (%)
School enrollment - Not enrolled (%)
Median number of rooms in houses and condos
Median number of rooms in apartments
Housing units lacking complete plumbing facilities (%)
Housing units lacking complete kitchen facilities (%)
Density of houses
Urban houses (%)
Rural houses (%)
Households with people 60 years and over (%)
Households with people 65 years and over (%)
Households with people 75 years and over (%)
Households with one or more nonrelatives (%)
Households with no nonrelatives (%)
Population in households (%)
Family households (%)
Nonfamily households (%)
Population in families (%)
Family households with own children (%)
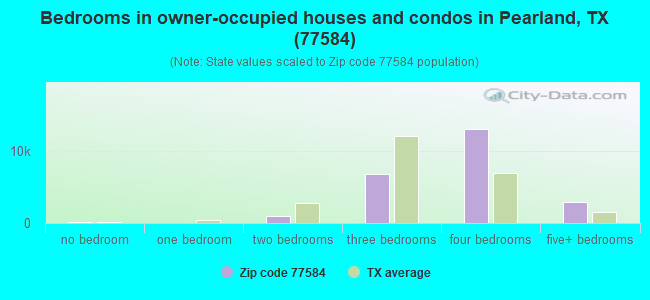
Median number of bedrooms in owner occupied houses
Mean number of bedrooms in owner occupied houses
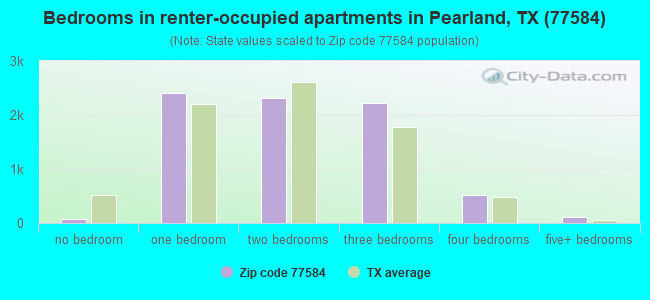
Median number of bedrooms in renter occupied houses
Mean number of bedrooms in renter occupied houses
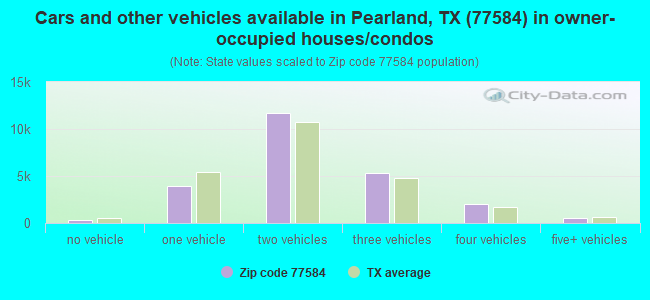
Median number of vehichles in owner occupied houses
Mean number of vehichles in owner occupied houses
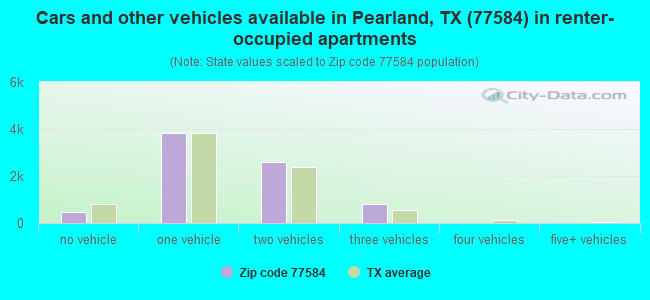
Median number of vehichles in renter occupied houses
Mean number of vehichles in renter occupied houses
Mortgage status - with mortgage (%)
Mortgage status - with second mortgage (%)
Mortgage status - with home equity loan (%)
Mortgage status - with both second mortgage and home equity loan (%)
Mortgage status - without a mortgage (%)
Average family size
Average family size - White
Average family size - Black or African American
Average family size - Asian
Average family size - Hispanic or Latino
Average family size - American Indian and Alaska Native
Average family size - Multirace
Average family size - Other Race
Geographical mobility - Same house 1 year ago (%)
Geographical mobility - Moved within same county (%)
Geographical mobility - Moved from different county within same state (%)
Geographical mobility - Moved from different state (%)
Geographical mobility - Moved from abroad (%)
Place of birth - Born in state of residence (%)
Place of birth - Born in other state (%)
Place of birth - Native, outside of US (%)
Place of birth - Foreign born (%)
Housing units in structures - 1, detached (%)
Housing units in structures - 1, attached (%)
Housing units in structures - 2 (%)
Housing units in structures - 3 or 4 (%)
Housing units in structures - 5 to 9 (%)
Housing units in structures - 10 to 19 (%)
Housing units in structures - 20 to 49 (%)
Housing units in structures - 50 or more (%)
Housing units in structures - Mobile home (%)
Housing units in structures - Boat, RV, van, etc. (%)
House/condo owner moved in on average (years ago)
Renter moved in on average (years ago)
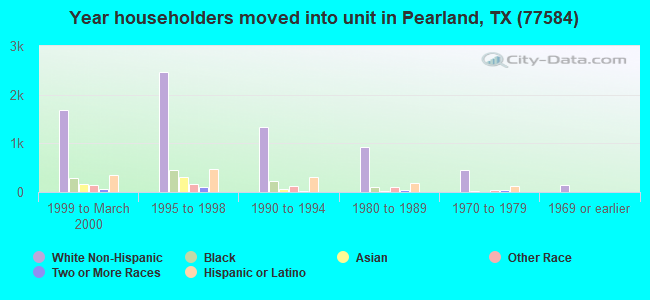
Year householder moved into unit - Moved in 1999 to March 2000 (%)
Year householder moved into unit - Moved in 1995 to 1998 (%)
Year householder moved into unit - Moved in 1990 to 1994 (%)
Year householder moved into unit - Moved in 1980 to 1989 (%)
Year householder moved into unit - Moved in 1970 to 1979 (%)
Year householder moved into unit - Moved in 1969 or earlier (%)
Means of transportation to work - Drove car alone (%)
Means of transportation to work - Carpooled (%)
Means of transportation to work - Public transportation (%)
Means of transportation to work - Bus or trolley bus (%)
Means of transportation to work - Streetcar or trolley car (%)
Means of transportation to work - Subway or elevated (%)
Means of transportation to work - Railroad (%)
Means of transportation to work - Ferryboat (%)
Means of transportation to work - Taxicab (%)
Means of transportation to work - Motorcycle (%)
Means of transportation to work - Bicycle (%)
Means of transportation to work - Walked (%)
Means of transportation to work - Other means (%)
Working at home (%)
Industry diversity
Most Common Industries - Agriculture, forestry, fishing and hunting, and mining (%)
Most Common Industries - Agriculture, forestry, fishing and hunting (%)
Most Common Industries - Mining, quarrying, and oil and gas extraction (%)
Most Common Industries - Construction (%)
Most Common Industries - Manufacturing (%)
Most Common Industries - Wholesale trade (%)
Most Common Industries - Retail trade (%)
Most Common Industries - Transportation and warehousing, and utilities (%)
Most Common Industries - Transportation and warehousing (%)
Most Common Industries - Utilities (%)
Most Common Industries - Information (%)
Most Common Industries - Finance and insurance, and real estate and rental and leasing (%)
Most Common Industries - Finance and insurance (%)
Most Common Industries - Real estate and rental and leasing (%)
Most Common Industries - Professional, scientific, and management, and administrative and waste management services (%)
Most Common Industries - Professional, scientific, and technical services (%)
Most Common Industries - Management of companies and enterprises (%)
Most Common Industries - Administrative and support and waste management services (%)
Most Common Industries - Educational services, and health care and social assistance (%)
Most Common Industries - Educational services (%)
Most Common Industries - Health care and social assistance (%)
Most Common Industries - Arts, entertainment, and recreation, and accommodation and food services (%)
Most Common Industries - Arts, entertainment, and recreation (%)
Most Common Industries - Accommodation and food services (%)
Most Common Industries - Other services, except public administration (%)
Most Common Industries - Public administration (%)
Occupation diversity
Most Common Occupations - Management, business, science, and arts occupations (%)
Most Common Occupations - Management, business, and financial occupations (%)
Most Common Occupations - Management occupations (%)
Most Common Occupations - Business and financial operations occupations (%)
Most Common Occupations - Computer, engineering, and science occupations (%)
Most Common Occupations - Computer and mathematical occupations (%)
Most Common Occupations - Architecture and engineering occupations (%)
Most Common Occupations - Life, physical, and social science occupations (%)
Most Common Occupations - Education, legal, community service, arts, and media occupations (%)
Most Common Occupations - Community and social service occupations (%)
Most Common Occupations - Legal occupations (%)
Most Common Occupations - Education, training, and library occupations (%)
Most Common Occupations - Arts, design, entertainment, sports, and media occupations (%)
Most Common Occupations - Healthcare practitioners and technical occupations (%)
Most Common Occupations - Health diagnosing and treating practitioners and other technical occupations (%)
Most Common Occupations - Health technologists and technicians (%)
Most Common Occupations - Service occupations (%)
Most Common Occupations - Healthcare support occupations (%)
Most Common Occupations - Protective service occupations (%)
Most Common Occupations - Fire fighting and prevention, and other protective service workers including supervisors (%)
Most Common Occupations - Law enforcement workers including supervisors (%)
Most Common Occupations - Food preparation and serving related occupations (%)
Most Common Occupations - Building and grounds cleaning and maintenance occupations (%)
Most Common Occupations - Personal care and service occupations (%)
Most Common Occupations - Sales and office occupations (%)
Most Common Occupations - Sales and related occupations (%)
Most Common Occupations - Office and administrative support occupations (%)
Most Common Occupations - Natural resources, construction, and maintenance occupations (%)
Most Common Occupations - Farming, fishing, and forestry occupations (%)
Most Common Occupations - Construction and extraction occupations (%)
Most Common Occupations - Installation, maintenance, and repair occupations (%)
Most Common Occupations - Production, transportation, and material moving occupations (%)
Most Common Occupations - Production occupations (%)
Most Common Occupations - Transportation occupations (%)
Most Common Occupations - Material moving occupations (%)
People in Group quarters - Institutionalized population (%)
People in Group quarters - Correctional institutions (%)
People in Group quarters - Federal prisons and detention centers (%)
People in Group quarters - Halfway houses (%)
People in Group quarters - Local jails and other confinement facilities (including police lockups) (%)
People in Group quarters - Military disciplinary barracks (%)
People in Group quarters - State prisons (%)
People in Group quarters - Other types of correctional institutions (%)
People in Group quarters - Nursing homes (%)
People in Group quarters - Hospitals/wards, hospices, and schools for the handicapped (%)
People in Group quarters - Hospitals/wards and hospices for chronically ill (%)
People in Group quarters - Hospices or homes for chronically ill (%)
People in Group quarters - Military hospitals or wards for chronically ill (%)
People in Group quarters - Other hospitals or wards for chronically ill (%)
People in Group quarters - Hospitals or wards for drug/alcohol abuse (%)
People in Group quarters - Mental (Psychiatric) hospitals or wards (%)
People in Group quarters - Schools, hospitals, or wards for the mentally retarded (%)
People in Group quarters - Schools, hospitals, or wards for the physically handicapped (%)
People in Group quarters - Institutions for the deaf (%)
People in Group quarters - Institutions for the blind (%)
People in Group quarters - Orthopedic wards and institutions for the physically handicapped (%)
People in Group quarters - Wards in general hospitals for patients who have no usual home elsewhere (%)
People in Group quarters - Wards in military hospitals for patients who have no usual home elsewhere (%)
People in Group quarters - Juvenile institutions (%)
People in Group quarters - Long-term care (%)
People in Group quarters - Homes for abused, dependent, and neglected children (%)
People in Group quarters - Residential treatment centers for emotionally disturbed children (%)
People in Group quarters - Training schools for juvenile delinquents (%)
People in Group quarters - Short-term care, detention or diagnostic centers for delinquent children (%)
People in Group quarters - Type of juvenile institution unknown (%)
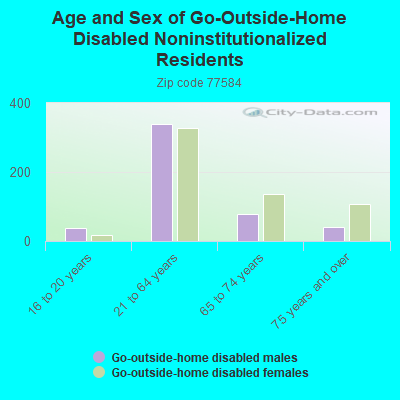
People in Group quarters - Noninstitutionalized population (%)
People in Group quarters - College dormitories (includes college quarters off campus) (%)
People in Group quarters - Military quarters (%)
People in Group quarters - On base (%)
People in Group quarters - Barracks, unaccompanied personnel housing (UPH), (Enlisted/Officer), ;and similar group living quarters for military personnel (%)
People in Group quarters - Transient quarters for temporary residents (%)
People in Group quarters - Military ships (%)
People in Group quarters - Group homes (%)
People in Group quarters - Homes or halfway houses for drug/alcohol abuse (%)
People in Group quarters - Homes for the mentally ill (%)
People in Group quarters - Homes for the mentally retarded (%)
People in Group quarters - Homes for the physically handicapped (%)
People in Group quarters - Other group homes (%)
People in Group quarters - Religious group quarters (%)
People in Group quarters - Dormitories (%)
People in Group quarters - Agriculture workers' dormitories on farms (%)
People in Group quarters - Job Corps and vocational training facilities (%)
People in Group quarters - Other workers' dormitories (%)
People in Group quarters - Crews of maritime vessels (%)
People in Group quarters - Other nonhousehold living situations (%)
People in Group quarters - Other noninstitutional group quarters (%)
Residents speaking English at home (%)
Residents speaking English at home - Born in the United States (%)
Residents speaking English at home - Native, born elsewhere (%)
Residents speaking English at home - Foreign born (%)
Residents speaking Spanish at home (%)
Residents speaking Spanish at home - Born in the United States (%)
Residents speaking Spanish at home - Native, born elsewhere (%)
Residents speaking Spanish at home - Foreign born (%)
Residents speaking other language at home (%)
Residents speaking other language at home - Born in the United States (%)
Residents speaking other language at home - Native, born elsewhere (%)
Residents speaking other language at home - Foreign born (%)
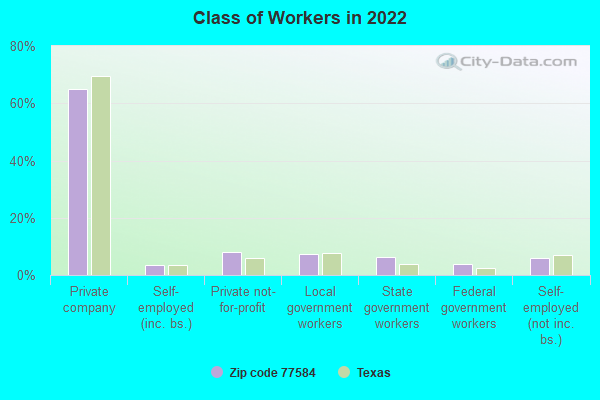
Class of Workers - Employee of private company (%)
Class of Workers - Self-employed in own incorporated business (%)
Class of Workers - Private not-for-profit wage and salary workers (%)
Class of Workers - Local government workers (%)
Class of Workers - State government workers (%)
Class of Workers - Federal government workers (%)
Class of Workers - Self-employed workers in own not incorporated business and Unpaid family workers (%)
House heating fuel used in houses and condos - Utility gas (%)
House heating fuel used in houses and condos - Bottled, tank, or LP gas (%)
House heating fuel used in houses and condos - Electricity (%)
House heating fuel used in houses and condos - Fuel oil, kerosene, etc. (%)
House heating fuel used in houses and condos - Coal or coke (%)
House heating fuel used in houses and condos - Wood (%)
House heating fuel used in houses and condos - Solar energy (%)
House heating fuel used in houses and condos - Other fuel (%)
House heating fuel used in houses and condos - No fuel used (%)
House heating fuel used in apartments - Utility gas (%)
House heating fuel used in apartments - Bottled, tank, or LP gas (%)
House heating fuel used in apartments - Electricity (%)
House heating fuel used in apartments - Fuel oil, kerosene, etc. (%)
House heating fuel used in apartments - Coal or coke (%)
House heating fuel used in apartments - Wood (%)
House heating fuel used in apartments - Solar energy (%)
House heating fuel used in apartments - Other fuel (%)
House heating fuel used in apartments - No fuel used (%)
Armed forces status - In Armed Forces (%)
Armed forces status - Civilian (%)
Armed forces status - Civilian - Veteran (%)
Armed forces status - Civilian - Nonveteran (%)
Fatal accidents locations in years 2005-2021
Fatal accidents locations in 2005
Fatal accidents locations in 2006
Fatal accidents locations in 2007
Fatal accidents locations in 2008
Fatal accidents locations in 2009
Fatal accidents locations in 2010
Fatal accidents locations in 2011
Fatal accidents locations in 2012
Fatal accidents locations in 2013
Fatal accidents locations in 2014
Fatal accidents locations in 2015
Fatal accidents locations in 2016
Fatal accidents locations in 2017
Fatal accidents locations in 2018
Fatal accidents locations in 2019
Fatal accidents locations in 2020
Fatal accidents locations in 2021
Alcohol use - People drinking some alcohol every month (%)
Alcohol use - People not drinking at all (%)
Alcohol use - Average days/month drinking alcohol
Alcohol use - Average drinks/week
Alcohol use - Average days/year people drink much
Audiometry - Average condition of hearing (%)
Audiometry - People that can hear a whisper from across a quiet room (%)
Audiometry - People that can hear normal voice from across a quiet room (%)
Audiometry - Ears ringing, roaring, buzzing (%)
Audiometry - Had a job exposure to loud noise (%)
Audiometry - Had off-work exposure to loud noise (%)
Blood Pressure & Cholesterol - Has high blood pressure (%)
Blood Pressure & Cholesterol - Checking blood pressure at home (%)
Blood Pressure & Cholesterol - Frequently checking blood cholesterol (%)
Blood Pressure & Cholesterol - Has high cholesterol level (%)
Consumer Behavior - Money monthly spent on food at supermarket/grocery store
Consumer Behavior - Money monthly spent on food at other stores
Consumer Behavior - Money monthly spent on eating out
Consumer Behavior - Money monthly spent on carryout/delivered foods
Consumer Behavior - Income spent on food at supermarket/grocery store (%)
Consumer Behavior - Income spent on food at other stores (%)
Consumer Behavior - Income spent on eating out (%)
Consumer Behavior - Income spent on carryout/delivered foods (%)
Current Health Status - General health condition (%)
Current Health Status - Blood donors (%)
Current Health Status - Has blood ever tested for HIV virus (%)
Current Health Status - Left-handed people (%)
Dermatology - People using sunscreen (%)
Diabetes - Diabetics (%)
Diabetes - Had a blood test for high blood sugar (%)
Diabetes - People taking insulin (%)
Diet Behavior & Nutrition - Diet health (%)
Diet Behavior & Nutrition - Milk product consumption (# of products/month)
Diet Behavior & Nutrition - Meals not home prepared (#/week)
Diet Behavior & Nutrition - Meals from fast food or pizza place (#/week)
Diet Behavior & Nutrition - Ready-to-eat foods (#/month)
Diet Behavior & Nutrition - Frozen meals/pizza (#/month)
Drug Use - People that ever used marijuana or hashish (%)
Drug Use - Ever used hard drugs (%)
Drug Use - Ever used any form of cocaine (%)
Drug Use - Ever used heroin (%)
Drug Use - Ever used methamphetamine (%)
Health Insurance - People covered by health insurance (%)
Kidney Conditions-Urology - Avg. # of times urinating at night
Medical Conditions - People with asthma (%)
Medical Conditions - People with anemia (%)
Medical Conditions - People with psoriasis (%)
Medical Conditions - People with overweight (%)
Medical Conditions - Elderly people having difficulties in thinking or remembering (%)
Medical Conditions - People who ever received blood transfusion (%)
Medical Conditions - People having trouble seeing even with glass/contacts (%)
Medical Conditions - People with arthritis (%)
Medical Conditions - People with gout (%)
Medical Conditions - People with congestive heart failure (%)
Medical Conditions - People with coronary heart disease (%)
Medical Conditions - People with angina pectoris (%)
Medical Conditions - People who ever had heart attack (%)
Medical Conditions - People who ever had stroke (%)
Medical Conditions - People with emphysema (%)
Medical Conditions - People with thyroid problem (%)
Medical Conditions - People with chronic bronchitis (%)
Medical Conditions - People with any liver condition (%)
Medical Conditions - People who ever had cancer or malignancy (%)
Mental Health - People who have little interest in doing things (%)
Mental Health - People feeling down, depressed, or hopeless (%)
Mental Health - People who have trouble sleeping or sleeping too much (%)
Mental Health - People feeling tired or having little energy (%)
Mental Health - People with poor appetite or overeating (%)
Mental Health - People feeling bad about themself (%)
Mental Health - People who have trouble concentrating on things (%)
Mental Health - People moving or speaking slowly or too fast (%)
Mental Health - People having thoughts they would be better off dead (%)
Oral Health - Average years since last visit a dentist
Oral Health - People embarrassed because of mouth (%)
Oral Health - People with gum disease (%)
Oral Health - General health of teeth and gums (%)
Oral Health - Average days a week using dental floss/device
Oral Health - Average days a week using mouthwash for dental problem
Oral Health - Average number of teeth
Pesticide Use - Households using pesticides to control insects (%)
Pesticide Use - Households using pesticides to kill weeds (%)
Physical Activity - People doing vigorous-intensity work activities (%)
Physical Activity - People doing moderate-intensity work activities (%)
Physical Activity - People walking or bicycling (%)
Physical Activity - People doing vigorous-intensity recreational activities (%)
Physical Activity - People doing moderate-intensity recreational activities (%)
Physical Activity - Average hours a day doing sedentary activities
Physical Activity - Average hours a day watching TV or videos
Physical Activity - Average hours a day using computer
Physical Functioning - People having limitations keeping them from working (%)
Physical Functioning - People limited in amount of work they can do (%)
Physical Functioning - People that need special equipment to walk (%)
Physical Functioning - People experiencing confusion/memory problems (%)
Physical Functioning - People requiring special healthcare equipment (%)
Prescription Medications - Average number of prescription medicines taking
Preventive Aspirin Use - Adults 40+ taking low-dose aspirin (%)
Reproductive Health - Vaginal deliveries (%)
Reproductive Health - Cesarean deliveries (%)
Reproductive Health - Deliveries resulted in a live birth (%)
Reproductive Health - Pregnancies resulted in a delivery (%)
Reproductive Health - Women breastfeeding newborns (%)
Reproductive Health - Women that had a hysterectomy (%)
Reproductive Health - Women that had both ovaries removed (%)
Reproductive Health - Women that have ever taken birth control pills (%)
Reproductive Health - Women taking birth control pills (%)
Reproductive Health - Women that have ever used Depo-Provera or injectables (%)
Reproductive Health - Women that have ever used female hormones (%)
Sexual Behavior - People 18+ that ever had sex (vaginal, anal, or oral) (%)
Sexual Behavior - Males 18+ that ever had vaginal sex with a woman (%)
Sexual Behavior - Males 18+ that ever performed oral sex on a woman (%)
Sexual Behavior - Males 18+ that ever had anal sex with a woman (%)
Sexual Behavior - Males 18+ that ever had any sex with a man (%)
Sexual Behavior - Females 18+ that ever had vaginal sex with a man (%)
Sexual Behavior - Females 18+ that ever performed oral sex on a man (%)
Sexual Behavior - Females 18+ that ever had anal sex with a man (%)
Sexual Behavior - Females 18+ that ever had any kind of sex with a woman (%)
Sexual Behavior - Average age people first had sex
Sexual Behavior - Average number of female sex partners in lifetime (males 18+)
Sexual Behavior - Average number of female vaginal sex partners in lifetime (males 18+)
Sexual Behavior - Average age people first performed oral sex on a woman (18+)
Sexual Behavior - Average number of woman performed oral sex on in lifetime (18+)
Sexual Behavior - Average number of male sex partners in lifetime (males 18+)
Sexual Behavior - Average number of male anal sex partners in lifetime (males 18+)
Sexual Behavior - Average age people first performed oral sex on a man (18+)
Sexual Behavior - Average number of male oral sex partners in lifetime (18+)
Sexual Behavior - People using protection when performing oral sex (%)
Sexual Behavior - Average number of times people have vaginal or anal sex a year
Sexual Behavior - People having sex without condom (%)
Sexual Behavior - Average number of male sex partners in lifetime (females 18+)
Sexual Behavior - Average number of male vaginal sex partners in lifetime (females 18+)
Sexual Behavior - Average number of female sex partners in lifetime (females 18+)
Sexual Behavior - Circumcised males 18+ (%)
Sleep Disorders - Average hours sleeping at night
Sleep Disorders - People that has trouble sleeping (%)
Smoking-Cigarette Use - People smoking cigarettes (%)
Taste & Smell - People 40+ having problems with smell (%)
Taste & Smell - People 40+ having problems with taste (%)
Taste & Smell - People 40+ that ever had wisdom teeth removed (%)
Taste & Smell - People 40+ that ever had tonsils teeth removed (%)
Taste & Smell - People 40+ that ever had a loss of consciousness because of a head injury (%)
Taste & Smell - People 40+ that ever had a broken nose or other serious injury to face or skull (%)
Taste & Smell - People 40+ that ever had two or more sinus infections (%)
Weight - Average height (inches)
Weight - Average weight (pounds)
Weight - Average BMI
Weight - People that are obese (%)
Weight - People that ever were obese (%)
Weight - People trying to lose weight (%)
Urban population: 91,992
Rural population: 800
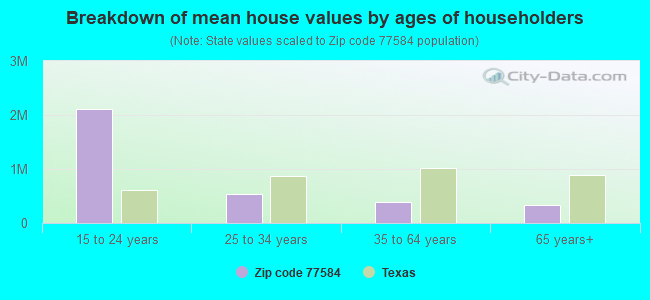
Estimated median house/condo value in 2022: $375,724
77584:
$375,724Texas:
$275,400
According to our research of Texas and other state lists, there were 39 registered sex offenders living in 77584 zip code as of April 27, 2024 . The ratio of all residents to sex offenders in zip code 77584 is 2,177 to 1.The ratio of registered sex offenders to all residents in this zip code is much lower than the state average.
Median resident age: This zip code:
36.4 yearsTexas median age:
35.6 years
Average household size: This zip code:
2.9 peopleTexas:
2.6 people
Averages for the 2020 tax year for zip code 77584, filed in 2021:
Average Adjusted Gross Income (AGI) in 2020: $94,199 (Individual Income Tax Returns) Here:
$94,199State:
$77,054
Salary/wage: $89,412 (reported on 86.1% of returns )Here:
$89,412State:
$62,766
(% of AGI for various income ranges: 1209.6% for AGIs below $25k , 3685.0% for AGIs $25k-50k , 6574.9% for AGIs $50k-75k , 9799.7% for AGIs $75k-100k , 18947.5% for AGIs $100k-200k , 62671.2% for AGIs over 200k ) Taxable interest for individuals: $1,577 (reported on 28.0% of returns )This zip code:
$1,577Texas:
$2,665
(% of AGI for various income ranges: 11.6% for AGIs below $25k , 16.6% for AGIs $25k-50k , 26.2% for AGIs $50k-75k , 41.2% for AGIs $75k-100k , 70.4% for AGIs $100k-200k , 547.9% for AGIs over 200k ) Ordinary dividends: $4,177 (reported on 20.5% of returns )(% of AGI for various income ranges: 15.8% for AGIs below $25k , 30.3% for AGIs $25k-50k , 48.2% for AGIs $50k-75k , 75.5% for AGIs $75k-100k , 123.6% for AGIs $100k-200k , 1158.6% for AGIs over 200k ) Net capital gain/loss in AGI: +$14,932 (reported on 19.7% of returns )Here:
+$14,932State:
+$39,590
(% of AGI for various income ranges: 14.7% for AGIs below $25k , 38.4% for AGIs $25k-50k , 60.7% for AGIs $50k-75k , 102.5% for AGIs $75k-100k , 319.5% for AGIs $100k-200k , 5325.2% for AGIs over 200k ) Profit/loss from business: +$5,562 (reported on 23.7% of returns )Here:
+$5,562State:
+$10,888
(% of AGI for various income ranges: 50.6% for AGIs below $25k , 20.2% for AGIs $25k-50k , 80.9% for AGIs $50k-75k , 101.6% for AGIs $75k-100k , 242.7% for AGIs $100k-200k , 1583.1% for AGIs over 200k ) Taxable individual retirement arrangement distribution: $24,048 (reported on 7.0% of returns )77584:
$24,048Texas:
$24,740
(% of AGI for various income ranges: 38.6% for AGIs below $25k , 83.7% for AGIs $25k-50k , 153.4% for AGIs $50k-75k , 261.3% for AGIs $75k-100k , 447.3% for AGIs $100k-200k , 1053.0% for AGIs over 200k ) Self-employed (Keogh) retirement plans: $23,647 (reported on 0.5% of returns )77584:
$23,647Texas:
$29,298
(% of AGI for various income ranges: 7.5% for AGIs $50k-75k , 13.3% for AGIs $100k-200k , 199.5% for AGIs over 200k ) Total itemized deductions: $31,983 (reported on 14.4% of returns )Here:
$31,983State:
$40,428
(% of AGI for various income ranges: 53.9% for AGIs below $25k , 220.1% for AGIs $25k-50k , 536.6% for AGIs $50k-75k , 748.9% for AGIs $75k-100k , 1142.9% for AGIs $100k-200k , 3110.8% for AGIs over 200k ) Charity contributions: $12,386 (reported on 12.2% of returns )Here:
$12,386State:
$18,201
(% of AGI for various income ranges: 6.0% for AGIs below $25k , 46.4% for AGIs $25k-50k , 126.4% for AGIs $50k-75k , 175.5% for AGIs $75k-100k , 379.2% for AGIs $100k-200k , 1417.7% for AGIs over 200k ) Taxes paid: $8,336 (reported on 13.9% of returns )(% of AGI for various income ranges: 12.1% for AGIs below $25k , 48.9% for AGIs $25k-50k , 137.2% for AGIs $50k-75k , 201.3% for AGIs $75k-100k , 307.7% for AGIs $100k-200k , 715.7% for AGIs over 200k ) Earned income credit: $2,356 (reported on 12.1% of returns )(% of AGI for various income ranges: 92.4% for AGIs below $25k , 75.5% for AGIs $25k-50k , 1.1% for AGIs $50k-75k ) Percentage of individuals using paid preparers for their 2020 taxes: 91.4%(% for various income ranges: 90.2% for AGIs below $25k , 92.9% for AGIs $25k-50k , 92.2% for AGIs $50k-75k , 91.3% for AGIs $75k-100k , 91.2% for AGIs $100k-200k , 91.1% for AGIs over 200k )
Averages for the 2012 tax year for zip code 77584, filed in 2013:
Average Adjusted Gross Income (AGI) in 2012: $87,429 (Individual Income Tax Returns) Here:
$87,429State:
$65,384
Salary/wage: $82,658 (reported on 89.5% of returns )Here:
$82,658State:
$52,524
(% of AGI for various income ranges: 81.0% for AGIs below $25k , 86.4% for AGIs $25k-50k , 86.6% for AGIs $50k-75k , 88.4% for AGIs $75k-100k , 89.9% for AGIs $100k-200k , 75.7% for AGIs over 200k ) Taxable interest for individuals: $898 (reported on 34.5% of returns )This zip code:
$898Texas:
$2,372
(% of AGI for various income ranges: 1.0% for AGIs below $25k , 0.4% for AGIs $25k-50k , 0.4% for AGIs $50k-75k , 0.3% for AGIs $75k-100k , 0.3% for AGIs $100k-200k , 0.4% for AGIs over 200k ) Ordinary dividends: $3,784 (reported on 19.9% of returns )(% of AGI for various income ranges: 2.1% for AGIs below $25k , 0.7% for AGIs $25k-50k , 0.7% for AGIs $50k-75k , 0.6% for AGIs $75k-100k , 0.4% for AGIs $100k-200k , 1.5% for AGIs over 200k ) Net capital gain/loss in AGI: +$7,392 (reported on 16.4% of returns )Here:
+$7,392State:
+$35,319
(% of AGI for various income ranges: 0.2% for AGIs below $25k , 0.2% for AGIs $25k-50k , 0.4% for AGIs $50k-75k , 0.3% for AGIs $75k-100k , 0.4% for AGIs $100k-200k , 3.8% for AGIs over 200k ) Profit/loss from business: +$11,807 (reported on 19.8% of returns )Here:
+$11,807State:
+$13,732
(% of AGI for various income ranges: 8.8% for AGIs below $25k , 2.7% for AGIs $25k-50k , 2.0% for AGIs $50k-75k , 1.9% for AGIs $75k-100k , 2.1% for AGIs $100k-200k , 3.3% for AGIs over 200k ) Taxable individual retirement arrangement distribution: $18,883 (reported on 7.5% of returns )77584:
$18,883Texas:
$19,511
(% of AGI for various income ranges: 2.7% for AGIs below $25k , 1.8% for AGIs $25k-50k , 2.1% for AGIs $50k-75k , 1.8% for AGIs $75k-100k , 1.5% for AGIs $100k-200k , 1.3% for AGIs over 200k ) Self-employment retirement plans: $20,632 (reported on 0.7% of returns )77584:
$20,632Texas:
$23,938
(% of AGI for various income ranges: 0.1% for AGIs $50k-75k , 0.1% for AGIs $100k-200k , 0.4% for AGIs over 200k ) Total itemized deductions: $22,413 (17% of AGI, reported on 46.6% of returns )Here:
$22,413State:
$24,724
Here:
16.8% of AGIState:
15.9% of AGI
(% of AGI for various income ranges: 10.6% for AGIs below $25k , 12.3% for AGIs $25k-50k , 14.8% for AGIs $50k-75k , 14.9% for AGIs $75k-100k , 13.3% for AGIs $100k-200k , 8.0% for AGIs over 200k ) Charity contributions: $4,967 (reported on 38.5% of returns )(% of AGI for various income ranges: 1.0% for AGIs below $25k , 1.7% for AGIs $25k-50k , 2.1% for AGIs $50k-75k , 2.2% for AGIs $75k-100k , 2.4% for AGIs $100k-200k , 2.1% for AGIs over 200k ) Taxes paid: $7,569 (reported on 45.9% of returns )(% of AGI for various income ranges: 2.6% for AGIs below $25k , 3.3% for AGIs $25k-50k , 4.5% for AGIs $50k-75k , 4.8% for AGIs $75k-100k , 4.6% for AGIs $100k-200k , 3.0% for AGIs over 200k ) Earned income credit: $2,242 (reported on 11.4% of returns )(% of AGI for various income ranges: 6.5% for AGIs below $25k , 1.0% for AGIs $25k-50k ) Percentage of individuals using paid preparers for their 2012 taxes: 44.9%(% for various income ranges: 44.0% for AGIs below $25k , 46.5% for AGIs $25k-50k , 45.6% for AGIs $50k-75k , 42.9% for AGIs $75k-100k , 42.4% for AGIs $100k-200k , 54.3% for AGIs over 200k )
Averages for the 2004 tax year for zip code 77584, filed in 2005:
Average Adjusted Gross Income (AGI) in 2004: $71,030 (Individual Income Tax Returns) Here:
$71,030State:
$47,881
Salary/wage: $69,469 (reported on 90.0% of returns )Here:
$69,469State:
$41,947
(% of AGI for various income ranges: 144.7% for AGIs below $10k , 79.3% for AGIs $10k-25k , 87.2% for AGIs $25k-50k , 89.2% for AGIs $50k-75k , 91.4% for AGIs $75k-100k , 86.7% for AGIs over 100k ) Taxable interest for individuals: $1,008 (reported on 49.2% of returns )This zip code:
$1,008Texas:
$2,255
(% of AGI for various income ranges: 5.1% for AGIs below $10k , 1.8% for AGIs $10k-25k , 0.9% for AGIs $25k-50k , 0.7% for AGIs $50k-75k , 0.6% for AGIs $75k-100k , 0.6% for AGIs over 100k ) Taxable dividends: $1,740 (reported on 26.3% of returns )(% of AGI for various income ranges: 3.4% for AGIs below $10k , 1.3% for AGIs $10k-25k , 0.6% for AGIs $25k-50k , 0.5% for AGIs $50k-75k , 0.4% for AGIs $75k-100k , 0.7% for AGIs over 100k ) Net capital gain/loss: +$4,132 (reported on 22.9% of returns )Here:
+$4,132State:
+$16,110
(% of AGI for various income ranges: -2.7% for AGIs below $10k , -0.2% for AGIs $10k-25k , 0.2% for AGIs $25k-50k , 0.2% for AGIs $50k-75k , 0.5% for AGIs $75k-100k , 2.3% for AGIs over 100k ) Profit/loss from business: +$9,946 (reported on 19.8% of returns )Here:
+$9,946State:
+$11,013
(% of AGI for various income ranges: 7.9% for AGIs below $10k , 7.2% for AGIs $10k-25k , 2.7% for AGIs $25k-50k , 1.8% for AGIs $50k-75k , 2.3% for AGIs $75k-100k , 2.9% for AGIs over 100k ) IRA payment deduction: $3,119 (reported on 2.7% of returns )(% of AGI for various income ranges: 0.3% for AGIs below $10k , 0.2% for AGIs $10k-25k , 0.2% for AGIs $25k-50k , 0.2% for AGIs $50k-75k , 0.1% for AGIs $75k-100k , 0.1% for AGIs over 100k ) Self-employed pension: $12,771 (reported on 1.1% of returns )Here:
$12,771Texas:
$16,401
(% of AGI for various income ranges: 0.1% for AGIs $10k-25k , 0.1% for AGIs $50k-75k , 0.1% for AGIs $75k-100k , 0.3% for AGIs over 100k ) Total itemized deductions: $19,634 (19% of AGI, reported on 52.6% of returns )Here:
$19,634State:
$19,631
Here:
19.5% of AGIState:
18.9% of AGI
(% of AGI for various income ranges: 17.0% for AGIs below $10k , 12.0% for AGIs $10k-25k , 15.1% for AGIs $25k-50k , 17.3% for AGIs $50k-75k , 17.1% for AGIs $75k-100k , 12.9% for AGIs over 100k ) Charity contributions deductions: $3,721 (4% of AGI, reported on 45.4% of returns )Here:
3.6% of AGIState:
4.2% of AGI
(% of AGI for various income ranges: 1.2% for AGIs below $10k , 1.4% for AGIs $10k-25k , 2.0% for AGIs $25k-50k , 2.5% for AGIs $50k-75k , 2.6% for AGIs $75k-100k , 2.4% for AGIs over 100k ) Total tax: $11,410 (reported on 83.4% of returns )77584:
$11,410State:
$9,058
(% of AGI for various income ranges: 4.8% for AGIs below $10k , 4.2% for AGIs $10k-25k , 6.6% for AGIs $25k-50k , 8.9% for AGIs $50k-75k , 10.4% for AGIs $75k-100k , 17.5% for AGIs over 100k ) Earned income credit: $1,747 (reported on 9.1% of returns )Percentage of individuals using paid preparers for their 2004 taxes: 46.2%(% for various income ranges: 41.9% for AGIs below $10k , 54.2% for AGIs $10k-25k , 49.4% for AGIs $25k-50k , 44.4% for AGIs $50k-75k , 42.3% for AGIs $75k-100k , 45.0% for AGIs over 100k )
Estimated median household income in 2022: This zip code:
$111,832Texas:
$72,284
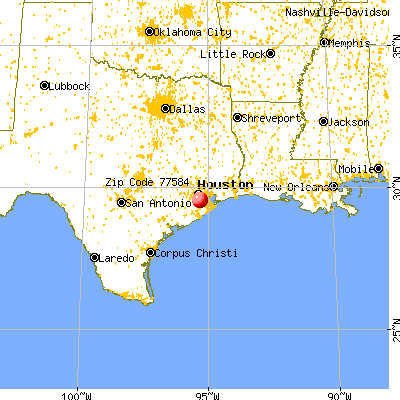
Nearest zip codes: 77578 ,
77581 ,
77047 ,
77048 ,
77075 ,
77051 .
Pearland Zip Code Map
Percentage of family households: This zip code:
57.3%Texas:
50.5%
Percentage of households with unmarried partners: This zip code:
4.1%Texas:
48.7%
Likely homosexual households (counted as self-reported same-sex unmarried-partner households)
Lesbian couples: 0.4% of all households Gay men: 0.2% of all households
Household received Food Stamps/SNAP in the past 12 months: 1,906Household did not receive Food Stamps/SNAP in the past 12 months: 29,647
Women who had a birth in the past 12 months: 1,686 (1,544 now married , 163 unmarried) Women who did not have a birth in the past 12 months: 21,462 (11,706 now married , 9,684 unmarried)
Housing units in zip code 77584 with a mortgage: 17,201 (798
second mortgage , 15
home equity loan , 467
both second mortgage and home equity loan )
Houses without a mortgage: 142
Median monthly owner costs for units with a mortgage: $2,476
Median monthly owner costs for units without a mortgage: $994
Residents with income below the poverty level in 2022:
This zip code:
4.9%Whole state:
14.0%
Residents with income below 50% of the poverty level in 2022:
This zip code:
3.1%Whole state:
7.4%
Median number of rooms in houses and condos: Median number of rooms in apartments:
Year house built (houses)
141 2020 or later9,744 2010 to 201913,353 2000 to 20095,463 1990 to 19993,294 1980 to 1989796 1970 to 1979406 1960 to 1969115 1950 to 195933 1940 to 194974 1939 or earlier
Zip code 77584 household income distribution in 2022 264 Less than $10,000419 $10,000 to $14,999391 $15,000 to $19,999802 $20,000 to $24,999368 $25,000 to $29,999889 $30,000 to $34,999575 $35,000 to $39,999754 $40,000 to $44,999681 $45,000 to $49,9991,268 $50,000 to $59,9992,834 $60,000 to $74,9993,876 $75,000 to $99,9994,146 $100,000 to $124,9992,836 $125,000 to $149,9995,078 $150,000 to $199,9996,335 $200,000 or moreEstimate of home value of owner-occupied houses/condos in 2022 in zip code 77584 283 Less than $10,00050 $10,000 to $14,99948 $15,000 to $19,99957 $20,000 to $24,99986 $25,000 to $29,99943 $30,000 to $34,99978 $35,000 to $39,9998 $40,000 to $49,99916 $50,000 to $59,999101 $60,000 to $69,999162 $70,000 to $79,99994 $80,000 to $89,999158 $90,000 to $99,999113 $100,000 to $124,999115 $125,000 to $149,999231 $150,000 to $174,999523 $175,000 to $199,9992,622 $200,000 to $249,9994,553 $250,000 to $299,9999,339 $300,000 to $399,9994,559 $400,000 to $499,9991,822 $500,000 to $749,999434 $750,000 to $999,999257 $1,000,000 to $1,499,99935 $1,500,000 to $1,999,999Rent paid by renters in 2022 in zip code 77584 48 $250 to $29937 $400 to $44935 $450 to $499101 $500 to $54976 $550 to $5997 $650 to $69923 $700 to $749461 $800 to $89969 $900 to $9991,005 $1,000 to $1,2491,661 $1,250 to $1,4993,361 $1,500 to $1,999876 $2,000 to $2,499294 $2,500 to $2,99972 $3,000 to $3,49910 $3,500 or more101 No cash rent
Median gross rent in 2022: $1,713.
Median price asked for vacant for-sale houses and condos in 2022: $3,389,549.
Estimated median house (or condo) value in 2022 for: White Non-Hispanic householders: $395,931Black or African American householders: $460,341American Indian or Alaska Native householders: $180,284Asian householders: $541,485Some other race householders: $301,526Two or more races householders: $340,362Hispanic or Latino householders: $331,205Estimated median house or condo value in 2022: $375,724
77584:
$375,724Texas:
$275,400
Lower value quartile - upper value quartile: $298,861 - $454,673
Mean price in 2022: Detached houses: $390,139Here:
$390,139State:
$369,058
Townhouses or other attached units: $313,182Here:
$313,182State:
$327,631
Mobile homes: $109,111Here:
$109,111State:
$124,413
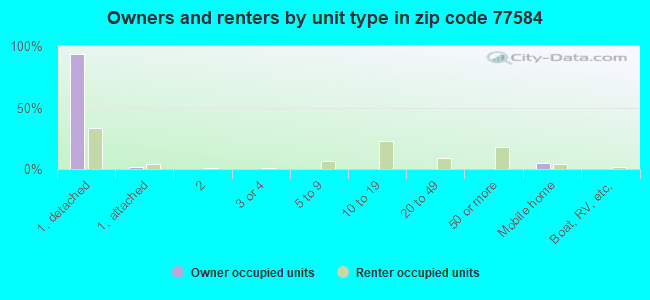
Housing units in structures:
One, detached: 25,121One, attached: 913Two: 723 or 4: 325 to 9: 46410 to 19: 2,02320 to 49: 1,02950 or more: 1,604Mobile homes: 1,522Boats, RVs, vans, etc.: 154Unemployment : 3.3%
Means of transportation to work in zip code 77584 76.7% 35,663 Drove a car alone7.7% 3,589 Carpooled0.0% 22 Streetcar or trolley car0.4% 179 Taxi0.1% 32 Motorcycle0.2% 105 Walked0.4% 202 Other means13.9% 6,485 Worked at homeTravel time to work (commute) in zip code 77584 263 Less than 5 minutes1,588 5 to 9 minutes2,343 10 to 14 minutes2,640 15 to 19 minutes4,243 20 to 24 minutes2,597 25 to 29 minutes8,653 30 to 34 minutes2,975 35 to 39 minutes3,142 40 to 44 minutes7,023 45 to 59 minutes3,787 60 to 89 minutes684 90 or more minutes
Percentage of zip code residents living and working in this county: 31.5%
Household type by relationship:
Households: 92,793
Male householders: 16,265 (2,749 living alone ), Female householders: 15,373 (4,128 living alone )19,142 spouses (19,029 opposite-sex spouses ), 1,858 unmarried partners , (1,761 opposite-sex unmarried partners ), 32,245 children (30,269 natural , 533 adopted , 1,441 stepchildren ), 1,559 grandchildren , 1,180 brothers or sisters , 2,381 parents , 0 foster children , 1,329 other relatives , 997 non-relatives In group quarters: 385 (-1 institutionalized population )
Size of family households: 6,975 2-persons , 4,815 3-persons , 7,319 4-persons , 2,596 5-persons , 931 6-persons , 735 7-or-more-persons
Size of nonfamily households: 6,875 1-person , 1,117 2-persons , 26 3-persons , 24 5-persons
20,537 married couples with children. single-parent households (1,115 men , 2,894 women ).
64.8% of residents of 77584 zip code speak English at home. of residents speak Spanish at home (71% very well, 14% well, 12% not well, 3% not at all ).of residents speak other Indo-European language at home (79% very well, 15% well, 6% not well ).of residents speak Asian or Pacific Island language at home (60% very well, 30% well, 8% not well, 2% not at all ).of residents speak other language at home (77% very well, 15% well, 6% not well, 2% not at all ).
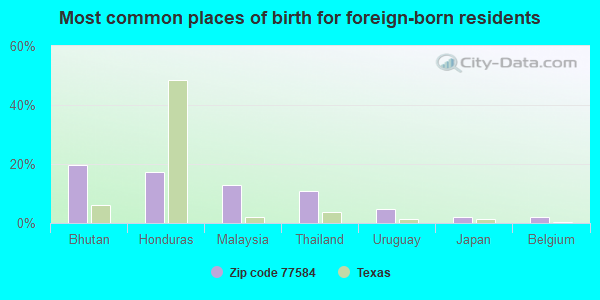
Foreign born population: 21,862 (23.6%)
(59.8%
of them are naturalized citizens )
This zip code:
23.6%Whole state:
17.2%
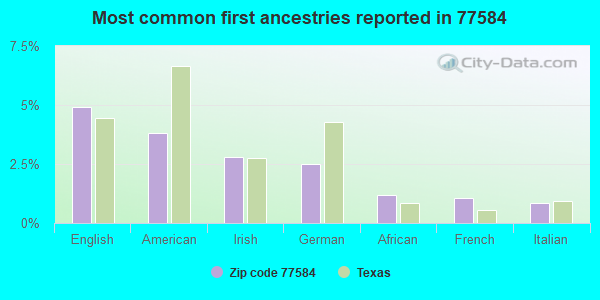
20% Bhutan 17% Honduras 13% Malaysia 11% Thailand 5% Uruguay 2% Japan 2% Belgium 5% English 4% American 3% Irish 2% German 1% African 1% French 1% Italian
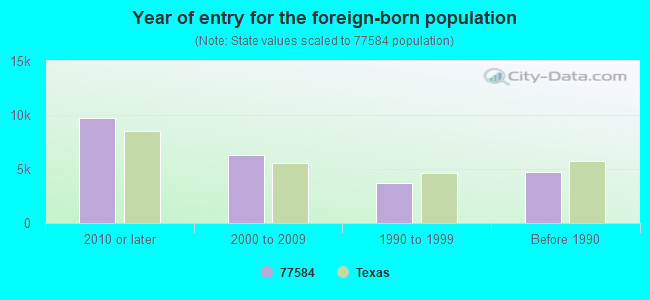
Year of entry for the foreign-born population
9,739 2010 or later 6,333 2000 to 2009 3,665 1990 to 1999 4,717 Before 1990
There are
372 Other Medical Specialists in Zip Code 77584.
Facilities with environmental interests located in this zip code:
ASTRO CONCRETE INC (2210 COUNTY RD 93 in PEARLAND, TX)
(Integrated Compliance Information System) - ICIS-HQ-1999-1093, FORMAL ENFORCEMENT ACTION Business SIC classification: LOCAL TRUCKING WITHOUT STORAGE; TRUCKING, EXCEPT LOCAL
AGGREKO INC (3732 MAGNOLIA ST in PEARLAND, TX)
(Resource Conservation and Recovery Act (tracking hazardous waste)) Business NAICS classification: HOUSEHOLD APPLIANCE STORES.
Housing units lacking complete plumbing facilities: 0.2%
Housing units lacking complete kitchen facilities: 0.3%
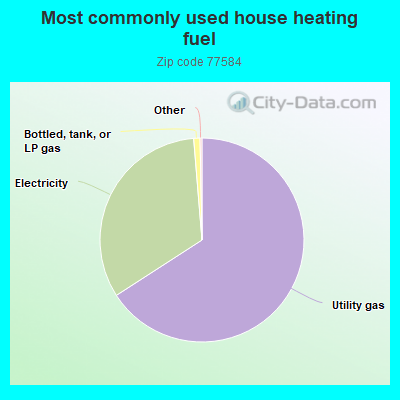
65.8% Utility gas 32.8% Electricity 1.0% Bottled, tank, or LP gas
Population in 1990: 14,234. Population change in the 1990s: +15,207 (+106.8%).
Place of birth for U.S.-born residents:
This state: 46,343Northeast: 3,902Midwest: 3,891South: 10,365West: 4,294
45% of the 77584 zip code residents lived in the same house 5 years ago.
Out of people who lived in different houses, 23% lived in this county.
Out of people who lived in different counties, 50% lived in Texas.
91% of the 77584 zip code residents lived in the same house 1 year ago.
Out of people who lived in different houses, 23% moved from this county.
Out of people who lived in different houses, 54% moved from different county within same state.
Out of people who lived in different houses, 21% moved from different state.
Out of people who lived in different houses, 7% moved from abroad.
Private vs. public school enrollment:
Students in private schools in grades 1 to 8 (elementary and middle school): 1,119
Students in private schools in grades 9 to 12 (high school): 645
Students in private undergraduate colleges: 566
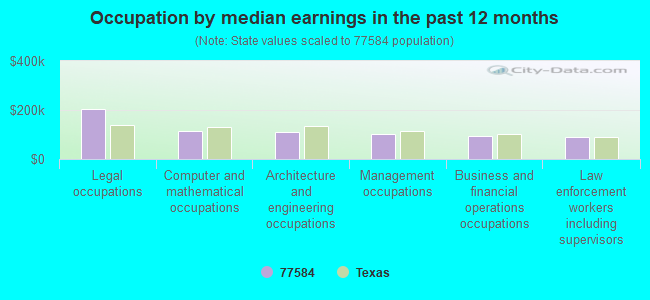
Occupation by median earnings in the past 12 months ($)
202,989 Legal occupations 114,055 Computer and mathematical occupations 111,322 Architecture and engineering occupations 101,298 Management occupations 94,383 Business and financial operations occupations 88,891 Law enforcement workers including supervisors
Companies with federal contracts located in this zip code:
NOVEM INC (2225 COUNTY ROAD 90 in PEARLAND, TX; small business)
$8,971 with Navy for Other Education and Training Services. Taking place in WA. Signed on 2006-04-18. Completion date: 2006-04-25.
STROUHAL TIRE RECAPPING PLANT (14770 SOUTH FWY 288 in PEARLAND, TX; small business)
$5,244 with Army for Tires, Solid and Cushion. Signed on 2005-06-25. Completion date: 2005-06-29.
Top industries in this zip code by the number of employees in 2005:
Accommodation and Food Services: Full-Service Restaurants (100-249 employees: 1 establishment, 50-99 employees: 4 establishments, 20-49 employees: 6 establishments, 10-19 employees: 3 establishments, 5-9 employees: 3 establishments, 1-4 employees: 7 establishments)Accommodation and Food Services: Limited-Service Restaurants (20-49: 7, 10-19: 4, 5-9: 1, 1-4: 2)Health Care and Social Assistance: Child Day Care Services (50-99: 1, 20-49: 4, 10-19: 2, 5-9: 2, 1-4: 6)Construction: Drywall and Insulation Contractors (100-249: 1)Arts, Entertainment, and Recreation: Amusement and Theme Parks (100-249: 1)Finance and Insurance: Commercial Banking (10-19: 5, 5-9: 5, 1-4: 3)
People in group quarters in 2010:
185 people in nursing facilities/skilled-nursing facilities
32 people in other noninstitutional facilities
7 people in local jails and other municipal confinement facilities
6 people in residential treatment centers for juveniles (non-correctional)
Fatal accident statistics in 2012:
Fatal accident count: 1Vehicles involved in fatal accidents: 2Fatal accidents caused by drunken drivers: 1Fatalities: 1Persons involved in fatal accidents: 6Pedestrians involved in fatal accidents: 0
Fatal accident statistics in 2010:
Fatal accident count: 2Vehicles involved in fatal accidents: 3Fatal accidents caused by drunken drivers: 1Fatalities: 2Persons involved in fatal accidents: 4Pedestrians involved in fatal accidents: 0
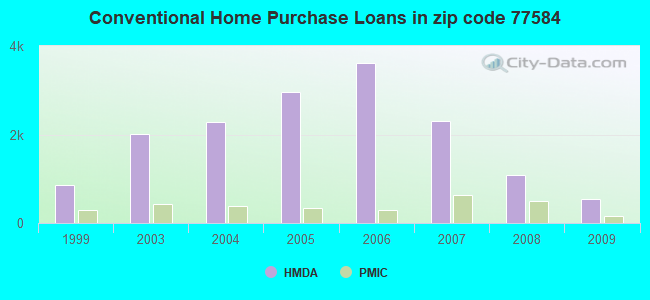
Home Mortgage Disclosure Act Aggregated Statistics For Year 2009(Based on 8 partial tracts) A) FHA, FSA/RHS & VA B) Conventional C) Refinancings D) Home Improvement Loans E) Loans on Dwellings For 5+ Families F) Non-occupant Loans on G) Loans On Manufactured Number Average Value Number Average Value Number Average Value Number Average Value Number Average Value Number Average Value Number Average Value
LOANS ORIGINATED 666 $172,888 534 $173,769 1,286 $167,511 51 $49,173 1 $15,594,000 50 $146,446 6 $55,240 APPLICATIONS APPROVED, NOT ACCEPTED 39 $180,843 56 $147,793 131 $166,006 13 $32,195 0 $0 4 $126,345 3 $49,243 APPLICATIONS DENIED 108 $172,560 93 $156,708 532 $171,248 102 $26,660 0 $0 30 $127,642 16 $47,939 APPLICATIONS WITHDRAWN 69 $183,309 99 $183,931 373 $171,919 21 $47,914 0 $0 12 $185,295 5 $78,076 FILES CLOSED FOR INCOMPLETENESS 16 $154,231 21 $173,219 98 $163,990 7 $72,924 0 $0 7 $108,884 3 $124,637
Aggregated Statistics For Year 2008(Based on 8 partial tracts) A) FHA, FSA/RHS & VA B) Conventional C) Refinancings D) Home Improvement Loans F) Non-occupant Loans on G) Loans On Manufactured Number Average Value Number Average Value Number Average Value Number Average Value Number Average Value Number Average Value
LOANS ORIGINATED 520 $173,975 1,090 $166,090 495 $157,519 122 $40,501 83 $125,429 15 $40,367 APPLICATIONS APPROVED, NOT ACCEPTED 15 $172,436 121 $145,904 118 $139,523 36 $40,422 17 $100,497 20 $44,186 APPLICATIONS DENIED 90 $178,663 231 $157,312 557 $161,932 206 $45,253 34 $126,920 33 $64,519 APPLICATIONS WITHDRAWN 71 $190,422 211 $174,598 239 $168,574 23 $72,159 33 $156,194 3 $100,903 FILES CLOSED FOR INCOMPLETENESS 13 $204,026 37 $168,446 49 $185,165 12 $50,718 4 $125,960 0 $0
Aggregated Statistics For Year 2007(Based on 8 partial tracts) A) FHA, FSA/RHS & VA B) Conventional C) Refinancings D) Home Improvement Loans E) Loans on Dwellings For 5+ Families F) Non-occupant Loans on G) Loans On Manufactured Number Average Value Number Average Value Number Average Value Number Average Value Number Average Value Number Average Value Number Average Value
LOANS ORIGINATED 244 $164,017 2,314 $146,526 550 $149,151 181 $43,500 2 $184,275 174 $127,513 18 $54,958 APPLICATIONS APPROVED, NOT ACCEPTED 8 $168,585 311 $133,370 153 $158,036 61 $44,674 0 $0 34 $140,094 11 $48,569 APPLICATIONS DENIED 45 $166,771 523 $143,579 688 $151,912 193 $43,120 0 $0 66 $132,058 38 $58,325 APPLICATIONS WITHDRAWN 55 $161,289 348 $152,267 321 $155,598 22 $34,149 0 $0 19 $132,606 6 $66,510 FILES CLOSED FOR INCOMPLETENESS 2 $190,435 92 $162,306 117 $176,747 1 $132,890 0 $0 7 $117,480 0 $0
Aggregated Statistics For Year 2006(Based on 8 partial tracts) A) FHA, FSA/RHS & VA B) Conventional C) Refinancings D) Home Improvement Loans E) Loans on Dwellings For 5+ Families F) Non-occupant Loans on G) Loans On Manufactured Number Average Value Number Average Value Number Average Value Number Average Value Number Average Value Number Average Value Number Average Value
LOANS ORIGINATED 246 $158,994 3,613 $128,091 497 $140,614 175 $38,815 0 $0 268 $122,520 28 $62,182 APPLICATIONS APPROVED, NOT ACCEPTED 12 $153,398 654 $119,766 165 $140,738 41 $44,195 0 $0 42 $112,274 26 $37,044 APPLICATIONS DENIED 25 $157,363 855 $128,303 615 $147,238 198 $47,526 1 $78,650 104 $130,215 66 $54,012 APPLICATIONS WITHDRAWN 39 $170,033 545 $139,094 414 $146,818 31 $42,154 0 $0 36 $135,985 3 $26,250 FILES CLOSED FOR INCOMPLETENESS 3 $150,793 124 $145,242 146 $162,865 7 $63,279 0 $0 9 $178,879 1 $15,480
Aggregated Statistics For Year 2005(Based on 8 partial tracts) A) FHA, FSA/RHS & VA B) Conventional C) Refinancings D) Home Improvement Loans E) Loans on Dwellings For 5+ Families F) Non-occupant Loans on G) Loans On Manufactured Number Average Value Number Average Value Number Average Value Number Average Value Number Average Value Number Average Value Number Average Value
LOANS ORIGINATED 173 $152,692 2,960 $121,278 767 $129,415 134 $61,547 2 $6,918,750 187 $111,534 35 $60,099 APPLICATIONS APPROVED, NOT ACCEPTED 14 $143,973 513 $117,658 135 $141,318 35 $46,244 0 $0 19 $131,527 23 $57,294 APPLICATIONS DENIED 30 $138,845 653 $118,503 780 $137,490 178 $37,692 0 $0 60 $106,426 65 $46,437 APPLICATIONS WITHDRAWN 33 $140,888 499 $133,419 427 $161,714 58 $218,162 0 $0 56 $134,046 5 $54,722 FILES CLOSED FOR INCOMPLETENESS 4 $178,385 92 $147,791 168 $147,000 1 $108,230 0 $0 15 $111,001 1 $122,040
Aggregated Statistics For Year 2004(Based on 8 partial tracts) A) FHA, FSA/RHS & VA B) Conventional C) Refinancings D) Home Improvement Loans E) Loans on Dwellings For 5+ Families F) Non-occupant Loans on G) Loans On Manufactured Number Average Value Number Average Value Number Average Value Number Average Value Number Average Value Number Average Value Number Average Value
LOANS ORIGINATED 186 $145,880 2,284 $125,418 1,090 $127,211 130 $50,564 1 $10,777,560 103 $108,204 42 $64,479 APPLICATIONS APPROVED, NOT ACCEPTED 15 $130,759 387 $118,078 226 $127,673 40 $66,863 0 $0 17 $124,943 29 $50,219 APPLICATIONS DENIED 34 $138,891 444 $115,270 796 $136,383 143 $35,770 0 $0 51 $97,164 47 $54,883 APPLICATIONS WITHDRAWN 37 $146,327 320 $137,398 402 $124,805 20 $36,498 3 $193,010 21 $97,051 20 $93,968 FILES CLOSED FOR INCOMPLETENESS 0 $0 78 $146,163 172 $141,122 5 $59,346 0 $0 6 $98,283 2 $59,995
Aggregated Statistics For Year 2003(Based on 8 partial tracts) A) FHA, FSA/RHS & VA B) Conventional C) Refinancings D) Home Improvement Loans E) Loans on Dwellings For 5+ Families F) Non-occupant Loans on Number Average Value Number Average Value Number Average Value Number Average Value Number Average Value Number Average Value
LOANS ORIGINATED 258 $138,080 2,004 $127,187 2,612 $128,138 121 $43,532 1 $836,190 86 $105,761 APPLICATIONS APPROVED, NOT ACCEPTED 13 $156,475 262 $106,675 359 $128,912 35 $39,545 0 $0 19 $113,346 APPLICATIONS DENIED 42 $132,727 277 $112,592 1,109 $120,693 102 $27,905 0 $0 36 $102,172 APPLICATIONS WITHDRAWN 34 $137,992 281 $134,282 553 $129,305 8 $50,222 0 $0 7 $63,580 FILES CLOSED FOR INCOMPLETENESS 6 $185,873 43 $146,085 104 $136,982 2 $57,745 0 $0 2 $166,040
Aggregated Statistics For Year 1999(Based on 4 partial tracts) A) FHA, FSA/RHS & VA B) Conventional C) Refinancings D) Home Improvement Loans F) Non-occupant Loans on Number Average Value Number Average Value Number Average Value Number Average Value Number Average Value
LOANS ORIGINATED 90 $109,989 870 $116,142 166 $88,236 61 $20,230 14 $60,319 APPLICATIONS APPROVED, NOT ACCEPTED 1 $89,260 126 $81,609 33 $74,462 25 $21,209 2 $55,630 APPLICATIONS DENIED 9 $128,512 215 $72,800 60 $75,448 39 $18,328 13 $55,156 APPLICATIONS WITHDRAWN 12 $116,532 103 $141,287 55 $83,120 9 $21,978 2 $68,505 FILES CLOSED FOR INCOMPLETENESS 2 $108,190 43 $131,313 26 $87,051 1 $24,570 3 $124,113
Detailed HMDA statistics for the following Tracts:
6606.00
,
6607.00 ,
6608.00 ,
6609.00
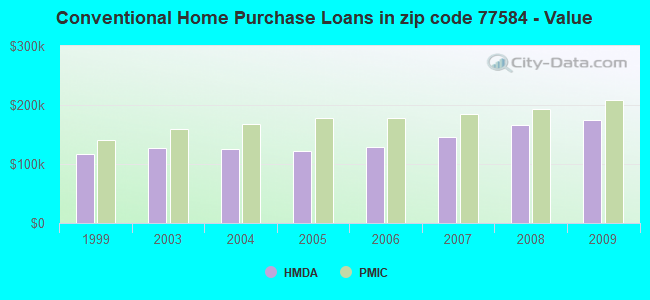
Private Mortgage Insurance Companies Aggregated Statistics For Year 2009(Based on 8 partial tracts) A) Conventional B) Refinancings C) Non-occupant Loans on Number Average Value Number Average Value Number Average Value
LOANS ORIGINATED 162 $208,819 109 $195,642 2 $215,605 APPLICATIONS APPROVED, NOT ACCEPTED 41 $209,199 41 $203,494 3 $112,717 APPLICATIONS DENIED 21 $197,111 9 $170,624 1 $141,020 APPLICATIONS WITHDRAWN 11 $234,721 12 $177,890 4 $211,535 FILES CLOSED FOR INCOMPLETENESS 3 $188,233 2 $212,725 0 $0
Aggregated Statistics For Year 2008(Based on 8 partial tracts) A) Conventional B) Refinancings C) Non-occupant Loans on D) Loans On Manufactured Number Average Value Number Average Value Number Average Value Number Average Value
LOANS ORIGINATED 495 $193,116 78 $187,074 21 $153,336 1 $50,170 APPLICATIONS APPROVED, NOT ACCEPTED 142 $210,836 43 $214,519 9 $155,774 1 $50,170 APPLICATIONS DENIED 19 $203,824 5 $255,958 8 $209,024 0 $0 APPLICATIONS WITHDRAWN 17 $164,306 7 $276,253 1 $198,610 0 $0 FILES CLOSED FOR INCOMPLETENESS 4 $206,145 2 $210,410 0 $0 0 $0
Aggregated Statistics For Year 2007(Based on 8 partial tracts) A) Conventional B) Refinancings C) Non-occupant Loans on D) Loans On Manufactured Number Average Value Number Average Value Number Average Value Number Average Value
LOANS ORIGINATED 630 $184,711 80 $191,379 38 $150,805 1 $50,180 APPLICATIONS APPROVED, NOT ACCEPTED 79 $197,948 22 $219,942 1 $280,340 0 $0 APPLICATIONS DENIED 19 $196,356 3 $247,017 4 $222,058 0 $0 APPLICATIONS WITHDRAWN 19 $188,958 8 $189,460 1 $132,210 0 $0 FILES CLOSED FOR INCOMPLETENESS 6 $139,073 0 $0 0 $0 0 $0
Aggregated Statistics For Year 2006(Based on 8 partial tracts) A) Conventional B) Refinancings C) Non-occupant Loans on D) Loans On Manufactured Number Average Value Number Average Value Number Average Value Number Average Value
LOANS ORIGINATED 299 $177,464 42 $189,980 18 $152,546 0 $0 APPLICATIONS APPROVED, NOT ACCEPTED 68 $188,316 22 $195,131 7 $169,387 3 $78,537 APPLICATIONS DENIED 3 $200,170 0 $0 1 $146,450 0 $0 APPLICATIONS WITHDRAWN 15 $187,723 7 $202,923 1 $157,970 1 $81,810 FILES CLOSED FOR INCOMPLETENESS 0 $0 0 $0 0 $0 0 $0
Aggregated Statistics For Year 2005(Based on 8 partial tracts) A) Conventional B) Refinancings C) Non-occupant Loans on D) Loans On Manufactured Number Average Value Number Average Value Number Average Value Number Average Value
LOANS ORIGINATED 329 $177,650 68 $172,038 22 $151,835 4 $66,320 APPLICATIONS APPROVED, NOT ACCEPTED 64 $182,628 23 $190,809 2 $125,795 0 $0 APPLICATIONS DENIED 7 $185,060 0 $0 1 $111,870 0 $0 APPLICATIONS WITHDRAWN 23 $156,413 3 $156,937 3 $135,340 1 $43,630 FILES CLOSED FOR INCOMPLETENESS 0 $0 0 $0 0 $0 0 $0
Aggregated Statistics For Year 2004(Based on 8 partial tracts) A) Conventional B) Refinancings C) Non-occupant Loans on D) Loans On Manufactured Number Average Value Number Average Value Number Average Value Number Average Value
LOANS ORIGINATED 391 $168,040 116 $159,606 12 $173,468 2 $104,060 APPLICATIONS APPROVED, NOT ACCEPTED 70 $162,484 50 $180,298 0 $0 0 $0 APPLICATIONS DENIED 2 $306,450 0 $0 1 $111,870 0 $0 APPLICATIONS WITHDRAWN 20 $173,467 13 $157,415 2 $180,880 0 $0 FILES CLOSED FOR INCOMPLETENESS 1 $190,160 4 $143,630 0 $0 0 $0
Aggregated Statistics For Year 2003(Based on 8 partial tracts) A) Conventional B) Refinancings C) Non-occupant Loans on Number Average Value Number Average Value Number Average Value
LOANS ORIGINATED 440 $159,389 294 $157,696 18 $104,563 APPLICATIONS APPROVED, NOT ACCEPTED 110 $158,047 126 $155,188 5 $148,732 APPLICATIONS DENIED 8 $151,904 7 $172,259 2 $101,000 APPLICATIONS WITHDRAWN 17 $195,205 17 $176,421 1 $62,380 FILES CLOSED FOR INCOMPLETENESS 2 $145,205 3 $191,563 0 $0
Aggregated Statistics For Year 1999(Based on 4 partial tracts) A) Conventional B) Refinancings C) Non-occupant Loans on Number Average Value Number Average Value Number Average Value
LOANS ORIGINATED 305 $140,880 27 $112,640 1 $82,550 APPLICATIONS APPROVED, NOT ACCEPTED 43 $155,805 8 $110,389 0 $0 APPLICATIONS DENIED 37 $135,938 3 $180,350 0 $0 APPLICATIONS WITHDRAWN 8 $127,174 0 $0 0 $0 FILES CLOSED FOR INCOMPLETENESS 3 $93,227 4 $105,150 0 $0
Detailed PMIC statistics for the following Tracts:
6606.00
,
6607.00 ,
6608.00 ,
6609.00
2002 - 2018 National Fire Incident Reporting System (NFIRS) incidents See full 2006 National Fire Incident Reporting System statistics for zip code 77584, Texas
Most common first names in zip code 77584 among deceased individuals Name Count Lived (average)
John 51 71.4 years Robert 47 72.3 years Mary 46 78.8 years James 46 70.8 years William 44 75.6 years Dorothy 28 75.7 years Charles 28 70.9 years Richard 22 70.2 years Thomas 18 72.1 years Joseph 15 74.4 years
Most common last names in zip code 77584 among deceased individuals Last name Count Lived (average)
Smith 19 73.3 years Johnson 15 77.5 years Davis 15 66.7 years Brown 13 71.4 years Jones 12 71.8 years Williams 11 72.4 years Moore 10 70.3 years Miller 10 76.3 years Anderson 8 77.4 years Bell 7 81.3 years
Businesses in zip code 77584
Name Count Name Count
24 Hour Fitness 1 Kohl's 1 AT&T 1 Kroger 1 Academy Sports + Outdoors 1 La Quinta 1 Advance Auto Parts 1 Lane Bryant 1 Aeropostale 1 LensCrafters 1 American Eagle Outfitters 1 Little Caesars Pizza 1 Ann Taylor 1 Macy's 1 Ashley Furniture 1 Marriott 2 AutoZone 1 Marshalls 1 Barnes & Noble 1 McDonald's 2 Baskin-Robbins 1 Men's Wearhouse 1 Bed Bath & Beyond 1 Motherhood Maternity 1 Burger King 1 New Balance 1 CVS 1 New York & Co 1 Carl\s Jr. 1 Nike 12 Catherines 1 Office Depot 1 Charlotte Russe 1 Old Navy 1 Chick-Fil-A 1 Olive Garden 1 Chico's 1 Panera Bread 1 Chipotle 1 Papa John's Pizza 1 Chuck E. Cheese's 1 Payless 2 Cinnabon 1 Penske 1 Cold Stone Creamery 1 PetSmart 1 Coldwater Creek 1 Pier 1 Imports 1 Cracker Barrel 1 Pizza Hut 2 Cricket Wireless 2 Popeyes 1 Dairy Queen 1 Quiznos 1 Discount Tire 1 RadioShack 1 Domino's Pizza 1 Red Lobster 1 DressBarn 1 Red Robin 1 Dressbarn 1 Rue21 1 Express 1 SONIC Drive-In 1 Famous Footwear 1 Safeway 1 FedEx 5 Sears 1 Finish Line 1 Shoe Carnival 1 Firestone Complete Auto Care 1 Sprint Nextel 1 Forever 21 1 Starbucks 3 GNC 1 Subway 1 GameStop 3 T-Mobile 3 Gymboree 1 T.G.I. Driday's 1 H&R Block 2 Taco Bell 2 Hobby Lobby 1 Target 1 Holiday Inn 1 The Limited 1 Hollister Co. 1 U-Haul 3 Home Depot 1 UPS 4 Hot Topic 1 Vans 3 IHOP 1 Verizon Wireless 2 JCPenney 1 Victoria's Secret 1 Jamba Juice 1 Vons 2 JoS. A. Bank 1 Walgreens 1 Journeys 1 Walmart 1 Justice 1 Wet Seal 1 KFC 1


 Nearest zip codes: 77578, 77581, 77047, 77048, 77075, 77051.
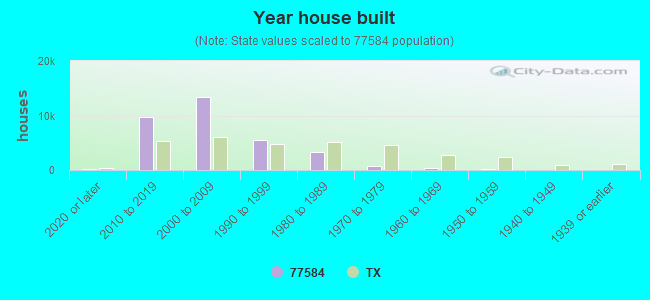


 Based on the data from the years 2002 - 2018 the average number of fires per year is 92. The highest number of reported fire incidents - 170 took place in 2008, and the least - 12 in 2004. The data has a rising trend.
 When looking into fire subcategories, the most incidents belonged to: Outside Fires (44.8%), and Structure Fires (36.9%).