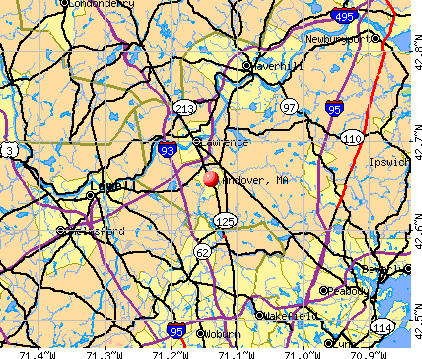
Andover, Massachusetts
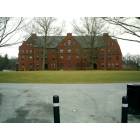
Andover: The Chappel Phillips Academy Andover.

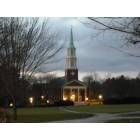
Andover: West Parish, Andover

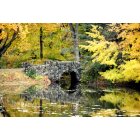
Andover: Haggetts Pond, Andover, MA
Andover: West Parish, Andover

Andover: Haggett's Pond, Andover
Andover: The Chappel Phillips Academy Andover.

Andover: The Chappel Phillips Academy Andover.
- add
your
Submit your own pictures of this place and show them to the world
- OSM Map
- General Map
- Google Map
- MSN Map
Population change since 2000: +10.9%
| Males: 4,070 | |
| Females: 4,692 |
| Median resident age: | 45.7 years |
| Massachusetts median age: | 40.3 years |
Zip codes: 01810.
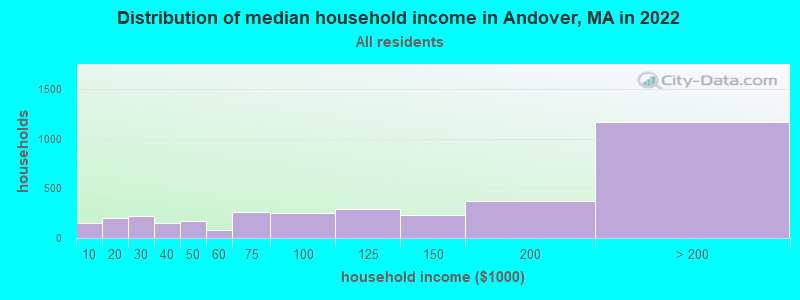
| Andover: | $127,702 |
| MA: | $94,488 |
Estimated per capita income in 2022: $68,674 (it was $34,760 in 2000)
Andover CDP income, earnings, and wages data
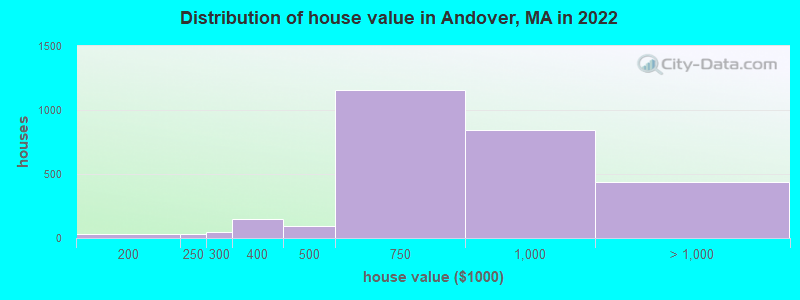
Estimated median house or condo value in 2022: $759,499 (it was $294,800 in 2000)
| Andover: | $759,499 |
| MA: | $534,700 |
Mean prices in 2022: all housing units: $764,759; detached houses: $870,060; townhouses or other attached units: $770,459; in 2-unit structures: $564,179; in 3-to-4-unit structures: $543,133; in 5-or-more-unit structures: $326,302
Median gross rent in 2022: $1,583.
(7.5% for White Non-Hispanic residents, 0.7% for Black residents, 4.3% for Hispanic or Latino residents, 16.8% for other race residents)
Detailed information about poverty and poor residents in Andover, MA


Compare current foreclosures near Andover, MA:
| Photo | Address | Area | Beds / Baths | Price | Details |
|---|---|---|---|---|---|

|
#1
Elysian Dr
Andover, MA 01810
|
2,078 sq. feet
|
1 baths 4 beds |
show details | |

|
#2
Locke St
Andover, MA 01810
|
2,251 sq. feet
|
4 baths 4 beds |
show details | |

|
#3
Red Spring Rd
Andover, MA 01810
|
2,505 sq. feet
|
2 baths 4 beds |
show details | |

|
#4
Elm Ct
Andover, MA 01810
|
1,320 sq. feet
|
1 baths 3 beds |
show details | |

|
#5
North St
Andover, MA 01810
|
2,196 sq. feet
|
1 baths 5 beds |
show details | |

|
#6
Hillcrest Rd
Andover, MA 01810
|
- sq. feet
|
- baths - beds |
show details | |

|
#7
Lowell St Apt 3305
Andover, MA 01810
|
- sq. feet
|
- baths - beds |
show details | |

|
#8
River Rd
Andover, MA 01810
|
- sq. feet
|
- baths - beds |
show details | |

|
#9
River Rd
Andover, MA 01810
|
- sq. feet
|
- baths - beds |
show details | |

|
#10
Blanchard St
Andover, MA 01810
|
- sq. feet
|
- baths - beds |
show details |
| Photo | Address | Area | Beds / Baths | Price | Details |
|---|---|---|---|---|---|

|
#11
Woodview Way, Apt 2305
Andover, MA 01810
|
- sq. feet
|
- baths - beds |
show details | |

|
#12
Shore Dr
Hampstead, NH 03841
|
787 sq. feet
|
1 baths 2 beds |
$529,900
|
show details |

|
#13
Cedar St # A
Haverhill, MA 01830
|
1,134 sq. feet
|
2 baths 2 beds |
$209,300
|
show details |

|
#14
Maple St
Tewksbury, MA 01876
|
1,748 sq. feet
|
1 baths 4 beds |
$379,900
|
show details |

|
#15
Portland St
Lynn, MA 01902
|
851 sq. feet
|
2 baths 2 beds |
show details | |

|
#16
Aiken Ave Apt 15
Lowell, MA 01850
|
1,100 sq. feet
|
1 baths 2 beds |
show details | |

|
#17
Salem Rd
Billerica, MA 01821
|
1,428 sq. feet
|
1 baths 4 beds |
show details | |

|
#18
Lyons St
Lowell, MA 01852
|
1,314 sq. feet
|
1 baths 2 beds |
show details | |

|
#19
Byron St
Haverhill, MA 01835
|
2,446 sq. feet
|
2 baths 4 beds |
show details | |

|
#20
Carlisle St
Lowell, MA 01852
|
1,913 sq. feet
|
1 baths 5 beds |
show details |
| Photo | Address | Area | Beds / Baths | Price | Details |
|---|---|---|---|---|---|

|
#21
Emily Rd
Tewksbury, MA 01876
|
1,600 sq. feet
|
1 baths 3 beds |
show details | |

|
#22
Frances Street Aka 57 Francis Street
Haverhill, MA 01830
|
1,280 sq. feet
|
2 baths 3 beds |
show details | |

|
#23
Forest Park Rd
Woburn, MA 01801
|
1,132 sq. feet
|
1 baths 3 beds |
show details | |

|
#24
Boston Rd
Chelmsford, MA 01824
|
1,392 sq. feet
|
1 baths 3 beds |
show details | |

|
#25
River Rd
Tyngsboro, MA 01879
|
1,863 sq. feet
|
2 baths 2 beds |
show details | |

|
#26
Oak Ridge Rd
Plaistow, NH 03865
|
3,089 sq. feet
|
3 baths 5 beds |
show details | |

|
#27
Mill River Ln
Rowley, MA 01969
|
2,705 sq. feet
|
2 baths 4 beds |
show details | |

|
#28
3rd Ave
North Chelmsford, MA 01863
|
- sq. feet
|
1 baths 2 beds |
show details | |

|
#29
Schaefer Cir
Hudson, NH 03051
|
4,358 sq. feet
|
3 baths 5 beds |
show details | |

|
#30
Williamine Dr
Newton, NH 03858
|
2,295 sq. feet
|
1 baths 3 beds |
show details |
| Photo | Address | Area | Beds / Baths | Price | Details |
|---|---|---|---|---|---|

|
#31
Cheney Dr
Hudson, NH 03051
|
1,685 sq. feet
|
2 baths 3 beds |
show details | |

|
#32
Lincoln Ave
Saugus, MA 01906
|
1,080 sq. feet
|
1 baths 3 beds |
show details | |

|
#33
Margin Street
Lynn, MA 01905
|
1,240 sq. feet
|
2 baths 2 beds |
show details | |

|
#34
Essex St
Swampscott, MA 01907
|
2,029 sq. feet
|
2 baths 3 beds |
show details | |

|
#35
Atlantic Street, Unit A 10 A/k/a Unit 10, Marilyn Condominium
Lynn, MA 01902
|
576 sq. feet
|
1 baths 1 beds |
show details | |

|
#36
Thornton St
Lawrence, MA 01841
|
912 sq. feet
|
1 baths 2 beds |
show details | |

|
#37
Pine Ridge Rd
Windham, NH 03087
|
1,746 sq. feet
|
2 baths 4 beds |
show details | |

|
#38
S Broadway
Lawrence, MA 01843
|
5,706 sq. feet
|
2 baths 6 beds |
show details | |

|
#39
Maple St
Amesbury, MA 01913
|
2,186 sq. feet
|
2 baths 4 beds |
show details | |

|
#40
Farnham Rd
Rowley, MA 01969
|
1,106 sq. feet
|
2 baths 3 beds |
show details |
| Photo | Address | Area | Beds / Baths | Price | Details |
|---|---|---|---|---|---|

|
#41
Millbrook Ln
Wakefield, MA 01880
|
2,224 sq. feet
|
2 baths 4 beds |
show details | |

|
#42
Collins St
Danvers, MA 01923
|
1,729 sq. feet
|
2 baths 2 beds |
show details | |

|
#43
Limewoods Dr
Saugus, MA 01906
|
2,240 sq. feet
|
2 baths 3 beds |
show details | |

|
#44
Maple St
Danvers, MA 01923
|
1,756 sq. feet
|
1 baths 3 beds |
show details | |

|
#45
Edison Ln
North Billerica, MA 01862
|
1,468 sq. feet
|
1 baths 3 beds |
show details | |

|
#46
Concord Rd
Billerica, MA 01821
|
3,243 sq. feet
|
2 baths 2 beds |
show details | |

|
#47
Gauthier Way
Pelham, NH 03076
|
2,752 sq. feet
|
2 baths 3 beds |
show details | |

|
#48
Linebrook Rd
Ipswich, MA 01938
|
901 sq. feet
|
1 baths 1 beds |
show details | |

|
#49
Samoset Dr
Salem, NH 03079
|
4,816 sq. feet
|
3 baths 3 beds |
show details | |

|
Check over 1 million property listings on Foreclosure.com!
|
browse all offers | |||


- 7,17376.1%White alone
- 95510.1%Asian alone
- 8048.5%Hispanic
- 2062.2%Two or more races
- 1171.2%Black alone
- 380.4%American Indian alone
- 210.2%Other race alone
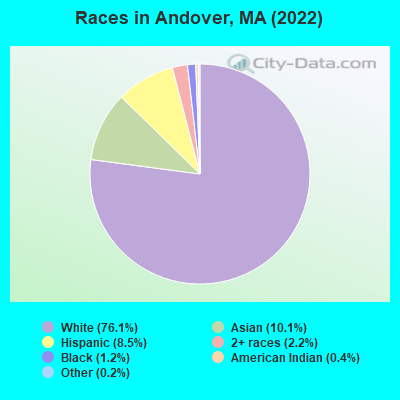
Races in Andover detailed stats: ancestries, foreign born residents, place of birth
According to our research of Massachusetts and other state lists, there were 4 registered sex offenders living in Andover, Massachusetts as of April 27, 2024.
The ratio of all residents to sex offenders in Andover is 2,327 to 1.
The ratio of registered sex offenders to all residents in this city is lower than the state average.
Type |
2009 |
2010 |
2011 |
2012 |
2013 |
2014 |
2015 |
2016 |
2017 |
2018 |
2019 |
2020 |
2021 |
2022 |
|---|---|---|---|---|---|---|---|---|---|---|---|---|---|---|
| Murders (per 100,000) | 0 (0.0) | 0 (0.0) | 2 (6.0) | 0 (0.0) | 0 (0.0) | 0 (0.0) | 0 (0.0) | 0 (0.0) | 0 (0.0) | 0 (0.0) | 0 (0.0) | 0 (0.0) | 0 (0.0) | 0 (0.0) |
| Rapes (per 100,000) | 3 (8.9) | 2 (6.0) | 2 (6.0) | 1 (3.0) | 3 (8.7) | 4 (11.5) | 1 (2.8) | 3 (8.4) | 5 (13.9) | 5 (13.8) | 6 (16.4) | 3 (8.2) | 0 (0.0) | 5 (13.6) |
| Robberies (per 100,000) | 4 (11.8) | 4 (12.0) | 4 (12.0) | 2 (5.9) | 1 (2.9) | 3 (8.6) | 2 (5.6) | 2 (5.6) | 3 (8.4) | 1 (2.8) | 0 (0.0) | 0 (0.0) | 0 (0.0) | 2 (5.5) |
| Assaults (per 100,000) | 13 (38.4) | 9 (27.1) | 7 (21.0) | 20 (59.3) | 16 (46.3) | 9 (25.8) | 16 (45.0) | 18 (50.6) | 57 (158.8) | 15 (41.3) | 1 (2.7) | 4 (10.9) | 4 (10.7) | 36 (98.3) |
| Burglaries (per 100,000) | 60 (177.2) | 75 (225.9) | 52 (155.7) | 50 (148.1) | 39 (112.9) | 22 (63.1) | 35 (98.4) | 28 (78.7) | 25 (69.6) | 28 (77.1) | 29 (79.3) | 38 (104.0) | 37 (99.4) | 26 (71.0) |
| Thefts (per 100,000) | 349 (1,031) | 239 (719.9) | 233 (697.5) | 226 (669.6) | 255 (738.5) | 213 (610.6) | 246 (691.7) | 174 (489.3) | 238 (663.0) | 147 (404.7) | 179 (489.8) | 138 (377.7) | 152 (408.4) | 146 (398.6) |
| Auto thefts (per 100,000) | 13 (38.4) | 17 (51.2) | 24 (71.8) | 14 (41.5) | 20 (57.9) | 17 (48.7) | 10 (28.1) | 14 (39.4) | 23 (64.1) | 7 (19.3) | 7 (19.2) | 8 (21.9) | 9 (24.2) | 11 (30.0) |
| Arson (per 100,000) | 5 (14.8) | 3 (9.0) | 3 (9.0) | 0 (0.0) | 0 (0.0) | 2 (5.7) | 1 (2.8) | 3 (8.4) | 1 (2.8) | 1 (2.8) | 0 (0.0) | 0 (0.0) | 1 (2.7) | 1 (2.7) |
| City-Data.com crime index | 75.0 | 62.6 | 69.1 | 56.5 | 59.2 | 49.7 | 49.7 | 46.8 | 81.9 | 43.2 | 40.4 | 32.9 | 27.4 | 55.5 |
The City-Data.com crime index weighs serious crimes and violent crimes more heavily. Higher means more crime, U.S. average is 246.1. It adjusts for the number of visitors and daily workers commuting into cities.
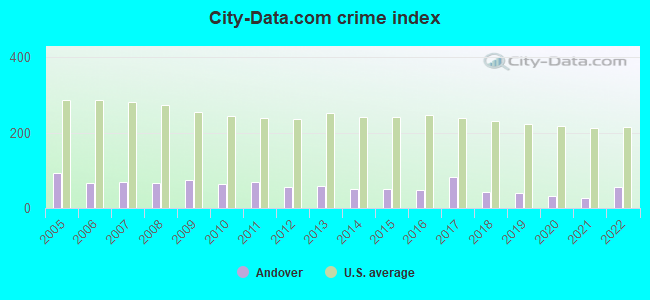
Crime rate in Andover detailed stats: murders, rapes, robberies, assaults, burglaries, thefts, arson
Full-time law enforcement employees in 2021, including police officers: 68 (49 officers - 47 male; 2 female).
| Officers per 1,000 residents here: | 1.32 |
| Massachusetts average: | 2.53 |
 Recent articles from our blog. Our writers, many of them Ph.D. graduates or candidates, create easy-to-read articles on a wide variety of topics.

 | Andover vs Lexington/Wincheste/Newton (25 replies) |
| What is the difference between Andover and No. Andover? (45 replies) |
| Custom builders for Andover/North Andover (5 replies) |
| Thinking of buying a house in Andover, moving from Beverly (23 replies) |
| Andover/Tri-town best for working single parent ? (10 replies) |
| Need food delivery asap in N. Andover following a death. (1 reply) |
Latest news from Andover, MA collected exclusively by city-data.com from local newspapers, TV, and radio stations
Ancestries: Irish (24.1%), Italian (11.6%), English (4.4%), American (4.2%), French Canadian (2.8%), Polish (2.8%).
Current Local Time: EST time zone
Incorporated in 1646
Elevation: 180 feet
Land area: 3.70 square miles.
Population density: 2,366 people per square mile (low).
1,356 residents are foreign born (6.7% Asia, 3.7% Latin America, 3.5% Europe).
| This place: | 14.4% |
| Massachusetts: | 17.6% |
Median real estate property taxes paid for housing units with mortgages in 2022: $8,568 (1.1%)
Median real estate property taxes paid for housing units with no mortgage in 2022: $8,776 (1.2%)
Nearest city with pop. 50,000+: Lawrence, MA  (3.4 miles , pop. 72,043).
Nearest city with pop. 200,000+: Boston, MA (23.3 miles , pop. 589,141).
Nearest city with pop. 1,000,000+: Bronx, NY (188.6 miles , pop. 1,332,650).
Nearest cities:
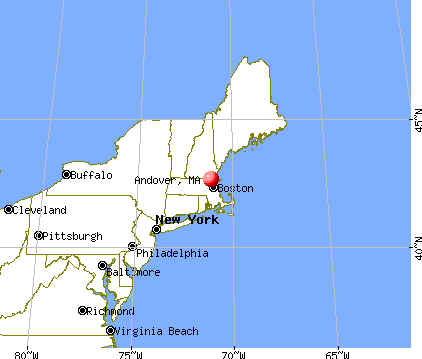
), Latitude: 42.66 N, Longitude: 71.14 W
Daytime population change due to commuting: +3,045 (+32.3%)
Workers who live and work in this place: 2,087 (42.5%)
Area codes: 978, 508
Andover, Massachusetts accommodation & food services, waste management - Economy and Business Data
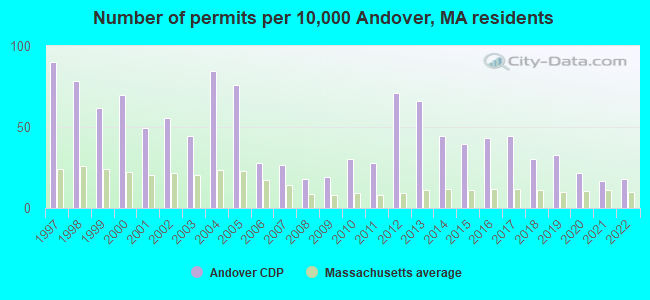
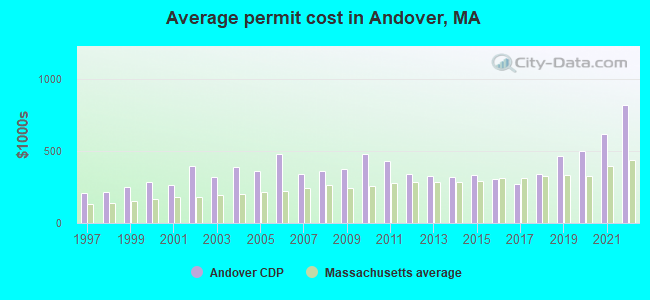
Single-family new house construction building permits:
- 2022: 14 buildings, average cost: $817,300
- 2021: 13 buildings, average cost: $616,600
- 2020: 17 buildings, average cost: $499,600
- 2019: 26 buildings, average cost: $463,000
- 2018: 24 buildings, average cost: $339,000
- 2017: 35 buildings, average cost: $267,400
- 2016: 34 buildings, average cost: $305,600
- 2015: 31 buildings, average cost: $332,000
- 2014: 35 buildings, average cost: $320,600
- 2013: 52 buildings, average cost: $325,000
- 2012: 56 buildings, average cost: $336,500
- 2011: 22 buildings, average cost: $430,800
- 2010: 24 buildings, average cost: $477,600
- 2009: 15 buildings, average cost: $377,300
- 2008: 14 buildings, average cost: $361,400
- 2007: 21 buildings, average cost: $341,500
- 2006: 22 buildings, average cost: $477,500
- 2005: 60 buildings, average cost: $361,900
- 2004: 67 buildings, average cost: $387,600
- 2003: 35 buildings, average cost: $318,300
- 2002: 44 buildings, average cost: $394,500
- 2001: 39 buildings, average cost: $262,200
- 2000: 55 buildings, average cost: $283,400
- 1999: 49 buildings, average cost: $248,100
- 1998: 62 buildings, average cost: $212,300
- 1997: 71 buildings, average cost: $209,000
| Here: | 3.6% |
| Massachusetts: | 3.5% |
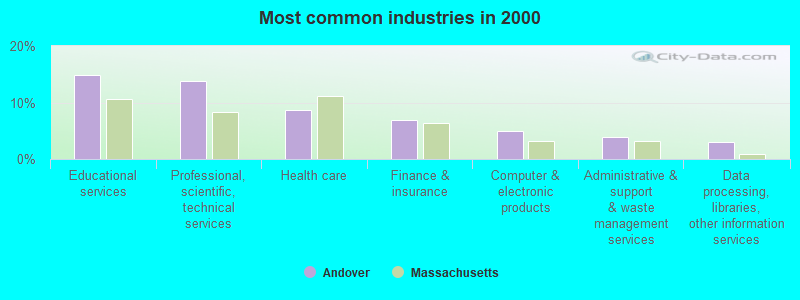
- Educational services (14.9%)
- Professional, scientific, technical services (13.8%)
- Health care (8.7%)
- Finance & insurance (6.8%)
- Computer & electronic products (4.9%)
- Administrative & support & waste management services (3.9%)
- Data processing, libraries, other information services (3.1%)

- Professional, scientific, technical services (15.5%)
- Educational services (9.4%)
- Computer & electronic products (7.9%)
- Finance & insurance (7.7%)
- Administrative & support & waste management services (5.5%)
- Construction (4.3%)
- Food & beverage stores (4.0%)
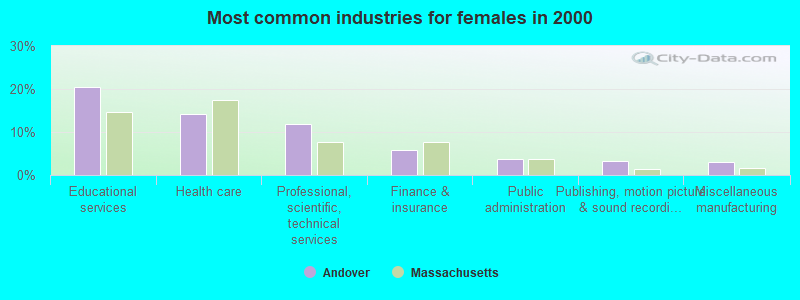
- Educational services (20.6%)
- Health care (14.3%)
- Professional, scientific, technical services (12.0%)
- Finance & insurance (5.9%)
- Public administration (3.7%)
- Publishing, motion picture & sound recording industries (3.3%)
- Miscellaneous manufacturing (3.0%)
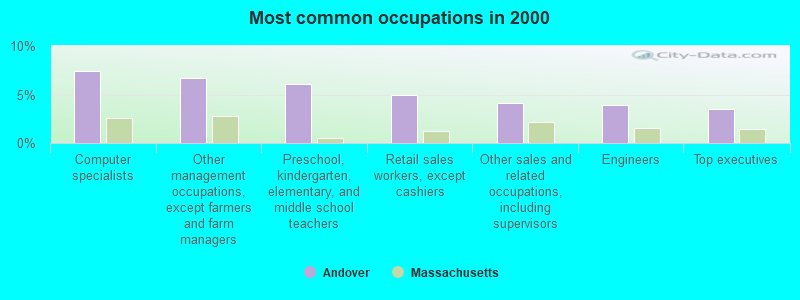
- Computer specialists (7.4%)
- Other management occupations, except farmers and farm managers (6.7%)
- Preschool, kindergarten, elementary, and middle school teachers (6.0%)
- Retail sales workers, except cashiers (5.0%)
- Other sales and related occupations, including supervisors (4.2%)
- Engineers (3.9%)
- Top executives (3.5%)

- Computer specialists (10.6%)
- Other management occupations, except farmers and farm managers (8.4%)
- Top executives (5.5%)
- Engineers (5.3%)
- Sales representatives, services, wholesale and manufacturing (4.7%)
- Preschool, kindergarten, elementary, and middle school teachers (4.3%)
- Retail sales workers, except cashiers (4.2%)

- Preschool, kindergarten, elementary, and middle school teachers (7.9%)
- Retail sales workers, except cashiers (5.8%)
- Other management occupations, except farmers and farm managers (5.0%)
- Registered nurses (4.9%)
- Other sales and related occupations, including supervisors (4.6%)
- Secretaries and administrative assistants (4.4%)
- Computer specialists (4.0%)
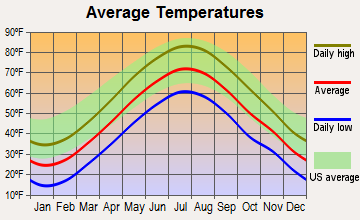
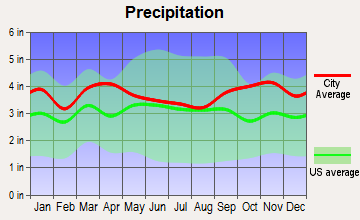
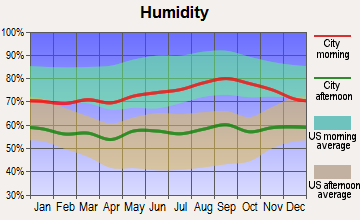
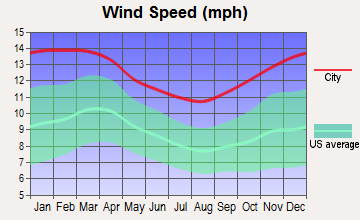
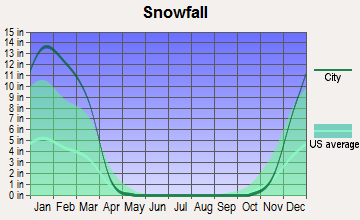
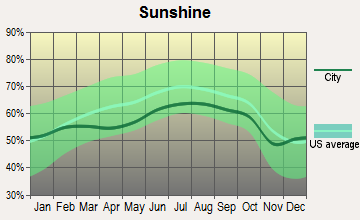
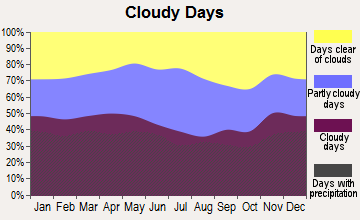
Average climate in Andover, Massachusetts
Based on data reported by over 4,000 weather stations
|
|

(lower is better)
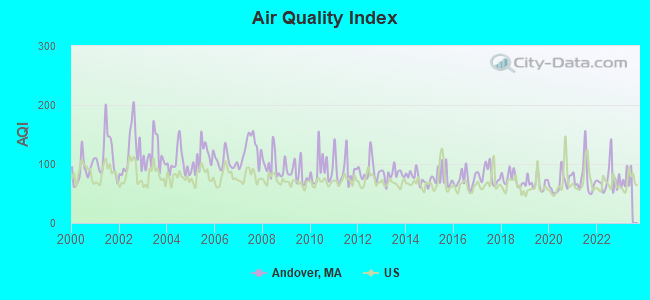
Air Quality Index (AQI) level in 2022 was 74.3. This is about average.
| City: | 74.3 |
| U.S.: | 72.6 |
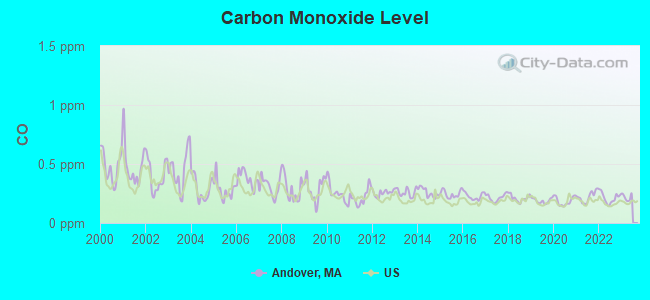
Carbon Monoxide (CO) [ppm] level in 2022 was 0.213. This is about average. Closest monitor was 5.3 miles away from the city center.
| City: | 0.213 |
| U.S.: | 0.251 |
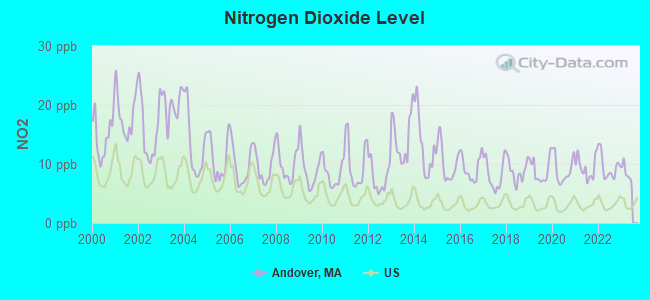
Nitrogen Dioxide (NO2) [ppb] level in 2022 was 9.45. This is significantly worse than average. Closest monitor was 3.5 miles away from the city center.
| City: | 9.45 |
| U.S.: | 5.11 |
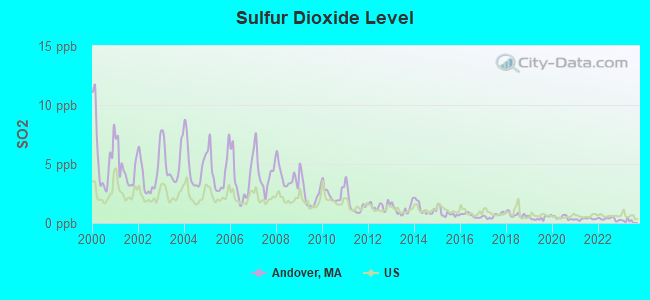
Sulfur Dioxide (SO2) [ppb] level in 2022 was 0.347. This is significantly better than average. Closest monitor was 3.5 miles away from the city center.
| City: | 0.347 |
| U.S.: | 1.515 |
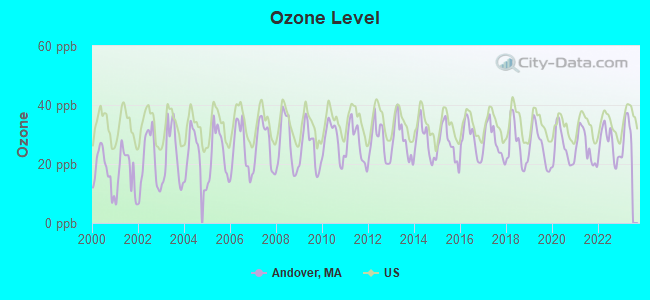
Ozone [ppb] level in 2022 was 26.8. This is better than average. Closest monitor was 3.6 miles away from the city center.
| City: | 26.8 |
| U.S.: | 33.3 |
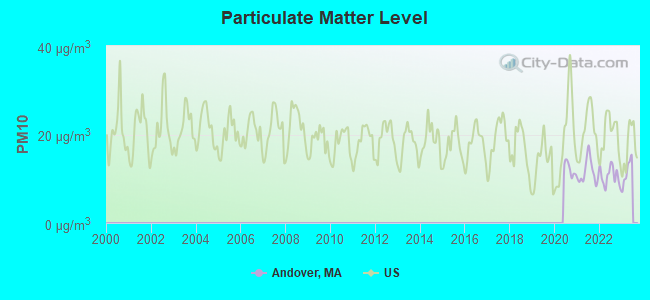
Particulate Matter (PM10) [µg/m3] level in 2022 was 10.6. This is significantly better than average. Closest monitor was 3.6 miles away from the city center.
| City: | 10.6 |
| U.S.: | 19.2 |
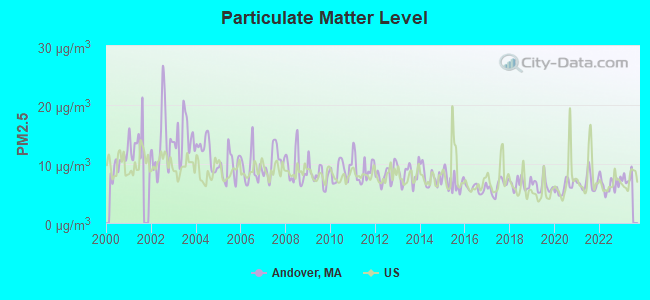
Particulate Matter (PM2.5) [µg/m3] level in 2022 was 6.53. This is better than average. Closest monitor was 3.1 miles away from the city center.
| City: | 6.53 |
| U.S.: | 8.11 |
Tornado activity:
Andover-area historical tornado activity is near Massachusetts state average. It is 40% smaller than the overall U.S. average.
On 9/29/1974, a category F3 (max. wind speeds 158-206 mph) tornado 4.0 miles away from the Andover place center injured one person and caused between $50,000 and $500,000 in damages.
On 6/9/1953, a category F4 (max. wind speeds 207-260 mph) tornado 31.4 miles away from the place center killed 90 people and injured 1228 people and caused between $50,000,000 and $500,000,000 in damages.
Earthquake activity:
Andover-area historical earthquake activity is significantly above Massachusetts state average. It is 73% smaller than the overall U.S. average.On 4/20/2002 at 10:50:47, a magnitude 5.3 (5.3 ML, Depth: 3.0 mi, Class: Moderate, Intensity: VI - VII) earthquake occurred 181.3 miles away from the city center
On 10/7/1983 at 10:18:46, a magnitude 5.3 (5.1 MB, 5.3 LG, 5.1 ML) earthquake occurred 184.4 miles away from Andover center
On 1/19/1982 at 00:14:42, a magnitude 4.7 (4.5 MB, 4.7 MD, 4.5 LG, Class: Light, Intensity: IV - V) earthquake occurred 62.8 miles away from the city center
On 10/16/2012 at 23:12:25, a magnitude 4.7 (4.7 ML, Depth: 10.0 mi) earthquake occurred 69.5 miles away from the city center
On 4/20/2002 at 10:50:47, a magnitude 5.2 (5.2 MB, 4.2 MS, 5.2 MW, 5.0 MW) earthquake occurred 180.8 miles away from Andover center
On 8/22/1992 at 12:20:32, a magnitude 4.8 (4.8 MB, 3.8 MS, 4.7 LG, Depth: 6.2 mi) earthquake occurred 249.3 miles away from the city center
Magnitude types: regional Lg-wave magnitude (LG), body-wave magnitude (MB), duration magnitude (MD), local magnitude (ML), surface-wave magnitude (MS), moment magnitude (MW)
Natural disasters:
The number of natural disasters in Essex County (33) is a lot greater than the US average (15).Major Disasters (Presidential) Declared: 20
Emergencies Declared: 13
Causes of natural disasters: Floods: 14, Storms: 11, Hurricanes: 6, Snowstorms: 5, Winter Storms: 5, Snows: 3, Blizzards: 2, Fire: 1, Heavy Rain: 1, Snowfall: 1, Water Main Break: 1, Wind: 1 (Note: some incidents may be assigned to more than one category).
Main business address for: DYNAMICS RESEARCH CORP (SERVICES-COMPUTER INTEGRATED SYSTEMS DESIGN), ENTERASYS NETWORKS INC /DE/ (COMPUTER COMMUNICATIONS EQUIPMENT), NAVISITE INC (SERVICES-BUSINESS SERVICES, NEC), MED DIVERSIFIED INC (SERVICES-HOME HEALTH CARE SERVICES), VICOR CORP (ELECTRONIC COMPONENTS, NEC).
Hospitals and medical centers in Andover:
Heliports located in Andover:
College/University in Andover:
Colleges/universities with over 2000 students nearest to Andover:
- Merrimack College (about 2 miles; North Andover, MA; Full-time enrollment: 2,734)
- University of Massachusetts-Lowell (about 10 miles; Lowell, MA; FT enrollment: 12,341)
- North Shore Community College (about 10 miles; Danvers, MA; FT enrollment: 5,195)
- Northern Essex Community College (about 11 miles; Haverhill, MA; FT enrollment: 4,737)
- Middlesex Community College (about 12 miles; Bedford, MA; FT enrollment: 6,040)
- Salem State University (about 17 miles; Salem, MA; FT enrollment: 8,027)
- Endicott College (about 17 miles; Beverly, MA; FT enrollment: 4,064)
Public high schools in Andover:
- ANDOVER HIGH (Students: 1,746, Location: 80 SHAWSHEEN ROAD, Grades: 9-12)
- GR LAWRENCE REGIONAL VOCATIONAL TECHNICAL (Location: 57 RIVER RD, Grades: 9-12)
Private high school in Andover:
Public elementary/middle schools in Andover:
- WEST ELEMENTARY (Students: 646, Location: 58 BEACON STREET, Grades: PK-5)
- SOUTH ELEMENTARY (Students: 557, Location: 55 WOBURN STREET, Grades: KG-5)
- DOHERTY MIDDLE (Students: 556, Location: 50 BARTLET STREET, Grades: 6-8)
- HIGH PLAIN ELEMENTARY (Students: 533, Location: 333 HIGH PLAIN ROAD, Grades: KG-5)
- ANDOVER WEST MIDDLE (Students: 508, Location: 70 SHAWSHEEN ROAD, Grades: 6-8)
- BANCROFT ELEMENTARY (Students: 461, Location: 15 BANCROFT STREET, Grades: KG-5)
- WOOD HILL MIDDLE SCHOOL (Students: 394, Location: 11 CROSS STREET, Grades: 6-8)
- HENRY C SANBORN ELEMENTARY (Students: 355, Location: 90 LOVEJOY ROAD, Grades: KG-5)
- SHAWSHEEN SCHOOL (Students: 242, Location: 18 MAGNOLIA AVE, Grades: PK-2)
Private elementary/middle schools in Andover:
Points of interest:
Notable locations in Andover: Andover Station (A), Shawsheen Plaza (B), Caroline M Underhill Research Library (C), Andover Fire Department Station 1 Headquarters (D), Andover Historical Society Building (E), Andover Town Hall (F). Display/hide their locations on the map
Churches in Andover include: Free Christian Church (A), First Church of Christ Scientist (B), Christ Church (C), Andover Baptist Church (D). Display/hide their locations on the map
Cemeteries: Saint Augustines Cemetery (1), Spring Grove Cemetery (2). Display/hide their locations on the map
Lakes and reservoirs: Rabbit Pond (A), Shawsheen River Reservoir (B). Display/hide their locations on the map
Streams, rivers, and creeks: Hussey Brook (A), Rogers Brook (B). Display/hide their locations on the map
Tourist attractions: Addison Gallery of American Art (Museums; South Main), Jeff's Pinball & Jukebox Manuals (Arcades & Amusements; 6 Pinecrest Road).
Hotels: Andover Marriott Hotel (123 River Road), Comfort Suites Andover (4 Riverside Drive), Merrimax (123 River Road), Courtyard Andover (10 Campanelli Drive), Comfort Suites (4 Riverside Dr), Ramada Rolling Green (311 Lowell St).
Court: Snap Court (191 Chandler).
Birthplace of: Bill Cunliffe - Composer, Ed Doherty (American football) - Football player and coach, Arthur Sherburne Hardy - Engineer, Brian Darling - Lawyer, John Horne Burns - Novelist, Samuel Osgood - Politician, Ted Coy - Football player and coach, Zak DeOssie - Football player, Evan Hatch - Professional wrestler, Abiel Foster - Politician.
Drinking water stations with addresses in Andover and their reported violations in the past:
ANDOVER WATER DEPT (Population served: 33,201, Surface water):Past monitoring violations:JACK O LANTERN CONDOS (Serves NH, Population served: 98, Groundwater):
- One regular monitoring violation
Past health violations:
- MCL, Average - Between JAN-2014 and MAR-2014, Contaminant: Combined Radium (-226 and -228). Follow-up actions: St Public Notif requested (MAR-05-2014), St Violation/Reminder Notice (MAR-05-2014), St Public Notif received (APR-03-2014), St Formal NOV issued (APR-21-2014)
- MCL, Average - Between OCT-2013 and DEC-2013, Contaminant: Combined Radium (-226 and -228). Follow-up actions: St Public Notif requested (NOV-15-2013), St Violation/Reminder Notice (NOV-15-2013), St Public Notif received (DEC-23-2013), St Formal NOV issued (APR-21-2014)
Drinking water stations with addresses in Andover that have no violations reported:
- REGENCY AT BOLTON CONDOMINIUMS (Population served: 148, Primary Water Source Type: Groundwater)
- POLLARD SHORE COTTAGES (Serves NH, Population served: 42, Primary Water Source Type: Groundwater)
| This place: | 2.3 people |
| Massachusetts: | 2.5 people |
| This place: | 58.6% |
| Whole state: | 63.0% |
| This place: | 4.6% |
| Whole state: | 7.0% |
Likely homosexual households (counted as self-reported same-sex unmarried-partner households)
- Lesbian couples: 0.5% of all households
- Gay men: 0.3% of all households
People in group quarters in Andover in 2010:
- 845 people in college/university student housing
- 259 people in nursing facilities/skilled-nursing facilities
- 149 people in workers' group living quarters and job corps centers
- 14 people in group homes intended for adults
- 7 people in group homes for juveniles (non-correctional)
- 4 people in other noninstitutional facilities
12 people in homes for the mentally retarded in 2000
Banks with most branches in Andover (2011 data):
- People's United Bank: Shawsheen Branch, Andover Branch, Andover Branch. Info updated 2012/02/16: Bank assets: $27,319.3 mil, Deposits: $20,835.4 mil, headquarters in Bridgeport, CT, positive income, Commercial Lending Specialization, 374 total offices
- Sovereign Bank, National Association: Andover Branch at 71 Main Street, branch established on 1995/02/16; North Main Street Branch at 211 North Main Street, branch established on 1977/09/10. Info updated 2012/01/31: Bank assets: $78,146.9 mil, Deposits: $48,042.9 mil, headquarters in Wilmington, DE, positive income, Commercial Lending Specialization, 718 total offices, Holding Company: Banco Santander, S.A.
- Enterprise Bank and Trust Company: Andover Branch at 8 & 8 Rear High Street, branch established on 2004/03/15. Info updated 2006/11/03: Bank assets: $1,488.4 mil, Deposits: $1,333.6 mil, headquarters in Lowell, MA, positive income, Commercial Lending Specialization, 20 total offices, Holding Company: Enterprise Bancorp, Inc.
- RBS Citizens, National Association: Andover Branch at 209 North Main Street, branch established on 2005/03/07. Info updated 2007/09/19: Bank assets: $106,940.6 mil, Deposits: $75,690.2 mil, headquarters in Providence, RI, positive income, 1135 total offices, Holding Company: Uk Financial Investments Limited
- Bank of America, National Association: Andover Main Branch at 23 Main Street, branch established on 1814/04/01. Info updated 2009/11/18: Bank assets: $1,451,969.3 mil, Deposits: $1,077,176.8 mil, headquarters in Charlotte, NC, positive income, 5782 total offices, Holding Company: Bank Of America Corporation
- The Savings Bank: Andover Branch at 84 Main Street, branch established on 1997/02/10. Info updated 2009/07/02: Bank assets: $443.8 mil, Deposits: $385.0 mil, headquarters in Wakefield, MA, positive income, 9 total offices
- TD Bank, National Association: Andover Bank Branch at 61 Main Street, branch established on 1834/04/02. Info updated 2010/10/04: Bank assets: $188,912.6 mil, Deposits: $153,149.8 mil, headquarters in Wilmington, DE, positive income, 1314 total offices, Holding Company: Toronto-Dominion Bank, The
- Northmark Bank: Andover Branch at 69 Park Street, branch established on 2005/05/02. Info updated 2006/11/03: Bank assets: $305.6 mil, Deposits: $261.3 mil, headquarters in North Andover, MA, positive income, Commercial Lending Specialization, 3 total offices
- Eastern Bank: Andover Branch at 60 Main Street, branch established on 2010/08/16. Info updated 2011/03/30: Bank assets: $7,812.9 mil, Deposits: $6,295.8 mil, headquarters in Boston, MA, positive income, Commercial Lending Specialization, 94 total offices, Holding Company: Eastern Bank Corporation
- 2 other banks with 2 local branches
For population 15 years and over in Andover:
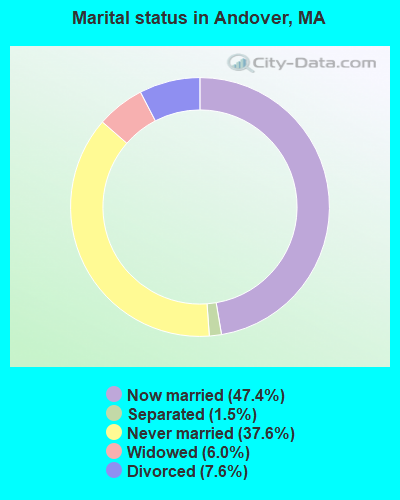
- Never married: 37.6%
- Now married: 47.4%
- Separated: 1.5%
- Widowed: 6.0%
- Divorced: 7.6%
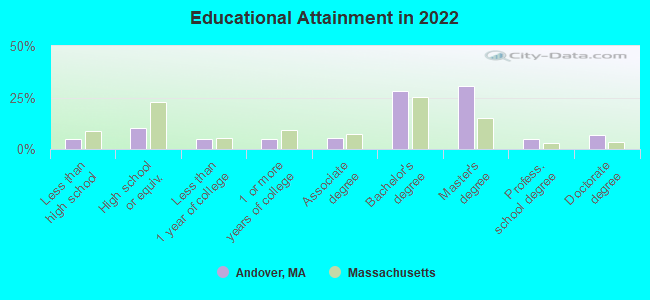
For population 25 years and over in Andover:
- High school or higher: 95.0%
- Bachelor's degree or higher: 70.2%
- Graduate or professional degree: 41.7%
- Unemployed: 2.0%
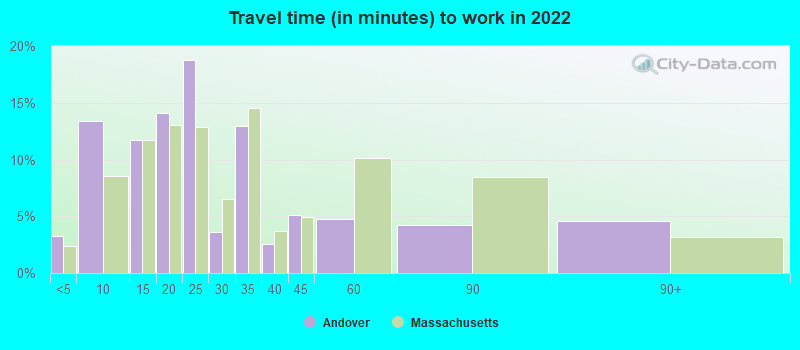
- Mean travel time to work (commute): 16.6 minutes
| Here: | 10.7 |
| Massachusetts average: | 13.0 |
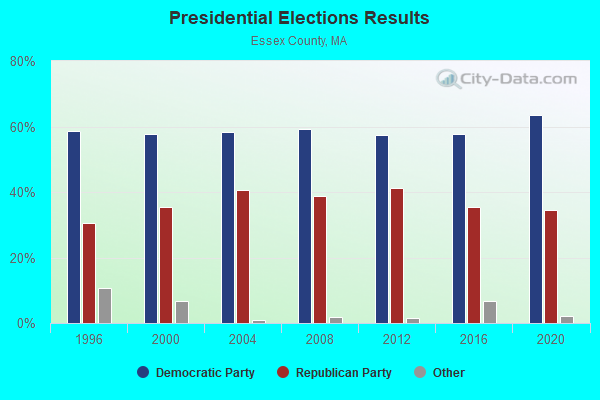
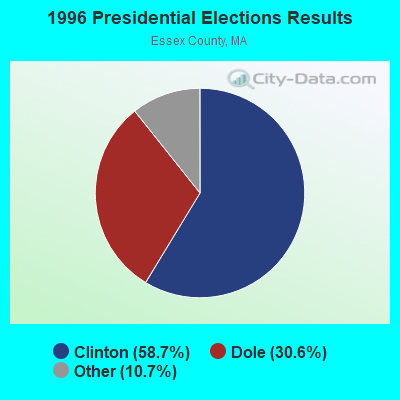
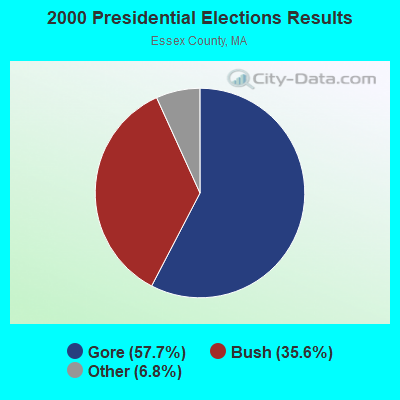
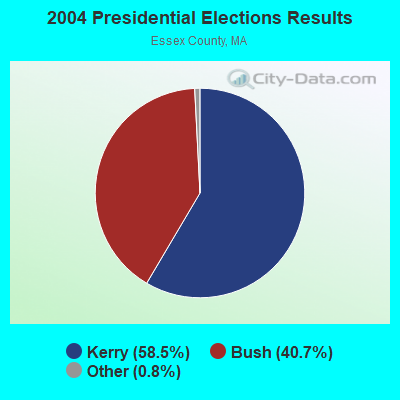
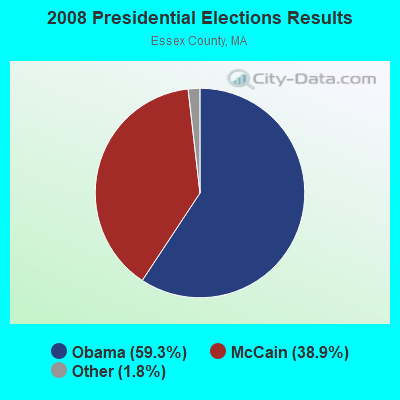
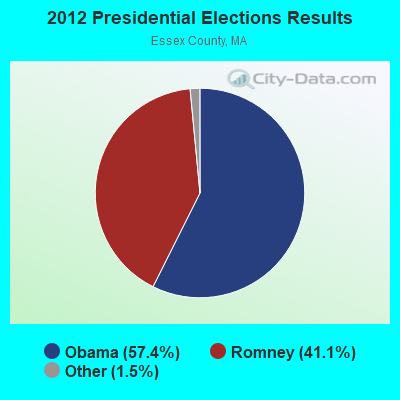
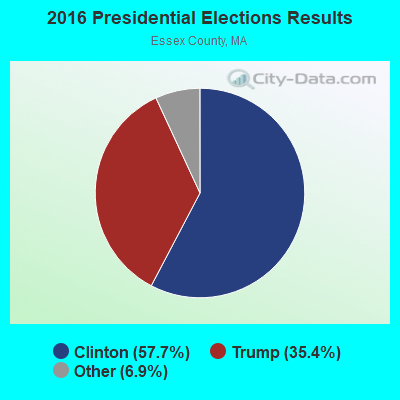
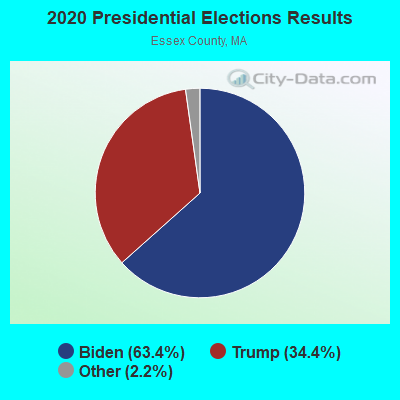
Graphs represent county-level data. Detailed 2008 Election Results
Religion statistics for Andover, MA (based on Essex County data)
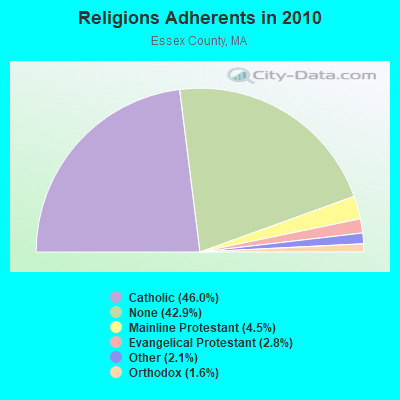
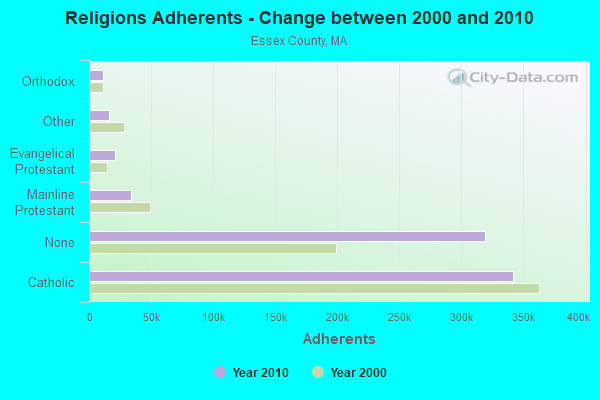
| Religion | Adherents | Congregations |
|---|---|---|
| Catholic | 341,970 | 55 |
| Mainline Protestant | 33,710 | 140 |
| Evangelical Protestant | 20,925 | 160 |
| Other | 15,882 | 63 |
| Orthodox | 11,590 | 13 |
| Black Protestant | 376 | 3 |
| None | 318,706 | - |
Food Environment Statistics:
| Essex County: | 1.98 / 10,000 pop. |
| Massachusetts: | 1.98 / 10,000 pop. |
| This county: | 0.04 / 10,000 pop. |
| State: | 0.05 / 10,000 pop. |
| Essex County: | 1.97 / 10,000 pop. |
| Massachusetts: | 2.22 / 10,000 pop. |
| Essex County: | 1.30 / 10,000 pop. |
| State: | 1.77 / 10,000 pop. |
| Here: | 7.60 / 10,000 pop. |
| State: | 8.76 / 10,000 pop. |
| This county: | 8.4% |
| Massachusetts: | 8.1% |
| Essex County: | 23.7% |
| Massachusetts: | 22.5% |
| This county: | 20.7% |
| State: | 16.5% |
Health and Nutrition:
| This city: | 59.7% |
| State: | 50.5% |
| Andover: | 60.3% |
| Massachusetts: | 48.0% |
| Andover: | 27.7 |
| Massachusetts: | 28.4 |
| This city: | 16.7% |
| State: | 20.7% |
| Andover: | 8.3% |
| Massachusetts: | 10.4% |
| Andover: | 7.0 |
| Massachusetts: | 6.8 |
| This city: | 34.3% |
| Massachusetts: | 33.4% |
| Andover: | 64.7% |
| Massachusetts: | 57.1% |
| This city: | 81.0% |
| State: | 79.2% |
More about Health and Nutrition of Andover, MA Residents
5.09% of this county's 2021 resident taxpayers lived in other counties in 2020 ($96,821 average adjusted gross income)
| Here: | 5.09% |
| Massachusetts average: | 6.35% |
0.01% of residents moved from foreign countries ($21 average AGI)
Essex County: 0.01% Massachusetts average: 0.01%
Top counties from which taxpayers relocated into this county between 2020 and 2021:
| from Middlesex County, MA | |
| from Suffolk County, MA | |
| from Rockingham County, NH |
5.47% of this county's 2020 resident taxpayers moved to other counties in 2021 ($95,440 average adjusted gross income)
| Here: | 5.47% |
| Massachusetts average: | 7.18% |
0.01% of residents moved to foreign countries ($53 average AGI)
Essex County: 0.01% Massachusetts average: 0.02%
Top counties to which taxpayers relocated from this county between 2020 and 2021:
| to Middlesex County, MA | |
| to Rockingham County, NH | |
| to Suffolk County, MA |
| Businesses in Andover, MA | ||||
| Name | Count | Name | Count | |
|---|---|---|---|---|
| CVS | 1 | McDonald's | 1 | |
| Chevrolet | 1 | Nike | 1 | |
| Decora Cabinetry | 2 | RadioShack | 1 | |
| Domino's Pizza | 1 | Rite Aid | 1 | |
| Dunkin Donuts | 4 | SAS Shoes | 1 | |
| FedEx | 6 | Starbucks | 1 | |
| H&R Block | 1 | Stop & Shop | 1 | |
| Holiday Inn | 1 | T-Mobile | 1 | |
| La Quinta | 1 | UPS | 9 | |
| Marriott | 3 | Whole Foods Market | 1 | |
| Marshalls | 1 | YMCA | 1 | |
| MasterBrand Cabinets | 3 | |||
Strongest AM radio stations in Andover:
- WRKO (680 AM; 50 kW; BOSTON, MA; Owner: ENTERCOM BOSTON LICENSE, LLC)
- WNNW (800 AM; 1 kW; LAWRENCE, MA; Owner: COSTA-EAGLE RADIO VENTURES, LP)
- WWZN (1510 AM; 50 kW; BOSTON, MA; Owner: ROSE CITY RADIO CORPORATION)
- WEEI (850 AM; 50 kW; BOSTON, MA; Owner: ENTERCOM BOSTON LICENSE, LLC)
- WBZ (1030 AM; 50 kW; BOSTON, MA; Owner: INFINITY BROADCASTING OPERATIONS, INC.)
- WKOX (1200 AM; 50 kW; FRAMINGHAM, MA; Owner: CAPSTAR TX LIMITED PARTNERSHIP)
- WCEC (1110 AM; daytime; 5 kW; SALEM, NH; Owner: COSTA-EAGLE RADIO VENTURES LTD PARTNERSHIP)
- WBIX (1060 AM; 40 kW; NATICK, MA; Owner: LANGER BROADCASTING CORPORATION)
- WRCA (1330 AM; 25 kW; WALTHAM, MA; Owner: WRCA LICENSE, LLC)
- WCAP (980 AM; 5 kW; LOWELL, MA; Owner: NORTHEAST RADIO, INC.)
- WDER (1320 AM; 10 kW; DERRY, NH; Owner: BLOUNT COMMUNICATIONS, INC. OF NH)
- WAMG (890 AM; 25 kW; DEDHAM, MA; Owner: MEGA COMMUNICATIONS OF DEDHAM LICENSEE, LLC)
- WEZE (590 AM; 5 kW; BOSTON, MA; Owner: NEW ENGLAND CONTINENTAL MEDIA, INC.)
Strongest FM radio stations in Andover:
- WKLB-FM (99.5 FM; LOWELL, MA; Owner: GREATER BOSTON RADIO, INC.)
- W227AM (93.3 FM; ANDOVER, MA; Owner: GREATER BOSTON RADIO, INC.)
- WPAA (91.7 FM; ANDOVER, MA; Owner: TRUSTEES OF PHILLIPS ACADEMY)
- WXRV (92.5 FM; HAVERHILL, MA; Owner: BEANPOT BROADCASTING CORP.)
- WQSX (93.7 FM; LAWRENCE, MA; Owner: ENTERCOM BOSTON LICENSE, LLC)
- WXKS-FM (107.9 FM; MEDFORD, MA; Owner: AMFM RADIO LICENSES, L.L.C.)
- WMJX (106.7 FM; BOSTON, MA; Owner: GREATER BOSTON RADIO, INC.)
- WBMX (98.5 FM; BOSTON, MA; Owner: INFINITY RADIO OPERATIONS INC.)
- WJMN (94.5 FM; BOSTON, MA; Owner: AMFM RADIO LICENSES, L.L.C.)
- WCRB (102.5 FM; WALTHAM, MA; Owner: CHARLES RIVER BROADCASTING WCRB LICE)
- WTKK (96.9 FM; BOSTON, MA; Owner: GREATER BOSTON RADIO, INC.)
- WHOB (106.3 FM; NASHUA, NH; Owner: TELE-MEDIA COMPANY OF NEW HAMPSHIRE, L.L.C.)
- WROR-FM (105.7 FM; FRAMINGHAM, MA; Owner: GREATER BOSTON RADIO, INC.)
- WBOS (92.9 FM; BROOKLINE, MA; Owner: GREATER BOSTON RADIO, INC.)
- WGBH (89.7 FM; BOSTON, MA; Owner: WGBH EDUCATIONAL FOUNDATION)
- WBUR-FM (90.9 FM; BOSTON, MA; Owner: TRUSTEES OF BOSTON UNIVERSITY)
- WBCN (104.1 FM; BOSTON, MA; Owner: HEMISPHERE BROADCASTING CORPORATION)
- WZLX (100.7 FM; BOSTON, MA; Owner: INFINITY BROADCASTING CORPORATION OF BOSTON)
- W267AI (101.3 FM; BOSTON, MA; Owner: MCC BROADCASTING COMPANY, INC.)
- WODS (103.3 FM; BOSTON, MA; Owner: INFINITY BROADCASTING OPERATIONS, INC.)
TV broadcast stations around Andover:
- WFXZ-CA (Channel 24; BOSTON, MA; Owner: BOSTON BROADCASTING CORP.)
- WCVB-TV (Channel 5; BOSTON, MA; Owner: WCVB HEARST-ARGYLE TV, INC.)
- WGBH-TV (Channel 2; BOSTON, MA; Owner: WGBH EDUCATIONAL FOUNDATION)
- WHDH-TV (Channel 7; BOSTON, MA; Owner: WHDH-TV)
- WMFP (Channel 62; LAWRENCE, MA; Owner: WSAH LICENSE, INC.)
- WBZ-TV (Channel 4; BOSTON, MA; Owner: VIACOM INC.)
- WGBX-TV (Channel 44; BOSTON, MA; Owner: WGBH EDUCATIONAL FOUNDATION)
- WSBK-TV (Channel 38; BOSTON, MA; Owner: VIACOM INC.)
- WLVI-TV (Channel 56; CAMBRIDGE, MA; Owner: WLVI, INC.)
- WBPX (Channel 68; BOSTON, MA; Owner: PAXSON BOSTON-68 LICENSE, INC.)
- WFXT (Channel 25; BOSTON, MA; Owner: FOX TELEVISION STATIONS INC.)
- WUTF (Channel 66; MARLBOROUGH, MA; Owner: TELEFUTURA BOSTON LLC)
- WNDS (Channel 50; DERRY, NH; Owner: CTV OF DERRY, INC)
- WTMU-LP (Channel 32; BOSTON, MA; Owner: ZGS BOSTON, INC.)
- WCEA-LP (Channel 58; BOSTON, MA; Owner: CHANNEL 19 TV CORPORATION)
- WHDN-LP (Channel 26; BOSTON, MA; Owner: GUENTER MARKSTEINER)
- W40BO (Channel 40; BOSTON, MA; Owner: PAXSON COMMUNICATIONS LPTV, INC.)
- WUNI (Channel 27; WORCESTER, MA; Owner: ENTRAVISION HOLDINGS, LLC)
- WMEA-TV (Channel 26; BIDDEFORD, ME; Owner: MAINE PUBLIC BROADCASTING CORP.)
- WWDP (Channel 46; NORWELL, MA; Owner: NORWELL TELEVISION, LLC)
Medal of Honor Recipients
Medal of Honor Recipients born in Andover: Henry F. Chandler, William Marland.
- National Bridge Inventory (NBI) Statistics
- 12Number of bridges
- 69ft / 20.6mTotal length
- $16,349,000Total costs
- 226,660Total average daily traffic
- 7,299Total average daily truck traffic
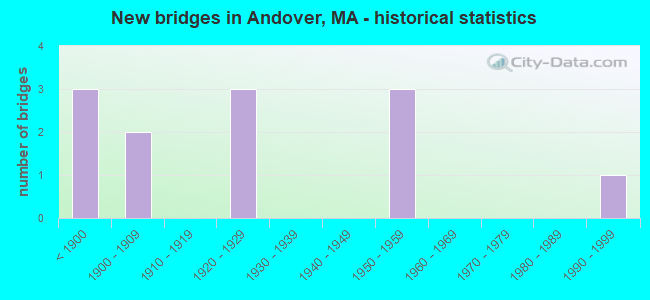
- New bridges - historical statistics
- 3Before 1900
- 21900-1909
- 31920-1929
- 31950-1959
- 11990-1999
FCC Registered Commercial Land Mobile Towers: 4 (See the full list of FCC Registered Commercial Land Mobile Towers in Andover, MA)
FCC Registered Private Land Mobile Towers: 4 (See the full list of FCC Registered Private Land Mobile Towers)
FCC Registered Broadcast Land Mobile Towers: 37 (See the full list of FCC Registered Broadcast Land Mobile Towers)
FCC Registered Microwave Towers: 43 (See the full list of FCC Registered Microwave Towers in this town)
FCC Registered Paging Towers: 10 (See the full list of FCC Registered Paging Towers)
FCC Registered Amateur Radio Licenses: 212 (See the full list of FCC Registered Amateur Radio Licenses in Andover)
FAA Registered Aircraft: 34 (See the full list of FAA Registered Aircraft in Andover)
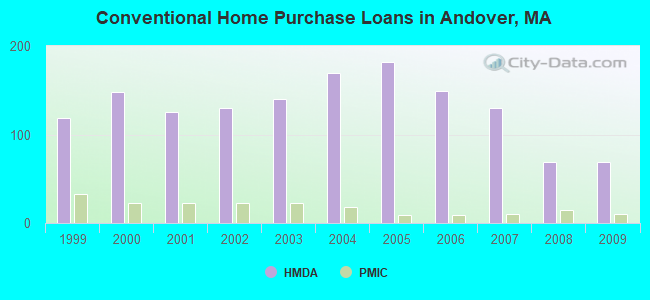
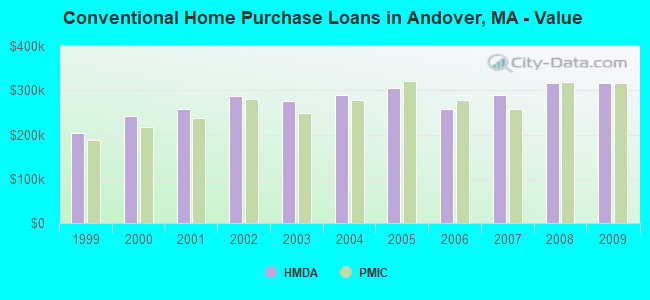
| Home Mortgage Disclosure Act Aggregated Statistics For Year 2009 (Based on 1 full and 3 partial tracts) | ||||||||||||
| A) FHA, FSA/RHS & VA Home Purchase Loans | B) Conventional Home Purchase Loans | C) Refinancings | D) Home Improvement Loans | E) Loans on Dwellings For 5+ Families | F) Non-occupant Loans on < 5 Family Dwellings (A B C & D) | |||||||
|---|---|---|---|---|---|---|---|---|---|---|---|---|
| Number | Average Value | Number | Average Value | Number | Average Value | Number | Average Value | Number | Average Value | Number | Average Value | |
| LOANS ORIGINATED | 13 | $313,758 | 69 | $315,866 | 347 | $297,489 | 19 | $162,021 | 1 | $90,000 | 12 | $217,629 |
| APPLICATIONS APPROVED, NOT ACCEPTED | 1 | $698,320 | 2 | $367,650 | 22 | $319,856 | 1 | $49,380 | 0 | $0 | 1 | $192,030 |
| APPLICATIONS DENIED | 1 | $234,610 | 5 | $352,794 | 40 | $316,201 | 5 | $118,588 | 0 | $0 | 2 | $186,755 |
| APPLICATIONS WITHDRAWN | 3 | $382,720 | 6 | $355,273 | 38 | $281,136 | 3 | $306,663 | 0 | $0 | 1 | $193,510 |
| FILES CLOSED FOR INCOMPLETENESS | 0 | $0 | 1 | $490,570 | 11 | $317,077 | 0 | $0 | 0 | $0 | 0 | $0 |
Detailed HMDA statistics for the following Tracts: 2541.00 , 2542.00, 2543.01, 2544.01
| Private Mortgage Insurance Companies Aggregated Statistics For Year 2009 (Based on 1 full and 3 partial tracts) | ||||
| A) Conventional Home Purchase Loans | B) Refinancings | |||
|---|---|---|---|---|
| Number | Average Value | Number | Average Value | |
| LOANS ORIGINATED | 10 | $316,000 | 3 | $377,240 |
| APPLICATIONS APPROVED, NOT ACCEPTED | 4 | $279,425 | 2 | $196,835 |
| APPLICATIONS DENIED | 3 | $263,483 | 3 | $294,440 |
| APPLICATIONS WITHDRAWN | 0 | $0 | 2 | $155,000 |
| FILES CLOSED FOR INCOMPLETENESS | 0 | $0 | 0 | $0 |
Detailed PMIC statistics for the following Tracts: 2541.00 , 2542.00, 2543.01, 2544.01
2002 - 2018 National Fire Incident Reporting System (NFIRS) incidents
- Fire incident types reported to NFIRS in Andover, MA
- 87044.2%Structure Fires
- 54527.7%Outside Fires
- 36318.4%Mobile Property/Vehicle Fires
- 1929.7%Other
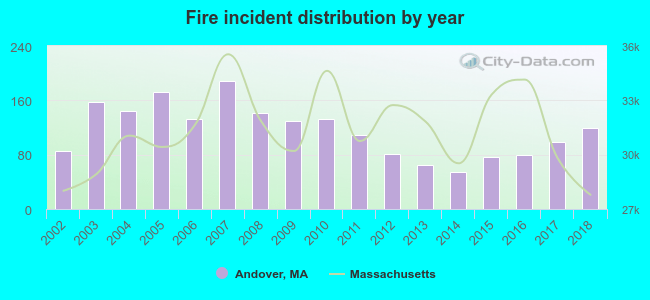 According to the data from the years 2002 - 2018 the average number of fire incidents per year is 116. The highest number of reported fires - 188 took place in 2007, and the least - 54 in 2014. The data has a rising trend.
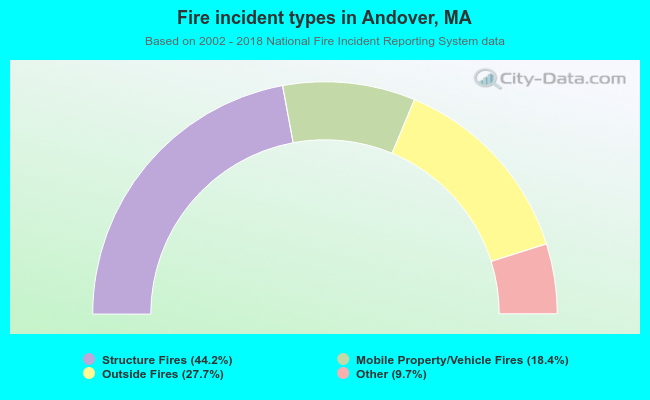 When looking into fire subcategories, the most reports belonged to: Structure Fires (44.2%), and Outside Fires (27.7%).
Fire-safe hotels and motels in Andover, Massachusetts:
- Wyndham Boston Andover Hotel, 123 Old River Rd, Andover, Massachusetts 01810 , Phone: (978) 975-3600, Fax: (978) 975-0383
- Courtyard By Marriott Andover, 10 Campanelli Dr, Andover, Massachusetts 01810 , Phone: (978) 794-0700, Fax: (978) 794-9558
- Homewood Suites By Hilton-Boston/Andover, 4 Riverside Dr, Andover, Massachusetts 01810 , Phone: (978) 475-6000, Fax: (978) 475-6639
- Sonesta Es Suites, 4 Tech Dr, Andover, Massachusetts 01810 , Phone: (978) 626-2000, Fax: (978) 686-2088
- Andover Residence Inn By Marriott, 500 Minuteman Rd, Andover, Massachusetts 01810 , Phone: (800) 331-3131, Fax: (978) 683-0384
- Springhill Suites By Marriott, 550 Minuteman Rd, Andover, Massachusetts 01810 , Phone: (978) 688-8200, Fax: (978) 688-0078
| Most common first names in Andover, MA among deceased individuals | ||
| Name | Count | Lived (average) |
|---|---|---|
| Mary | 302 | 83.3 years |
| John | 218 | 76.0 years |
| William | 155 | 74.4 years |
| Joseph | 129 | 76.8 years |
| Margaret | 126 | 83.7 years |
| Helen | 125 | 83.0 years |
| Robert | 123 | 73.3 years |
| James | 120 | 76.2 years |
| George | 114 | 74.9 years |
| Alice | 98 | 82.3 years |
| Most common last names in Andover, MA among deceased individuals | ||
| Last name | Count | Lived (average) |
|---|---|---|
| Smith | 41 | 78.8 years |
| Sullivan | 41 | 78.3 years |
| Murphy | 33 | 83.5 years |
| Mccarthy | 31 | 82.4 years |
| Anderson | 27 | 79.5 years |
| White | 25 | 79.0 years |
| Sweeney | 23 | 80.1 years |
| Johnson | 21 | 79.2 years |
| Brown | 21 | 79.3 years |
| Lynch | 20 | 78.4 years |
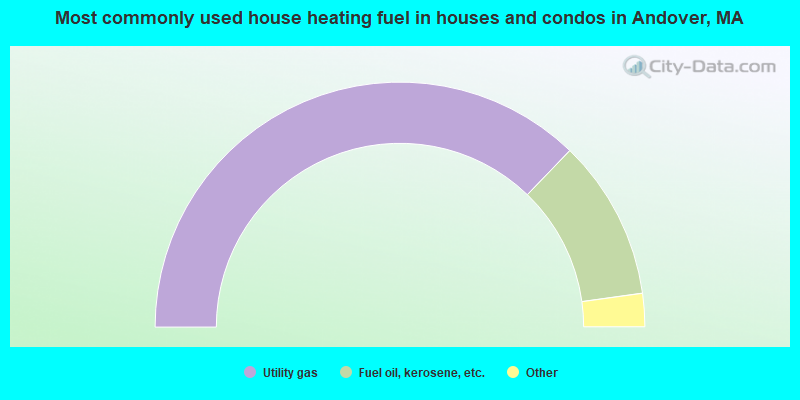
- 74.4%Utility gas
- 21.2%Fuel oil, kerosene, etc.
- 3.3%Electricity
- 0.5%Wood
- 0.5%Other fuel
- 0.1%Bottled, tank, or LP gas
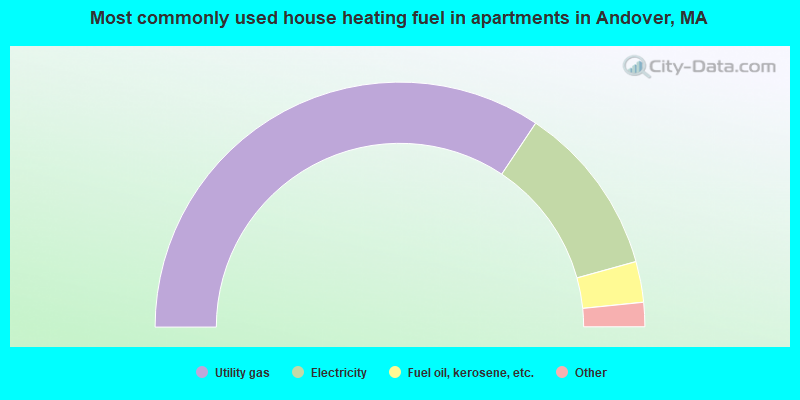
- 68.7%Utility gas
- 22.7%Electricity
- 5.4%Fuel oil, kerosene, etc.
- 1.4%Bottled, tank, or LP gas
- 1.0%No fuel used
- 0.7%Other fuel
Andover compared to Massachusetts state average:
- Unemployed percentage significantly below state average.
- Black race population percentage significantly below state average.
- Length of stay since moving in significantly above state average.
- Institutionalized population percentage above state average.
- Number of college students above state average.
- Percentage of population with a bachelor's degree or higher above state average.
Andover on our top lists:
- #50 on the list of "Top 101 cities with largest percentage of females in occupations: arts, design, entertainment, sports, and media occupations (population 5,000+)"
- #81 on the list of "Top 101 cities with largest percentage of females in industries: educational services (population 5,000+)"
- #92 on the list of "Top 101 cities with largest percentage of females in occupations: education, training, and library occupations (population 5,000+)"
- #21 on the list of "Top 101 counties with the lowest percentage of residents that keep firearms around their homes"
- #21 on the list of "Top 101 counties with the most Orthodox adherents"
- #23 on the list of "Top 101 counties with the highest carbon monoxide air pollution readings in 2012 (ppm)"
- #30 on the list of "Top 101 counties with the most Catholic adherents"
- #36 on the list of "Top 101 counties with the most Orthodox congregations (pop. 50,000+)"

|
|
Total of 3162 patent applications in 2008-2024.