Annapolis, Maryland

Annapolis: Point in Annapolis

Annapolis: Holiday Season at Annapolis City Dock, December 2005

Annapolis: Annapolis City Dock, December 2005

Annapolis: Sailing My Mind Away From The Comfort Of My Deck On A Lazy Spring Afternoon

Annapolis: Annapolis City-2

Annapolis: Misty morning, downtown Annapolis, MD

Annapolis: Sailboat Race - in front of Naval Academy

Annapolis: Early morning - Spa Creek headwaters

Annapolis: Jonas Green Park at Sunset

Annapolis: Church in East Port

Annapolis: Maryland State House -- Capitol of the US from 11/26/1783 to 8/13/1784
- see
45
more - add
your
Submit your own pictures of this city and show them to the world
- OSM Map
- General Map
- Google Map
- MSN Map
Population change since 2000: +13.4%
 |
| Males: 19,522 | |
| Females: 21,126 |
| Median resident age: | 38.1 years |
| Maryland median age: | 39.7 years |
Zip codes: 21401, 21402, 21403.
Annapolis Zip Code Map| Annapolis: | $94,802 |
| MD: | $94,991 |
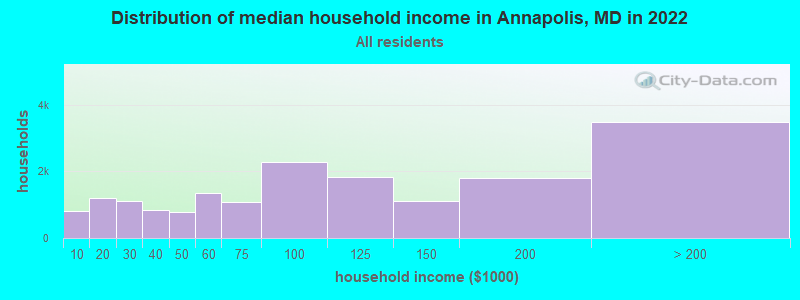
Estimated per capita income in 2022: $57,700 (it was $27,180 in 2000)
Annapolis city income, earnings, and wages data
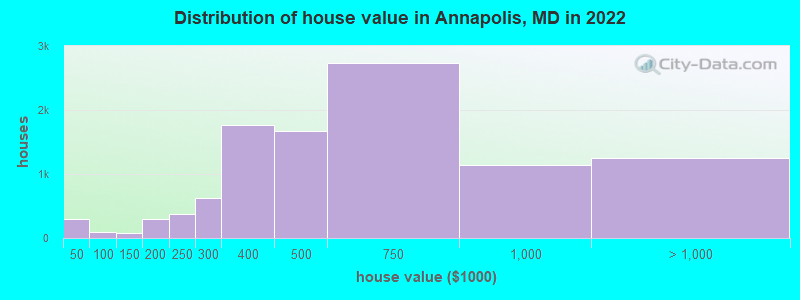
Estimated median house or condo value in 2022: $496,974 (it was $161,700 in 2000)
| Annapolis: | $496,974 |
| MD: | $398,100 |
Mean prices in 2022: all housing units: $715,181; detached houses: $867,207; townhouses or other attached units: $504,835; in 2-unit structures: $553,629; in 3-to-4-unit structures: $704,155; in 5-or-more-unit structures: $488,683
Median gross rent in 2022: $1,651.
(5.5% for White Non-Hispanic residents, 20.5% for Black residents, 10.1% for Hispanic or Latino residents, 39.1% for American Indian residents, 14.3% for other race residents, 12.7% for two or more races residents)
Detailed information about poverty and poor residents in Annapolis, MD


- 21,14451.5%White alone
- 9,89024.1%Black alone
- 7,73418.8%Hispanic
- 1,3733.3%Two or more races
- 1,1962.9%Asian alone
- 2140.5%Other race alone
- 360.09%American Indian alone
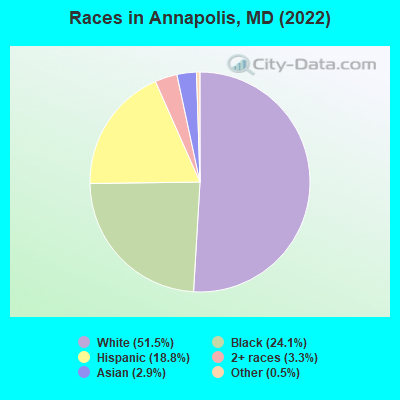
Races in Annapolis detailed stats: ancestries, foreign born residents, place of birth
According to our research of Maryland and other state lists, there were 60 registered sex offenders living in Annapolis, Maryland as of April 27, 2024.
The ratio of all residents to sex offenders in Annapolis is 660 to 1.
Type |
2009 |
2010 |
2011 |
2012 |
2013 |
2014 |
2015 |
2016 |
2017 |
2018 |
2019 |
2020 |
2022 |
|---|---|---|---|---|---|---|---|---|---|---|---|---|---|
| Murders (per 100,000) | 4 (10.9) | 4 (10.4) | 1 (2.6) | 2 (5.1) | 4 (10.3) | 1 (2.6) | 1 (2.6) | 10 (25.2) | 7 (17.7) | 1 (2.5) | 4 (10.2) | 6 (15.3) | 1 (2.5) |
| Rapes (per 100,000) | 9 (24.6) | 7 (18.2) | 8 (20.6) | 4 (10.2) | 8 (20.7) | 4 (10.3) | 13 (33.3) | 11 (27.7) | 15 (37.9) | 27 (68.4) | 11 (28.0) | 19 (48.3) | 17 (41.9) |
| Robberies (per 100,000) | 82 (224.1) | 91 (237.0) | 71 (183.2) | 54 (137.6) | 63 (163.0) | 66 (170.1) | 64 (164.2) | 66 (166.2) | 63 (159.1) | 47 (119.1) | 67 (170.6) | 51 (129.7) | 42 (103.6) |
| Assaults (per 100,000) | 148 (404.5) | 124 (323.0) | 96 (247.7) | 117 (298.1) | 94 (243.2) | 123 (317.0) | 111 (284.7) | 163 (410.5) | 136 (343.5) | 140 (354.8) | 170 (432.8) | 176 (447.7) | 155 (382.3) |
| Burglaries (per 100,000) | 199 (543.9) | 197 (513.1) | 186 (479.9) | 185 (471.3) | 169 (437.3) | 176 (453.6) | 194 (497.6) | 210 (528.9) | 131 (330.8) | 133 (337.0) | 98 (249.5) | 109 (277.2) | 75 (185.0) |
| Thefts (per 100,000) | 702 (1,919) | 800 (2,084) | 779 (2,010) | 775 (1,974) | 821 (2,124) | 715 (1,843) | 742 (1,903) | 684 (1,723) | 762 (1,924) | 722 (1,830) | 734 (1,869) | 625 (1,590) | 644 (1,588) |
| Auto thefts (per 100,000) | 79 (215.9) | 104 (270.9) | 69 (178.0) | 82 (208.9) | 66 (170.8) | 58 (149.5) | 41 (105.2) | 44 (110.8) | 40 (101.0) | 55 (139.4) | 92 (234.2) | 60 (152.6) | 69 (170.2) |
| Arson (per 100,000) | 3 (8.2) | 9 (23.4) | 8 (20.6) | 8 (20.4) | 14 (36.2) | 7 (18.0) | 11 (28.2) | 18 (45.3) | 9 (22.7) | 3 (7.6) | 15 (38.2) | 10 (25.4) | 18 (44.4) |
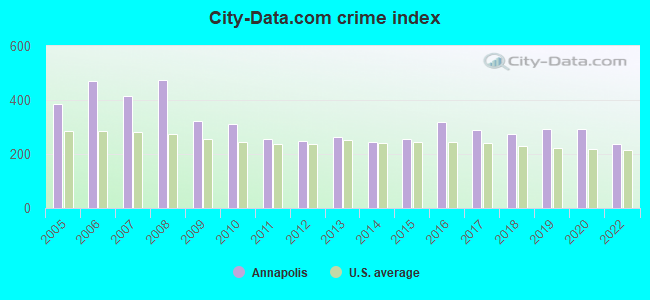
| City-Data.com crime index | 321.8 | 312.1 | 254.4 | 247.9 | 264.0 | 245.2 | 257.4 | 319.3 | 290.3 | 274.4 | 291.5 | 292.8 | 236.1 |
The City-Data.com crime index weighs serious crimes and violent crimes more heavily. Higher means more crime, U.S. average is 246.1. It adjusts for the number of visitors and daily workers commuting into cities.
Crime rate in Annapolis detailed stats: murders, rapes, robberies, assaults, burglaries, thefts, arson
Full-time law enforcement employees in 2021, including police officers: 143 (112 officers - 96 male; 16 female).
| Officers per 1,000 residents here: | 2.83 |
| Maryland average: | 2.47 |
 Recent articles from our blog. Our writers, many of them Ph.D. graduates or candidates, create easy-to-read articles on a wide variety of topics.

 | Is Annapolis right for me? Help me decide! (11 replies) |
| Annapolis; Moving for work (0 replies) |
| Vacation: Stay in Baltimore or Annapolis? (22 replies) |
| Young Parents in Downtown Annapolis? (4 replies) |
| Recap: Baltimore and Annapolis Trip (13 replies) |
| Thinking of buying a house in Annapolis (7 replies) |
Latest news from Annapolis, MD collected exclusively by city-data.com from local newspapers, TV, and radio stations
Annapolis, MD City Guides:
Ancestries: Irish (7.0%), American (6.1%), German (5.7%), English (4.4%), Italian (3.5%), European (2.8%).
Current Local Time: EST time zone
Incorporated in 1708
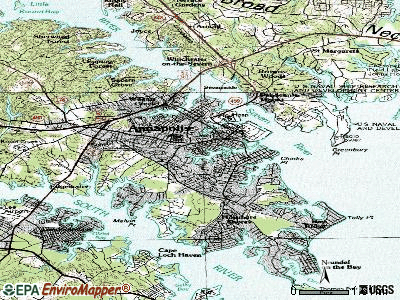
Elevation: 40 feet
Land area: 6.73 square miles.
Population density: 6,041 people per square mile (high).
4,561 residents are foreign born (6.3% Latin America, 2.3% Asia, 1.4% Europe).
| This city: | 11.1% |
| Maryland: | 15.7% |
Median real estate property taxes paid for housing units with mortgages in 2022: $4,916 (1.0%)
Median real estate property taxes paid for housing units with no mortgage in 2022: $4,842 (1.0%)
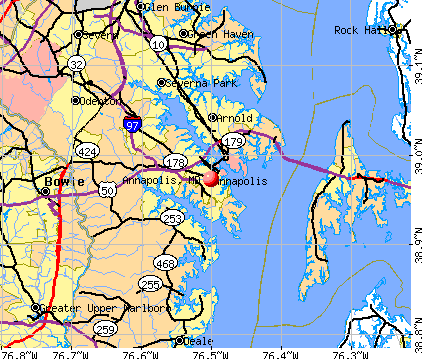
Nearest city with pop. 50,000+: Bowie, MD (13.1 miles  , pop. 50,269).
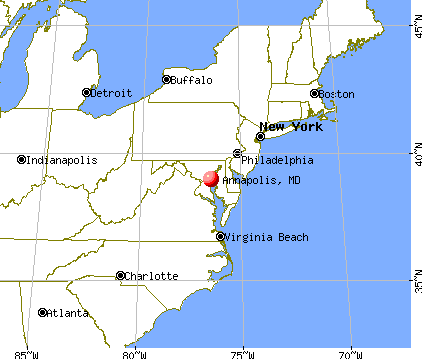
Nearest city with pop. 200,000+: Baltimore, MD (24.0 miles , pop. 651,154).
Nearest city with pop. 1,000,000+: Philadelphia, PA (101.3 miles , pop. 1,517,550).
Nearest cities:
), ), ), ), Latitude: 38.97 N, Longitude: 76.50 W
Daytime population change due to commuting: +8,740 (+21.3%)
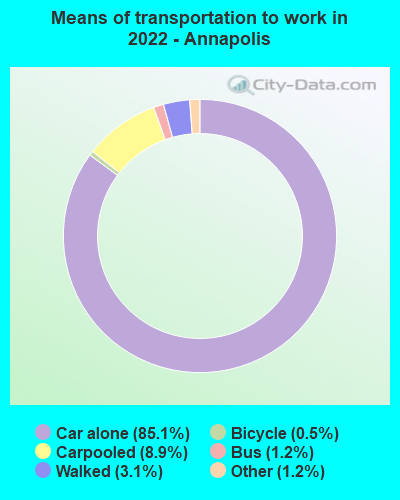
Workers who live and work in this city: 9,158 (42.7%)
Area codes: 410, 443
Property values in Annapolis, MD

Detailed articles:
- Annapolis: Introduction
- Annapolis Basic Facts
- Annapolis: Communications
- Annapolis: Convention Facilities
- Annapolis: Economy
- Annapolis: Education and Research
- Annapolis: Geography and Climate
- Annapolis: Health Care
- Annapolis: History
- Annapolis: Municipal Government
- Annapolis: Population Profile
- Annapolis: Recreation
- Annapolis: Transportation
Annapolis tourist attractions:
- Annapolis Marriott Waterfront, MD - Annapolis, Maryland - Unique Waterfront Hotel in Historic Downtown Offers Schooner Sails on the Bay While Going Green
- Shopping Mall Near the State Capital
- Loews Annapolis Hotel, MD - Annapolis, Maryland - Children and Pets Welcome at Downtown Hotel Blocks from the Chesapeake Bay
- O'Callaghan Hotel Annapolis, MD - Annapolis, Maryland - Irish Boutique Hotel in Historic Maryland Capital
- Lodging Near State Capital
- Headquarters of U.S. Navy
- Westin Annapolis, MD - Annapolis, Maryland - New Modern Accommodations Near Maryland State Capitol
- Gardens Near State Capital
Annapolis, Maryland accommodation & food services, waste management - Economy and Business Data
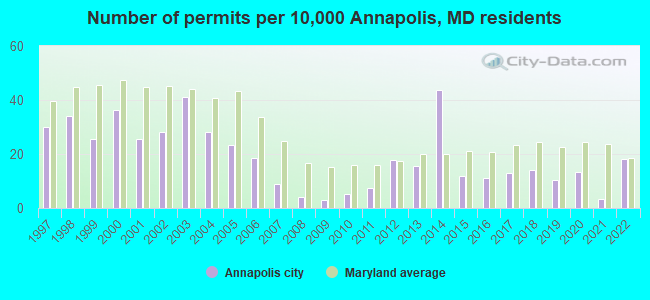
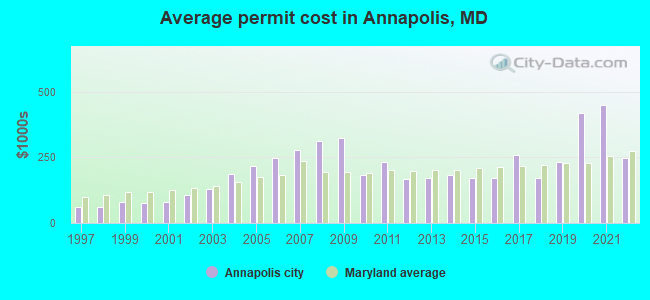
Single-family new house construction building permits:
- 2022: 65 buildings, average cost: $247,900
- 2021: 12 buildings, average cost: $450,400
- 2020: 48 buildings, average cost: $419,300
- 2019: 37 buildings, average cost: $231,000
- 2018: 50 buildings, average cost: $171,900
- 2017: 46 buildings, average cost: $258,000
- 2016: 40 buildings, average cost: $172,600
- 2015: 42 buildings, average cost: $171,900
- 2014: 156 buildings, average cost: $182,400
- 2013: 56 buildings, average cost: $169,500
- 2012: 64 buildings, average cost: $167,400
- 2011: 26 buildings, average cost: $231,400
- 2010: 19 buildings, average cost: $183,500
- 2009: 11 buildings, average cost: $322,600
- 2008: 15 buildings, average cost: $311,100
- 2007: 32 buildings, average cost: $278,600
- 2006: 67 buildings, average cost: $249,100
- 2005: 84 buildings, average cost: $219,400
- 2004: 101 buildings, average cost: $187,000
- 2003: 147 buildings, average cost: $131,000
- 2002: 101 buildings, average cost: $105,200
- 2001: 92 buildings, average cost: $79,600
- 2000: 130 buildings, average cost: $75,800
- 1999: 92 buildings, average cost: $79,000
- 1998: 122 buildings, average cost: $60,000
- 1997: 107 buildings, average cost: $59,700
| Here: | 1.7% |
| Maryland: | 2.0% |
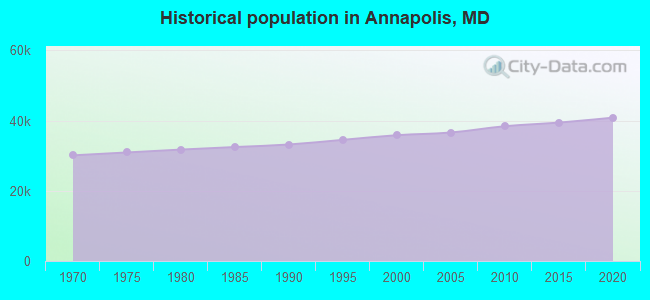
Population change in the 1990s: +3,190 (+9.8%).
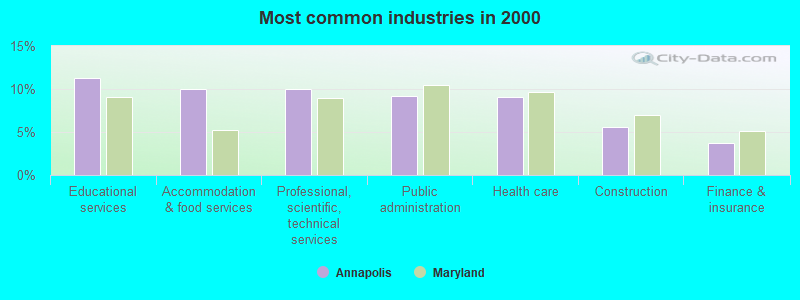
- Educational services (11.3%)
- Accommodation & food services (10.0%)
- Professional, scientific, technical services (10.0%)
- Public administration (9.2%)
- Health care (9.0%)
- Construction (5.6%)
- Finance & insurance (3.7%)
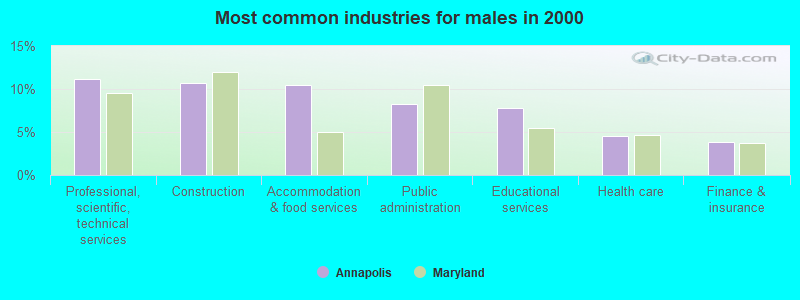
- Professional, scientific, technical services (11.1%)
- Construction (10.7%)
- Accommodation & food services (10.5%)
- Public administration (8.2%)
- Educational services (7.8%)
- Health care (4.6%)
- Finance & insurance (3.8%)
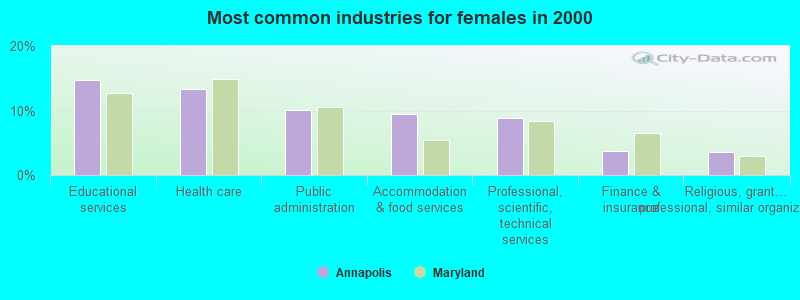
- Educational services (14.8%)
- Health care (13.4%)
- Public administration (10.1%)
- Accommodation & food services (9.5%)
- Professional, scientific, technical services (8.9%)
- Finance & insurance (3.7%)
- Religious, grantmaking, civic, professional, similar organizations (3.6%)
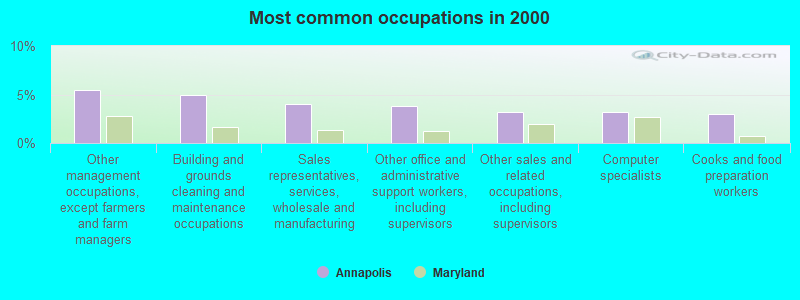
- Other management occupations, except farmers and farm managers (5.4%)
- Building and grounds cleaning and maintenance occupations (5.0%)
- Sales representatives, services, wholesale and manufacturing (4.0%)
- Other office and administrative support workers, including supervisors (3.8%)
- Other sales and related occupations, including supervisors (3.2%)
- Computer specialists (3.2%)
- Cooks and food preparation workers (3.0%)
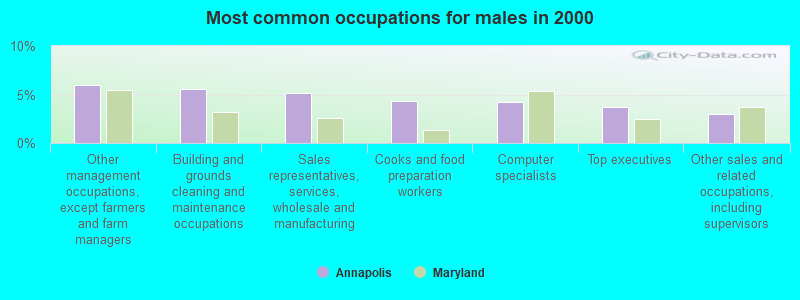
- Other management occupations, except farmers and farm managers (6.0%)
- Building and grounds cleaning and maintenance occupations (5.6%)
- Sales representatives, services, wholesale and manufacturing (5.2%)
- Cooks and food preparation workers (4.4%)
- Computer specialists (4.2%)
- Top executives (3.7%)
- Other sales and related occupations, including supervisors (3.0%)
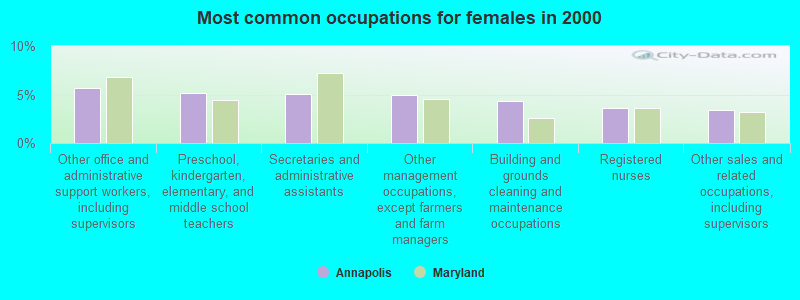
- Other office and administrative support workers, including supervisors (5.6%)
- Preschool, kindergarten, elementary, and middle school teachers (5.2%)
- Secretaries and administrative assistants (5.1%)
- Other management occupations, except farmers and farm managers (4.9%)
- Building and grounds cleaning and maintenance occupations (4.3%)
- Registered nurses (3.6%)
- Other sales and related occupations, including supervisors (3.4%)
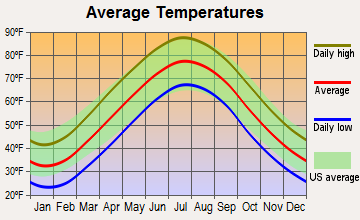
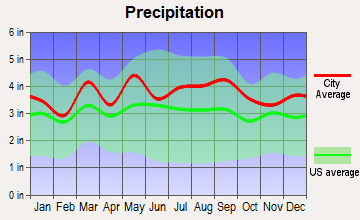
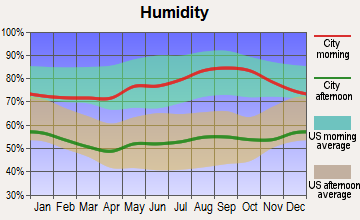
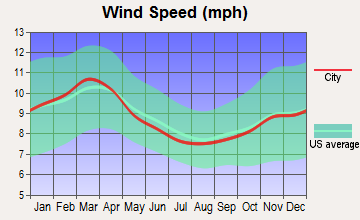
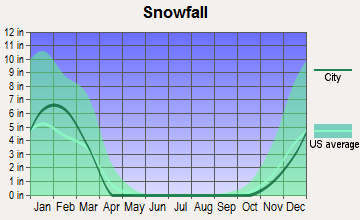
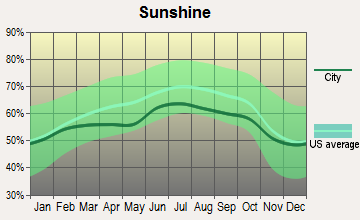
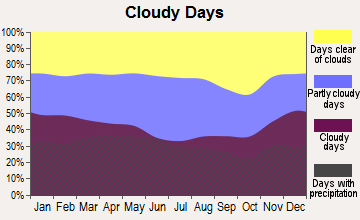
Average climate in Annapolis, Maryland
Based on data reported by over 4,000 weather stations
|
|

(lower is better)
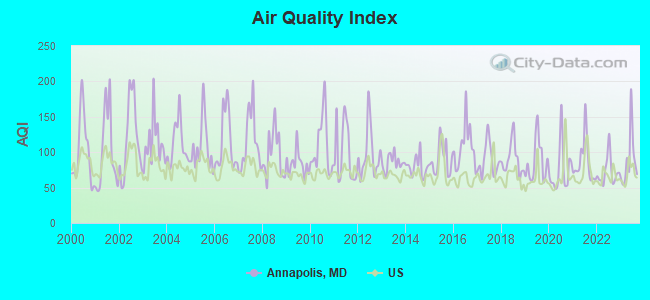
Air Quality Index (AQI) level in 2023 was 88.3. This is worse than average.
| City: | 88.3 |
| U.S.: | 72.6 |
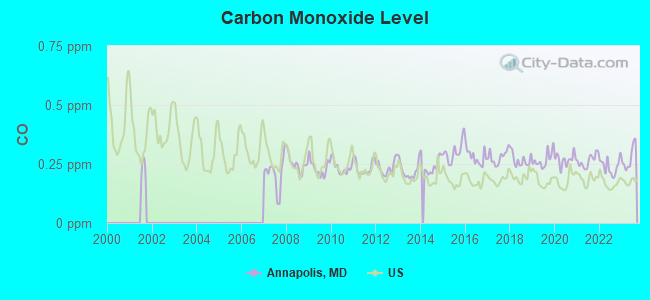
Carbon Monoxide (CO) [ppm] level in 2023 was 0.276. This is about average. Closest monitor was 12.9 miles away from the city center.
| City: | 0.276 |
| U.S.: | 0.251 |
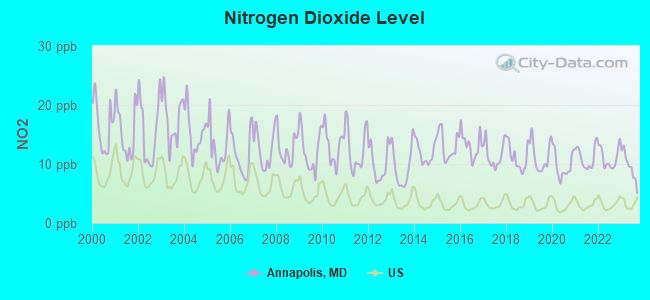
Nitrogen Dioxide (NO2) [ppb] level in 2023 was 9.57. This is significantly worse than average. Closest monitor was 0.7 miles away from the city center.
| City: | 9.57 |
| U.S.: | 5.11 |
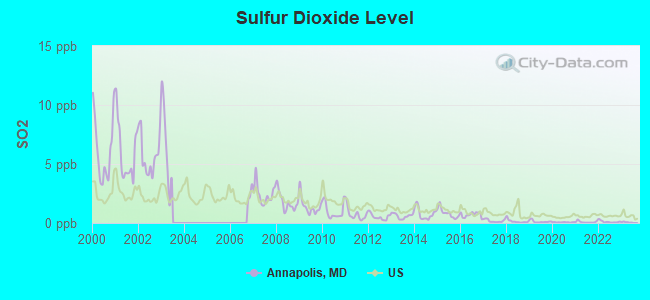
Sulfur Dioxide (SO2) [ppb] level in 2022 was 0.109. This is significantly better than average. Closest monitor was 0.7 miles away from the city center.
| City: | 0.109 |
| U.S.: | 1.515 |
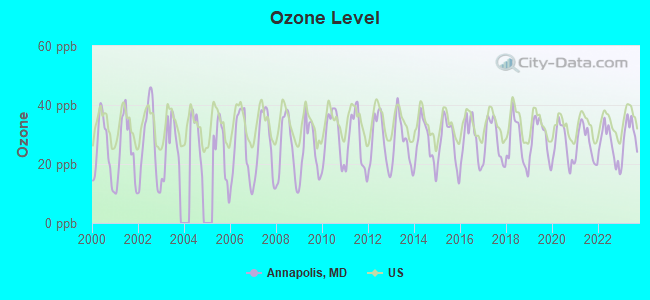
Ozone [ppb] level in 2023 was 30.1. This is about average. Closest monitor was 9.5 miles away from the city center.
| City: | 30.1 |
| U.S.: | 33.3 |
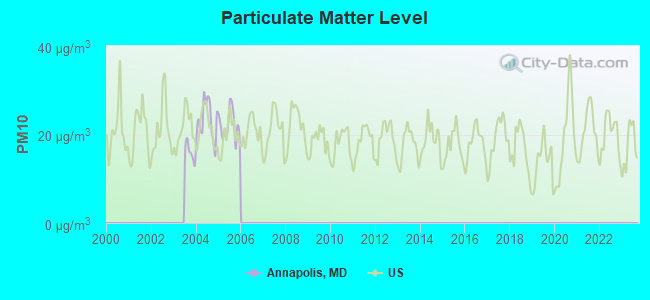
Particulate Matter (PM10) [µg/m3] level in 2005 was 22.2. This is about average. Closest monitor was 0.7 miles away from the city center.
| City: | 22.2 |
| U.S.: | 19.2 |
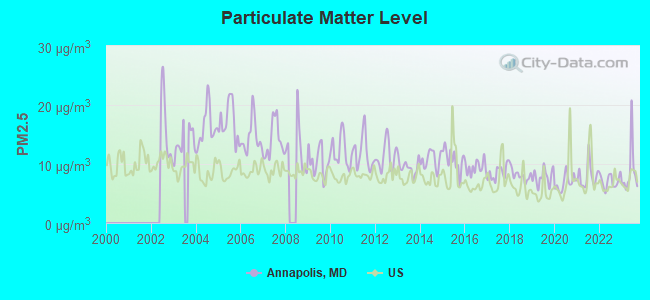
Particulate Matter (PM2.5) [µg/m3] level in 2023 was 8.67. This is about average. Closest monitor was 9.5 miles away from the city center.
| City: | 8.67 |
| U.S.: | 8.11 |
Tornado activity:
Annapolis-area historical tornado activity is slightly above Maryland state average. It is 5% greater than the overall U.S. average.
On 4/28/2002, a category F4 (max. wind speeds 207-260 mph) tornado 34.1 miles away from the Annapolis city center killed 3 people and injured 122 people and caused $124 million in damages.
On 6/9/1961, a category F3 (max. wind speeds 158-206 mph) tornado 17.0 miles away from the city center caused between $50,000 and $500,000 in damages.
Earthquake activity:
Annapolis-area historical earthquake activity is significantly above Maryland state average. It is 60% smaller than the overall U.S. average.On 8/23/2011 at 17:51:04, a magnitude 5.8 (5.8 MW, Depth: 3.7 mi, Class: Moderate, Intensity: VI - VII) earthquake occurred 107.0 miles away from the city center
On 1/16/1994 at 01:49:16, a magnitude 4.6 (4.6 MB, 4.6 LG, Depth: 3.1 mi, Class: Light, Intensity: IV - V) earthquake occurred 97.1 miles away from Annapolis center
On 8/25/2011 at 05:07:52, a magnitude 4.5 (4.5 ML, Depth: 4.2 mi) earthquake occurred 106.5 miles away from the city center
On 12/9/2003 at 20:59:18, a magnitude 4.5 (4.5 ML, Depth: 6.2 mi) earthquake occurred 120.0 miles away from the city center
On 12/9/2003 at 20:59:14, a magnitude 4.5 (4.5 MB, 4.5 LG) earthquake occurred 122.4 miles away from Annapolis center
On 9/25/1998 at 19:52:52, a magnitude 5.2 (4.8 MB, 4.3 MS, 5.2 LG, 4.5 MW, Depth: 3.1 mi) earthquake occurred 269.5 miles away from the city center
Magnitude types: regional Lg-wave magnitude (LG), body-wave magnitude (MB), local magnitude (ML), surface-wave magnitude (MS), moment magnitude (MW)
Natural disasters:
The number of natural disasters in Anne Arundel County (20) is greater than the US average (15).Major Disasters (Presidential) Declared: 15
Emergencies Declared: 5
Causes of natural disasters: Hurricanes: 6, Winter Storms: 6, Snowstorms: 4, Floods: 3, Storms: 3, Tropical Storms: 2, Blizzard: 1, Heavy Rain: 1, Ice Storm: 1, Snowfall: 1, Tornado: 1, Other: 1 (Note: some incidents may be assigned to more than one category).
Main business address for: TELKONET INC (COMMUNICATION SERVICES, NEC), FTI CONSULTING INC (SERVICES-MANAGEMENT CONSULTING SERVICES), TELECOMMUNICATION SYSTEMS INC /FA/ (SERVICES-PREPACKAGED SOFTWARE), SEVERN BANCORP INC (NATIONAL COMMERCIAL BANKS).
Hospitals in Annapolis:
- ANNE ARUNDEL MEDICAL CENTER (Voluntary non-profit - Private, provides emergency services, 2001 MEDICAL PARKWAY)
- ARUNDEL GENL HOSP HOSPICE (FRANKLIN AND CATHEDRAL STREETS)
- HOSPICE OF THE CHESAPEAKE (445 DEFENSE HIGHWAY)
Nursing Homes in Annapolis:
- BAY MANOR NH (REVELL HWY)
- BAY RIDGE HEALTH CARE CENTER (900 VAN BUREN STREET)
- GINGER COVE (4000 RIVER CRESCENT DRIVE)
- HERITAGE HARBOUR HEALTH AND REHABILITATION CENTER (2700 SOUTH HAVEN ROAD)
- SPA CREEK CENTER (35 MILKSHAKE LANE)
- THE ARBOR (7101 BAY FRONT DRIVE)
Dialysis Facilities in Annapolis:
Home Health Centers in Annapolis:
Airports, heliports and other landing facilities located in Annapolis:
- Fairview Airport (3MD4) (Runways: 1)
- Anne Arundel Medical Center Heliport (20MD)
- Annapolis Seaplane Base (01MD)
Amtrak stations near Annapolis:
- 19 miles: BWI AIRPORT RAIL STATION (BALTIMORE, AMTRAK WAY) . Services: ticket office, fully wheelchair accessible, enclosed waiting area, public restrooms, public payphones, snack bar, ATM, paid short-term parking, paid long-term parking, call for car rental service, call for taxi service, public transit connection.
- 20 miles: NEW CARROLLTON (4300 GARDEN CITY DR.) . Services: ticket office, fully wheelchair accessible, enclosed waiting area, public restrooms, public payphones, snack bar, ATM, paid short-term parking, paid long-term parking, call for car rental service, taxi stand, public transit connection.
Colleges/Universities in Annapolis:
Other colleges/universities with over 2000 students near Annapolis:
- Anne Arundel Community College (about 6 miles; Arnold, MD; Full-time enrollment: 10,501)
- Bowie State University (about 15 miles; Bowie, MD; FT enrollment: 4,517)
- Prince George's Community College (about 19 miles; Largo, MD; FT enrollment: 8,537)
- All-State Career-Baltimore (about 21 miles; Baltimore, MD; FT enrollment: 2,287)
- University of Maryland-Baltimore County (about 23 miles; Baltimore, MD; FT enrollment: 11,160)
- University of Maryland-Baltimore (about 24 miles; Baltimore, MD; FT enrollment: 3,162)
- University of Maryland-College Park (about 24 miles; College Park, MD; FT enrollment: 32,734)
Public high schools in Annapolis:
- ANNAPOLIS HIGH (Location: 2700 RIVA RD, Grades: 9-12)
- BROADNECK HIGH (Location: 1265 GREEN HOLLY DR, Grades: 9-12)
- PHOENIX ACADEMY (Location: 1411 CEDAR PARK ROAD, Grades: 1-12)
Private high schools in Annapolis:
- ANNAPOLIS AREA CHRISTIAN SCHOOL (Students: 828, Location: 716 BESTGATE RD, Grades: PK-12)
- KEY SCHOOL (Students: 698, Location: 534 HILLSMERE DR, Grades: PK-12)
- ST MARYS HIGH SCHOOL (Students: 469, Location: 113 DUKE OF GLOUCESTER ST, Grades: 9-12)
- THE HARBOUR SCHOOL AT ANNAPOLIS (Students: 159, Location: 1277 GREEN HOLLY DR, Grades: 3-12)
Biggest public elementary/middle schools in Annapolis:
- ANNAPOLIS ELEMENTARY (Location: 180 GREEN STREET, Grades: PK-5)
- ANNAPOLIS MIDDLE (Location: 1399 FOREST DR, Grades: 6-8)
- WILEY H. BATES MIDDLE (Location: 701 CHASE STREET, Grades: 6-8)
- CAPE ST. CLAIRE ELEMENTARY (Location: 931 BLUE RIDGE DR, Grades: KG-5)
- EASTPORT ELEMENTARY (Location: 420 5TH STREET, Grades: PK-5)
- GEORGETOWN EAST ELEMENTARY (Location: 111 DOGWOOD RD, Grades: PK-5)
- GERMANTOWN ELEMENTARY (Location: 200 WINDELL AVENUE, Grades: PK-5)
- HILLSMERE ELEMENTARY (Location: 3052 ARUNDEL ON THE BAY RD, Grades: PK-5)
- J. ALBERT ADAMS ACADEMY (Location: 245 CLAY STREET, Grades: 6-8)
- WALTER S. MILLS - PAROLE ELEMENTARY (Location: 103 CHINQUAPIN ROUND RD, Grades: PK-5)
Private elementary/middle schools in Annapolis:
- ST MARY ELEMENTARY SCHOOL (Students: 825, Location: 111 DUKE OF GLOUCESTER ST, Grades: KG-8)
- NAVAL ACADEMY PRIMARY SCHOOL (Students: 256, Location: 74 GREENBURY POINT RD, Grades: PK-5)
- ST ANNES SCHOOL OF ANNAPOLIS (Students: 195, Location: 3112 ARUNDEL ON THE BAY RD, Grades: PK-8)
- ST MARTINS LUTHERAN CHURCH SCHOOL (Students: 179, Location: 1120 SPA RD, Grades: PK-8)
- MONTESSORI INTERNATIONAL CHILDRENS HOUSE (Students: 137, Location: 1641 N WINCHESTER RD, Grades: PK-6)
- CHESAPEAKE MONTESSORI SCHOOL (Students: 133, Location: 30 OLD MILL BOTTOM RD N, Grades: PK-5)
- BOOK OF LIFE ACADEMY (Students: 65, Location: 913 CEDAR PARK RD, Grades: PK-5)
- ALPERT FAMILY ALEPH BET JEWISH DAY SCHOOL (Students: 36, Location: 1125 SPA RD, Grades: KG-5)
User-submitted facts and corrections:
- Church - Burning Bush Ministries, 84 Janwall St., Annapolis, MD 21403.
- North Arundel Hospital now called Baltimore-Washington Medical Center. Crownsville State Hospital is now closed added by Brigitte
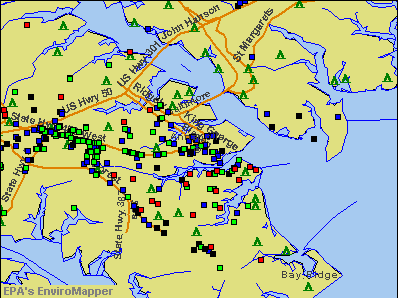
Points of interest:
Notable locations in Annapolis: Seafarers Yacht Club (A), Church Circle (B), Campbell Parking Lot (C), Chase-Stone Parking Lot (D), Mellon Parking Lot (E), Port Annapolis Marina (F), Olde Towne Marina (G), Mears Marina (H), Annapolis Landing Marina (I), Market Slip (J), Annapolis City Dock (K), Annapolis Yacht Club (L), Annapolis Branch Public Library of Annapolis and Anne Arundel County (M), Waterwitch Fire Station Number 1 (N), State of Maryland Hall of Records (O), Maryland Court of Appeals (P), Governors Mansion (Q), Banneker-Douglass Museum of Afro-American Life and History (R), Anne Arundel County Courthouse (S), Victualling Warehouse Maritime Museum (T). Display/hide their locations on the map
Shopping Centers: West II Shopping Center (1), Eastport Shopping Center (2), Colonial Parole Shopping Center (3), Clock Tower Plaza Shopping Center (4), Arundel Plaza Shopping Center (5), Ames Shopping Center (6), Bay Bridge Market Place Shopping Center (7), Market Place Shopping Center (8), Value City Shopping Center (9). Display/hide their locations on the map
Main business address in Annapolis include: TELECOMMUNICATION SYSTEMS INC /FA/ (A), SEVERN BANCORP INC (B). Display/hide their locations on the map
Churches in Annapolis include: Church of Christ (A), Eastport United Methodist Church (B), First Baptist Church of Eastport (C), First Church of God (D), First Presbyterian Church of Annapolis (E), John Wesley United Methodist Church (F), Mount Zion United Methodist Church (G), Saint Lukes Chapel (H), Saint Marys Convent (I). Display/hide their locations on the map
Cemeteries: Saint Marys Cemetery (1), Annapolis National Cemetery (2), Saint Annes Cemetery (3), Cedar Bluff Cemetery (4), Brewer Hill Cemetery (5), Hillcrest Memorial Cemetery (6). Display/hide their locations on the map
Lake: Chase Pond (A). Display/hide its location on the map
Streams, rivers, and creeks: Spa Creek (A), Cowhide Branch (B). Display/hide their locations on the map
Parks in Annapolis include: Truxton Park (1), Navy-Marine Corps Memorial Stadium (2), Colonial Annapolis Historic District (3). Display/hide their locations on the map
Tourist attractions: Annapolis Maritime Museum (222 Severn Avenue), Charles Carroll House (Museums; 107 Duke Of Gloucester South), Hartge Laurence & Virginia (Museums; 257 Hanover St), Chesapeake Childrens Museum (25 Silopanna Road), Historic Annapolis Foundation (Cultural Attractions- Events- & Facilities; 18 Pinkney Street), Hotel and Tourism Consulting Specialists (Tourism Consultants; 3108 Riverwalk Court), USDA Aphis WS (Recreation Areas; 1568 Whitehall Road), Tilt 213 (Amusement & Theme Parks; 1061 Annapolis Mall), Schooner Woodwind Sailing Cruises (80 Compromise Street).
Hotels: Deline Don & Mickie (85 East Street), Mainstay Suites (120 Admiral Cochrane Dr), Hampton Inn & Suites Annapolis (124 Womack Drive), Breeze (126 West Street), Governor Calvert House (State Circle), Residence Inn Annapolis (170 Admiral Cochrane Drive), Chez AMIS Bed & Breakfast (85 East Street), Loews Annapolis Hotel (126 West St), Historic Inns of Annapolis (58 State Circle).
Courts: Maryland State Government - Courts- Court Of Appeals- Clerks Office (Courts Of Appeal Building), Maryland State - Correctional Agencies- Court Of Special Appeals- Judicial Information Sys (2661 Riva Road), Maryland State Government - Judiciary Of Maryland- Anne Arundel County- District Court Of Mary (Rowe Boulevard Taylor A), Federal Bureau Of Investigation - Resident Agency (200 Harry S Truman Parkway), Community Action Agency Of Anne Arundel County - O'Bery Court Head S (110 Clay Street), Maryland State Government - Courts- District Court Of Maryland- Clerks Office- Ju (251 Rowe), Maryland State Government - Courts- Court of Appeals- Reporters Office (Courts Of Appeal Building), Maryland State Government - Courts- District Court Of Maryland- Clerks Of (251 Rowe).
Birthplace of: Benjamin Ogle Tayloe - Diplomat, Lynde D. McCormick - Admiral, Alexandre Arsène Girault - Entomologist, Barbara Kingsolver - Author, William Alexander Hammond - Union Army general, Josh Sims - Lacrosse player, Christian Siriano - Fashion designer, Charles Carroll of Carrollton - Politician, Travis Pastrana - Stock car and rally driver, Bret Gilliam - Non-fiction writer.
Drinking water stations with addresses in Annapolis and their reported violations in the past:
CITY OF ANNAPOLIS (Population served: 35,000, Groundwater):Past monitoring violations:THE KEY SCHOOL (Population served: 820, Groundwater):
- Monitoring and Reporting (DBP) - Between JAN-2005 and MAR-2005, Contaminant: TTHM. Follow-up actions: St Violation/Reminder Notice (MAY-11-2005), St Compliance achieved (MAY-31-2005)
Past monitoring violations:ANNAPOLIS AREA CHRISTIAN SCHOOL (Population served: 415, Groundwater):
- Lead Consumer Notice - In JAN-01-2013, Contaminant: Lead and Copper Rule. Follow-up actions: St Violation/Reminder Notice (2 times from JUL-13-2012 to MAR-26-2014)
Past monitoring violations:NORTHROP GRUMMAN - UNDERSEA SYSTEMS (Address: 895 OCEANIC DRIVE , Population served: 395, Groundwater):
- Initial Tap Sampling for Pb and Cu - In JAN-01-2008, Contaminant: Lead and Copper Rule. Follow-up actions: St Violation/Reminder Notice (MAY-29-2008), St Compliance achieved (OCT-15-2008)
- One routine major monitoring violation
Past monitoring violations:MONTESSORI INTL. CHILDRENS HOUSE (Population served: 177, Groundwater):
- Monitoring and Reporting (DBP) - Between JAN-2011 and DEC-2013, Contaminant: Total Haloacetic Acids (HAA5). Follow-up actions: St Public Notif requested (FEB-20-2014), St Compliance achieved (MAR-07-2014)
- Monitoring and Reporting (DBP) - Between JAN-2011 and DEC-2013, Contaminant: TTHM. Follow-up actions: St Public Notif requested (FEB-20-2014), St Compliance achieved (MAR-07-2014)
Past health violations:HH&P IV, LLC (Address: 60 WEST STREET, SUITE 204 , Population served: 100, Groundwater):
- MCL, Monthly (TCR) - In APR-2008, Contaminant: Coliform. Follow-up actions: St Violation/Reminder Notice (APR-28-2008), St Public Notif requested (MAY-06-2008), St Public Notif received (MAY-15-2008), St Compliance achieved (MAY-16-2008)
Past monitoring violations:CHESAPEAKE BAY FOUNDATION (Address: 6 HERNDON AVENUE , Population served: 90, Groundwater):
- Follow-up Or Routine LCR Tap M/R - In JUL-01-2005, Contaminant: Lead and Copper Rule. Follow-up actions: St Violation/Reminder Notice (3 times from DEC-09-2005 to JUN-14-2006), St Compliance achieved (OCT-03-2006)
- Initial, Follow-up, or Routine Source Water M/R - In APR-01-2004, Contaminant: Lead and Copper Rule. Follow-up actions: St Violation/Reminder Notice (AUG-26-2005), St Compliance achieved (AUG-23-2007)
- 3 routine major monitoring violations
- One regular monitoring violation
Past monitoring violations:CALVERT MOBILE HOME PARK (Address: 343 MARTINS COVE ROAD , Population served: 80, Groundwater):
- Initial, Follow-up, or Routine Source Water M/R - In JAN-01-2001, Contaminant: Lead and Copper Rule. Follow-up actions: St Violation/Reminder Notice (2 times from FEB-12-2002 to AUG-26-2005), St Compliance achieved (DEC-07-2006)
Past monitoring violations:
- Follow-up Or Routine LCR Tap M/R - In OCT-01-2008, Contaminant: Lead and Copper Rule. Follow-up actions: St Compliance achieved (JAN-30-2009), St Public Notif received (JUN-30-2009)
- 2 routine major monitoring violations
Drinking water stations with addresses in Annapolis that have no violations reported:
- U.S. NAVAL ACADEMY (Address: 181 WAINWRIGHT ROAD , Population served: 8,700, Primary Water Source Type: Groundwater)
- EPPING FOREST (Population served: 500, Primary Water Source Type: Groundwater)
- UNITARIAN UNIVERSALIST CHURCH (Address: 333 DUBOIS RD , Population served: 207, Primary Water Source Type: Groundwater)
- CAPE KIDS CORNER (Address: 855 CHESTNUT TREE DRIVE , Population served: 70, Primary Water Source Type: Groundwater)
- MAYO APARTMENTS (Address: 200 WESTGATE CIRCLE SUITE 502 , Population served: 60, Primary Water Source Type: Groundwater)
- TROYS CARIBBEAN AND SOUL FOOD (Address: 1914 FOREST DR. STE. 2A , Population served: 35, Primary Water Source Type: Groundwater)
- UNITARIAN UNIVERSALIST CHURCH OF ANNAPOL (Address: 333 DUBOIS RD , Population served: 25, Primary Water Source Type: Groundwater)
| This city: | 2.3 people |
| Maryland: | 2.6 people |
| This city: | 54.4% |
| Whole state: | 67.1% |
| This city: | 7.8% |
| Whole state: | 6.4% |
Likely homosexual households (counted as self-reported same-sex unmarried-partner households)
- Lesbian couples: 0.3% of all households
- Gay men: 0.4% of all households
People in group quarters in Annapolis in 2010:
- 323 people in college/university student housing
- 143 people in nursing facilities/skilled-nursing facilities
- 69 people in other noninstitutional facilities
- 44 people in group homes intended for adults
- 18 people in emergency and transitional shelters (with sleeping facilities) for people experiencing homelessness
- 6 people in residential treatment centers for adults
People in group quarters in Annapolis in 2000:
- 285 people in college dormitories (includes college quarters off campus)
- 212 people in nursing homes
- 155 people in other group homes
- 34 people in other noninstitutional group quarters
- 13 people in other nonhousehold living situations
- 6 people in homes for the mentally retarded
Banks with most branches in Annapolis (2011 data):
- PNC Bank, National Association: 8 branches. Info updated 2012/03/20: Bank assets: $263,309.6 mil, Deposits: $197,343.0 mil, headquarters in Wilmington, DE, positive income, Commercial Lending Specialization, 3085 total offices, Holding Company: Pnc Financial Services Group, Inc., The
- Branch Banking and Trust Company: 8 branches. Info updated 2010/03/29: Bank assets: $168,867.6 mil, Deposits: $127,549.5 mil, headquarters in Winston Salem, NC, positive income, Commercial Lending Specialization, 1793 total offices, Holding Company: Bb&T Corporation
- BankAnnapolis: Annapolis Towne Centre Branch, Bankannapolis, Bay Woods Branch, Cape St. Claire Road Branch. Info updated 2008/07/01: Bank assets: $441.5 mil, Deposits: $350.7 mil, local headquarters, positive income, Commercial Lending Specialization, 7 total offices, Holding Company: Annapolis Bancorp, Inc.
- Capital One, National Association: Annapolis Branch, Annapolis Harbour Branch, Village Greens Of Annapolis Branch, 2063 West Street. Info updated 2011/07/01: Bank assets: $133,477.8 mil, Deposits: $97,063.7 mil, headquarters in Mclean, VA, positive income, 984 total offices, Holding Company: Capital One Financial Corporation
- Bank of America, National Association: Annapolis Mall Branch, Parole, Annapolis Church Circle Branch, Hillsmere Branch. Info updated 2009/11/18: Bank assets: $1,451,969.3 mil, Deposits: $1,077,176.8 mil, headquarters in Charlotte, NC, positive income, 5782 total offices, Holding Company: Bank Of America Corporation
- Manufacturers and Traders Trust Company: Annapolis Mall Branch, Parole Branch, West Street Annapolis Branch. Info updated 2011/08/08: Bank assets: $76,887.1 mil, Deposits: $60,064.2 mil, headquarters in Buffalo, NY, positive income, Commercial Lending Specialization, 808 total offices, Holding Company: M&T Bank Corporation
- SunTrust Bank: Parole Branch, Annapolis Branch, Gateway Village Safeway Branch. Info updated 2010/05/27: Bank assets: $171,291.7 mil, Deposits: $129,833.2 mil, headquarters in Atlanta, GA, positive income, Commercial Lending Specialization, 1716 total offices, Holding Company: Suntrust Banks, Inc.
- Wells Fargo Bank, National Association: Bay Forest Branch, Restaurant Park, Annapolis Pb Satellite Branch. Info updated 2011/04/05: Bank assets: $1,161,490.0 mil, Deposits: $905,653.0 mil, headquarters in Sioux Falls, SD, positive income, 6395 total offices, Holding Company: Wells Fargo & Company
- Severn Savings Bank, FSB: Annapolis - West Street Branch at 1917 West Street, branch established on 2007/02/26; Severn Savings Bank, Fsb at 200 Westgate Circle, Suite 200, branch established on 1949/04/04. Info updated 2011/07/21: Bank assets: $896.6 mil, Deposits: $657.9 mil, local headquarters, positive income, Commercial Lending Specialization, 4 total offices
- 9 other banks with 9 local branches
For population 15 years and over in Annapolis:
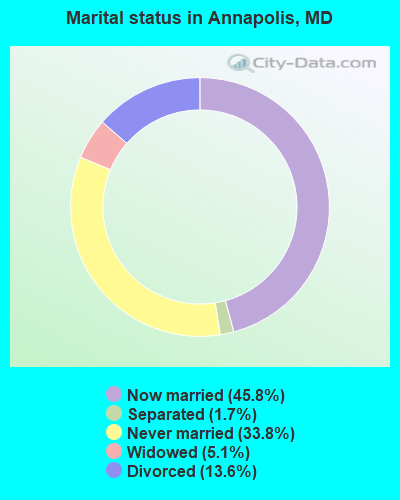
- Never married: 33.8%
- Now married: 45.8%
- Separated: 1.7%
- Widowed: 5.1%
- Divorced: 13.6%
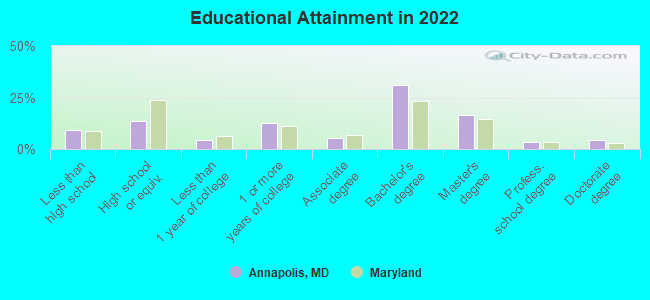
For population 25 years and over in Annapolis:
- High school or higher: 90.5%
- Bachelor's degree or higher: 51.4%
- Graduate or professional degree: 22.6%
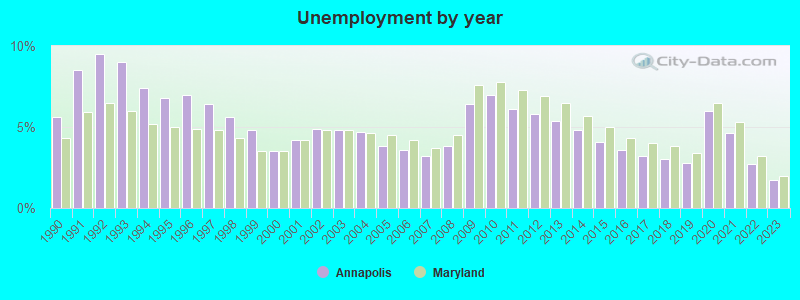
- Unemployed: 3.4%
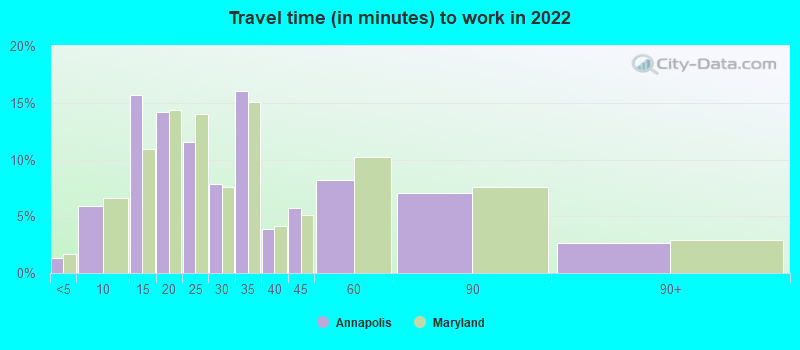
- Mean travel time to work (commute): 22.5 minutes
| Here: | 12.9 |
| Maryland average: | 12.7 |
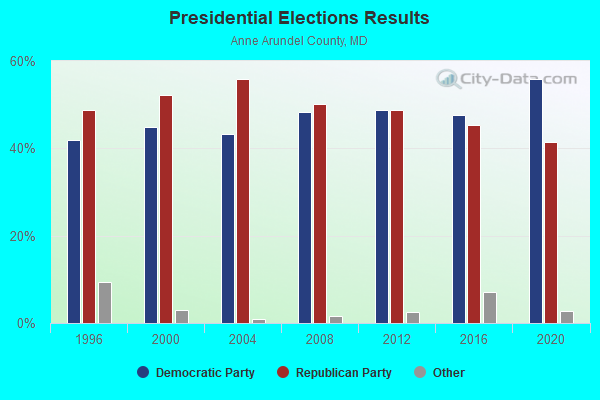
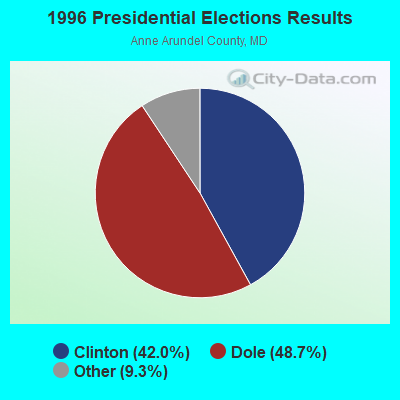
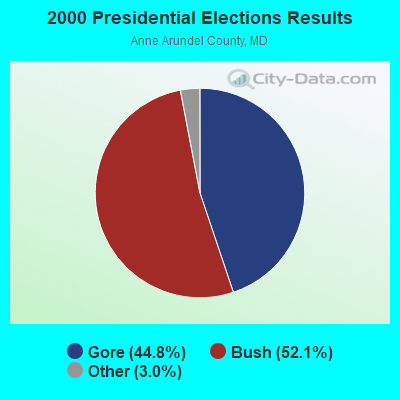
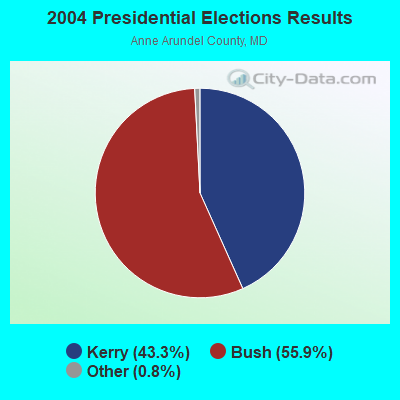
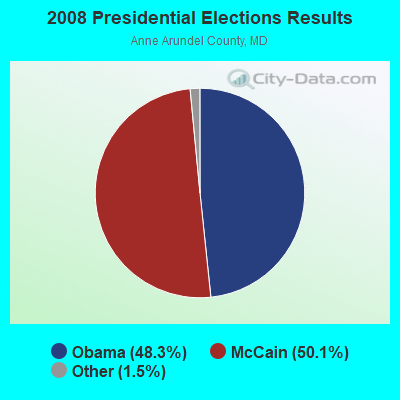
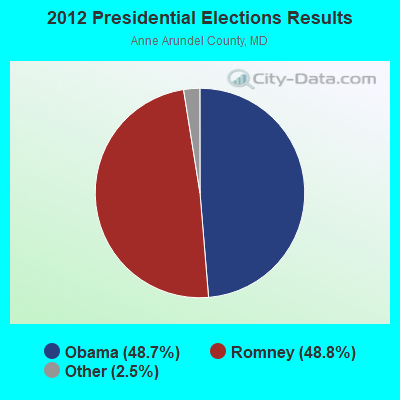
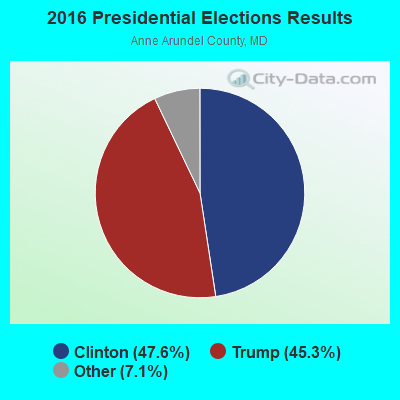
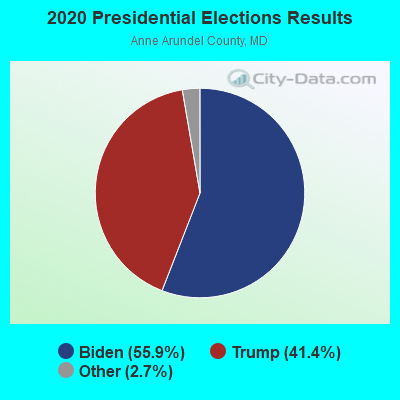
Graphs represent county-level data. Detailed 2008 Election Results
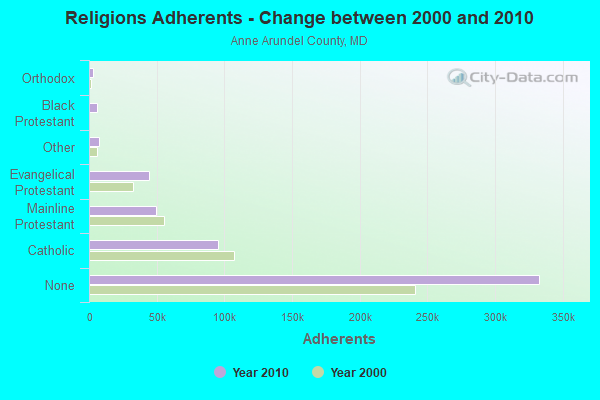
Religion statistics for Annapolis, MD (based on Anne Arundel County data)
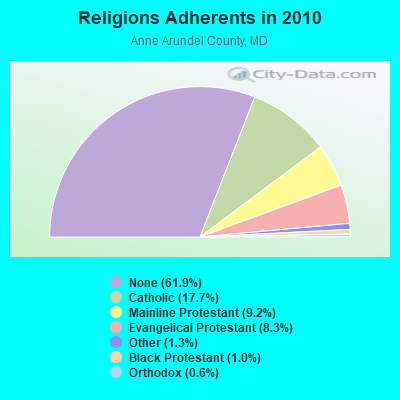
| Religion | Adherents | Congregations |
|---|---|---|
| Catholic | 95,116 | 20 |
| Mainline Protestant | 49,450 | 107 |
| Evangelical Protestant | 44,446 | 182 |
| Other | 7,076 | 28 |
| Black Protestant | 5,609 | 11 |
| Orthodox | 3,250 | 2 |
| None | 332,709 | - |
Food Environment Statistics:
| Anne Arundel County: | 1.55 / 10,000 pop. |
| Maryland: | 1.96 / 10,000 pop. |
| This county: | 0.12 / 10,000 pop. |
| State: | 0.07 / 10,000 pop. |
| Anne Arundel County: | 1.10 / 10,000 pop. |
| Maryland: | 1.22 / 10,000 pop. |
| Anne Arundel County: | 2.27 / 10,000 pop. |
| State: | 2.05 / 10,000 pop. |
| Here: | 5.82 / 10,000 pop. |
| State: | 5.40 / 10,000 pop. |
| This county: | 8.4% |
| Maryland: | 9.1% |
| Anne Arundel County: | 25.5% |
| Maryland: | 26.7% |
| This county: | 15.2% |
| State: | 15.5% |
Health and Nutrition:
| Here: | 48.4% |
| Maryland: | 50.1% |
| This city: | 45.5% |
| Maryland: | 47.6% |
| Annapolis: | 28.9 |
| Maryland: | 28.8 |
| This city: | 20.1% |
| State: | 20.0% |
| Annapolis: | 11.0% |
| State: | 11.3% |
| This city: | 6.8 |
| State: | 6.8 |
| This city: | 33.5% |
| Maryland: | 34.1% |
| This city: | 55.4% |
| Maryland: | 56.5% |
| Annapolis: | 80.2% |
| State: | 80.5% |
More about Health and Nutrition of Annapolis, MD Residents
| Local government employment and payroll (March 2022) | |||||
| Function | Full-time employees | Monthly full-time payroll | Average yearly full-time wage | Part-time employees | Monthly part-time payroll |
|---|---|---|---|---|---|
| Firefighters | 108 | $1,022,319 | $113,591 | 0 | $0 |
| Police Protection - Officers | 97 | $1,015,613 | $125,643 | 0 | $0 |
| Streets and Highways | 43 | $299,602 | $83,610 | 0 | $0 |
| Transit | 42 | $264,685 | $75,624 | 27 | $104,740 |
| Police - Other | 31 | $161,165 | $62,386 | 17 | $6,202 |
| Financial Administration | 25 | $200,865 | $96,415 | 0 | $0 |
| Other Government Administration | 21 | $256,855 | $146,774 | 0 | $0 |
| Water Supply | 21 | $155,022 | $88,584 | 0 | $0 |
| Other and Unallocable | 20 | $183,795 | $110,277 | 0 | $0 |
| Parks and Recreation | 17 | $117,335 | $82,825 | 165 | $139,357 |
| Solid Waste Management | 14 | $96,015 | $82,299 | 0 | $0 |
| Judicial and Legal | 6 | $64,321 | $128,642 | 0 | $0 |
| Sewerage | 5 | $64,889 | $155,734 | 0 | $0 |
| Water Transport and Terminals | 2 | $15,715 | $94,290 | 8 | $5,125 |
| Natural Resources | 2 | $14,315 | $85,890 | 0 | $0 |
| Totals for Government | 454 | $3,932,511 | $103,943 | 217 | $255,424 |
Annapolis government finances - Expenditure in 2021 (per resident):
- Current Operations - Police Protection: $19,474,000 ($479.09)
Local Fire Protection: $19,042,000 ($468.46)
General - Other: $13,879,000 ($341.44)
Parks and Recreation: $8,023,000 ($197.38)
Central Staff Services: $7,375,000 ($181.44)
Regular Highways: $6,215,000 ($152.90)
Sewerage: $5,557,000 ($136.71)
Water Utilities: $5,117,000 ($125.89)
Financial Administration: $4,214,000 ($103.67)
Transit Utilities: $3,892,000 ($95.75)
Parking Facilities: $3,878,000 ($95.40)
Protective Inspection and Regulation - Other: $3,134,000 ($77.10)
Solid Waste Management: $3,085,000 ($75.90)
Judicial and Legal Services: $1,370,000 ($33.70)
Housing and Community Development: $1,077,000 ($26.50)
- General - Interest on Debt: $34,000 ($0.84)
- Other Capital Outlay - General - Other: $1,052,000 ($25.88)
- Total Salaries and Wages: $63,601,000 ($1564.68)
Annapolis government finances - Revenue in 2021 (per resident):
- Charges - Other: $11,209,000 ($275.76)
Sewerage: $7,787,000 ($191.57)
Parking Facilities: $5,256,000 ($129.31)
Parks and Recreation: $1,312,000 ($32.28)
- Federal Intergovernmental - Other: $2,909,000 ($71.57)
Highways: $1,631,000 ($40.12)
Housing and Community Development: $528,000 ($12.99)
- Local Intergovernmental - Other: $4,846,000 ($119.22)
- Miscellaneous - General Revenue - Other: $3,269,000 ($80.42)
Fines and Forfeits: $251,000 ($6.17)
Rents: $198,000 ($4.87)
Interest Earnings: $96,000 ($2.36)
Donations From Private Sources: $62,000 ($1.53)
- Revenue - Water Utilities: $7,490,000 ($184.26)
Transit Utilities: $167,000 ($4.11)
- State Intergovernmental - Other: $10,372,000 ($255.17)
- Tax - Property: $58,244,000 ($1432.89)
Other License: $1,872,000 ($46.05)
Other Selective Sales: $1,751,000 ($43.08)
Public Utility License: $771,000 ($18.97)
Alcoholic Beverage License: $444,000 ($10.92)
Occupation and Business License - Other: $122,000 ($3.00)
Annapolis government finances - Debt in 2021 (per resident):
- Long Term Debt - Beginning Outstanding - Unspecified Public Purpose: $160,553,000 ($3949.84)
Outstanding Unspecified Public Purpose: $151,189,000 ($3719.47)
Retired Unspecified Public Purpose: $9,911,000 ($243.83)
Beginning Outstanding - Public Debt for Private Purpose: $655,000 ($16.11)
Issue, Unspecified Public Purpose: $547,000 ($13.46)
Outstanding Nonguaranteed - Industrial Revenue: $515,000 ($12.67)
Retired Nonguaranteed - Public Debt for Private Purpose: $140,000 ($3.44)
Annapolis government finances - Cash and Securities in 2021 (per resident):
- Bond Funds - Cash and Securities: $1,359,000 ($33.43)
- Other Funds - Cash and Securities: $68,383,000 ($1682.32)
- Sinking Funds - Cash and Securities: $515,000 ($12.67)
8.53% of this county's 2021 resident taxpayers lived in other counties in 2020 ($82,630 average adjusted gross income)
| Here: | 8.53% |
| Maryland average: | 7.42% |
0.15% of residents moved from foreign countries ($1,366 average AGI)
Anne Arundel County: 0.15% Maryland average: 0.05%
Top counties from which taxpayers relocated into this county between 2020 and 2021:
| from Prince George's County, MD | |
| from Howard County, MD | |
| from Baltimore County, MD |
8.46% of this county's 2020 resident taxpayers moved to other counties in 2021 ($91,056 average adjusted gross income)
| Here: | 8.46% |
| Maryland average: | 7.91% |
0.11% of residents moved to foreign countries ($1,325 average AGI)
Anne Arundel County: 0.11% Maryland average: 0.04%
Top counties to which taxpayers relocated from this county between 2020 and 2021:
| to Baltimore County, MD | |
| to Baltimore city, MD | |
| to Prince George's County, MD |
| Businesses in Annapolis, MD | ||||
| Name | Count | Name | Count | |
|---|---|---|---|---|
| 24 Hour Fitness | 1 | Justice | 2 | |
| 7-Eleven | 5 | KFC | 1 | |
| ALDO | 1 | Kohl's | 1 | |
| AT&T | 3 | Kroger | 1 | |
| Abercrombie & Fitch | 1 | La-Z-Boy | 1 | |
| Advance Auto Parts | 1 | Lane Furniture | 2 | |
| Aeropostale | 1 | LensCrafters | 1 | |
| Aerosoles | 1 | Levi Strauss & Co. | 1 | |
| American Eagle Outfitters | 2 | Loews | 1 | |
| Ann Taylor | 3 | Macy's | 1 | |
| Apple Store | 1 | Marriott | 4 | |
| Applebee's | 1 | Marshalls | 1 | |
| Arby's | 1 | MasterBrand Cabinets | 13 | |
| Audi | 1 | Mazda | 1 | |
| BMW | 1 | McDonald's | 4 | |
| Baja Fresh Mexican Grill | 1 | Men's Wearhouse | 2 | |
| Bakers | 1 | Motherhood Maternity | 2 | |
| Banana Republic | 1 | New Balance | 10 | |
| Barnes & Noble | 1 | New York & Co | 1 | |
| Baskin-Robbins | 2 | Nike | 25 | |
| Bath & Body Works | 2 | Nissan | 1 | |
| Bebe | 1 | Nordstrom | 1 | |
| Bed Bath & Beyond | 1 | Office Depot | 1 | |
| Best Western | 1 | Old Country Buffet | 1 | |
| Brooks Brothers | 1 | Old Navy | 1 | |
| Brookstone | 1 | Outback | 1 | |
| Budget Car Rental | 1 | Outback Steakhouse | 1 | |
| Buffalo Wild Wings | 1 | Pac Sun | 1 | |
| Burger King | 1 | Panda Express | 1 | |
| Burlington Coat Factory | 1 | Panera Bread | 1 | |
| CVS | 4 | Papa John's Pizza | 1 | |
| Cache | 1 | Payless | 1 | |
| Casual Male XL | 1 | PetSmart | 1 | |
| Charlotte Russe | 1 | Pier 1 Imports | 1 | |
| Chick-Fil-A | 1 | Pizza Hut | 1 | |
| Chico's | 2 | Popeyes | 2 | |
| Chipotle | 1 | Pottery Barn | 1 | |
| Chuck E. Cheese's | 1 | Pottery Barn Kids | 1 | |
| Cinnabon | 1 | Quality | 1 | |
| Clarks | 1 | Quiznos | 1 | |
| Coldwater Creek | 1 | RadioShack | 2 | |
| Comfort Inn | 1 | Red Lobster | 1 | |
| Crate & Barrel | 1 | Red Robin | 1 | |
| Cricket Wireless | 3 | Rite Aid | 3 | |
| Dairy Queen | 1 | Ruby Tuesday | 1 | |
| Decora Cabinetry | 4 | SAS Shoes | 1 | |
| Dennys | 1 | Safeway | 2 | |
| Domino's Pizza | 1 | Sam's Club | 1 | |
| Dunkin Donuts | 4 | Sears | 2 | |
| Eddie Bauer | 1 | Sephora | 1 | |
| Express | 1 | Sheraton | 1 | |
| Extended Stay America | 1 | Skechers USA | 1 | |
| Famous Footwear | 1 | Soma Intimates | 1 | |
| Fashion Bug | 1 | Spencer Gifts | 1 | |
| FedEx | 23 | Sprint Nextel | 2 | |
| Finish Line | 1 | Staples | 1 | |
| Firestone Complete Auto Care | 1 | Starbucks | 9 | |
| Foot Locker | 1 | Subaru | 1 | |
| Ford | 1 | Subway | 8 | |
| Forever 21 | 1 | Super 8 | 1 | |
| GNC | 2 | T-Mobile | 3 | |
| GameStop | 3 | T.G.I. Driday's | 1 | |
| Gap | 1 | T.J.Maxx | 1 | |
| Giant | 2 | Talbots | 1 | |
| Goodwill | 1 | Target | 1 | |
| Gymboree | 1 | The Cheesecake Factory | 1 | |
| H&M | 1 | The Limited | 1 | |
| H&R Block | 4 | The Room Place | 1 | |
| Hilton | 2 | Torrid | 1 | |
| Holiday Inn | 1 | Toys"R"Us | 1 | |
| Hollister Co. | 1 | Trader Joe's | 1 | |
| Home Depot | 2 | True Value | 3 | |
| Homestead Studio Suites | 1 | U-Haul | 2 | |
| Honda | 1 | UPS | 29 | |
| Hot Topic | 1 | Vans | 6 | |
| Hyundai | 1 | Verizon Wireless | 3 | |
| J. Jill | 1 | Victoria's Secret | 1 | |
| J.Crew | 1 | Volkswagen | 1 | |
| JCPenney | 1 | Vons | 2 | |
| Jimmy John's | 2 | Wendy's | 3 | |
| JoS. A. Bank | 1 | Westin | 1 | |
| Johnny Rockets | 1 | Wet Seal | 1 | |
| Jones New York | 3 | Whole Foods Market | 2 | |
| Journeys | 1 | |||
Strongest AM radio stations in Annapolis:
- WBIS (1190 AM; 50 kW; ANNAPOLIS, MD; Owner: NATIONS RADIO, LLC)
- WNAV (1430 AM; 5 kW; ANNAPOLIS, MD; Owner: SAJAK BROADCASTING CORP.)
- WYRE (810 AM; daytime; 0 kW; ANNAPOLIS, MD)
- WTEM (980 AM; 50 kW; WASHINGTON, DC; Owner: AMFM RADIO LICENSES, L.L.C.)
- WWLG (1370 AM; 50 kW; BALTIMORE, MD; Owner: M-10 BROADCASTING, INC.)
- WPGC (1580 AM; 50 kW; MORNINGSIDE, MD; Owner: INFINITY WPGC(AM), INC.)
- WCBM (680 AM; 50 kW; BALTIMORE, MD; Owner: WCBM MARYLAND, INC.)
- WBAL (1090 AM; 50 kW; BALTIMORE, MD; Owner: HEARST RADIO, INC.)
- WWGB (1030 AM; daytime; 50 kW; INDIAN HEAD, MD; Owner: GOOD BODY MEDIA, LLC)
- WTOP (1500 AM; 50 kW; WASHINGTON, DC; Owner: BONNEVILLE HOLDING COMPANY)
- WGOP (700 AM; daytime; 25 kW; WALKERSVILLE, MD; Owner: BIRACH BROADCASTING CORPORATION)
- WMET (1150 AM; 50 kW; GAITHERSBURG, MD; Owner: BELTWAY ACQUISITION CORPORATION)
- WUST (1120 AM; daytime; 20 kW; WASHINGTON, DC)
Strongest FM radio stations in Annapolis:
- WFSI (107.9 FM; ANNAPOLIS, MD; Owner: FAMILY STATIONS, INC.)
- WWMX (106.5 FM; BALTIMORE, MD; Owner: INFINITY RADIO OPERATIONS INC.)
- WIYY (97.9 FM; BALTIMORE, MD; Owner: HEARST RADIO, INC.)
- WPOC (93.1 FM; BALTIMORE, MD; Owner: CITICASTERS LICENSES, L.P.)
- WLIF (101.9 FM; BALTIMORE, MD; Owner: INFINITY WLIF, INC.)
- WRNR-FM (103.1 FM; GRASONVILLE, MD; Owner: EMPIRE BROADCASTING SYSTEM, INC.)
- WBZS-FM (92.7 FM; PRINCE FREDERICK, MD; Owner: MEGA COMMUNICATIONS OF PRINCE FREDERICK LICENSEE, LLC)
- WRBS (95.1 FM; BALTIMORE, MD; Owner: PETER & JOHN RADIO FELLOWSHIP, INC.)
- WRQX (107.3 FM; WASHINGTON, DC; Owner: WMAL, INC.)
- WPGC-FM (95.5 FM; MORNINGSIDE, MD; Owner: INFINITY BROADCASTING CORPORATION OF MARYLAND)
- WWDC-FM (101.1 FM; WASHINGTON, DC; Owner: AMFM RADIO LICENSES, L.L.C.)
- WHUR-FM (96.3 FM; WASHINGTON, DC; Owner: THE HOWARD UNIVERSITY)
- WASH (97.1 FM; WASHINGTON, DC; Owner: AMFM RADIO LICENSES, L.L.C.)
- WWZZ (104.1 FM; WALDORF, MD; Owner: BONNEVILLE HOLDING COMPANY)
- WARW (94.7 FM; BETHESDA, MD; Owner: INFINITY BROADCASTING OPERATIONS, INC.)
- WHFS (99.1 FM; ANNAPOLIS, MD; Owner: INFINITY BROADCASTING OPERATIONS, INC.)
- WBIG-FM (100.3 FM; WASHINGTON, DC; Owner: AMFM RADIO LICENSES, L.L.C.)
- WIHT (99.5 FM; WASHINGTON, DC; Owner: AMFM RADIO LICENSES, L.L.C.)
- WZBA (100.7 FM; WESTMINSTER, MD; Owner: SHAMROCK COMMUNICATIONS, INC.)
- WWIN-FM (95.9 FM; GLEN BURNIE, MD; Owner: RADIO ONE LICENSES, LLC)
TV broadcast stations around Annapolis:
- W61BY (Channel 61; ANNAPOLIS, MD; Owner: ANNAPOLIS BROADCASTING COMPANY, INC.)
- W63BP (Channel 63; ANNAPOLIS, MD; Owner: ANNAPOLIS BROADCASTING COMPANY, INC.)
- WMPT (Channel 22; ANNAPOLIS, MD; Owner: MARYLAND PUBLIC BROADCASTING COMMISSION)
- WBAL-TV (Channel 11; BALTIMORE, MD; Owner: WBAL HEARST-ARGYLE TV, INC. (CA CORP.))
- WMAR-TV (Channel 2; BALTIMORE, MD; Owner: SCRIPPS HOWARD BROADCASTING COMPANY)
- WBFF (Channel 45; BALTIMORE, MD; Owner: CHESAPEAKE TELEVISION LICENSEE, LLC)
- WNUV (Channel 54; BALTIMORE, MD; Owner: BALTIMORE (WNUV-TV) LICENSEE, INC.)
- WJZ-TV (Channel 13; BALTIMORE, MD; Owner: VIACOM INC.)
- WUTB (Channel 24; BALTIMORE, MD; Owner: FOX TELEVISION STATIONS, INC.)
- WMPB (Channel 67; BALTIMORE, MD; Owner: MARYLAND PUBLIC BROADCASTING COMMISSION)
- WJLA-TV (Channel 7; WASHINGTON, DC; Owner: ACC LICENSEE, INC.)
- WUSA (Channel 9; WASHINGTON, DC; Owner: THE DETROIT NEWS, INC.)
- WTTG (Channel 5; WASHINGTON, DC; Owner: FOX TELEVISION STATIONS, INC.)
- WBDC-TV (Channel 50; WASHINGTON, DC; Owner: WBDC BROADCASTING, INC.)
- WIAV-LP (Channel 58; WASHINGTON, DC; Owner: ASIAVISION, INC.)
- WETA-TV (Channel 26; WASHINGTON, DC; Owner: THE GREATER WASHINGTON ED TELECOMM. ASSOC)
- WHUT-TV (Channel 32; WASHINGTON, DC; Owner: HOWARD UNIVERSITY)
- WDCA (Channel 20; WASHINGTON, DC; Owner: FOX TELEVISION STATIONS, INC.)
- WRC-TV (Channel 4; WASHINGTON, DC; Owner: NBC SUBSIDIARY (WRC-TV), INC.)
Medal of Honor Recipients
Medal of Honor Recipient born in Annapolis: Theodore Stark, Jr. Wilkinson.
- National Bridge Inventory (NBI) Statistics
- 12Number of bridges
- 686ft / 209mTotal length
- $2,369,000Total costs
- 451,083Total average daily traffic
- 28,323Total average daily truck traffic
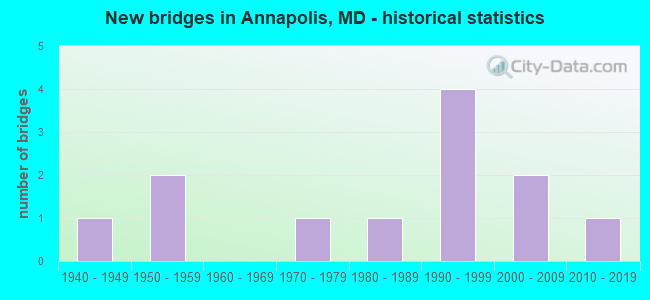
- New bridges - historical statistics
- 11940-1949
- 21950-1959
- 11970-1979
- 11980-1989
- 41990-1999
- 22000-2009
- 12010-2019
FCC Registered Antenna Towers: 137 (See the full list of FCC Registered Antenna Towers)
FCC Registered Commercial Land Mobile Towers: 4 (See the full list of FCC Registered Commercial Land Mobile Towers in Annapolis, MD)
FCC Registered Private Land Mobile Towers: 9 (See the full list of FCC Registered Private Land Mobile Towers)
FCC Registered Broadcast Land Mobile Towers: 76 (See the full list of FCC Registered Broadcast Land Mobile Towers)
FCC Registered Microwave Towers: 78 (See the full list of FCC Registered Microwave Towers in this town)
FCC Registered Paging Towers: 18 (See the full list of FCC Registered Paging Towers)
FCC Registered Maritime Coast & Aviation Ground Towers: 37 (See the full list of FCC Registered Maritime Coast & Aviation Ground Towers)
FCC Registered Amateur Radio Licenses: 746 (See the full list of FCC Registered Amateur Radio Licenses in Annapolis)
FAA Registered Aircraft Manufacturers and Dealers: 6 (See the full list of FAA Registered Manufacturers and Dealers in Annapolis)
FAA Registered Aircraft: 103 (See the full list of FAA Registered Aircraft)
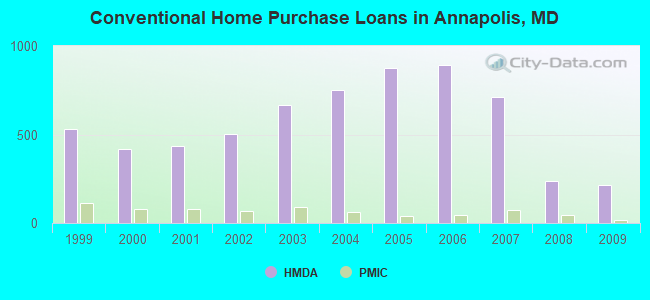
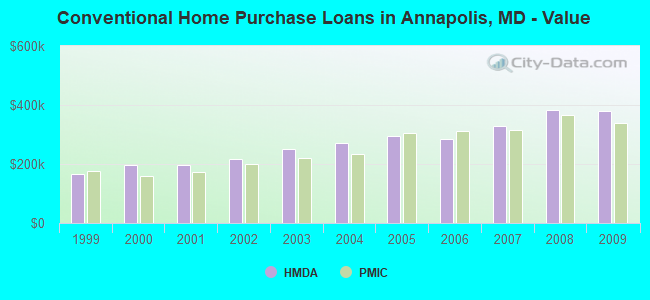
| Home Mortgage Disclosure Act Aggregated Statistics For Year 2009 (Based on 5 full and 3 partial tracts) | ||||||||||||
| A) FHA, FSA/RHS & VA Home Purchase Loans | B) Conventional Home Purchase Loans | C) Refinancings | D) Home Improvement Loans | E) Loans on Dwellings For 5+ Families | F) Non-occupant Loans on < 5 Family Dwellings (A B C & D) | |||||||
|---|---|---|---|---|---|---|---|---|---|---|---|---|
| Number | Average Value | Number | Average Value | Number | Average Value | Number | Average Value | Number | Average Value | Number | Average Value | |
| LOANS ORIGINATED | 141 | $273,116 | 215 | $378,643 | 952 | $303,718 | 46 | $204,799 | 2 | $2,533,475 | 131 | $294,467 |
| APPLICATIONS APPROVED, NOT ACCEPTED | 8 | $253,585 | 9 | $545,259 | 67 | $305,997 | 2 | $67,130 | 0 | $0 | 4 | $367,808 |
| APPLICATIONS DENIED | 19 | $239,718 | 35 | $484,796 | 269 | $317,843 | 18 | $136,508 | 2 | $668,025 | 39 | $284,311 |
| APPLICATIONS WITHDRAWN | 15 | $244,844 | 21 | $306,573 | 207 | $311,427 | 11 | $297,282 | 0 | $0 | 23 | $262,733 |
| FILES CLOSED FOR INCOMPLETENESS | 6 | $186,885 | 8 | $265,604 | 46 | $272,557 | 1 | $132,270 | 0 | $0 | 4 | $197,035 |
Detailed HMDA statistics for the following Tracts: 7025.00 , 7026.01, 7061.01, 7063.00, 7064.01, 7064.02, 7065.00, 7066.00
| Private Mortgage Insurance Companies Aggregated Statistics For Year 2009 (Based on 5 full and 3 partial tracts) | ||||
| A) Conventional Home Purchase Loans | B) Refinancings | |||
|---|---|---|---|---|
| Number | Average Value | Number | Average Value | |
| LOANS ORIGINATED | 19 | $339,239 | 12 | $325,275 |
| APPLICATIONS APPROVED, NOT ACCEPTED | 3 | $288,823 | 4 | $345,218 |
| APPLICATIONS DENIED | 0 | $0 | 6 | $364,545 |
| APPLICATIONS WITHDRAWN | 1 | $77,000 | 1 | $323,950 |
| FILES CLOSED FOR INCOMPLETENESS | 0 | $0 | 0 | $0 |
Detailed PMIC statistics for the following Tracts: 7025.00 , 7026.01, 7061.01, 7063.00, 7064.01, 7064.02, 7065.00, 7066.00
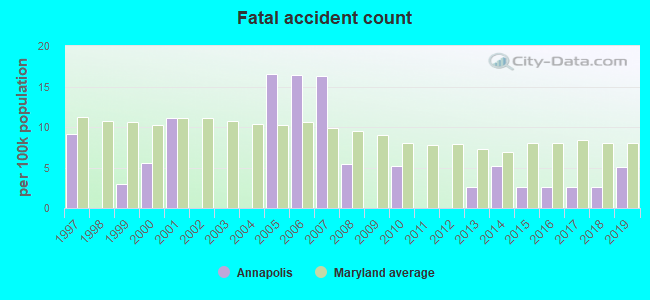
2009 - 2018 National Fire Incident Reporting System (NFIRS) incidents
- Fire incident types reported to NFIRS in Annapolis, MD
- 1,56255.2%Structure Fires
- 76327.0%Outside Fires
- 41014.5%Mobile Property/Vehicle Fires
- 963.4%Other
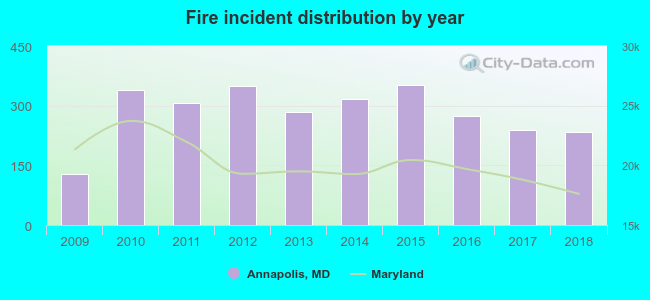 Based on the data from the years 2009 - 2018 the average number of fires per year is 282. The highest number of fire incidents - 352 took place in 2015, and the least - 127 in 2009. The data has an increasing trend.
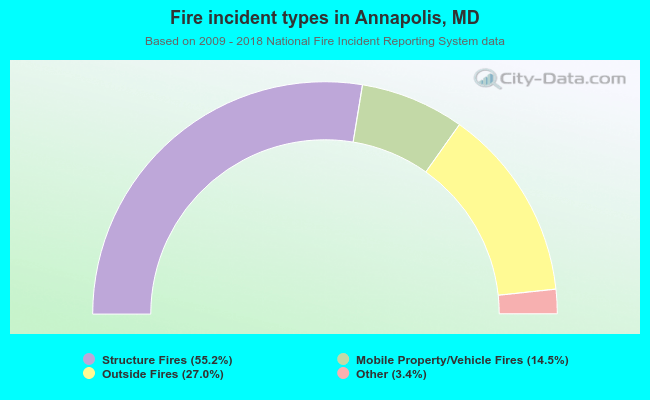 When looking into fire subcategories, the most incidents belonged to: Structure Fires (55.2%), and Outside Fires (27.0%).
Fire-safe hotels and motels in Annapolis, Maryland:
- Annapolis Courtyard By Marriott, 2559 Riva Rd, Annapolis, Maryland 21401 , Phone: (410) 266-1555, Fax: (410) 266-6376
- Annapolis Marriott Waterfront, 80 Compromise St, Annapolis, Maryland 21401 , Phone: (410) 268-7555
- Crown Plaza Annapolis, 173 Jennifer Rd, Annapolis, Maryland 21401 , Phone: (410) 266-3131, Fax: (410) 266-6247
- Quality Inns And Suites, 1542 Whitehall Rd, Annapolis, Maryland 21401 , Phone: (410) 974-4440, Fax: (410) 757-6419
- Historic Inns Of Annapolis, 58 State Cir, Annapolis, Maryland 21401 , Phone: (410) 263-2641, Fax: (410) 268-3813
- Doubletree by Hilton Hotel Annapolis, 210 Holiday Ct, Annapolis, Maryland 21401 , Phone: (410) 224-3150, Fax: (410) 571-1123
- Hotel Annapolis, 126 West St, Annapolis, Maryland 21401 , Phone: (410) 263-7777
- Residence Inn By Marriott Annapolis, 170 Admiral Cochrane Dr, Annapolis, Maryland 21401 , Phone: (410) 573-0300, Fax: (410) 573-0316
- 18 other hotels and motels
| Most common first names in Annapolis, MD among deceased individuals | ||
| Name | Count | Lived (average) |
|---|---|---|
| Mary | 617 | 79.7 years |
| John | 606 | 73.9 years |
| William | 540 | 74.6 years |
| James | 447 | 72.1 years |
| Charles | 371 | 73.2 years |
| Robert | 320 | 72.6 years |
| Margaret | 307 | 79.6 years |
| George | 294 | 75.1 years |
| Joseph | 276 | 74.1 years |
| Helen | 274 | 80.7 years |
| Most common last names in Annapolis, MD among deceased individuals | ||
| Last name | Count | Lived (average) |
|---|---|---|
| Johnson | 237 | 74.1 years |
| Smith | 232 | 77.1 years |
| Brown | 200 | 73.3 years |
| Jones | 171 | 73.1 years |
| Williams | 131 | 73.3 years |
| Miller | 103 | 77.5 years |
| Parker | 95 | 73.0 years |
| Taylor | 90 | 75.4 years |
| Thomas | 89 | 73.3 years |
| Hall | 83 | 75.1 years |
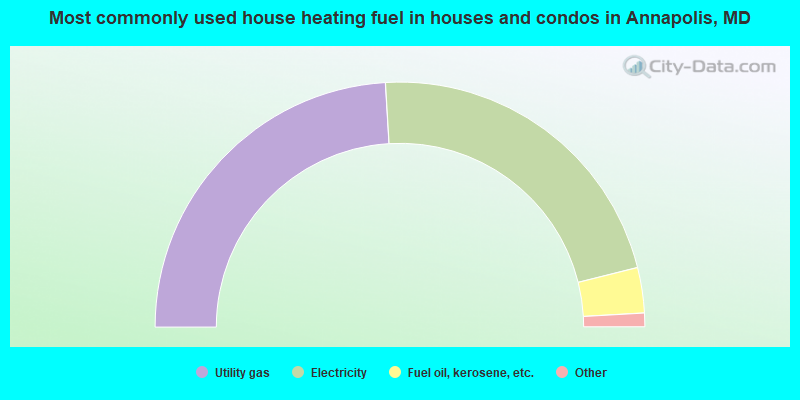
- 48.1%Utility gas
- 44.1%Electricity
- 6.0%Fuel oil, kerosene, etc.
- 0.9%Bottled, tank, or LP gas
- 0.9%Wood
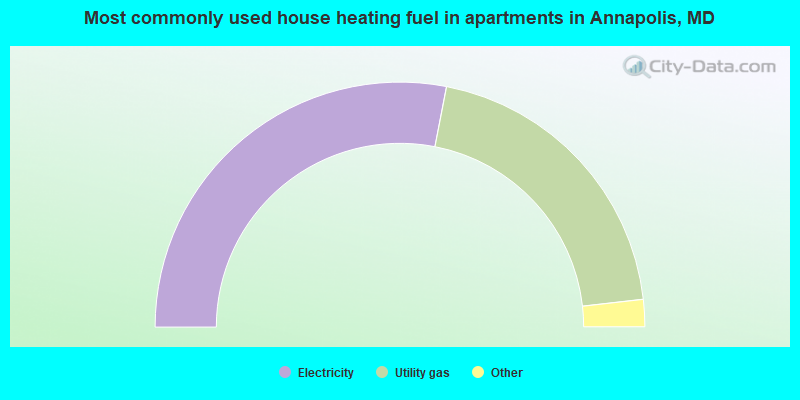
- 56.1%Electricity
- 40.3%Utility gas
- 1.9%Bottled, tank, or LP gas
- 0.8%Fuel oil, kerosene, etc.
- 0.7%No fuel used
- 0.2%Wood
Annapolis compared to Maryland state average:
- Unemployed percentage significantly below state average.
- Hispanic race population percentage above state average.
- Renting percentage above state average.
- Length of stay since moving in significantly above state average.
- Percentage of population with a bachelor's degree or higher above state average.
Annapolis on our top lists:
- #38 on the list of "Top 101 cities with the most local government spending on current operations of parking facilities per resident (population 10,000+)"
- #40 on the list of "Top 101 cities with the most full-time firefighters per 1000 residents (population 5,000+)"
- #50 on the list of "Top 101 cities with the most people taking a taxi to work (population 5,000+)"
- #78 on the list of "Top 101 cities with the largest racial income disparity between any two races with at least 2,000 householders"
- #3 (21402) on the list of "Top 101 zip codes with the largest percentage of returns reporting salary or wage in 2012 (pop 1,000+)"
- #13 (21402) on the list of "Top 101 zip codes with the smallest percentage of taxpayers using paid preparers for 2012 taxes (pop 5,000+)"
- #42 (21402) on the list of "Top 101 zip codes with the smallest percentage of taxpayers reporting profit/loss from business in 2012 (pop 5,000+)"
- #66 (21402) on the list of "Top 101 zip codes with the lowest 2012 average reported profit/loss from business (pop 5,000+)"
- #89 (21401) on the list of "Top 101 zip codes with the most full service restaurants in 2005"
- #97 (21401) on the list of "Top 101 zip codes with the most beauty salons in 2005"
- #33 on the list of "Top 101 counties with the highest percentage of residents that visited a dentist within the past year"
- #36 on the list of "Top 101 counties with the largest decrease in the number of infant deaths per 1000 residents 2000-2006 to 2007-2013 (pop. 50,000+)"
- #56 on the list of "Top 101 counties with the lowest Particulate Matter (PM10) Annual air pollution readings in 2012 (µg/m3)"
- #59 on the list of "Top 101 counties with the best general health status score of residents (1-5), 3 years of data"
- #71 on the list of "Top 101 counties with the lowest percentage of residents that keep firearms around their homes"

|
|
Total of 727 patent applications in 2008-2024.