Arvada, Colorado Submit your own pictures of this city and show them to the world
OSM Map
General Map
Google Map
MSN Map
OSM Map
General Map
Google Map
MSN Map
OSM Map
General Map
Google Map
MSN Map
OSM Map
General Map
Google Map
MSN Map
Please wait while loading the map...
Population in 2022: 121,581 (100% urban, 0% rural). Population change since 2000: +19.0%Males: 61,039 Females: 60,542
March 2022 cost of living index in Arvada: 109.9 (more than average, U.S. average is 100) Percentage of residents living in poverty in 2022: 5.0%for White Non-Hispanic residents , 12.2% for Black residents , 12.6% for Hispanic or Latino residents , 7.2% for other race residents , 11.1% for two or more races residents )
Profiles of local businesses
Business Search - 14 Million verified businesses
Data:
Median household income ($)
Median household income (% change since 2000)
Household income diversity
Ratio of average income to average house value (%)
Ratio of average income to average rent
Median household income ($) - White
Median household income ($) - Black or African American
Median household income ($) - Asian
Median household income ($) - Hispanic or Latino
Median household income ($) - American Indian and Alaska Native
Median household income ($) - Multirace
Median household income ($) - Other Race
Median household income for houses/condos with a mortgage ($)
Median household income for apartments without a mortgage ($)
Races - White alone (%)
Races - White alone (% change since 2000)
Races - Black alone (%)
Races - Black alone (% change since 2000)
Races - American Indian alone (%)
Races - American Indian alone (% change since 2000)
Races - Asian alone (%)
Races - Asian alone (% change since 2000)
Races - Hispanic (%)
Races - Hispanic (% change since 2000)
Races - Native Hawaiian and Other Pacific Islander alone (%)
Races - Native Hawaiian and Other Pacific Islander alone (% change since 2000)
Races - Two or more races (%)
Races - Two or more races (% change since 2000)
Races - Other race alone (%)
Races - Other race alone (% change since 2000)
Racial diversity
Unemployment (%)
Unemployment (% change since 2000)
Unemployment (%) - White
Unemployment (%) - Black or African American
Unemployment (%) - Asian
Unemployment (%) - Hispanic or Latino
Unemployment (%) - American Indian and Alaska Native
Unemployment (%) - Multirace
Unemployment (%) - Other Race
Population density (people per square mile)
Population - Males (%)
Population - Females (%)
Population - Males (%) - White
Population - Males (%) - Black or African American
Population - Males (%) - Asian
Population - Males (%) - Hispanic or Latino
Population - Males (%) - American Indian and Alaska Native
Population - Males (%) - Multirace
Population - Males (%) - Other Race
Population - Females (%) - White
Population - Females (%) - Black or African American
Population - Females (%) - Asian
Population - Females (%) - Hispanic or Latino
Population - Females (%) - American Indian and Alaska Native
Population - Females (%) - Multirace
Population - Females (%) - Other Race
Coronavirus confirmed cases (Apr 27, 2024)
Deaths caused by coronavirus (Apr 27, 2024)
Coronavirus confirmed cases (per 100k population) (Apr 27, 2024)
Deaths caused by coronavirus (per 100k population) (Apr 27, 2024)
Daily increase in number of cases (Apr 27, 2024)
Weekly increase in number of cases (Apr 27, 2024)
Cases doubled (in days) (Apr 27, 2024)
Hospitalized patients (Apr 18, 2022)
Negative test results (Apr 18, 2022)
Total test results (Apr 18, 2022)
COVID Vaccine doses distributed (per 100k population) (Sep 19, 2023)
COVID Vaccine doses administered (per 100k population) (Sep 19, 2023)
COVID Vaccine doses distributed (Sep 19, 2023)
COVID Vaccine doses administered (Sep 19, 2023)
Likely homosexual households (%)
Likely homosexual households (% change since 2000)
Likely homosexual households - Lesbian couples (%)
Likely homosexual households - Lesbian couples (% change since 2000)
Likely homosexual households - Gay men (%)
Likely homosexual households - Gay men (% change since 2000)
Cost of living index
Median gross rent ($)
Median contract rent ($)
Median monthly housing costs ($)
Median house or condo value ($)
Median house or condo value ($ change since 2000)
Mean house or condo value by units in structure - 1, detached ($)
Mean house or condo value by units in structure - 1, attached ($)
Mean house or condo value by units in structure - 2 ($)
Mean house or condo value by units in structure by units in structure - 3 or 4 ($)
Mean house or condo value by units in structure - 5 or more ($)
Mean house or condo value by units in structure - Boat, RV, van, etc. ($)
Mean house or condo value by units in structure - Mobile home ($)
Median house or condo value ($) - White
Median house or condo value ($) - Black or African American
Median house or condo value ($) - Asian
Median house or condo value ($) - Hispanic or Latino
Median house or condo value ($) - American Indian and Alaska Native
Median house or condo value ($) - Multirace
Median house or condo value ($) - Other Race
Median resident age
Resident age diversity
Median resident age - Males
Median resident age - Females
Median resident age - White
Median resident age - Black or African American
Median resident age - Asian
Median resident age - Hispanic or Latino
Median resident age - American Indian and Alaska Native
Median resident age - Multirace
Median resident age - Other Race
Median resident age - Males - White
Median resident age - Males - Black or African American
Median resident age - Males - Asian
Median resident age - Males - Hispanic or Latino
Median resident age - Males - American Indian and Alaska Native
Median resident age - Males - Multirace
Median resident age - Males - Other Race
Median resident age - Females - White
Median resident age - Females - Black or African American
Median resident age - Females - Asian
Median resident age - Females - Hispanic or Latino
Median resident age - Females - American Indian and Alaska Native
Median resident age - Females - Multirace
Median resident age - Females - Other Race
Commute - mean travel time to work (minutes)
Travel time to work - Less than 5 minutes (%)
Travel time to work - Less than 5 minutes (% change since 2000)
Travel time to work - 5 to 9 minutes (%)
Travel time to work - 5 to 9 minutes (% change since 2000)
Travel time to work - 10 to 19 minutes (%)
Travel time to work - 10 to 19 minutes (% change since 2000)
Travel time to work - 20 to 29 minutes (%)
Travel time to work - 20 to 29 minutes (% change since 2000)
Travel time to work - 30 to 39 minutes (%)
Travel time to work - 30 to 39 minutes (% change since 2000)
Travel time to work - 40 to 59 minutes (%)
Travel time to work - 40 to 59 minutes (% change since 2000)
Travel time to work - 60 to 89 minutes (%)
Travel time to work - 60 to 89 minutes (% change since 2000)
Travel time to work - 90 or more minutes (%)
Travel time to work - 90 or more minutes (% change since 2000)
Marital status - Never married (%)
Marital status - Now married (%)
Marital status - Separated (%)
Marital status - Widowed (%)
Marital status - Divorced (%)
Median family income ($)
Median family income (% change since 2000)
Median non-family income ($)
Median non-family income (% change since 2000)
Median per capita income ($)
Median per capita income (% change since 2000)
Median family income ($) - White
Median family income ($) - Black or African American
Median family income ($) - Asian
Median family income ($) - Hispanic or Latino
Median family income ($) - American Indian and Alaska Native
Median family income ($) - Multirace
Median family income ($) - Other Race
Median year house/condo built
Median year apartment built
Year house built - Built 2005 or later (%)
Year house built - Built 2000 to 2004 (%)
Year house built - Built 1990 to 1999 (%)
Year house built - Built 1980 to 1989 (%)
Year house built - Built 1970 to 1979 (%)
Year house built - Built 1960 to 1969 (%)
Year house built - Built 1950 to 1959 (%)
Year house built - Built 1940 to 1949 (%)
Year house built - Built 1939 or earlier (%)
Average household size
Household density (households per square mile)
Average household size - White
Average household size - Black or African American
Average household size - Asian
Average household size - Hispanic or Latino
Average household size - American Indian and Alaska Native
Average household size - Multirace
Average household size - Other Race
Occupied housing units (%)
Vacant housing units (%)
Owner occupied housing units (%)
Renter occupied housing units (%)
Vacancy status - For rent (%)
Vacancy status - For sale only (%)
Vacancy status - Rented or sold, not occupied (%)
Vacancy status - For seasonal, recreational, or occasional use (%)
Vacancy status - For migrant workers (%)
Vacancy status - Other vacant (%)
Residents with income below the poverty level (%)
Residents with income below 50% of the poverty level (%)
Children below poverty level (%)
Poor families by family type - Married-couple family (%)
Poor families by family type - Male, no wife present (%)
Poor families by family type - Female, no husband present (%)
Poverty status for native-born residents (%)
Poverty status for foreign-born residents (%)
Poverty among high school graduates not in families (%)
Poverty among people who did not graduate high school not in families (%)
Residents with income below the poverty level (%) - White
Residents with income below the poverty level (%) - Black or African American
Residents with income below the poverty level (%) - Asian
Residents with income below the poverty level (%) - Hispanic or Latino
Residents with income below the poverty level (%) - American Indian and Alaska Native
Residents with income below the poverty level (%) - Multirace
Residents with income below the poverty level (%) - Other Race
Air pollution - Air Quality Index (AQI)
Air pollution - CO
Air pollution - NO2
Air pollution - SO2
Air pollution - Ozone
Air pollution - PM10
Air pollution - PM25
Air pollution - Pb
Crime - Murders per 100,000 population
Crime - Rapes per 100,000 population
Crime - Robberies per 100,000 population
Crime - Assaults per 100,000 population
Crime - Burglaries per 100,000 population
Crime - Thefts per 100,000 population
Crime - Auto thefts per 100,000 population
Crime - Arson per 100,000 population
Crime - City-data.com crime index
Crime - Violent crime index
Crime - Property crime index
Crime - Murders per 100,000 population (5 year average)
Crime - Rapes per 100,000 population (5 year average)
Crime - Robberies per 100,000 population (5 year average)
Crime - Assaults per 100,000 population (5 year average)
Crime - Burglaries per 100,000 population (5 year average)
Crime - Thefts per 100,000 population (5 year average)
Crime - Auto thefts per 100,000 population (5 year average)
Crime - Arson per 100,000 population (5 year average)
Crime - City-data.com crime index (5 year average)
Crime - Violent crime index (5 year average)
Crime - Property crime index (5 year average)
1996 Presidential Elections Results (%) - Democratic Party (Clinton)
1996 Presidential Elections Results (%) - Republican Party (Dole)
1996 Presidential Elections Results (%) - Other
2000 Presidential Elections Results (%) - Democratic Party (Gore)
2000 Presidential Elections Results (%) - Republican Party (Bush)
2000 Presidential Elections Results (%) - Other
2004 Presidential Elections Results (%) - Democratic Party (Kerry)
2004 Presidential Elections Results (%) - Republican Party (Bush)
2004 Presidential Elections Results (%) - Other
2008 Presidential Elections Results (%) - Democratic Party (Obama)
2008 Presidential Elections Results (%) - Republican Party (McCain)
2008 Presidential Elections Results (%) - Other
2012 Presidential Elections Results (%) - Democratic Party (Obama)
2012 Presidential Elections Results (%) - Republican Party (Romney)
2012 Presidential Elections Results (%) - Other
2016 Presidential Elections Results (%) - Democratic Party (Clinton)
2016 Presidential Elections Results (%) - Republican Party (Trump)
2016 Presidential Elections Results (%) - Other
2020 Presidential Elections Results (%) - Democratic Party (Biden)
2020 Presidential Elections Results (%) - Republican Party (Trump)
2020 Presidential Elections Results (%) - Other
Ancestries Reported - Arab (%)
Ancestries Reported - Czech (%)
Ancestries Reported - Danish (%)
Ancestries Reported - Dutch (%)
Ancestries Reported - English (%)
Ancestries Reported - French (%)
Ancestries Reported - French Canadian (%)
Ancestries Reported - German (%)
Ancestries Reported - Greek (%)
Ancestries Reported - Hungarian (%)
Ancestries Reported - Irish (%)
Ancestries Reported - Italian (%)
Ancestries Reported - Lithuanian (%)
Ancestries Reported - Norwegian (%)
Ancestries Reported - Polish (%)
Ancestries Reported - Portuguese (%)
Ancestries Reported - Russian (%)
Ancestries Reported - Scotch-Irish (%)
Ancestries Reported - Scottish (%)
Ancestries Reported - Slovak (%)
Ancestries Reported - Subsaharan African (%)
Ancestries Reported - Swedish (%)
Ancestries Reported - Swiss (%)
Ancestries Reported - Ukrainian (%)
Ancestries Reported - United States (%)
Ancestries Reported - Welsh (%)
Ancestries Reported - West Indian (%)
Ancestries Reported - Other (%)
Educational Attainment - No schooling completed (%)
Educational Attainment - Less than high school (%)
Educational Attainment - High school or equivalent (%)
Educational Attainment - Less than 1 year of college (%)
Educational Attainment - 1 or more years of college (%)
Educational Attainment - Associate degree (%)
Educational Attainment - Bachelor's degree (%)
Educational Attainment - Master's degree (%)
Educational Attainment - Professional school degree (%)
Educational Attainment - Doctorate degree (%)
School Enrollment - Nursery, preschool (%)
School Enrollment - Kindergarten (%)
School Enrollment - Grade 1 to 4 (%)
School Enrollment - Grade 5 to 8 (%)
School Enrollment - Grade 9 to 12 (%)
School Enrollment - College undergrad (%)
School Enrollment - Graduate or professional (%)
School Enrollment - Not enrolled in school (%)
School enrollment - Public schools (%)
School enrollment - Private schools (%)
School enrollment - Not enrolled (%)
Median number of rooms in houses and condos
Median number of rooms in apartments
Housing units lacking complete plumbing facilities (%)
Housing units lacking complete kitchen facilities (%)
Density of houses
Urban houses (%)
Rural houses (%)
Households with people 60 years and over (%)
Households with people 65 years and over (%)
Households with people 75 years and over (%)
Households with one or more nonrelatives (%)
Households with no nonrelatives (%)
Population in households (%)
Family households (%)
Nonfamily households (%)
Population in families (%)
Family households with own children (%)
Median number of bedrooms in owner occupied houses
Mean number of bedrooms in owner occupied houses
Median number of bedrooms in renter occupied houses
Mean number of bedrooms in renter occupied houses
Median number of vehichles in owner occupied houses
Mean number of vehichles in owner occupied houses
Median number of vehichles in renter occupied houses
Mean number of vehichles in renter occupied houses
Mortgage status - with mortgage (%)
Mortgage status - with second mortgage (%)
Mortgage status - with home equity loan (%)
Mortgage status - with both second mortgage and home equity loan (%)
Mortgage status - without a mortgage (%)
Average family size
Average family size - White
Average family size - Black or African American
Average family size - Asian
Average family size - Hispanic or Latino
Average family size - American Indian and Alaska Native
Average family size - Multirace
Average family size - Other Race
Geographical mobility - Same house 1 year ago (%)
Geographical mobility - Moved within same county (%)
Geographical mobility - Moved from different county within same state (%)
Geographical mobility - Moved from different state (%)
Geographical mobility - Moved from abroad (%)
Place of birth - Born in state of residence (%)
Place of birth - Born in other state (%)
Place of birth - Native, outside of US (%)
Place of birth - Foreign born (%)
Housing units in structures - 1, detached (%)
Housing units in structures - 1, attached (%)
Housing units in structures - 2 (%)
Housing units in structures - 3 or 4 (%)
Housing units in structures - 5 to 9 (%)
Housing units in structures - 10 to 19 (%)
Housing units in structures - 20 to 49 (%)
Housing units in structures - 50 or more (%)
Housing units in structures - Mobile home (%)
Housing units in structures - Boat, RV, van, etc. (%)
House/condo owner moved in on average (years ago)
Renter moved in on average (years ago)
Year householder moved into unit - Moved in 1999 to March 2000 (%)
Year householder moved into unit - Moved in 1995 to 1998 (%)
Year householder moved into unit - Moved in 1990 to 1994 (%)
Year householder moved into unit - Moved in 1980 to 1989 (%)
Year householder moved into unit - Moved in 1970 to 1979 (%)
Year householder moved into unit - Moved in 1969 or earlier (%)
Means of transportation to work - Drove car alone (%)
Means of transportation to work - Carpooled (%)
Means of transportation to work - Public transportation (%)
Means of transportation to work - Bus or trolley bus (%)
Means of transportation to work - Streetcar or trolley car (%)
Means of transportation to work - Subway or elevated (%)
Means of transportation to work - Railroad (%)
Means of transportation to work - Ferryboat (%)
Means of transportation to work - Taxicab (%)
Means of transportation to work - Motorcycle (%)
Means of transportation to work - Bicycle (%)
Means of transportation to work - Walked (%)
Means of transportation to work - Other means (%)
Working at home (%)
Industry diversity
Most Common Industries - Agriculture, forestry, fishing and hunting, and mining (%)
Most Common Industries - Agriculture, forestry, fishing and hunting (%)
Most Common Industries - Mining, quarrying, and oil and gas extraction (%)
Most Common Industries - Construction (%)
Most Common Industries - Manufacturing (%)
Most Common Industries - Wholesale trade (%)
Most Common Industries - Retail trade (%)
Most Common Industries - Transportation and warehousing, and utilities (%)
Most Common Industries - Transportation and warehousing (%)
Most Common Industries - Utilities (%)
Most Common Industries - Information (%)
Most Common Industries - Finance and insurance, and real estate and rental and leasing (%)
Most Common Industries - Finance and insurance (%)
Most Common Industries - Real estate and rental and leasing (%)
Most Common Industries - Professional, scientific, and management, and administrative and waste management services (%)
Most Common Industries - Professional, scientific, and technical services (%)
Most Common Industries - Management of companies and enterprises (%)
Most Common Industries - Administrative and support and waste management services (%)
Most Common Industries - Educational services, and health care and social assistance (%)
Most Common Industries - Educational services (%)
Most Common Industries - Health care and social assistance (%)
Most Common Industries - Arts, entertainment, and recreation, and accommodation and food services (%)
Most Common Industries - Arts, entertainment, and recreation (%)
Most Common Industries - Accommodation and food services (%)
Most Common Industries - Other services, except public administration (%)
Most Common Industries - Public administration (%)
Occupation diversity
Most Common Occupations - Management, business, science, and arts occupations (%)
Most Common Occupations - Management, business, and financial occupations (%)
Most Common Occupations - Management occupations (%)
Most Common Occupations - Business and financial operations occupations (%)
Most Common Occupations - Computer, engineering, and science occupations (%)
Most Common Occupations - Computer and mathematical occupations (%)
Most Common Occupations - Architecture and engineering occupations (%)
Most Common Occupations - Life, physical, and social science occupations (%)
Most Common Occupations - Education, legal, community service, arts, and media occupations (%)
Most Common Occupations - Community and social service occupations (%)
Most Common Occupations - Legal occupations (%)
Most Common Occupations - Education, training, and library occupations (%)
Most Common Occupations - Arts, design, entertainment, sports, and media occupations (%)
Most Common Occupations - Healthcare practitioners and technical occupations (%)
Most Common Occupations - Health diagnosing and treating practitioners and other technical occupations (%)
Most Common Occupations - Health technologists and technicians (%)
Most Common Occupations - Service occupations (%)
Most Common Occupations - Healthcare support occupations (%)
Most Common Occupations - Protective service occupations (%)
Most Common Occupations - Fire fighting and prevention, and other protective service workers including supervisors (%)
Most Common Occupations - Law enforcement workers including supervisors (%)
Most Common Occupations - Food preparation and serving related occupations (%)
Most Common Occupations - Building and grounds cleaning and maintenance occupations (%)
Most Common Occupations - Personal care and service occupations (%)
Most Common Occupations - Sales and office occupations (%)
Most Common Occupations - Sales and related occupations (%)
Most Common Occupations - Office and administrative support occupations (%)
Most Common Occupations - Natural resources, construction, and maintenance occupations (%)
Most Common Occupations - Farming, fishing, and forestry occupations (%)
Most Common Occupations - Construction and extraction occupations (%)
Most Common Occupations - Installation, maintenance, and repair occupations (%)
Most Common Occupations - Production, transportation, and material moving occupations (%)
Most Common Occupations - Production occupations (%)
Most Common Occupations - Transportation occupations (%)
Most Common Occupations - Material moving occupations (%)
People in Group quarters - Institutionalized population (%)
People in Group quarters - Correctional institutions (%)
People in Group quarters - Federal prisons and detention centers (%)
People in Group quarters - Halfway houses (%)
People in Group quarters - Local jails and other confinement facilities (including police lockups) (%)
People in Group quarters - Military disciplinary barracks (%)
People in Group quarters - State prisons (%)
People in Group quarters - Other types of correctional institutions (%)
People in Group quarters - Nursing homes (%)
People in Group quarters - Hospitals/wards, hospices, and schools for the handicapped (%)
People in Group quarters - Hospitals/wards and hospices for chronically ill (%)
People in Group quarters - Hospices or homes for chronically ill (%)
People in Group quarters - Military hospitals or wards for chronically ill (%)
People in Group quarters - Other hospitals or wards for chronically ill (%)
People in Group quarters - Hospitals or wards for drug/alcohol abuse (%)
People in Group quarters - Mental (Psychiatric) hospitals or wards (%)
People in Group quarters - Schools, hospitals, or wards for the mentally retarded (%)
People in Group quarters - Schools, hospitals, or wards for the physically handicapped (%)
People in Group quarters - Institutions for the deaf (%)
People in Group quarters - Institutions for the blind (%)
People in Group quarters - Orthopedic wards and institutions for the physically handicapped (%)
People in Group quarters - Wards in general hospitals for patients who have no usual home elsewhere (%)
People in Group quarters - Wards in military hospitals for patients who have no usual home elsewhere (%)
People in Group quarters - Juvenile institutions (%)
People in Group quarters - Long-term care (%)
People in Group quarters - Homes for abused, dependent, and neglected children (%)
People in Group quarters - Residential treatment centers for emotionally disturbed children (%)
People in Group quarters - Training schools for juvenile delinquents (%)
People in Group quarters - Short-term care, detention or diagnostic centers for delinquent children (%)
People in Group quarters - Type of juvenile institution unknown (%)
People in Group quarters - Noninstitutionalized population (%)
People in Group quarters - College dormitories (includes college quarters off campus) (%)
People in Group quarters - Military quarters (%)
People in Group quarters - On base (%)
People in Group quarters - Barracks, unaccompanied personnel housing (UPH), (Enlisted/Officer), ;and similar group living quarters for military personnel (%)
People in Group quarters - Transient quarters for temporary residents (%)
People in Group quarters - Military ships (%)
People in Group quarters - Group homes (%)
People in Group quarters - Homes or halfway houses for drug/alcohol abuse (%)
People in Group quarters - Homes for the mentally ill (%)
People in Group quarters - Homes for the mentally retarded (%)
People in Group quarters - Homes for the physically handicapped (%)
People in Group quarters - Other group homes (%)
People in Group quarters - Religious group quarters (%)
People in Group quarters - Dormitories (%)
People in Group quarters - Agriculture workers' dormitories on farms (%)
People in Group quarters - Job Corps and vocational training facilities (%)
People in Group quarters - Other workers' dormitories (%)
People in Group quarters - Crews of maritime vessels (%)
People in Group quarters - Other nonhousehold living situations (%)
People in Group quarters - Other noninstitutional group quarters (%)
Residents speaking English at home (%)
Residents speaking English at home - Born in the United States (%)
Residents speaking English at home - Native, born elsewhere (%)
Residents speaking English at home - Foreign born (%)
Residents speaking Spanish at home (%)
Residents speaking Spanish at home - Born in the United States (%)
Residents speaking Spanish at home - Native, born elsewhere (%)
Residents speaking Spanish at home - Foreign born (%)
Residents speaking other language at home (%)
Residents speaking other language at home - Born in the United States (%)
Residents speaking other language at home - Native, born elsewhere (%)
Residents speaking other language at home - Foreign born (%)
Class of Workers - Employee of private company (%)
Class of Workers - Self-employed in own incorporated business (%)
Class of Workers - Private not-for-profit wage and salary workers (%)
Class of Workers - Local government workers (%)
Class of Workers - State government workers (%)
Class of Workers - Federal government workers (%)
Class of Workers - Self-employed workers in own not incorporated business and Unpaid family workers (%)
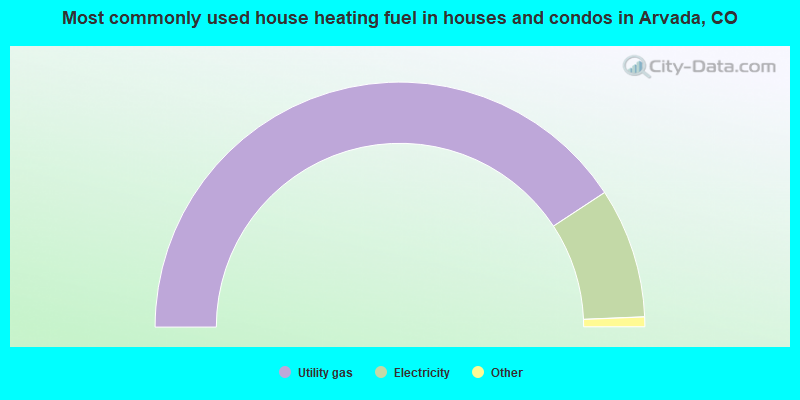
House heating fuel used in houses and condos - Utility gas (%)
House heating fuel used in houses and condos - Bottled, tank, or LP gas (%)
House heating fuel used in houses and condos - Electricity (%)
House heating fuel used in houses and condos - Fuel oil, kerosene, etc. (%)
House heating fuel used in houses and condos - Coal or coke (%)
House heating fuel used in houses and condos - Wood (%)
House heating fuel used in houses and condos - Solar energy (%)
House heating fuel used in houses and condos - Other fuel (%)
House heating fuel used in houses and condos - No fuel used (%)
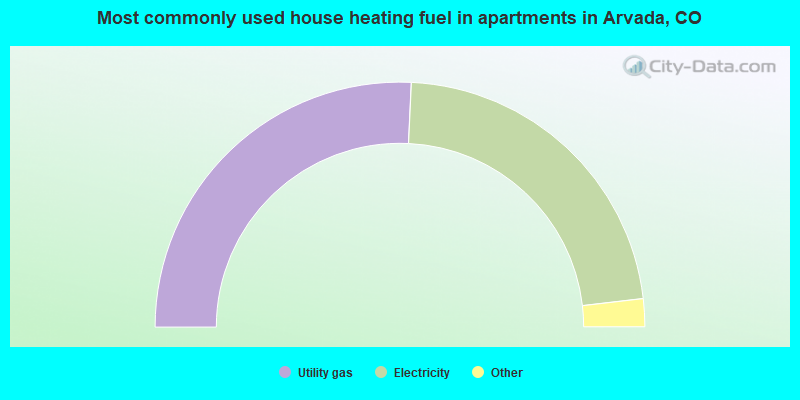
House heating fuel used in apartments - Utility gas (%)
House heating fuel used in apartments - Bottled, tank, or LP gas (%)
House heating fuel used in apartments - Electricity (%)
House heating fuel used in apartments - Fuel oil, kerosene, etc. (%)
House heating fuel used in apartments - Coal or coke (%)
House heating fuel used in apartments - Wood (%)
House heating fuel used in apartments - Solar energy (%)
House heating fuel used in apartments - Other fuel (%)
House heating fuel used in apartments - No fuel used (%)
Armed forces status - In Armed Forces (%)
Armed forces status - Civilian (%)
Armed forces status - Civilian - Veteran (%)
Armed forces status - Civilian - Nonveteran (%)
Fatal accidents locations in years 2005-2021
Fatal accidents locations in 2005
Fatal accidents locations in 2006
Fatal accidents locations in 2007
Fatal accidents locations in 2008
Fatal accidents locations in 2009
Fatal accidents locations in 2010
Fatal accidents locations in 2011
Fatal accidents locations in 2012
Fatal accidents locations in 2013
Fatal accidents locations in 2014
Fatal accidents locations in 2015
Fatal accidents locations in 2016
Fatal accidents locations in 2017
Fatal accidents locations in 2018
Fatal accidents locations in 2019
Fatal accidents locations in 2020
Fatal accidents locations in 2021
Alcohol use - People drinking some alcohol every month (%)
Alcohol use - People not drinking at all (%)
Alcohol use - Average days/month drinking alcohol
Alcohol use - Average drinks/week
Alcohol use - Average days/year people drink much
Audiometry - Average condition of hearing (%)
Audiometry - People that can hear a whisper from across a quiet room (%)
Audiometry - People that can hear normal voice from across a quiet room (%)
Audiometry - Ears ringing, roaring, buzzing (%)
Audiometry - Had a job exposure to loud noise (%)
Audiometry - Had off-work exposure to loud noise (%)
Blood Pressure & Cholesterol - Has high blood pressure (%)
Blood Pressure & Cholesterol - Checking blood pressure at home (%)
Blood Pressure & Cholesterol - Frequently checking blood cholesterol (%)
Blood Pressure & Cholesterol - Has high cholesterol level (%)
Consumer Behavior - Money monthly spent on food at supermarket/grocery store
Consumer Behavior - Money monthly spent on food at other stores
Consumer Behavior - Money monthly spent on eating out
Consumer Behavior - Money monthly spent on carryout/delivered foods
Consumer Behavior - Income spent on food at supermarket/grocery store (%)
Consumer Behavior - Income spent on food at other stores (%)
Consumer Behavior - Income spent on eating out (%)
Consumer Behavior - Income spent on carryout/delivered foods (%)
Current Health Status - General health condition (%)
Current Health Status - Blood donors (%)
Current Health Status - Has blood ever tested for HIV virus (%)
Current Health Status - Left-handed people (%)
Dermatology - People using sunscreen (%)
Diabetes - Diabetics (%)
Diabetes - Had a blood test for high blood sugar (%)
Diabetes - People taking insulin (%)
Diet Behavior & Nutrition - Diet health (%)
Diet Behavior & Nutrition - Milk product consumption (# of products/month)
Diet Behavior & Nutrition - Meals not home prepared (#/week)
Diet Behavior & Nutrition - Meals from fast food or pizza place (#/week)
Diet Behavior & Nutrition - Ready-to-eat foods (#/month)
Diet Behavior & Nutrition - Frozen meals/pizza (#/month)
Drug Use - People that ever used marijuana or hashish (%)
Drug Use - Ever used hard drugs (%)
Drug Use - Ever used any form of cocaine (%)
Drug Use - Ever used heroin (%)
Drug Use - Ever used methamphetamine (%)
Health Insurance - People covered by health insurance (%)
Kidney Conditions-Urology - Avg. # of times urinating at night
Medical Conditions - People with asthma (%)
Medical Conditions - People with anemia (%)
Medical Conditions - People with psoriasis (%)
Medical Conditions - People with overweight (%)
Medical Conditions - Elderly people having difficulties in thinking or remembering (%)
Medical Conditions - People who ever received blood transfusion (%)
Medical Conditions - People having trouble seeing even with glass/contacts (%)
Medical Conditions - People with arthritis (%)
Medical Conditions - People with gout (%)
Medical Conditions - People with congestive heart failure (%)
Medical Conditions - People with coronary heart disease (%)
Medical Conditions - People with angina pectoris (%)
Medical Conditions - People who ever had heart attack (%)
Medical Conditions - People who ever had stroke (%)
Medical Conditions - People with emphysema (%)
Medical Conditions - People with thyroid problem (%)
Medical Conditions - People with chronic bronchitis (%)
Medical Conditions - People with any liver condition (%)
Medical Conditions - People who ever had cancer or malignancy (%)
Mental Health - People who have little interest in doing things (%)
Mental Health - People feeling down, depressed, or hopeless (%)
Mental Health - People who have trouble sleeping or sleeping too much (%)
Mental Health - People feeling tired or having little energy (%)
Mental Health - People with poor appetite or overeating (%)
Mental Health - People feeling bad about themself (%)
Mental Health - People who have trouble concentrating on things (%)
Mental Health - People moving or speaking slowly or too fast (%)
Mental Health - People having thoughts they would be better off dead (%)
Oral Health - Average years since last visit a dentist
Oral Health - People embarrassed because of mouth (%)
Oral Health - People with gum disease (%)
Oral Health - General health of teeth and gums (%)
Oral Health - Average days a week using dental floss/device
Oral Health - Average days a week using mouthwash for dental problem
Oral Health - Average number of teeth
Pesticide Use - Households using pesticides to control insects (%)
Pesticide Use - Households using pesticides to kill weeds (%)
Physical Activity - People doing vigorous-intensity work activities (%)
Physical Activity - People doing moderate-intensity work activities (%)
Physical Activity - People walking or bicycling (%)
Physical Activity - People doing vigorous-intensity recreational activities (%)
Physical Activity - People doing moderate-intensity recreational activities (%)
Physical Activity - Average hours a day doing sedentary activities
Physical Activity - Average hours a day watching TV or videos
Physical Activity - Average hours a day using computer
Physical Functioning - People having limitations keeping them from working (%)
Physical Functioning - People limited in amount of work they can do (%)
Physical Functioning - People that need special equipment to walk (%)
Physical Functioning - People experiencing confusion/memory problems (%)
Physical Functioning - People requiring special healthcare equipment (%)
Prescription Medications - Average number of prescription medicines taking
Preventive Aspirin Use - Adults 40+ taking low-dose aspirin (%)
Reproductive Health - Vaginal deliveries (%)
Reproductive Health - Cesarean deliveries (%)
Reproductive Health - Deliveries resulted in a live birth (%)
Reproductive Health - Pregnancies resulted in a delivery (%)
Reproductive Health - Women breastfeeding newborns (%)
Reproductive Health - Women that had a hysterectomy (%)
Reproductive Health - Women that had both ovaries removed (%)
Reproductive Health - Women that have ever taken birth control pills (%)
Reproductive Health - Women taking birth control pills (%)
Reproductive Health - Women that have ever used Depo-Provera or injectables (%)
Reproductive Health - Women that have ever used female hormones (%)
Sexual Behavior - People 18+ that ever had sex (vaginal, anal, or oral) (%)
Sexual Behavior - Males 18+ that ever had vaginal sex with a woman (%)
Sexual Behavior - Males 18+ that ever performed oral sex on a woman (%)
Sexual Behavior - Males 18+ that ever had anal sex with a woman (%)
Sexual Behavior - Males 18+ that ever had any sex with a man (%)
Sexual Behavior - Females 18+ that ever had vaginal sex with a man (%)
Sexual Behavior - Females 18+ that ever performed oral sex on a man (%)
Sexual Behavior - Females 18+ that ever had anal sex with a man (%)
Sexual Behavior - Females 18+ that ever had any kind of sex with a woman (%)
Sexual Behavior - Average age people first had sex
Sexual Behavior - Average number of female sex partners in lifetime (males 18+)
Sexual Behavior - Average number of female vaginal sex partners in lifetime (males 18+)
Sexual Behavior - Average age people first performed oral sex on a woman (18+)
Sexual Behavior - Average number of woman performed oral sex on in lifetime (18+)
Sexual Behavior - Average number of male sex partners in lifetime (males 18+)
Sexual Behavior - Average number of male anal sex partners in lifetime (males 18+)
Sexual Behavior - Average age people first performed oral sex on a man (18+)
Sexual Behavior - Average number of male oral sex partners in lifetime (18+)
Sexual Behavior - People using protection when performing oral sex (%)
Sexual Behavior - Average number of times people have vaginal or anal sex a year
Sexual Behavior - People having sex without condom (%)
Sexual Behavior - Average number of male sex partners in lifetime (females 18+)
Sexual Behavior - Average number of male vaginal sex partners in lifetime (females 18+)
Sexual Behavior - Average number of female sex partners in lifetime (females 18+)
Sexual Behavior - Circumcised males 18+ (%)
Sleep Disorders - Average hours sleeping at night
Sleep Disorders - People that has trouble sleeping (%)
Smoking-Cigarette Use - People smoking cigarettes (%)
Taste & Smell - People 40+ having problems with smell (%)
Taste & Smell - People 40+ having problems with taste (%)
Taste & Smell - People 40+ that ever had wisdom teeth removed (%)
Taste & Smell - People 40+ that ever had tonsils teeth removed (%)
Taste & Smell - People 40+ that ever had a loss of consciousness because of a head injury (%)
Taste & Smell - People 40+ that ever had a broken nose or other serious injury to face or skull (%)
Taste & Smell - People 40+ that ever had two or more sinus infections (%)
Weight - Average height (inches)
Weight - Average weight (pounds)
Weight - Average BMI
Weight - People that are obese (%)
Weight - People that ever were obese (%)
Weight - People trying to lose weight (%)
93,077 76.5% White alone 18,824 15.5% Hispanic 5,029 4.1% Two or more races 3,054 2.5% Asian alone 1,287 1.1% Black alone 197 0.2% American Indian alone 204 0.2% Other race alone
According to our research of Colorado and other state lists, there were 178 registered sex offenders living in Arvada, Colorado as of April 27, 2024 . The ratio of all residents to sex offenders in Arvada is 659 to 1.The ratio of registered sex offenders to all residents in this city is lower than the state average.
The City-Data.com crime index weighs serious crimes and violent crimes more heavily. Higher means more crime, U.S. average is 246.1. It adjusts for the number of visitors and daily workers commuting into cities.
- means the value is smaller than the state average.
- means the value is about the same as the state average.
- means the value is bigger than the state average.
- means the value is much bigger than the state average.
Crime rate in Arvada detailed stats: murders, rapes, robberies, assaults, burglaries, thefts, arson Officers per 1,000 residents here:
1.30Colorado average:
2.14
Latest news from Arvada, CO collected exclusively by city-data.com from local newspapers, TV, and radio stations
Ancestries: German (15.1%), English (7.7%), Irish (6.4%), American (6.0%), Italian (5.2%), European (4.7%).
Current Local Time:
Incorporated on 8/24/1904
Land area: 32.7 square miles.
Population density: 3,723 people per square mile (average).
6,485 residents are foreign born (1.6% Asia , 1.6% Europe , 1.5% Latin America ).
This city:
5.3%Colorado:
9.5%
Median real estate property taxes paid for housing units with mortgages in 2022: $3,030 (0.5%)Median real estate property taxes paid for housing units with no mortgage in 2022: $2,717 (0.5%)
Nearest city with pop. 200,000+: Northeast Jefferson, CO (5.1 miles
Nearest city with pop. 1,000,000+: Phoenix, AZ
Nearest cities:
Lakeside, CO (1.9 miles),
Latitude: 39.82 N, Longitude: 105.11 W
Nickname or alias (official or unofficial): Celery Capital of the World
Daytime population change due to commuting: -23,208 (-19.1%)Workers who live and work in this city: 29,053 (42.0%)
Single-family new house construction building permits:
2022: 357 buildings , average cost: $282,5002021: 373 buildings , average cost: $275,0002020: 295 buildings , average cost: $277,8002019: 294 buildings , average cost: $273,8002018: 502 buildings , average cost: $270,9002017: 598 buildings , average cost: $273,9002016: 856 buildings , average cost: $271,8002015: 732 buildings , average cost: $277,3002014: 597 buildings , average cost: $263,8002013: 483 buildings , average cost: $282,0002012: 393 buildings , average cost: $257,1002011: 171 buildings , average cost: $227,7002010: 188 buildings , average cost: $244,8002009: 93 buildings , average cost: $246,3002008: 119 buildings , average cost: $252,6002007: 137 buildings , average cost: $272,3002006: 240 buildings , average cost: $254,3002005: 396 buildings , average cost: $184,8002004: 458 buildings , average cost: $200,5002003: 323 buildings , average cost: $206,6002002: 424 buildings , average cost: $182,3002001: 373 buildings , average cost: $140,1002000: 384 buildings , average cost: $145,1001999: 524 buildings , average cost: $134,8001998: 401 buildings , average cost: $127,7001997: 550 buildings , average cost: $124,800Unemployment in December 2023:
Population change in the 1990s: +12,104 (+13.4%).
Most common occupations in Arvada, CO (%)
Both Males Females
Other management occupations, except farmers and farm managers (6.0%)
Cooks and food preparation workers (5.1%)
Computer specialists (3.5%)
Secretaries and administrative assistants (2.4%)
Retail sales workers, except cashiers (2.4%)
Customer service representatives (2.4%)
Engineers (2.3%)
Other management occupations, except farmers and farm managers (6.4%)
Computer specialists (5.2%)
Cooks and food preparation workers (4.0%)
Electrical equipment mechanics and other installation, maintenance, and repair workers, including supervisors (3.5%)
Engineers (3.5%)
Driver/sales workers and truck drivers (3.2%)
Other production occupations, including supervisors (2.8%)
Cooks and food preparation workers (6.3%)
Other management occupations, except farmers and farm managers (5.5%)
Secretaries and administrative assistants (4.9%)
Customer service representatives (3.4%)
Other office and administrative support workers, including supervisors (3.1%)
Registered nurses (3.0%)
Information and record clerks, except customer service representatives (2.9%)
Tornado activity:
Arvada-area historical tornado activity is above Colorado state average. It is 20% greater than the overall U.S. average.
On 6/15/1988, a category F3 (max. wind speeds 158-206 mph) tornado 11.5 miles away from the Arvada city center injured 7 people and caused between $5,000,000 and $50,000,000 in damages.
On 5/18/1975, a category F3 tornado 20.3 miles away from the city center .
Earthquake activity:
Arvada-area historical earthquake activity is significantly above Colorado state average. It is 724% greater than the overall U.S. average. On 8/18/1959 at 06:37:13, a magnitude 7.7 (7.7 UK, Class: Major, Intensity: VIII - XII) earthquake occurred 433.9 miles away from the city center, causing $26,000,000 total damage On 10/18/1984 at 15:30:23, a magnitude 5.5 (5.4 MB, 5.1 MS, 5.5 ML, Class: Moderate, Intensity: VI - VII) earthquake occurred 179.7 miles away from Arvada center On 10/28/1983 at 14:06:06, a magnitude 7.3 (6.2 MB, 7.3 MS, 7.0 MW) earthquake occurred 534.9 miles away from the city center, causing 2 deaths ( 2 shaking deaths) and 3 injuries, causing $15,000,000 total damage On 8/23/2011 at 05:46:18, a magnitude 5.3 (5.3 MW, Depth: 2.5 mi) earthquake occurred 192.0 miles away from the city center On 3/28/1975 at 02:31:05, a magnitude 6.2 (6.1 MB, 6.0 MS, 6.2 ML, Class: Strong, Intensity: VII - IX) earthquake occurred 413.5 miles away from Arvada center On 8/10/2005 at 22:08:22, a magnitude 5.0 (5.0 MW, Depth: 3.1 mi) earthquake occurred 199.3 miles away from the city center Magnitude types: body-wave magnitude (MB), local magnitude (ML), surface-wave magnitude (MS), moment magnitude (MW) Natural disasters: The number of natural disasters in Jefferson County (12) is smaller than the US average (15).Major Disasters (Presidential) Declared: 4Emergencies Declared: 4Fires: 4, Floods: 4, Storms: 3, Landslides: 2, Mudslides: 2, Snows: 2, Heavy Rain: 1, Hurricane: 1, Snowstorm: 1, Other: 1 (Note: some incidents may be assigned to more than one category). Hospitals and medical centers in Arvada: ARVADA CARE AND REHABILITATION CENTER (6121 WEST 60TH AVENUE)
COLORADO LUTH HEALTH CARE CTR (7991 W 71ST AVE)
EXEMPLA COLORADO LUTHERAN HOME (7991 WEST 71ST AVENUE)
ARVADA DIALYSIS CENTER (DVA) (9950 W 80TH AVE STE 25)
KIDNEY CENTER OF ARVADA (ARA) (5265 VANCE ST)
BEST HOME HEALTH CARE CORP (5400 WARD RD BLDG II STE 101)
Heliports located in Arvada: Amtrak stations near Arvada: 8 miles: DENVER (1701 WYNKOOP ST.) Services: ticket office, fully wheelchair accessible, enclosed waiting area, public restrooms, public payphones, full-service food facilities and snack bar, paid short-term parking, paid long-term parking, call for car rental service, taxi stand, public transit connection.
19 miles: BOULDER (4401 N. BROADWAY) - Bus Station Services: enclosed waiting area, public payphones, snack bar.
Colleges/Universities in Arvada: College of International Esthetics Inc Full-time enrollment: 112; Location: 7330 West 52nd Avenue, Suite T; Private, for-profit; Website: www.internationalesthetics.com)
Empire Beauty School-Arvada Full-time enrollment: 44; Location: 6520 Wadsworth Blvd. #209; Private, for-profit; Website: www.empire.edu)
Colleges/universities with over 2000 students nearest to Arvada:
Regis University (about 5 miles; Denver, CO ; Full-time enrollment: 6,975)
Front Range Community College (about 7 miles; Westminster, CO ; FT enrollment: 14,756)
Red Rocks Community College (about 8 miles; Lakewood, CO ; FT enrollment: 6,185)
Colorado Christian University (about 8 miles; Lakewood, CO ; FT enrollment: 2,959)
Colorado School of Mines (about 8 miles; Golden, CO ; FT enrollment: 5,507)
University of Colorado Denver (about 8 miles; Denver, CO ; FT enrollment: 14,727)
Metropolitan State University of Denver (about 8 miles; Denver, CO ; FT enrollment: 17,242)
Public high schools in Arvada: ARVADA WEST HIGH SCHOOL Students: 1,664, Location: 11595 ALLENDALE DRIVE, Grades: 9-12)RALSTON VALLEY SENIOR HIGH SCHOOL Students: 1,604, Location: 13355 WEST 80TH AVENUE, Grades: 9-12)POMONA HIGH SCHOOL Students: 1,600, Location: 8101 WEST POMONA DRIVE, Grades: 9-12)ARVADA HIGH SCHOOL Students: 1,364, Location: 7951 WEST 65TH AVENUE, Grades: 9-12)EXCEL ACADEMY CHARTER SCHOOL Students: 783, Location: 11500 W. 84TH AVE, Grades: KG-12, Charter school )EARLY COLLEGE OF ARVADA Location: 4905 WEST 60TH AVENUE, Grades: 6-12, Charter school )
WARREN TECH NORTH Location: 11325 ALLENDALE DRIVE, Grades: 10-12)
TWO ROADS CHARTER SCHOOL Location: 6980 PIERCE STREET, Grades: PK-12, Charter school )
Private high school in Arvada: FAITH CHRISTIAN ACADEMY Students: 1,000, Location: 12189 W 64TH AVE, Grades: KG-12)
Biggest public elementary/middle schools in Arvada: OBERON JUNIOR HIGH SCHOOL Students: 751, Location: 7300 QUAIL STREET, Grades: 7-8)DRAKE JUNIOR HIGH SCHOOL Students: 655, Location: 12550 WEST 52ND AVENUE, Grades: 7-8)WEST WOODS ELEMENTARY SCHOOL Students: 628, Location: 16650 WEST 72ND AVENUE, Grades: KG-6)MOORE MIDDLE SCHOOL Students: 599, Location: 8455 WEST 88TH AVENUE, Grades: 7-8)SIERRA ELEMENTARY SCHOOL Students: 562, Location: 7751 OAK STREET, Grades: PK-6)SWANSON ELEMENTARY SCHOOL Students: 552, Location: 6055 WEST 68TH AVENUE, Grades: PK-6)VAN ARSDALE ELEMENTARY SCHOOL Students: 545, Location: 7535 ALKIRE STREET, Grades: KG-6)VANDERHOOF ELEMENTARY SCHOOL Students: 539, Location: 5875 ROUTT COURT, Grades: KG-6)NORTH ARVADA MIDDLE SCHOOL Students: 487, Location: 7285 PIERCE STREET, Grades: 7-8)LINCOLN CHARTER ACADEMY Students: 476, Location: 7180 OAK STREET, Grades: PK-8, Charter school )Private elementary/middle school in Arvada: SHRINE OF ST ANNE SCHOOL Students: 374, Location: 7320 GRANT PL, Grades: KG-8)
See full list of schools located in Arvada
Notable locations in Arvada: (A) , Enterprise Grange (B) , Clay (C) , Rocky (D) , Fire Clay (E) , Indian Tree Golf Club (F) , Arvada Plaza (G) , Lake Arbor Golf Course (H) , Arvada Center for the Arts and Humanities (I) , Jefferson County Public Library Arvada Branch (J) , Arvada Fire Protection District Station 1 (K) , Arvada Fire Protection District Station 4 (L) , Arvada Fire Protection District Station 5 (M) , Rural / Metro of Central Colorado Ambulance (N) , Arvada Municipal Court (O) , Jefferson County Public Library Standley Lake Branch (P) , Lake Arbor Recreation Center (Q) , City of Arvada Service Center (R) , Arvada City Hall (S) , Arvada Police Chief (T) . Display/hide their locations on the map
Shopping Centers: (1) , North Park Shopping Center (2) , Arvada Centerplace Shopping Center (3) , Arcada Marketplace Shopping Center (4) , Arvada West Town Center Shopping Center (5) , Cub Arvada Shopping Center (6) , Fairplanes Shopping Center (7) , Market Square Shopping Center (8) , Northridge Shopping Center (9) . Display/hide their locations on the map
Churches in Arvada include: (A) , King of Glory Lutheran Church (B) , Peace Lutheran Church (C) , Arvada Church of God (D) , Denver Bible Church (E) , Spirit of Joy Fellowship Church of the Brethren (F) , Word Church (G) , Heritage Community Bible Church (H) , Rapture Church of God (I) . Display/hide their locations on the map
Cemeteries: (1) , Arvada Cemetery (2) . Display/hide their locations on the map
Reservoirs: (A) , Hidden Lake Reservoir (B) , Pomona Lake Number 2 (C) , Tepper Reservoir Number 1 (D) , Blunn Reservoir (E) , Churches Lower Lake (F) , Pomona Lake Number 1 (G) , Oberon Lake Number 1 (H) . Display/hide their locations on the map
Streams, rivers, and creeks: (A) , Leyden Creek (B) , Van Bibber Creek (C) , Cross Creek (D) . Display/hide their locations on the map
Parks in Arvada include: (1) , Bridgeside Park (2) , Club Crest Park (3) , Far Horizon Park (4) , Fitzmorris Park (5) , Hackberry Park (6) , Harold D Lutz Sports Complex (7) , Harry S Truman Park (8) , Hillside Park (9) . Display/hide their locations on the map
Tourist attractions: (1) , Arvada Historical Society (Museums; 5590 Wadsworth Boulevard) (2) , Aquatic Design Habitats Inc (Aquariums; 4941 Allison St Ste 7/8) (3) , S & H Products Company (Cultural Attractions- Events- & Facilities; 5891 Nolan Street) (4) , Jackpot Bingo (Amusement & Theme Parks; 11651 Ralston Road Suite B2) (5) , Amf Bowling Centers - Amf Arvada Lanes (Amusement & Theme Parks; 6550 Wadsworth Bypass) (6) , Nickel A Play (Amusement & Theme Parks; 8025 Sheridan Boulevard Unit C) (7) , Cyber Extreme (Amusement & Theme Parks; 6635 Wadsworth Boulevard) (8) , Maximumgamer (Amusement & Theme Parks; 11651 West 64th Avenue) (9) . Display/hide their approximate locations on the map
Birthplace of: Brad Pyatt - 2005 NFL player (Indianapolis Colts, born : Apr 16, 1980), Joel Klatt - College Football Quarterback, Rick Carelli - Stock car racing driver, Jerry Robertson - Busch series NASCAR driver (born : Jan 27, 1962), Katee Doland - Cheerleader, Joe DeCamillis - Football coach, Nick Fazekas - College basketball player (Nevada Wolf Pack), Steve Quailer - Ice hockey player.
Jefferson County has a predicted average indoor radon screening level greater than 4 pCi/L (pico curies per liter) - Highest Potential Drinking water stations with addresses in Arvada and their reported violations in the past:
ARVADA CITY OF (Population served: 107,161, Surface water):
Past monitoring violations:
Single Turbidity Exceed (Enhanced SWTR) - In SEP-2013, Contaminant: IESWTR. Follow-up actions: St Public Notif requested (SEP-13-2013), St Public Notif received (SEP-24-2013), St Violation/Reminder Notice (NOV-13-2013)
Population served: 55, Groundwater):
Past health violations:
MCL, Monthly (TCR) - Between JAN-2012 and MAR-2012, Contaminant: Coliform. Follow-up actions: St Public Notif requested (MAR-16-2012), St Violation/Reminder Notice (MAR-16-2012), St Public Notif received (MAR-21-2012), St Compliance achieved (JUL-03-2012)
Past monitoring violations:
Monitoring, Source Water (GWR) - In MAR-2012, Contaminant: E. COLI. Follow-up actions: St Public Notif requested (MAY-04-2012), St Violation/Reminder Notice (MAY-04-2012), St Compliance achieved (MAY-16-2012)
One regular monitoring violation
Drinking water stations with addresses in Arvada that have no violations reported:
BERKELEY WSD (Population served: 7,300, Primary Water Source Type: Purch surface water)
HIGH VIEW WD (Population served: 2,278, Primary Water Source Type: Purch surface water)
Average household size: This city:
2.5 peopleColorado:
2.5 people
Percentage of family households: This city:
67.7%Whole state:
63.9%
Percentage of households with unmarried partners: This city:
5.5%Whole state:
6.5%
Likely homosexual households (counted as self-reported same-sex unmarried-partner households)
Lesbian couples: 0.4% of all households Gay men: 0.2% of all households
People in group quarters in Arvada in 2010:
314 people in nursing facilities/skilled-nursing facilities
75 people in other noninstitutional facilities
71 people in group homes intended for adults
15 people in residential treatment centers for juveniles (non-correctional)
14 people in group homes for juveniles (non-correctional)
9 people in workers' group living quarters and job corps centers
8 people in residential treatment centers for adults
People in group quarters in Arvada in 2000:
471 people in other noninstitutional group quarters
120 people in nursing homes
64 people in homes for the mentally retarded
29 people in other group homes
23 people in schools, hospitals, or wards for the intellectually disabled
19 people in college dormitories (includes college quarters off campus)
12 people in homes or halfway houses for drug/alcohol abuse
10 people in homes for the mentally ill
3 people in religious group quarters
Banks with most branches in Arvada (2011 data):
JPMorgan Chase Bank, National Association: 80th And Sheridan Banking Center Bra, 64th And Sheridan Banking Center Bra, 88th And Wadsworth Banking Ctr. Bran, Wadsworth & 52nd Banking Center, Arvada Branch, Arvada Plaza Branch. Info updated 2011/11/10: Bank assets: $1,811,678.0 mil, Deposits: $1,190,738.0 mil, headquarters in Columbus, OH, positive income , International Specialization, 5577 total offices , Holding Company: Jpmorgan Chase & Co.
FirstBank: 58th/Independence Branch, 64th And Ward Branch, 64th/Sheridan Branch, Westwoods Branch. Info updated 2011/12/05: Bank assets: $11,597.1 mil, Deposits: $10,530.4 mil, headquarters in Lakewood, CO, positive income , Mortgage Lending Specialization, 130 total offices , Holding Company: Firstbank Holding Company
TCF National Bank: 80th & Yarrow #7023 Branch, Gardenia & 64th Avenue Branch, Arvada Branch. Info updated 2009/11/23: Bank assets: $19,007.0 mil, Deposits: $12,377.0 mil, headquarters in Sioux Falls, SD, positive income , Commercial Lending Specialization, 441 total offices , Holding Company: Tcf Financial Corporation
Wells Fargo Bank, National Association: 52nd And Vance Branch, Arvada West Branch, Arvada Branch. Info updated 2011/04/05: Bank assets: $1,161,490.0 mil, Deposits: $905,653.0 mil, headquarters in Sioux Falls, SD, positive income , 6395 total offices , Holding Company: Wells Fargo & Company
U.S. Bank National Association: 64th And Mcintyre King Soopers Branc, Arvada Ralston Drive-Up Branch, Arvada West Branch. Info updated 2012/01/30: Bank assets: $330,470.8 mil, Deposits: $236,091.5 mil, headquarters in Cincinnati, OH, positive income , 3121 total offices , Holding Company: U.S. Bancorp
Compass Bank: 80th & Wadsworth Branch, Arvada Branch, Westwoods Branch. Info updated 2011/02/24: Bank assets: $63,107.0 mil, Deposits: $46,232.4 mil, headquarters in Birmingham, AL, negative income in the last year , Commercial Lending Specialization, 720 total offices , Holding Company: Banco Bilbao Vizcaya Argentaria, S.A.
Bank of the West: Arvada - West at 12880 West 64th Avenue, branch established on 1994/09/19; Arvada - Carr at 5805 Carr Street, branch established on 1891/01/01. Info updated 2009/11/16: Bank assets: $62,408.3 mil, Deposits: $43,995.2 mil, headquarters in San Francisco, CA, positive income , 647 total offices , Holding Company: Bnp Paribas
Bank Midwest, National Association: Arvada Branch at 7530 Grandview Avenue, branch established on 2004/11/01; Webster Street Branch at 5660 Webster Street, branch established on 2000/01/18. Info updated 2012/03/19: Bank assets: $6,237.6 mil, Deposits: $5,064.6 mil, headquarters in Kansas City, MO, positive income , 138 total offices , Holding Company: Nbh Holdings Corp.
KeyBank National Association: Westwood Keycenter Branch at 15590 West 64th Avenue, branch established on 2004/03/15; Arvada Branch at 7878 West 80th Place, branch established on 1974/04/29. Info updated 2008/03/03: Bank assets: $86,198.8 mil, Deposits: $64,214.8 mil, headquarters in Cleveland, OH, positive income , Commercial Lending Specialization, 1067 total offices , Holding Company: Keycorp
For population 15 years and over in Arvada:
Never married: 28.8%Now married: 54.4%Separated: 0.6%Widowed: 5.9%Divorced: 10.3% For population 25 years and over in Arvada:
High school or higher: 95.6%Bachelor's degree or higher: 53.1%Graduate or professional degree: 19.1%Unemployed: 2.4%Mean travel time to work (commute): 18.9 minutes
Education Gini index (Inequality in education) Here:
9.6Colorado average:
11.1
Religion statistics for Arvada, CO (based on Jefferson County data)
Religion Adherents Congregations Catholic 80,219 17 Evangelical Protestant 68,794 196 Mainline Protestant 22,716 57 Other 17,966 62 Orthodox 1,070 3 None 343,778 -
Source: Clifford Grammich, Kirk Hadaway, Richard Houseal, Dale E.Jones, Alexei Krindatch, Richie Stanley and Richard H.Taylor. 2012. 2010 U.S.Religion Census: Religious Congregations & Membership Study. Association of Statisticians of American Religious Bodies. Jones, Dale E., et al. 2002. Congregations and Membership in the United States 2000. Nashville, TN: Glenmary Research Center. Graphs represent county-level data
Food Environment Statistics: Number of grocery stores : 58Jefferson County :
1.10 / 10,000 pop.Colorado :
1.50 / 10,000 pop.
Number of supercenters and club stores : 5This county :
0.09 / 10,000 pop.State :
0.15 / 10,000 pop.
Number of convenience stores (no gas) : 18Jefferson County :
0.34 / 10,000 pop.Colorado :
0.45 / 10,000 pop.
Number of convenience stores (with gas) : 145Jefferson County :
2.75 / 10,000 pop.State :
3.13 / 10,000 pop.
Number of full-service restaurants : 410Here :
7.76 / 10,000 pop.State :
8.99 / 10,000 pop.
Adult diabetes rate : This county :
5.3%Colorado :
5.3%
Adult obesity rate : Jefferson County :
17.4%Colorado :
18.4%
Low-income preschool obesity rate : This county :
9.6%State :
9.6%
Health and Nutrition: Healthy diet rate : This city:
49.8%State:
49.4%
Average overall health of teeth and gums : This city:
47.4%State:
47.8%
People feeling badly about themselves : People not drinking alcohol at all : Average hours sleeping at night : Overweight people : This city:
34.6%Colorado:
33.3%
General health condition : Average condition of hearing : More about Health and Nutrition of Arvada, CO Residents
Local government employment and payroll (March 2022)
Function
Full-time employees
Monthly full-time payroll
Average yearly full-time wage
Part-time employees
Monthly part-time payroll
Police Protection - Officers
206 $1,736,155 $101,135 0 $0 Parks and Recreation
81 $493,606 $73,127 137 $153,116 Water Supply
56 $365,114 $78,239 3 $5,139 Police - Other
56 $311,187 $66,683 0 $0 Streets and Highways
47 $298,627 $76,245 0 $0 Financial Administration
39 $240,739 $74,074 1 $1,783 Other Government Administration
26 $190,555 $87,948 0 $0 Judicial and Legal
23 $205,541 $107,239 9 $5,943 Sewerage
23 $143,242 $74,735 0 $0 Housing and Community Development (Local)
7 $54,161 $92,847 0 $0
Totals for Government
564 $4,038,928 $85,935 150 $165,981
Arvada government finances - Revenue in 2018 (per resident):
Tax - Property: $5,762,000 ($47.39)
Arvada government finances - Debt in 2018 (per resident):
Long Term Debt - Beginning Outstanding - Public Debt for Private Purpose: $44,200,000 ($363.54)
Outstanding Nonguaranteed - Industrial Revenue: $40,400,000 ($332.29)Beginning Outstanding - Unspecified Public Purpose: $27,620,000 ($227.17)Outstanding Unspecified Public Purpose: $21,689,000 ($178.39)Retired Unspecified Public Purpose: $5,931,000 ($48.78)Retired Nonguaranteed - Public Debt for Private Purpose: $3,800,000 ($31.25)
Arvada government finances - Cash and Securities in 2018 (per resident):
Sinking Funds - Cash and Securities: $57,490,000 ($472.85)
11.22% of this county's 2021 resident taxpayers lived in other counties in 2020 ($78,273 average adjusted gross income )
Here:
11.22%Colorado average:
11.28%
0.01% of residents moved from foreign countries ($77 average AGI )Jefferson County:
0.01%Colorado average:
0.05%
Top counties from which taxpayers relocated into this county between 2020 and 2021:
11.40% of this county's 2020 resident taxpayers moved to other counties in 2021 ($73,305 average adjusted gross income )
Here:
11.40%Colorado average:
11.05%
0.01% of residents moved to foreign countries ($82 average AGI )Jefferson County:
0.01%Colorado average:
0.03%
Top counties to which taxpayers relocated from this county between 2020 and 2021:
Businesses in Arvada, CO
Name Count Name Count
24 Hour Fitness 1 Kroger 7 7-Eleven 5 Little Caesars Pizza 1 AMF Bowling 1 Long John Silver's 1 AT&T 4 Lowe's 1 Ace Hardware 3 MasterBrand Cabinets 2 Advance Auto Parts 2 McDonald's 5 Applebee's 1 Nike 3 Arby's 3 Office Depot 2 AutoZone 2 OfficeMax 1 Bally Total Fitness 1 Panda Express 2 Big O Tires 2 Panera Bread 1 Blockbuster 3 Papa John's Pizza 2 Buffalo Wild Wings 2 Payless 1 Burger King 4 PetSmart 1 Chipotle 3 Pizza Hut 2 Chuck E. Cheese's 1 Popeyes 1 Cold Stone Creamery 2 Qdoba Mexican Grill 2 Costco 1 Quiznos 2 Cricket Wireless 3 RadioShack 3 Curves 2 Red Robin 1 DHL 2 Ruby Tuesday 1 Dairy Queen 2 SAS Shoes 1 Decora Cabinetry 2 SONIC Drive-In 1 Dennys 1 Safeway 3 Discount Tire 2 Sam's Club 1 Domino's Pizza 2 Sears 1 DressBarn 1 Sprint Nextel 1 Dressbarn 1 Starbucks 8 Fashion Bug 1 Subway 7 FedEx 12 T-Mobile 5 Firestone Complete Auto Care 1 Taco Bell 6 GNC 2 Target 1 H&R Block 3 U-Haul 2 Hobby Lobby 1 UPS 11 Home Depot 1 Vans 1 IHOP 1 Vons 3 Jones New York 1 Walgreens 1 KFC 3 Wendy's 4 Kmart 1 YMCA 2 Kohl's 1
Strongest AM radio stations in Arvada:
KPOF (910 AM; 5 kW; DENVER, CO; Owner: PILLAR OF FIRE)
KKZN (760 AM; 50 kW; THORNTON, CO; Owner: JACOR BROADCASTING OF COLORADO, INC.)
KRKS (990 AM; 10 kW; DENVER, CO; Owner: SALEM MEDIA OF COLORADO, INC.)
KLTT (670 AM; 50 kW; COMMERCE CITY, CO; Owner: KLZ RADIO, INC.)
KLZ (560 AM; 5 kW; DENVER, CO; Owner: KLZ RADIO, INC.)
KBJD (1650 AM; 10 kW; DENVER, CO; Owner: SALEM MEDIA OF COLORADO, INC.)
KOA (850 AM; 50 kW; DENVER, CO; Owner: JACOR BROADCASTING OF COLORADO, INC.)
KMXA (1090 AM; 50 kW; AURORA, CO; Owner: ENTRAVISION HOLDINGS, LLC)
KHOW (630 AM; 5 kW; DENVER, CO; Owner: CITICASTERS LICENSES, L.P.)
KKFN (950 AM; 5 kW; DENVER, CO; Owner: JEFFERSON-PILOT COMMUNICATIONS COMPANY OF COLORADO)
KJME (1390 AM; 5 kW; DENVER, CO; Owner: JO-MOR COMMUNICATIONS, INC.)
KCUV (1510 AM; 25 kW; LITTLETON, CO; Owner: PEOPLE WIRELESS, INC.)
KADZ (1550 AM; 10 kW; ARVADA, CO; Owner: ABC, INC.)
Strongest FM radio stations in Arvada:
KALC (105.9 FM; DENVER, CO; Owner: ENTERCOM DENVER LICENSE, LLC)
KBPI (106.7 FM; DENVER, CO; Owner: JACOR BROADCASTING OF COLORADO, INC.)
KFMD (95.7 FM; DENVER, CO; Owner: CITICASTERS LICENSES, L.P.)
KRFX (103.5 FM; DENVER, CO; Owner: JACOR BROADCASTING OF COLORADO, INC.)
KOSI (101.1 FM; DENVER, CO; Owner: ENTERCOM DENVER LICENSE, LLC)
KQMT (99.5 FM; DENVER, CO; Owner: ENTERCOM DENVER LICENSE, LLC)
KQKS (107.5 FM; LAKEWOOD, CO; Owner: JEFFERSON-PILOT COMMUNICATIONS COMPANY OF COLORADO)
KBCO-FM (97.3 FM; BOULDER, CO; Owner: CITICASTERS LICENSES, L.P.)
KUVO (89.3 FM; DENVER, CO; Owner: DENVER EDUCATIONAL BROADCASTING)
KIMN (100.3 FM; DENVER, CO; Owner: INFINITY RADIO OPERATIONS INC.)
KVOD (90.1 FM; DENVER, CO; Owner: PUBLIC BROADCASTING OF COLORADO, INC)
K209DE (89.7 FM; GOLDEN, CO; Owner: WAY-FM MEDIA GROUP, INC.)
KXKL-FM (105.1 FM; DENVER, CO; Owner: INFINITY RADIO OPERATIONS INC.)
KLDV (91.1 FM; MORRISON, CO; Owner: EDUCATIONAL MEDIA FOUNDATION)
KYGO-FM (98.5 FM; DENVER, CO; Owner: JEFFERSON-PILOT COMMUNICATIONS COMPANY OF COLORADO)
KRKS-FM (94.7 FM; LAFAYETTE, CO; Owner: SALEM MEDIA OF COLORADO, INC)
KXPK (96.5 FM; EVERGREEN, CO; Owner: ENTRAVISION HOLDINGS, LLC)
KJCD (104.3 FM; LONGMONT, CO; Owner: JEFFERSON-PILOT COMMUNICATIONS COMPANY OF COLORADO)
KDJM (92.5 FM; BROOMFIELD, CO; Owner: INFINITY RADIO OPERATIONS INC.)
KTCL (93.3 FM; FORT COLLINS, CO; Owner: JACOR BROADCASTING OF COLORADO, INC.)
TV broadcast stations around Arvada:
KMGH-TV (Channel 7; DENVER, CO; Owner: MCGRAW-HILL BROADCASTING COMPANY, INC.)
KUSA-TV (Channel 9; DENVER, CO; Owner: MULTIMEDIA HOLDINGS CORPORATION)
KRMA-TV (Channel 6; DENVER, CO; Owner: ROCKY MOUNTAIN PUBLIC BROADCASTING NETWORK, INC.)
KTVD (Channel 20; DENVER, CO; Owner: TWENVER BROADCAST, INC.)
KCNC-TV (Channel 4; DENVER, CO; Owner: CBS TELEVISION STATIONS INC.)
KWGN-TV (Channel 2; DENVER, CO; Owner: KWGN INC.)
KDVR (Channel 31; DENVER, CO; Owner: FOX TELEVISION STATIONS, INC.)
K48FW (Channel 48; DENVER, CO; Owner: TRINITY BROADCASTING NETWORK)
KDEN (Channel 25; LONGMONT, CO; Owner: LONGMONT CHANNEL 25, INC.)
KMAS-LP (Channel 63; DENVER, CO; Owner: TELEMUNDO OF STEAMBOAT SPRINGS COLO. LIC. CORP.)
K66FB (Channel 66; DENVER, CO; Owner: TRINITY BROADCASTING NETWORK)
KDEO-LP (Channel 38; AURORA, CO; Owner: PETER B. VAN DE SANDE)
KPXC-TV (Channel 59; DENVER, CO; Owner: PAXSON DENVER LICENSE, INC.)
KDVT-LP (Channel 36; DENVER, CO; Owner: ENTRAVISION HOLDINGS, LLC)
KDEV-LP (Channel 62; AURORA, CO; Owner: TIGER EYE BROADCASTING CORPORATION)
K47IH (Channel 47; BOULDER, CO; Owner: CHANNEL 20 TV COMPANY)
KCEC (Channel 50; DENVER, CO; Owner: ENTRAVISION HOLDINGS, LLC)
K44CT (Channel 44; BOULDER, CO; Owner: ROCKY MOUNTAIN PUBLIC BROADCASTING NETWORK, INC.)
KRMT (Channel 41; DENVER, CO; Owner: WORD OF GOD FELLOWSHIP, INC.)
K57BT (Channel 57; DENVER, CO; Owner: TRINITY BROADCASTING OF DENVER, INC.)
National Bridge Inventory (NBI) Statistics 106 Number of bridges830ft / 253m Total length $6,020,000 Total costs1,886,387 Total average daily traffic112,467 Total average daily truck traffic
New bridges - historical statistics
4 1930-1939 7 1950-1959 7 1960-1969 18 1970-1979 27 1980-1989 21 1990-1999 17 2000-2009 3 2010-2019 2 2020-2022
See full National Bridge Inventory statistics for Arvada, CO
Home Mortgage Disclosure Act Aggregated Statistics For Year 2009(Based on 14 full and 20 partial tracts) A) FHA, FSA/RHS & VA B) Conventional C) Refinancings D) Home Improvement Loans E) Loans on Dwellings For 5+ Families F) Non-occupant Loans on G) Loans On Manufactured Number Average Value Number Average Value Number Average Value Number Average Value Number Average Value Number Average Value Number Average Value
LOANS ORIGINATED 694 $195,092 492 $196,710 2,885 $204,157 129 $66,522 3 $687,217 151 $148,208 5 $98,826 APPLICATIONS APPROVED, NOT ACCEPTED 30 $193,494 32 $225,869 218 $199,312 30 $28,816 0 $0 11 $180,200 0 $0 APPLICATIONS DENIED 59 $196,254 65 $204,242 679 $206,394 73 $61,107 2 $263,500 46 $157,798 1 $62,880 APPLICATIONS WITHDRAWN 59 $186,763 62 $186,263 444 $199,094 26 $122,875 0 $0 32 $144,138 1 $25,590 FILES CLOSED FOR INCOMPLETENESS 7 $217,514 12 $223,997 161 $204,849 2 $29,275 1 $552,190 6 $197,522 0 $0
Aggregated Statistics For Year 2008(Based on 14 full and 20 partial tracts) A) FHA, FSA/RHS & VA B) Conventional C) Refinancings D) Home Improvement Loans E) Loans on Dwellings For 5+ Families F) Non-occupant Loans on G) Loans On Manufactured Number Average Value Number Average Value Number Average Value Number Average Value Number Average Value Number Average Value Number Average Value
LOANS ORIGINATED 552 $192,045 767 $190,743 1,280 $190,359 140 $45,407 7 $1,548,987 202 $144,168 6 $31,968 APPLICATIONS APPROVED, NOT ACCEPTED 40 $194,260 80 $181,970 186 $199,371 61 $38,680 0 $0 18 $137,927 1 $34,990 APPLICATIONS DENIED 73 $179,181 141 $194,429 700 $204,794 157 $42,215 1 $149,000 57 $148,623 10 $66,490 APPLICATIONS WITHDRAWN 40 $201,202 108 $199,987 332 $201,848 28 $80,926 1 $376,820 30 $137,036 0 $0 FILES CLOSED FOR INCOMPLETENESS 10 $148,480 21 $191,070 92 $201,455 16 $59,239 0 $0 6 $161,893 0 $0
Aggregated Statistics For Year 2007(Based on 14 full and 20 partial tracts) A) FHA, FSA/RHS & VA B) Conventional C) Refinancings D) Home Improvement Loans E) Loans on Dwellings For 5+ Families F) Non-occupant Loans on G) Loans On Manufactured Number Average Value Number Average Value Number Average Value Number Average Value Number Average Value Number Average Value Number Average Value
LOANS ORIGINATED 161 $196,874 1,520 $176,309 1,712 $172,399 276 $46,399 16 $1,602,442 303 $150,055 1 $21,840 APPLICATIONS APPROVED, NOT ACCEPTED 10 $178,576 177 $165,111 320 $170,375 75 $63,476 0 $0 51 $139,554 1 $51,220 APPLICATIONS DENIED 28 $189,826 239 $167,151 1,221 $184,251 188 $75,030 1 $404,210 83 $162,922 6 $51,030 APPLICATIONS WITHDRAWN 14 $177,533 159 $177,455 452 $185,545 39 $108,135 1 $123,830 39 $178,477 1 $77,870 FILES CLOSED FOR INCOMPLETENESS 1 $89,000 30 $167,062 155 $191,493 3 $34,237 0 $0 13 $186,655 0 $0
Aggregated Statistics For Year 2006(Based on 14 full and 20 partial tracts) A) FHA, FSA/RHS & VA B) Conventional C) Refinancings D) Home Improvement Loans E) Loans on Dwellings For 5+ Families F) Non-occupant Loans on G) Loans On Manufactured Number Average Value Number Average Value Number Average Value Number Average Value Number Average Value Number Average Value Number Average Value
LOANS ORIGINATED 203 $185,026 2,061 $155,687 2,349 $153,355 337 $51,762 11 $2,863,288 373 $141,701 4 $65,875 APPLICATIONS APPROVED, NOT ACCEPTED 9 $178,134 245 $140,888 449 $152,704 91 $41,528 1 $52,230 55 $129,206 2 $73,675 APPLICATIONS DENIED 19 $177,185 395 $148,621 1,402 $168,748 185 $55,279 1 $4,302,740 102 $160,242 10 $53,437 APPLICATIONS WITHDRAWN 15 $191,795 278 $160,253 931 $178,170 36 $84,226 0 $0 64 $128,642 0 $0 FILES CLOSED FOR INCOMPLETENESS 4 $216,758 32 $153,171 182 $191,957 8 $81,954 1 $80,880 9 $146,848 0 $0
Aggregated Statistics For Year 2005(Based on 14 full and 20 partial tracts) A) FHA, FSA/RHS & VA B) Conventional C) Refinancings D) Home Improvement Loans E) Loans on Dwellings For 5+ Families F) Non-occupant Loans on G) Loans On Manufactured Number Average Value Number Average Value Number Average Value Number Average Value Number Average Value Number Average Value Number Average Value
LOANS ORIGINATED 236 $183,269 2,425 $147,796 3,139 $162,660 339 $60,754 7 $5,951,989 493 $142,656 9 $47,091 APPLICATIONS APPROVED, NOT ACCEPTED 9 $190,502 246 $141,684 489 $161,415 76 $49,591 0 $0 58 $152,613 5 $69,674 APPLICATIONS DENIED 21 $176,316 480 $145,476 1,540 $173,215 222 $48,317 0 $0 142 $150,417 16 $63,822 APPLICATIONS WITHDRAWN 27 $173,712 462 $157,197 1,319 $185,411 74 $125,808 0 $0 123 $156,829 4 $182,942 FILES CLOSED FOR INCOMPLETENESS 1 $120,320 87 $141,191 246 $179,198 18 $55,242 0 $0 15 $156,161 0 $0
Aggregated Statistics For Year 2004(Based on 14 full and 20 partial tracts) A) FHA, FSA/RHS & VA B) Conventional C) Refinancings D) Home Improvement Loans E) Loans on Dwellings For 5+ Families F) Non-occupant Loans on G) Loans On Manufactured Number Average Value Number Average Value Number Average Value Number Average Value Number Average Value Number Average Value Number Average Value
LOANS ORIGINATED 347 $186,572 1,953 $164,689 3,823 $167,903 349 $48,851 7 $767,346 409 $155,030 4 $84,830 APPLICATIONS APPROVED, NOT ACCEPTED 12 $178,589 217 $166,646 535 $170,176 67 $45,638 0 $0 46 $155,598 3 $46,373 APPLICATIONS DENIED 40 $192,250 380 $152,364 1,512 $174,879 206 $42,800 0 $0 118 $158,745 22 $55,247 APPLICATIONS WITHDRAWN 42 $178,760 236 $180,155 1,089 $178,616 51 $90,659 1 $269,540 62 $164,964 1 $29,040 FILES CLOSED FOR INCOMPLETENESS 8 $187,511 47 $140,404 201 $192,435 19 $54,177 0 $0 9 $145,650 0 $0
Aggregated Statistics For Year 2003(Based on 14 full and 20 partial tracts) A) FHA, FSA/RHS & VA B) Conventional C) Refinancings D) Home Improvement Loans E) Loans on Dwellings For 5+ Families F) Non-occupant Loans on Number Average Value Number Average Value Number Average Value Number Average Value Number Average Value Number Average Value
LOANS ORIGINATED 528 $184,291 1,347 $172,937 8,570 $160,986 318 $33,998 8 $2,634,388 506 $148,371 APPLICATIONS APPROVED, NOT ACCEPTED 15 $159,095 109 $179,832 892 $157,088 69 $41,521 0 $0 51 $147,427 APPLICATIONS DENIED 37 $184,255 204 $155,068 1,584 $167,501 153 $27,413 2 $1,293,830 84 $159,423 APPLICATIONS WITHDRAWN 36 $192,626 138 $192,970 1,158 $173,367 37 $48,103 0 $0 61 $146,592 FILES CLOSED FOR INCOMPLETENESS 8 $209,102 29 $147,885 221 $172,488 14 $37,296 0 $0 9 $131,382
Aggregated Statistics For Year 2002(Based on 8 full and 8 partial tracts) A) FHA, FSA/RHS & VA B) Conventional C) Refinancings D) Home Improvement Loans E) Loans on Dwellings For 5+ Families F) Non-occupant Loans on Number Average Value Number Average Value Number Average Value Number Average Value Number Average Value Number Average Value
LOANS ORIGINATED 311 $176,137 684 $170,024 2,911 $150,929 220 $36,244 5 $360,258 214 $141,813 APPLICATIONS APPROVED, NOT ACCEPTED 7 $144,149 71 $157,868 336 $141,039 54 $31,015 0 $0 16 $139,339 APPLICATIONS DENIED 17 $169,691 99 $131,508 549 $142,754 90 $24,063 0 $0 28 $143,099 APPLICATIONS WITHDRAWN 17 $172,104 78 $178,145 445 $157,111 22 $36,114 0 $0 18 $152,218 FILES CLOSED FOR INCOMPLETENESS 6 $201,135 31 $163,914 180 $160,077 2 $29,795 0 $0 8 $130,805
Aggregated Statistics For Year 2001(Based on 8 full and 8 partial tracts) A) FHA, FSA/RHS & VA B) Conventional C) Refinancings D) Home Improvement Loans E) Loans on Dwellings For 5+ Families F) Non-occupant Loans on Number Average Value Number Average Value Number Average Value Number Average Value Number Average Value Number Average Value
LOANS ORIGINATED 313 $165,279 593 $156,587 2,677 $142,990 253 $26,964 2 $255,190 188 $142,979 APPLICATIONS APPROVED, NOT ACCEPTED 9 $169,064 69 $120,000 293 $129,907 67 $32,049 0 $0 14 $101,342 APPLICATIONS DENIED 15 $158,979 127 $102,742 587 $126,598 112 $19,827 0 $0 20 $107,986 APPLICATIONS WITHDRAWN 18 $170,073 59 $169,954 525 $141,045 33 $43,391 0 $0 20 $169,021 FILES CLOSED FOR INCOMPLETENESS 2 $196,855 22 $153,649 131 $143,923 7 $37,953 0 $0 7 $141,360
Aggregated Statistics For Year 2000(Based on 8 full and 8 partial tracts) A) FHA, FSA/RHS & VA B) Conventional C) Refinancings D) Home Improvement Loans E) Loans on Dwellings For 5+ Families F) Non-occupant Loans on Number Average Value Number Average Value Number Average Value Number Average Value Number Average Value Number Average Value
LOANS ORIGINATED 288 $153,225 679 $140,834 693 $106,294 280 $26,716 8 $817,238 104 $111,258 APPLICATIONS APPROVED, NOT ACCEPTED 10 $124,217 72 $119,205 132 $96,603 61 $19,120 0 $0 8 $115,629 APPLICATIONS DENIED 27 $115,003 184 $77,607 355 $97,648 115 $27,366 0 $0 15 $89,912 APPLICATIONS WITHDRAWN 18 $126,188 72 $124,574 191 $105,941 23 $28,960 0 $0 9 $118,206 FILES CLOSED FOR INCOMPLETENESS 4 $137,450 9 $163,590 68 $140,531 1 $20,440 0 $0 4 $181,500
Aggregated Statistics For Year 1999(Based on 11 full and 14 partial tracts) A) FHA, FSA/RHS & VA B) Conventional C) Refinancings D) Home Improvement Loans E) Loans on Dwellings For 5+ Families F) Non-occupant Loans on Number Average Value Number Average Value Number Average Value Number Average Value Number Average Value Number Average Value
LOANS ORIGINATED 662 $137,320 1,401 $137,919 2,878 $104,514 546 $24,143 12 $466,715 256 $101,311 APPLICATIONS APPROVED, NOT ACCEPTED 10 $135,291 169 $112,410 555 $104,095 131 $19,913 0 $0 22 $96,011 APPLICATIONS DENIED 32 $135,958 334 $87,302 822 $96,335 264 $22,677 1 $264,180 37 $82,399 APPLICATIONS WITHDRAWN 39 $125,805 194 $130,389 573 $107,207 39 $48,604 3 $1,399,113 25 $103,660 FILES CLOSED FOR INCOMPLETENESS 3 $128,530 49 $145,965 159 $109,414 7 $30,517 0 $0 8 $134,476
Detailed mortgage data for all 34 tracts in Arvada, CO
Private Mortgage Insurance Companies Aggregated Statistics For Year 2009(Based on 14 full and 20 partial tracts) A) Conventional B) Refinancings C) Non-occupant Loans on Number Average Value Number Average Value Number Average Value
LOANS ORIGINATED 88 $234,536 94 $229,231 3 $177,847 APPLICATIONS APPROVED, NOT ACCEPTED 29 $209,498 42 $225,120 1 $88,850 APPLICATIONS DENIED 10 $223,262 10 $224,252 1 $221,000 APPLICATIONS WITHDRAWN 6 $240,265 5 $256,526 0 $0 FILES CLOSED FOR INCOMPLETENESS 1 $250,860 4 $265,008 1 $59,090
Aggregated Statistics For Year 2008(Based on 14 full and 20 partial tracts) A) Conventional B) Refinancings C) Non-occupant Loans on Number Average Value Number Average Value Number Average Value
LOANS ORIGINATED 255 $204,732 134 $215,986 24 $147,863 APPLICATIONS APPROVED, NOT ACCEPTED 62 $215,709 57 $220,260 9 $150,398 APPLICATIONS DENIED 24 $162,778 13 $228,072 9 $172,589 APPLICATIONS WITHDRAWN 19 $219,624 13 $196,913 4 $127,100 FILES CLOSED FOR INCOMPLETENESS 5 $221,804 3 $231,807 1 $163,190
Aggregated Statistics For Year 2007(Based on 14 full and 20 partial tracts) A) Conventional B) Refinancings C) Non-occupant Loans on Number Average Value Number Average Value Number Average Value
LOANS ORIGINATED 408 $192,189 177 $213,030 41 $172,105 APPLICATIONS APPROVED, NOT ACCEPTED 31 $204,433 37 $222,928 1 $194,000 APPLICATIONS DENIED 8 $189,122 3 $348,333 4 $168,760 APPLICATIONS WITHDRAWN 21 $219,717 11 $228,470 3 $161,500 FILES CLOSED FOR INCOMPLETENESS 1 $206,280 1 $200,710 0 $0
Aggregated Statistics For Year 2006(Based on 14 full and 20 partial tracts) A) Conventional B) Refinancings C) Non-occupant Loans on Number Average Value Number Average Value Number Average Value
LOANS ORIGINATED 133 $196,142 86 $226,324 12 $187,456 APPLICATIONS APPROVED, NOT ACCEPTED 15 $188,375 36 $221,282 3 $161,670 APPLICATIONS DENIED 0 $0 0 $0 0 $0 APPLICATIONS WITHDRAWN 4 $173,805 5 $232,766 2 $133,745 FILES CLOSED FOR INCOMPLETENESS 0 $0 1 $284,620 1 $169,400
Aggregated Statistics For Year 2005(Based on 14 full and 20 partial tracts) A) Conventional B) Refinancings C) Non-occupant Loans on Number Average Value Number Average Value Number Average Value
LOANS ORIGINATED 114 $196,503 134 $211,558 19 $163,437 APPLICATIONS APPROVED, NOT ACCEPTED 14 $213,454 30 $218,991 2 $201,920 APPLICATIONS DENIED 0 $0 2 $197,095 0 $0 APPLICATIONS WITHDRAWN 4 $206,682 8 $223,484 2 $213,135 FILES CLOSED FOR INCOMPLETENESS 1 $228,000 0 $0 1 $228,000
Aggregated Statistics For Year 2004(Based on 14 full and 20 partial tracts) A) Conventional B) Refinancings C) Non-occupant Loans on Number Average Value Number Average Value Number Average Value
LOANS ORIGINATED 158 $212,622 193 $201,553 23 $206,381 APPLICATIONS APPROVED, NOT ACCEPTED 27 $223,586 65 $198,601 6 $193,373 APPLICATIONS DENIED 3 $163,257 4 $234,615 0 $0 APPLICATIONS WITHDRAWN 9 $196,596 29 $189,891 3 $172,987 FILES CLOSED FOR INCOMPLETENESS 2 $224,345 8 $193,015 0 $0
Aggregated Statistics For Year 2003(Based on 13 full and 20 partial tracts) A) Conventional B) Refinancings C) Non-occupant Loans on Number Average Value Number Average Value Number Average Value
LOANS ORIGINATED 253 $201,899 602 $197,518 35 $152,097 APPLICATIONS APPROVED, NOT ACCEPTED 47 $213,693 137 $192,788 5 $178,136 APPLICATIONS DENIED 5 $241,752 10 $205,582 1 $161,520 APPLICATIONS WITHDRAWN 16 $187,843 48 $213,966 6 $200,090 FILES CLOSED FOR INCOMPLETENESS 1 $208,630 2 $247,935 0 $0
Aggregated Statistics For Year 2002(Based on 8 full and 8 partial tracts) A) Conventional B) Refinancings C) Non-occupant Loans on Number Average Value Number Average Value Number Average Value
LOANS ORIGINATED 188 $206,767 241 $187,328 22 $171,035 APPLICATIONS APPROVED, NOT ACCEPTED 35 $211,877 51 $180,156 8 $175,466 APPLICATIONS DENIED 5 $205,084 4 $189,828 2 $224,265 APPLICATIONS WITHDRAWN 11 $196,484 20 $184,144 1 $65,760 FILES CLOSED FOR INCOMPLETENESS 1 $301,520 2 $199,030 0 $0
Aggregated Statistics For Year 2001(Based on 8 full and 8 partial tracts) A) Conventional B) Refinancings C) Non-occupant Loans on Number Average Value Number Average Value Number Average Value
LOANS ORIGINATED 178 $177,056 263 $173,801 19 $155,059 APPLICATIONS APPROVED, NOT ACCEPTED 22 $177,028 38 $168,204 2 $155,655 APPLICATIONS DENIED 1 $145,100 9 $170,043 0 $0 APPLICATIONS WITHDRAWN 3 $221,650 10 $158,644 1 $165,140 FILES CLOSED FOR INCOMPLETENESS 0 $0 1 $112,900 0 $0
Aggregated Statistics For Year 2000(Based on 8 full and 8 partial tracts) A) Conventional B) Refinancings C) Non-occupant Loans on Number Average Value Number Average Value Number Average Value
LOANS ORIGINATED 206 $163,516 81 $150,462 19 $150,444 APPLICATIONS APPROVED, NOT ACCEPTED 18 $154,122 9 $142,417 3 $151,203 APPLICATIONS DENIED 6 $135,768 8 $155,748 1 $135,480 APPLICATIONS WITHDRAWN 7 $177,399 3 $157,633 0 $0 FILES CLOSED FOR INCOMPLETENESS 2 $139,175 0 $0 1 $38,450
Aggregated Statistics For Year 1999(Based on 11 full and 14 partial tracts) A) Conventional B) Refinancings C) Non-occupant Loans on Number Average Value Number Average Value Number Average Value
LOANS ORIGINATED 422 $158,350 304 $141,265 23 $116,201 APPLICATIONS APPROVED, NOT ACCEPTED 43 $152,321 59 $139,999 3 $80,657 APPLICATIONS DENIED 16 $184,018 27 $150,925 1 $130,780 APPLICATIONS WITHDRAWN 13 $146,668 19 $128,865 1 $119,940 FILES CLOSED FOR INCOMPLETENESS 7 $130,373 3 $108,703 0 $0
Fire-safe hotels and motels in Arvada, Colorado:
Savannah Suites, 6455 N Sheridan Blvd, Arvada, Colorado 80003 Phone: (720) 889-2111, Fax: (720) 889-2112
Hilton Garden Inn Arvada Denver, 5455 Olde Wadsworth Blvd, Arvada, Colorado 80002 Phone: (303) 420-9799, Fax: (303) 420-2782
All 2 fire-safe hotels and motels in Arvada, Colorado
Most common first names in Arvada, CO among deceased individuals Name Count Lived (average)
John 406 74.5 years Mary 366 80.0 years Robert 333 70.8 years William 300 75.5 years James 238 70.1 years Charles 208 72.8 years George 183 76.6 years Helen 182 81.7 years Dorothy 177 79.6 years Donald 154 68.9 years
Most common last names in Arvada, CO among deceased individuals Last name Count Lived (average)
Smith 160 77.5 years Johnson 131 76.1 years Miller 88 76.4 years Anderson 88 74.2 years Jones 80 77.1 years Brown 70 77.4 years Nelson 67 78.5 years Williams 55 74.9 years Clark 52 74.0 years Davis 51 78.0 years
Arvada compared to Colorado state average:
Unemployed percentage significantly below state average. Black race population percentage significantly below state average. Percentage of population with a bachelor's degree or higher above state average. Arvada, CO compared to other similar cities:
#14 on the list of "Top 100 highest located cities (pop. 50,000+)"
#23 on the list of "Top 101 cities with the largest differences between daily high and daily low temperatures (population 50,000+)"
#27 on the list of "Top 101 cities with largest percentage of females in industries: management of companies and enterprises (population 50,000+)"
#29 on the list of "Top 101 cities with the smallest sunshine amount differences during a year (population 50,000+)"
#30 on the list of "Top 101 cities with largest percentage of females in occupations: architecture and engineering occupations (population 50,000+)"
#44 on the list of "Top 101 cities with the lowest maximum monthly morning or afternoon humidity (population 50,000+)"
#51 on the list of "Top 101 cities that people commute from (largest negative percentage daily daytime population change due to commuting) (population 50,000+)"
#52 on the list of "Top 101 cities with the lowest average humidity (population 50,000+)"
#52 on the list of "Top 101 cities with the smallest percentages of current college students (population 100,000+)"
#56 on the list of "Top 101 cities with largest percentage of males in occupations: arts, design, entertainment, sports, and media occupations (population 50,000+)"
#61 on the list of "Top 101 cities with the most cars per house, population 50,000+"
#69 on the list of "Top 100 cities with biggest houses (pop. 50,000+)"
#72 on the list of "Top 101 cities with largest percentage of males in occupations: architecture and engineering occupations (population 50,000+)"
#74 on the list of "Top 101 cities with largest percentage of females in industries: mining, quarrying, and oil and gas extraction (population 50,000+)"
#76 on the list of "Top 101 cities with largest percentage of males in industries: mining, quarrying, and oil and gas extraction (population 50,000+)"
#82 on the list of "Top 101 cities with the largest percentage of one, detached housing units in structures (20,000+ housing units)"
#83 on the list of "Top 101 cities with the lowest number of robberies per 100,000 residents (population 50,000+)"
#12 on the list of "Top 101 counties with the highest percentage of residents that exercised in the past month"
#19 on the list of "Top 101 counties with the largest increase in the number of deaths per 1000 residents 2000-2006 to 2007-2013 (pop. 50,000+)"
#22 on the list of "Top 101 counties with the best general health status score of residents (1-5), 3 years of data"
#45 on the list of "Top 101 counties with the lowest average weight of females"
#55 on the list of "Top 101 counties with the highest surface withdrawal of fresh water for public supply (pop. 50,000+)"
Top Patent Applicants
Norbert Kaula (64)
Joel G. Hassell (44)
Mark Jeffrey Pavol (32)
Jeffrey N. Steinmetz (31)
Norbert F. Kaula (29)
David S. Mohler (28)
Brian L. Nakayama (28)
Michael Zappe (26)
Daniel J. Schneider (19)
Anthony William Pankratz (16)
Total of 1553 patent applications in 2008-2024.
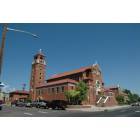
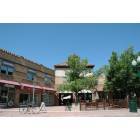
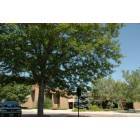
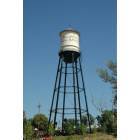
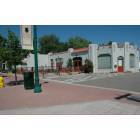
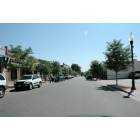
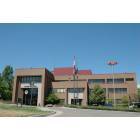
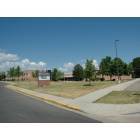
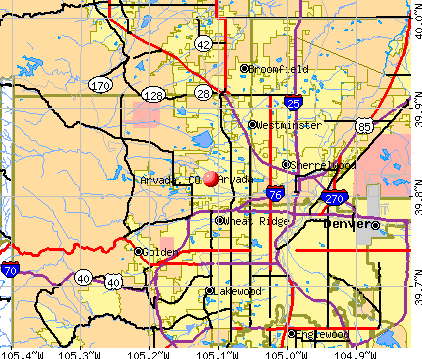


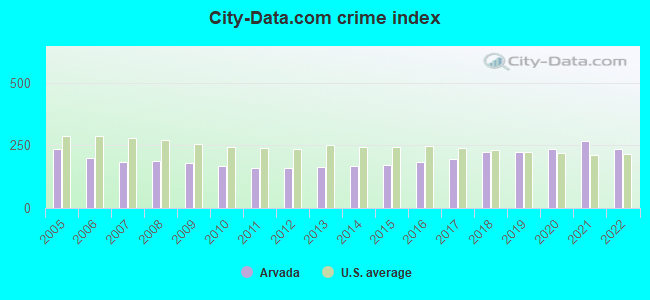
 Recent articles from our blog. Our writers, many of them Ph.D. graduates or candidates, create easy-to-read articles on a wide variety of topics.

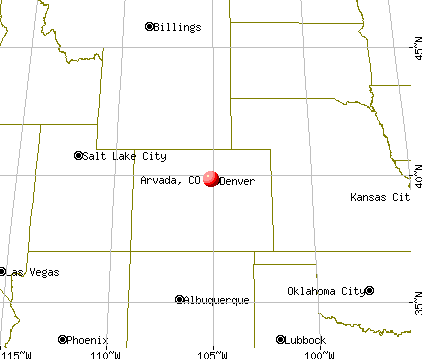
 , pop. 450,166).
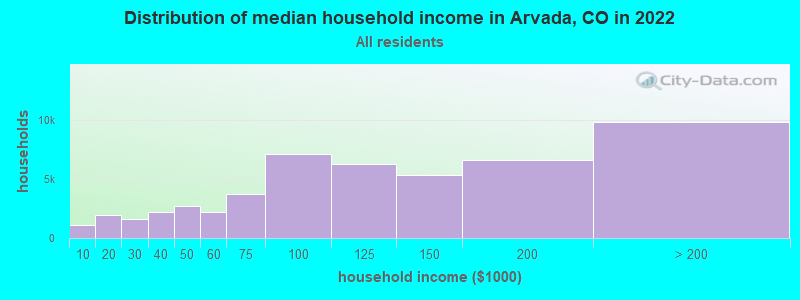
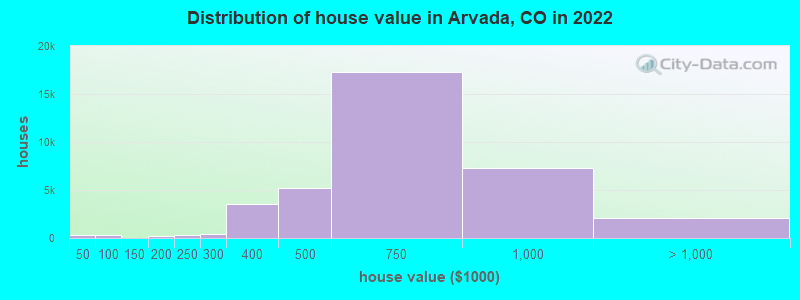
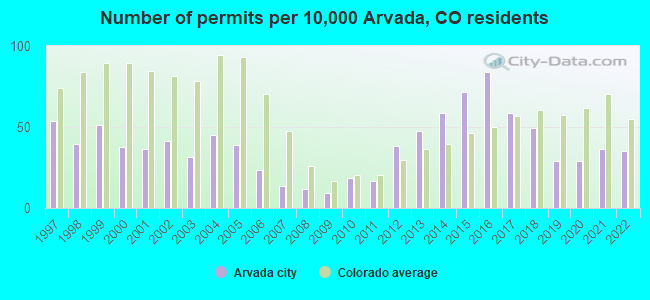
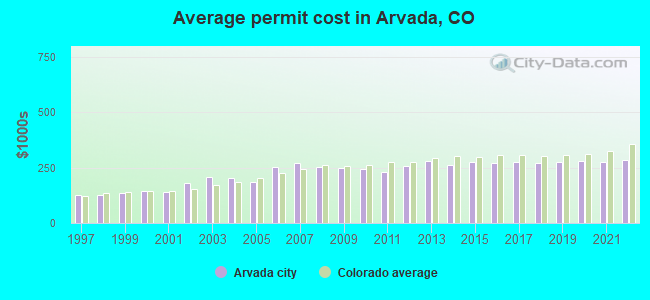
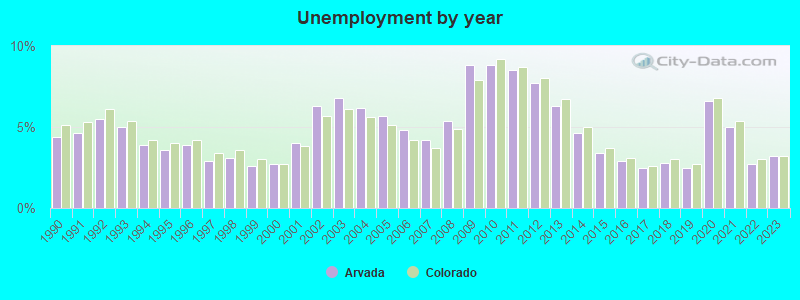
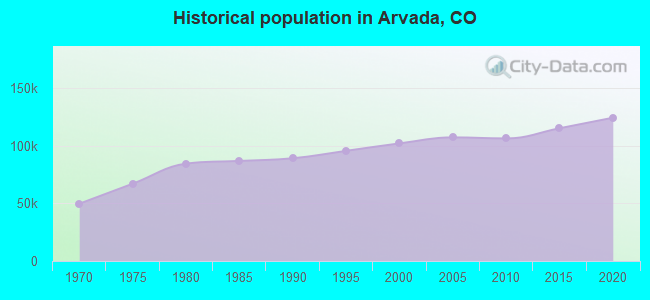
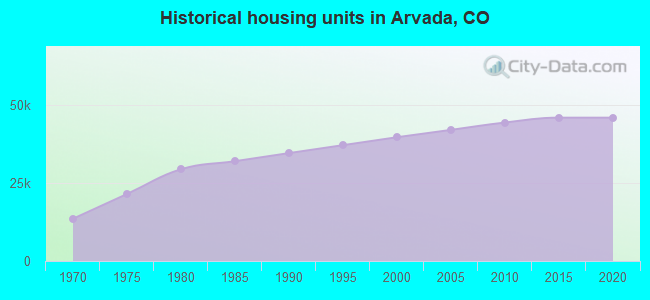
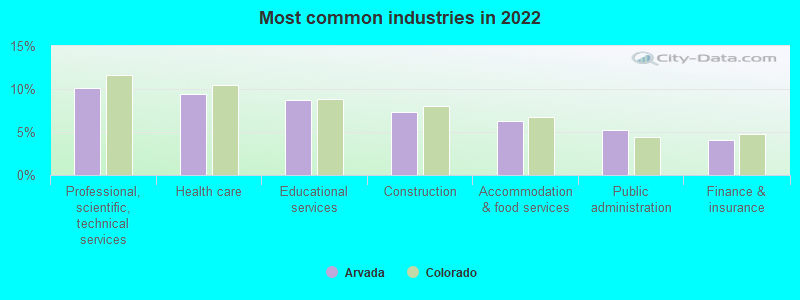
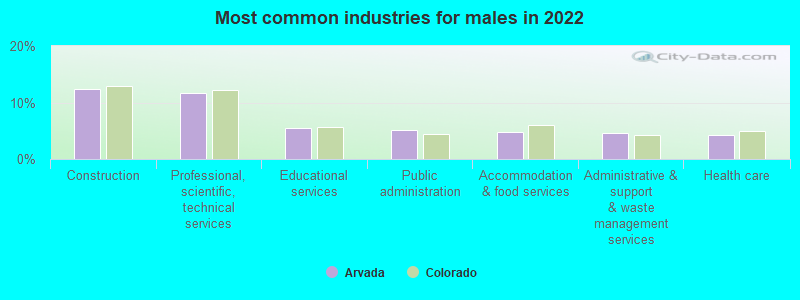
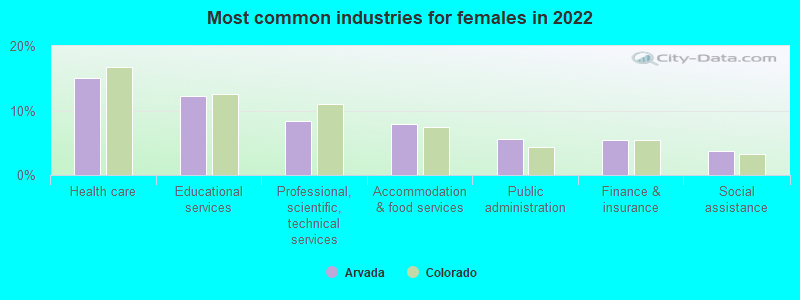
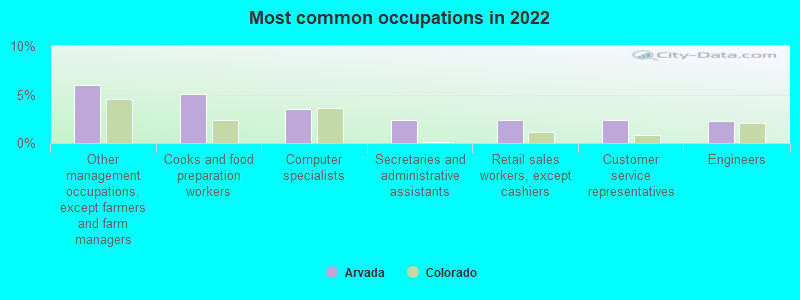
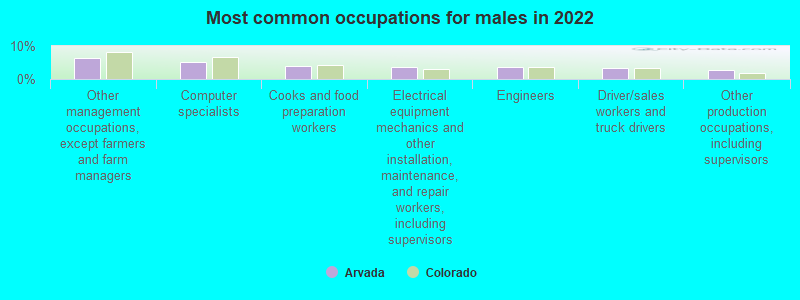
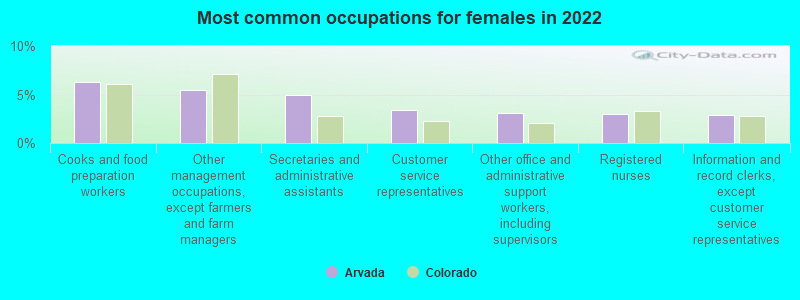
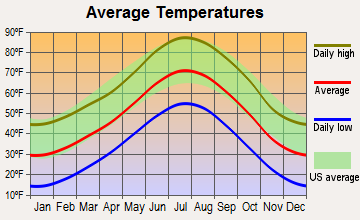
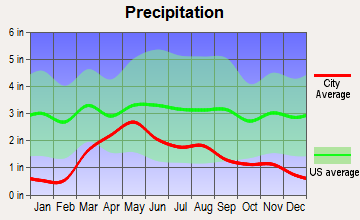
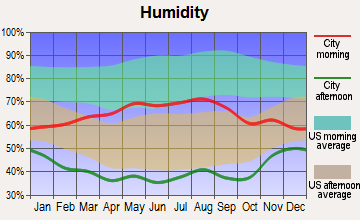
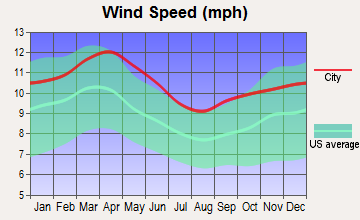
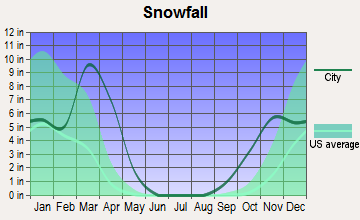
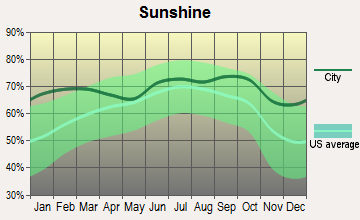
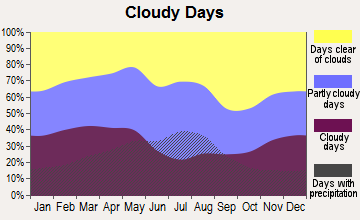
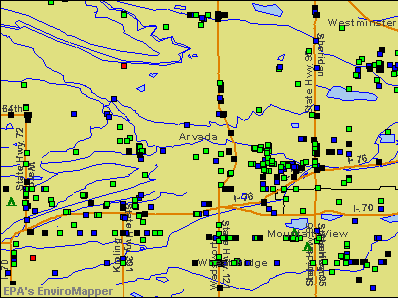

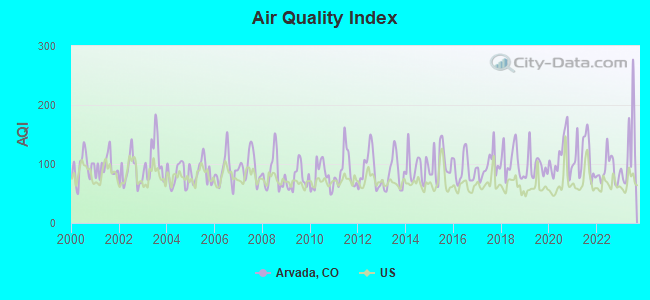
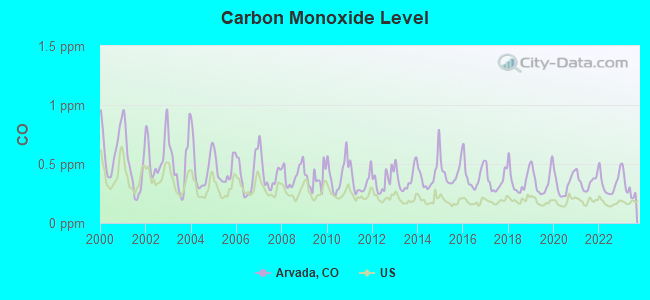
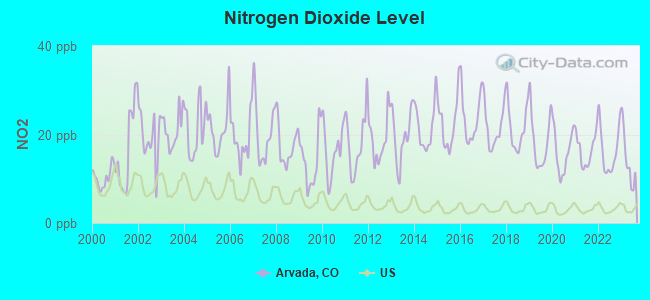
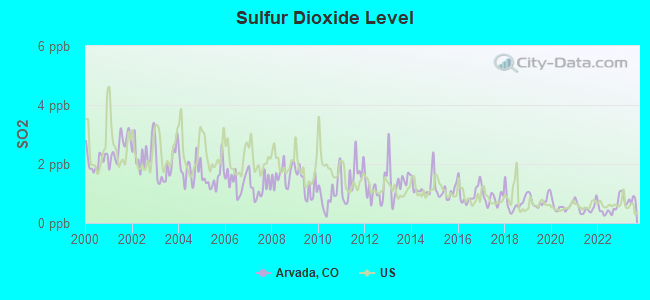
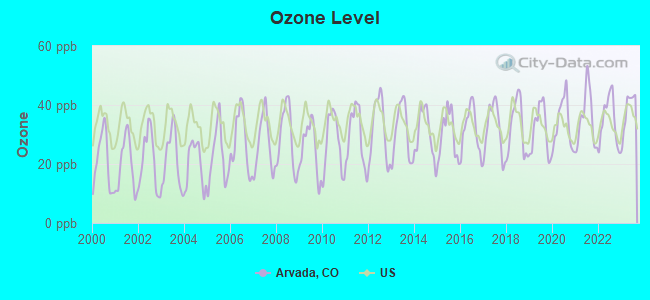
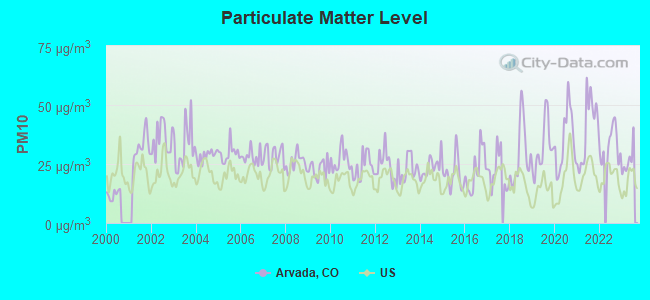
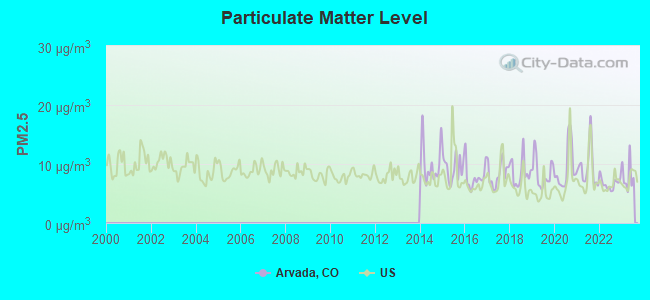
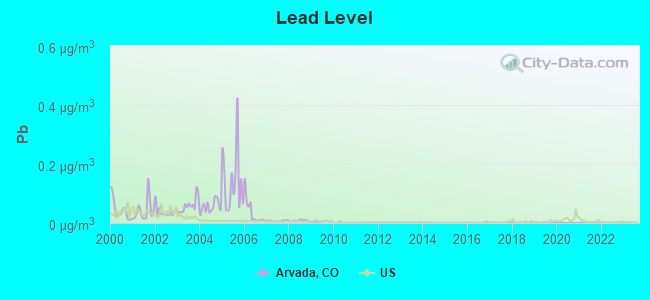

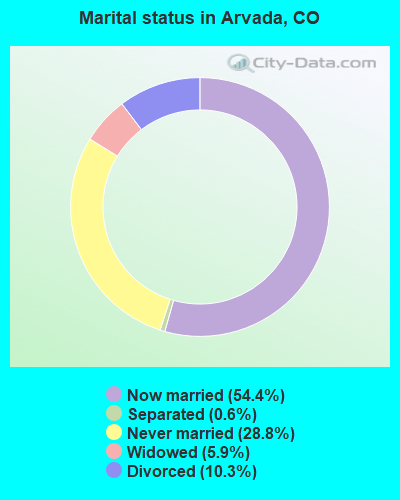
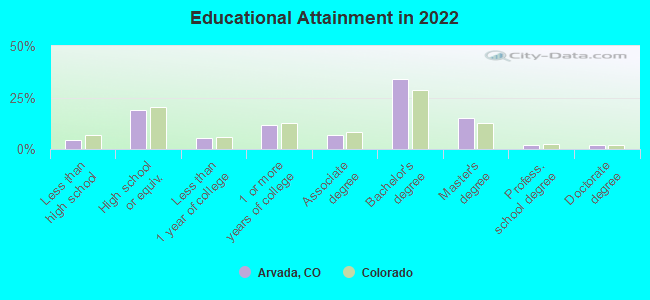
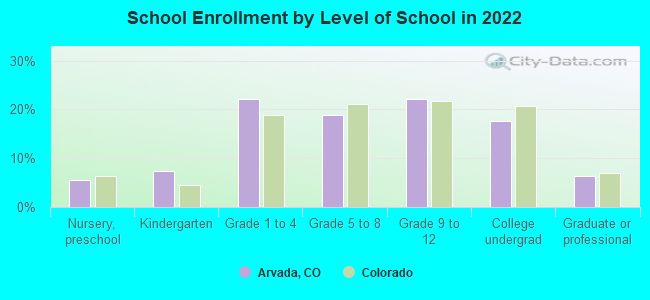
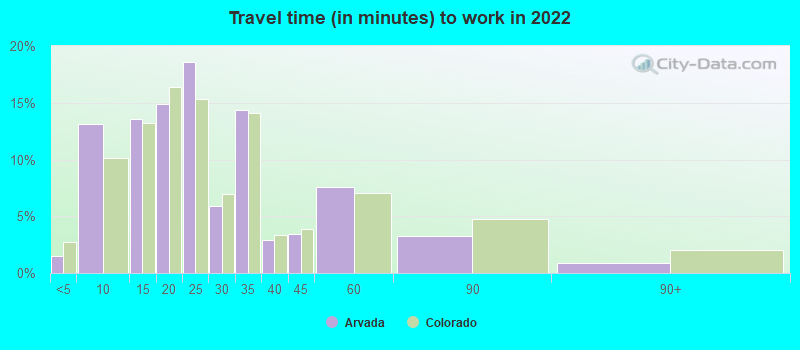
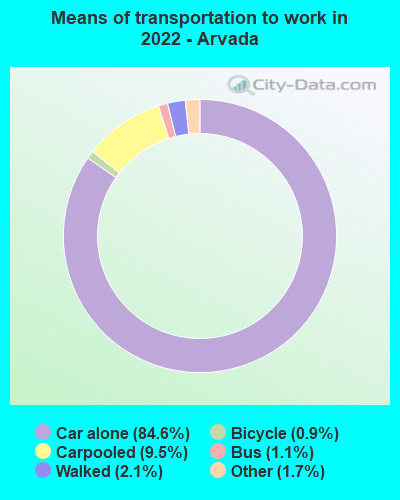
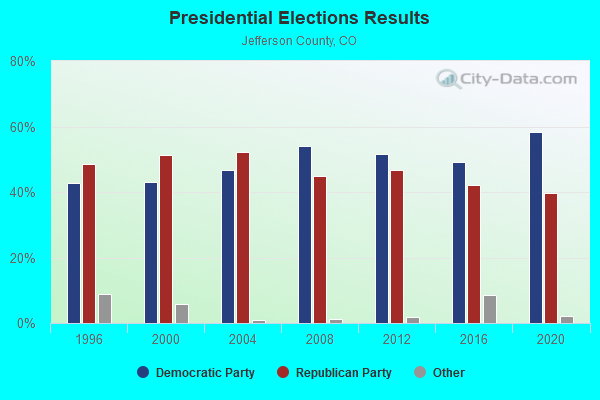
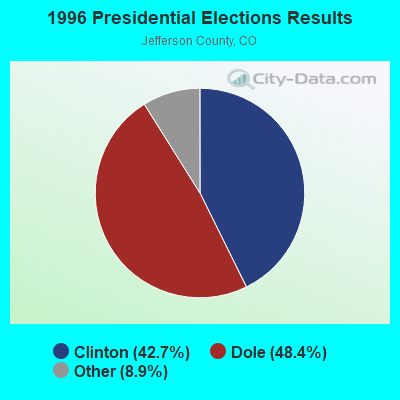

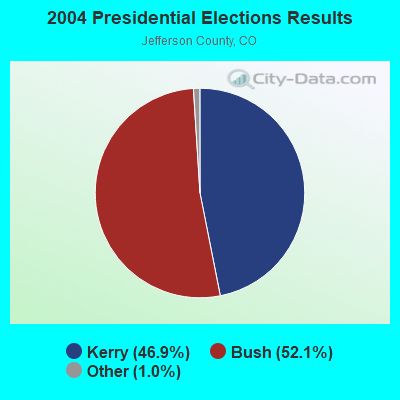
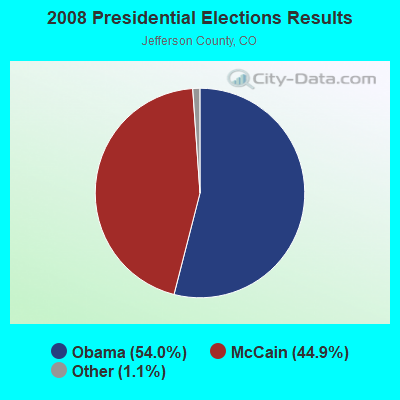
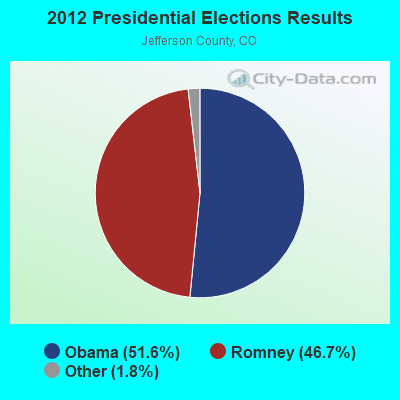
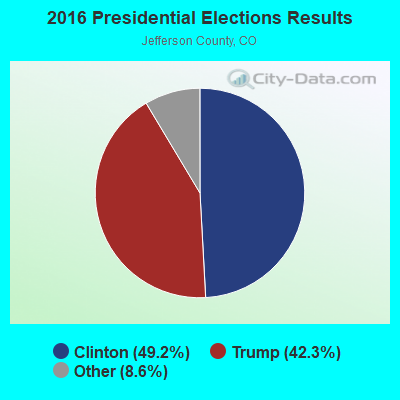

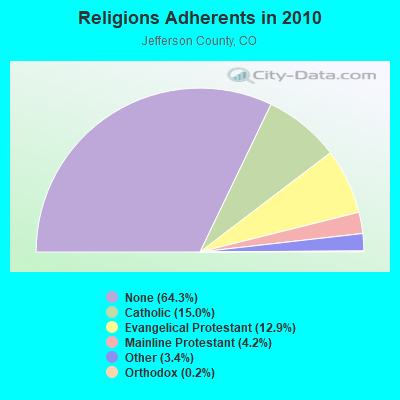
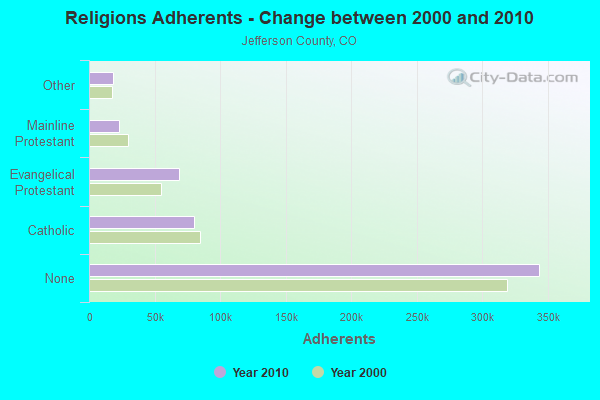
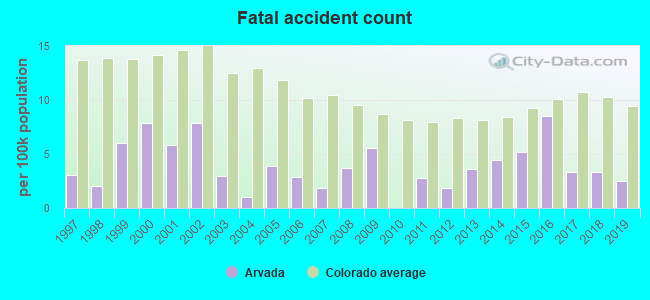
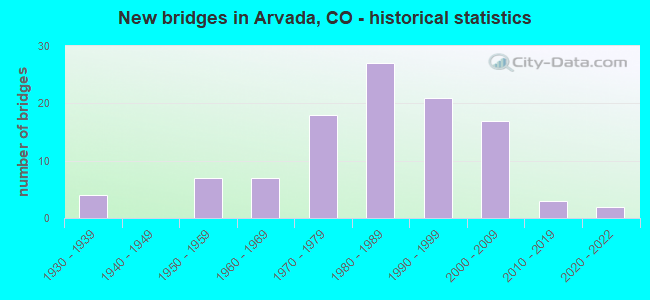
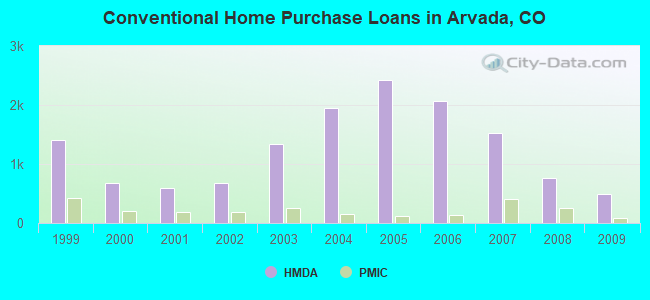
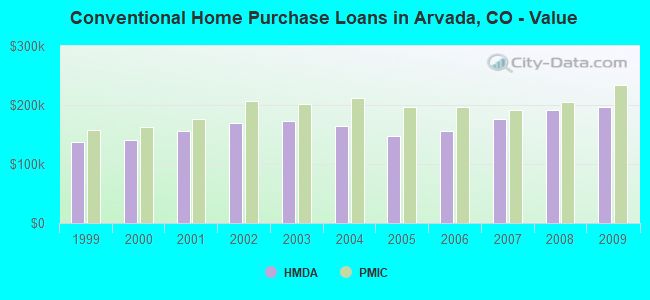
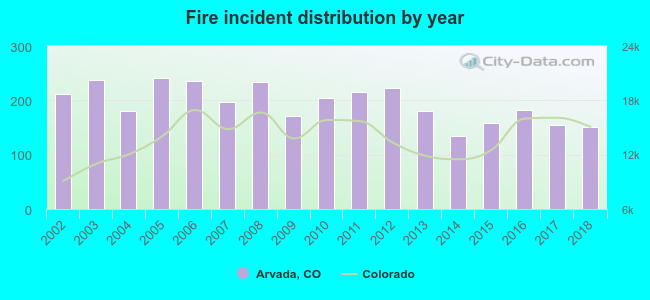 According to the data from the years 2002 - 2018 the average number of fire incidents per year is 195. The highest number of reported fires - 241 took place in 2005, and the least - 134 in 2014. The data has a dropping trend.
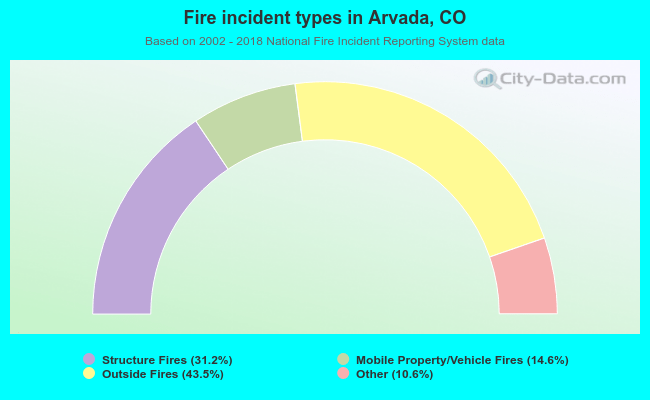 When looking into fire subcategories, the most incidents belonged to: Outside Fires (43.5%), and Structure Fires (31.2%).