Belleview, Florida Submit your own pictures of this city and show them to the world
OSM Map
General Map
Google Map
MSN Map
OSM Map
General Map
Google Map
MSN Map
OSM Map
General Map
Google Map
MSN Map
OSM Map
General Map
Google Map
MSN Map
Please wait while loading the map...
Population in 2022: 5,650 (97% urban, 3% rural). Population change since 2000: +62.4%Males: 2,767 Females: 2,883
March 2022 cost of living index in Belleview: 84.2 (less than average, U.S. average is 100) Percentage of residents living in poverty in 2022: 17.4%for White Non-Hispanic residents , 6.2% for Black residents , 11.4% for Hispanic or Latino residents , 16.0% for two or more races residents )
Profiles of local businesses
Business Search - 14 Million verified businesses
Data:
Median household income ($)
Median household income (% change since 2000)
Household income diversity
Ratio of average income to average house value (%)
Ratio of average income to average rent
Median household income ($) - White
Median household income ($) - Black or African American
Median household income ($) - Asian
Median household income ($) - Hispanic or Latino
Median household income ($) - American Indian and Alaska Native
Median household income ($) - Multirace
Median household income ($) - Other Race
Median household income for houses/condos with a mortgage ($)
Median household income for apartments without a mortgage ($)
Races - White alone (%)
Races - White alone (% change since 2000)
Races - Black alone (%)
Races - Black alone (% change since 2000)
Races - American Indian alone (%)
Races - American Indian alone (% change since 2000)
Races - Asian alone (%)
Races - Asian alone (% change since 2000)
Races - Hispanic (%)
Races - Hispanic (% change since 2000)
Races - Native Hawaiian and Other Pacific Islander alone (%)
Races - Native Hawaiian and Other Pacific Islander alone (% change since 2000)
Races - Two or more races (%)
Races - Two or more races (% change since 2000)
Races - Other race alone (%)
Races - Other race alone (% change since 2000)
Racial diversity
Unemployment (%)
Unemployment (% change since 2000)
Unemployment (%) - White
Unemployment (%) - Black or African American
Unemployment (%) - Asian
Unemployment (%) - Hispanic or Latino
Unemployment (%) - American Indian and Alaska Native
Unemployment (%) - Multirace
Unemployment (%) - Other Race
Population density (people per square mile)
Population - Males (%)
Population - Females (%)
Population - Males (%) - White
Population - Males (%) - Black or African American
Population - Males (%) - Asian
Population - Males (%) - Hispanic or Latino
Population - Males (%) - American Indian and Alaska Native
Population - Males (%) - Multirace
Population - Males (%) - Other Race
Population - Females (%) - White
Population - Females (%) - Black or African American
Population - Females (%) - Asian
Population - Females (%) - Hispanic or Latino
Population - Females (%) - American Indian and Alaska Native
Population - Females (%) - Multirace
Population - Females (%) - Other Race
Coronavirus confirmed cases (Apr 28, 2024)
Deaths caused by coronavirus (Apr 28, 2024)
Coronavirus confirmed cases (per 100k population) (Apr 28, 2024)
Deaths caused by coronavirus (per 100k population) (Apr 28, 2024)
Daily increase in number of cases (Apr 28, 2024)
Weekly increase in number of cases (Apr 28, 2024)
Cases doubled (in days) (Apr 28, 2024)
Hospitalized patients (Apr 18, 2022)
Negative test results (Apr 18, 2022)
Total test results (Apr 18, 2022)
COVID Vaccine doses distributed (per 100k population) (Sep 19, 2023)
COVID Vaccine doses administered (per 100k population) (Sep 19, 2023)
COVID Vaccine doses distributed (Sep 19, 2023)
COVID Vaccine doses administered (Sep 19, 2023)
Likely homosexual households (%)
Likely homosexual households (% change since 2000)
Likely homosexual households - Lesbian couples (%)
Likely homosexual households - Lesbian couples (% change since 2000)
Likely homosexual households - Gay men (%)
Likely homosexual households - Gay men (% change since 2000)
Cost of living index
Median gross rent ($)
Median contract rent ($)
Median monthly housing costs ($)
Median house or condo value ($)
Median house or condo value ($ change since 2000)
Mean house or condo value by units in structure - 1, detached ($)
Mean house or condo value by units in structure - 1, attached ($)
Mean house or condo value by units in structure - 2 ($)
Mean house or condo value by units in structure by units in structure - 3 or 4 ($)
Mean house or condo value by units in structure - 5 or more ($)
Mean house or condo value by units in structure - Boat, RV, van, etc. ($)
Mean house or condo value by units in structure - Mobile home ($)
Median house or condo value ($) - White
Median house or condo value ($) - Black or African American
Median house or condo value ($) - Asian
Median house or condo value ($) - Hispanic or Latino
Median house or condo value ($) - American Indian and Alaska Native
Median house or condo value ($) - Multirace
Median house or condo value ($) - Other Race
Median resident age
Resident age diversity
Median resident age - Males
Median resident age - Females
Median resident age - White
Median resident age - Black or African American
Median resident age - Asian
Median resident age - Hispanic or Latino
Median resident age - American Indian and Alaska Native
Median resident age - Multirace
Median resident age - Other Race
Median resident age - Males - White
Median resident age - Males - Black or African American
Median resident age - Males - Asian
Median resident age - Males - Hispanic or Latino
Median resident age - Males - American Indian and Alaska Native
Median resident age - Males - Multirace
Median resident age - Males - Other Race
Median resident age - Females - White
Median resident age - Females - Black or African American
Median resident age - Females - Asian
Median resident age - Females - Hispanic or Latino
Median resident age - Females - American Indian and Alaska Native
Median resident age - Females - Multirace
Median resident age - Females - Other Race
Commute - mean travel time to work (minutes)
Travel time to work - Less than 5 minutes (%)
Travel time to work - Less than 5 minutes (% change since 2000)
Travel time to work - 5 to 9 minutes (%)
Travel time to work - 5 to 9 minutes (% change since 2000)
Travel time to work - 10 to 19 minutes (%)
Travel time to work - 10 to 19 minutes (% change since 2000)
Travel time to work - 20 to 29 minutes (%)
Travel time to work - 20 to 29 minutes (% change since 2000)
Travel time to work - 30 to 39 minutes (%)
Travel time to work - 30 to 39 minutes (% change since 2000)
Travel time to work - 40 to 59 minutes (%)
Travel time to work - 40 to 59 minutes (% change since 2000)
Travel time to work - 60 to 89 minutes (%)
Travel time to work - 60 to 89 minutes (% change since 2000)
Travel time to work - 90 or more minutes (%)
Travel time to work - 90 or more minutes (% change since 2000)
Marital status - Never married (%)
Marital status - Now married (%)
Marital status - Separated (%)
Marital status - Widowed (%)
Marital status - Divorced (%)
Median family income ($)
Median family income (% change since 2000)
Median non-family income ($)
Median non-family income (% change since 2000)
Median per capita income ($)
Median per capita income (% change since 2000)
Median family income ($) - White
Median family income ($) - Black or African American
Median family income ($) - Asian
Median family income ($) - Hispanic or Latino
Median family income ($) - American Indian and Alaska Native
Median family income ($) - Multirace
Median family income ($) - Other Race
Median year house/condo built
Median year apartment built
Year house built - Built 2005 or later (%)
Year house built - Built 2000 to 2004 (%)
Year house built - Built 1990 to 1999 (%)
Year house built - Built 1980 to 1989 (%)
Year house built - Built 1970 to 1979 (%)
Year house built - Built 1960 to 1969 (%)
Year house built - Built 1950 to 1959 (%)
Year house built - Built 1940 to 1949 (%)
Year house built - Built 1939 or earlier (%)
Average household size
Household density (households per square mile)
Average household size - White
Average household size - Black or African American
Average household size - Asian
Average household size - Hispanic or Latino
Average household size - American Indian and Alaska Native
Average household size - Multirace
Average household size - Other Race
Occupied housing units (%)
Vacant housing units (%)
Owner occupied housing units (%)
Renter occupied housing units (%)
Vacancy status - For rent (%)
Vacancy status - For sale only (%)
Vacancy status - Rented or sold, not occupied (%)
Vacancy status - For seasonal, recreational, or occasional use (%)
Vacancy status - For migrant workers (%)
Vacancy status - Other vacant (%)
Residents with income below the poverty level (%)
Residents with income below 50% of the poverty level (%)
Children below poverty level (%)
Poor families by family type - Married-couple family (%)
Poor families by family type - Male, no wife present (%)
Poor families by family type - Female, no husband present (%)
Poverty status for native-born residents (%)
Poverty status for foreign-born residents (%)
Poverty among high school graduates not in families (%)
Poverty among people who did not graduate high school not in families (%)
Residents with income below the poverty level (%) - White
Residents with income below the poverty level (%) - Black or African American
Residents with income below the poverty level (%) - Asian
Residents with income below the poverty level (%) - Hispanic or Latino
Residents with income below the poverty level (%) - American Indian and Alaska Native
Residents with income below the poverty level (%) - Multirace
Residents with income below the poverty level (%) - Other Race
Air pollution - Air Quality Index (AQI)
Air pollution - CO
Air pollution - NO2
Air pollution - SO2
Air pollution - Ozone
Air pollution - PM10
Air pollution - PM25
Air pollution - Pb
Crime - Murders per 100,000 population
Crime - Rapes per 100,000 population
Crime - Robberies per 100,000 population
Crime - Assaults per 100,000 population
Crime - Burglaries per 100,000 population
Crime - Thefts per 100,000 population
Crime - Auto thefts per 100,000 population
Crime - Arson per 100,000 population
Crime - City-data.com crime index
Crime - Violent crime index
Crime - Property crime index
Crime - Murders per 100,000 population (5 year average)
Crime - Rapes per 100,000 population (5 year average)
Crime - Robberies per 100,000 population (5 year average)
Crime - Assaults per 100,000 population (5 year average)
Crime - Burglaries per 100,000 population (5 year average)
Crime - Thefts per 100,000 population (5 year average)
Crime - Auto thefts per 100,000 population (5 year average)
Crime - Arson per 100,000 population (5 year average)
Crime - City-data.com crime index (5 year average)
Crime - Violent crime index (5 year average)
Crime - Property crime index (5 year average)
1996 Presidential Elections Results (%) - Democratic Party (Clinton)
1996 Presidential Elections Results (%) - Republican Party (Dole)
1996 Presidential Elections Results (%) - Other
2000 Presidential Elections Results (%) - Democratic Party (Gore)
2000 Presidential Elections Results (%) - Republican Party (Bush)
2000 Presidential Elections Results (%) - Other
2004 Presidential Elections Results (%) - Democratic Party (Kerry)
2004 Presidential Elections Results (%) - Republican Party (Bush)
2004 Presidential Elections Results (%) - Other
2008 Presidential Elections Results (%) - Democratic Party (Obama)
2008 Presidential Elections Results (%) - Republican Party (McCain)
2008 Presidential Elections Results (%) - Other
2012 Presidential Elections Results (%) - Democratic Party (Obama)
2012 Presidential Elections Results (%) - Republican Party (Romney)
2012 Presidential Elections Results (%) - Other
2016 Presidential Elections Results (%) - Democratic Party (Clinton)
2016 Presidential Elections Results (%) - Republican Party (Trump)
2016 Presidential Elections Results (%) - Other
2020 Presidential Elections Results (%) - Democratic Party (Biden)
2020 Presidential Elections Results (%) - Republican Party (Trump)
2020 Presidential Elections Results (%) - Other
Ancestries Reported - Arab (%)
Ancestries Reported - Czech (%)
Ancestries Reported - Danish (%)
Ancestries Reported - Dutch (%)
Ancestries Reported - English (%)
Ancestries Reported - French (%)
Ancestries Reported - French Canadian (%)
Ancestries Reported - German (%)
Ancestries Reported - Greek (%)
Ancestries Reported - Hungarian (%)
Ancestries Reported - Irish (%)
Ancestries Reported - Italian (%)
Ancestries Reported - Lithuanian (%)
Ancestries Reported - Norwegian (%)
Ancestries Reported - Polish (%)
Ancestries Reported - Portuguese (%)
Ancestries Reported - Russian (%)
Ancestries Reported - Scotch-Irish (%)
Ancestries Reported - Scottish (%)
Ancestries Reported - Slovak (%)
Ancestries Reported - Subsaharan African (%)
Ancestries Reported - Swedish (%)
Ancestries Reported - Swiss (%)
Ancestries Reported - Ukrainian (%)
Ancestries Reported - United States (%)
Ancestries Reported - Welsh (%)
Ancestries Reported - West Indian (%)
Ancestries Reported - Other (%)
Educational Attainment - No schooling completed (%)
Educational Attainment - Less than high school (%)
Educational Attainment - High school or equivalent (%)
Educational Attainment - Less than 1 year of college (%)
Educational Attainment - 1 or more years of college (%)
Educational Attainment - Associate degree (%)
Educational Attainment - Bachelor's degree (%)
Educational Attainment - Master's degree (%)
Educational Attainment - Professional school degree (%)
Educational Attainment - Doctorate degree (%)
School Enrollment - Nursery, preschool (%)
School Enrollment - Kindergarten (%)
School Enrollment - Grade 1 to 4 (%)
School Enrollment - Grade 5 to 8 (%)
School Enrollment - Grade 9 to 12 (%)
School Enrollment - College undergrad (%)
School Enrollment - Graduate or professional (%)
School Enrollment - Not enrolled in school (%)
School enrollment - Public schools (%)
School enrollment - Private schools (%)
School enrollment - Not enrolled (%)
Median number of rooms in houses and condos
Median number of rooms in apartments
Housing units lacking complete plumbing facilities (%)
Housing units lacking complete kitchen facilities (%)
Density of houses
Urban houses (%)
Rural houses (%)
Households with people 60 years and over (%)
Households with people 65 years and over (%)
Households with people 75 years and over (%)
Households with one or more nonrelatives (%)
Households with no nonrelatives (%)
Population in households (%)
Family households (%)
Nonfamily households (%)
Population in families (%)
Family households with own children (%)
Median number of bedrooms in owner occupied houses
Mean number of bedrooms in owner occupied houses
Median number of bedrooms in renter occupied houses
Mean number of bedrooms in renter occupied houses
Median number of vehichles in owner occupied houses
Mean number of vehichles in owner occupied houses
Median number of vehichles in renter occupied houses
Mean number of vehichles in renter occupied houses
Mortgage status - with mortgage (%)
Mortgage status - with second mortgage (%)
Mortgage status - with home equity loan (%)
Mortgage status - with both second mortgage and home equity loan (%)
Mortgage status - without a mortgage (%)
Average family size
Average family size - White
Average family size - Black or African American
Average family size - Asian
Average family size - Hispanic or Latino
Average family size - American Indian and Alaska Native
Average family size - Multirace
Average family size - Other Race
Geographical mobility - Same house 1 year ago (%)
Geographical mobility - Moved within same county (%)
Geographical mobility - Moved from different county within same state (%)
Geographical mobility - Moved from different state (%)
Geographical mobility - Moved from abroad (%)
Place of birth - Born in state of residence (%)
Place of birth - Born in other state (%)
Place of birth - Native, outside of US (%)
Place of birth - Foreign born (%)
Housing units in structures - 1, detached (%)
Housing units in structures - 1, attached (%)
Housing units in structures - 2 (%)
Housing units in structures - 3 or 4 (%)
Housing units in structures - 5 to 9 (%)
Housing units in structures - 10 to 19 (%)
Housing units in structures - 20 to 49 (%)
Housing units in structures - 50 or more (%)
Housing units in structures - Mobile home (%)
Housing units in structures - Boat, RV, van, etc. (%)
House/condo owner moved in on average (years ago)
Renter moved in on average (years ago)
Year householder moved into unit - Moved in 1999 to March 2000 (%)
Year householder moved into unit - Moved in 1995 to 1998 (%)
Year householder moved into unit - Moved in 1990 to 1994 (%)
Year householder moved into unit - Moved in 1980 to 1989 (%)
Year householder moved into unit - Moved in 1970 to 1979 (%)
Year householder moved into unit - Moved in 1969 or earlier (%)
Means of transportation to work - Drove car alone (%)
Means of transportation to work - Carpooled (%)
Means of transportation to work - Public transportation (%)
Means of transportation to work - Bus or trolley bus (%)
Means of transportation to work - Streetcar or trolley car (%)
Means of transportation to work - Subway or elevated (%)
Means of transportation to work - Railroad (%)
Means of transportation to work - Ferryboat (%)
Means of transportation to work - Taxicab (%)
Means of transportation to work - Motorcycle (%)
Means of transportation to work - Bicycle (%)
Means of transportation to work - Walked (%)
Means of transportation to work - Other means (%)
Working at home (%)
Industry diversity
Most Common Industries - Agriculture, forestry, fishing and hunting, and mining (%)
Most Common Industries - Agriculture, forestry, fishing and hunting (%)
Most Common Industries - Mining, quarrying, and oil and gas extraction (%)
Most Common Industries - Construction (%)
Most Common Industries - Manufacturing (%)
Most Common Industries - Wholesale trade (%)
Most Common Industries - Retail trade (%)
Most Common Industries - Transportation and warehousing, and utilities (%)
Most Common Industries - Transportation and warehousing (%)
Most Common Industries - Utilities (%)
Most Common Industries - Information (%)
Most Common Industries - Finance and insurance, and real estate and rental and leasing (%)
Most Common Industries - Finance and insurance (%)
Most Common Industries - Real estate and rental and leasing (%)
Most Common Industries - Professional, scientific, and management, and administrative and waste management services (%)
Most Common Industries - Professional, scientific, and technical services (%)
Most Common Industries - Management of companies and enterprises (%)
Most Common Industries - Administrative and support and waste management services (%)
Most Common Industries - Educational services, and health care and social assistance (%)
Most Common Industries - Educational services (%)
Most Common Industries - Health care and social assistance (%)
Most Common Industries - Arts, entertainment, and recreation, and accommodation and food services (%)
Most Common Industries - Arts, entertainment, and recreation (%)
Most Common Industries - Accommodation and food services (%)
Most Common Industries - Other services, except public administration (%)
Most Common Industries - Public administration (%)
Occupation diversity
Most Common Occupations - Management, business, science, and arts occupations (%)
Most Common Occupations - Management, business, and financial occupations (%)
Most Common Occupations - Management occupations (%)
Most Common Occupations - Business and financial operations occupations (%)
Most Common Occupations - Computer, engineering, and science occupations (%)
Most Common Occupations - Computer and mathematical occupations (%)
Most Common Occupations - Architecture and engineering occupations (%)
Most Common Occupations - Life, physical, and social science occupations (%)
Most Common Occupations - Education, legal, community service, arts, and media occupations (%)
Most Common Occupations - Community and social service occupations (%)
Most Common Occupations - Legal occupations (%)
Most Common Occupations - Education, training, and library occupations (%)
Most Common Occupations - Arts, design, entertainment, sports, and media occupations (%)
Most Common Occupations - Healthcare practitioners and technical occupations (%)
Most Common Occupations - Health diagnosing and treating practitioners and other technical occupations (%)
Most Common Occupations - Health technologists and technicians (%)
Most Common Occupations - Service occupations (%)
Most Common Occupations - Healthcare support occupations (%)
Most Common Occupations - Protective service occupations (%)
Most Common Occupations - Fire fighting and prevention, and other protective service workers including supervisors (%)
Most Common Occupations - Law enforcement workers including supervisors (%)
Most Common Occupations - Food preparation and serving related occupations (%)
Most Common Occupations - Building and grounds cleaning and maintenance occupations (%)
Most Common Occupations - Personal care and service occupations (%)
Most Common Occupations - Sales and office occupations (%)
Most Common Occupations - Sales and related occupations (%)
Most Common Occupations - Office and administrative support occupations (%)
Most Common Occupations - Natural resources, construction, and maintenance occupations (%)
Most Common Occupations - Farming, fishing, and forestry occupations (%)
Most Common Occupations - Construction and extraction occupations (%)
Most Common Occupations - Installation, maintenance, and repair occupations (%)
Most Common Occupations - Production, transportation, and material moving occupations (%)
Most Common Occupations - Production occupations (%)
Most Common Occupations - Transportation occupations (%)
Most Common Occupations - Material moving occupations (%)
People in Group quarters - Institutionalized population (%)
People in Group quarters - Correctional institutions (%)
People in Group quarters - Federal prisons and detention centers (%)
People in Group quarters - Halfway houses (%)
People in Group quarters - Local jails and other confinement facilities (including police lockups) (%)
People in Group quarters - Military disciplinary barracks (%)
People in Group quarters - State prisons (%)
People in Group quarters - Other types of correctional institutions (%)
People in Group quarters - Nursing homes (%)
People in Group quarters - Hospitals/wards, hospices, and schools for the handicapped (%)
People in Group quarters - Hospitals/wards and hospices for chronically ill (%)
People in Group quarters - Hospices or homes for chronically ill (%)
People in Group quarters - Military hospitals or wards for chronically ill (%)
People in Group quarters - Other hospitals or wards for chronically ill (%)
People in Group quarters - Hospitals or wards for drug/alcohol abuse (%)
People in Group quarters - Mental (Psychiatric) hospitals or wards (%)
People in Group quarters - Schools, hospitals, or wards for the mentally retarded (%)
People in Group quarters - Schools, hospitals, or wards for the physically handicapped (%)
People in Group quarters - Institutions for the deaf (%)
People in Group quarters - Institutions for the blind (%)
People in Group quarters - Orthopedic wards and institutions for the physically handicapped (%)
People in Group quarters - Wards in general hospitals for patients who have no usual home elsewhere (%)
People in Group quarters - Wards in military hospitals for patients who have no usual home elsewhere (%)
People in Group quarters - Juvenile institutions (%)
People in Group quarters - Long-term care (%)
People in Group quarters - Homes for abused, dependent, and neglected children (%)
People in Group quarters - Residential treatment centers for emotionally disturbed children (%)
People in Group quarters - Training schools for juvenile delinquents (%)
People in Group quarters - Short-term care, detention or diagnostic centers for delinquent children (%)
People in Group quarters - Type of juvenile institution unknown (%)
People in Group quarters - Noninstitutionalized population (%)
People in Group quarters - College dormitories (includes college quarters off campus) (%)
People in Group quarters - Military quarters (%)
People in Group quarters - On base (%)
People in Group quarters - Barracks, unaccompanied personnel housing (UPH), (Enlisted/Officer), ;and similar group living quarters for military personnel (%)
People in Group quarters - Transient quarters for temporary residents (%)
People in Group quarters - Military ships (%)
People in Group quarters - Group homes (%)
People in Group quarters - Homes or halfway houses for drug/alcohol abuse (%)
People in Group quarters - Homes for the mentally ill (%)
People in Group quarters - Homes for the mentally retarded (%)
People in Group quarters - Homes for the physically handicapped (%)
People in Group quarters - Other group homes (%)
People in Group quarters - Religious group quarters (%)
People in Group quarters - Dormitories (%)
People in Group quarters - Agriculture workers' dormitories on farms (%)
People in Group quarters - Job Corps and vocational training facilities (%)
People in Group quarters - Other workers' dormitories (%)
People in Group quarters - Crews of maritime vessels (%)
People in Group quarters - Other nonhousehold living situations (%)
People in Group quarters - Other noninstitutional group quarters (%)
Residents speaking English at home (%)
Residents speaking English at home - Born in the United States (%)
Residents speaking English at home - Native, born elsewhere (%)
Residents speaking English at home - Foreign born (%)
Residents speaking Spanish at home (%)
Residents speaking Spanish at home - Born in the United States (%)
Residents speaking Spanish at home - Native, born elsewhere (%)
Residents speaking Spanish at home - Foreign born (%)
Residents speaking other language at home (%)
Residents speaking other language at home - Born in the United States (%)
Residents speaking other language at home - Native, born elsewhere (%)
Residents speaking other language at home - Foreign born (%)
Class of Workers - Employee of private company (%)
Class of Workers - Self-employed in own incorporated business (%)
Class of Workers - Private not-for-profit wage and salary workers (%)
Class of Workers - Local government workers (%)
Class of Workers - State government workers (%)
Class of Workers - Federal government workers (%)
Class of Workers - Self-employed workers in own not incorporated business and Unpaid family workers (%)
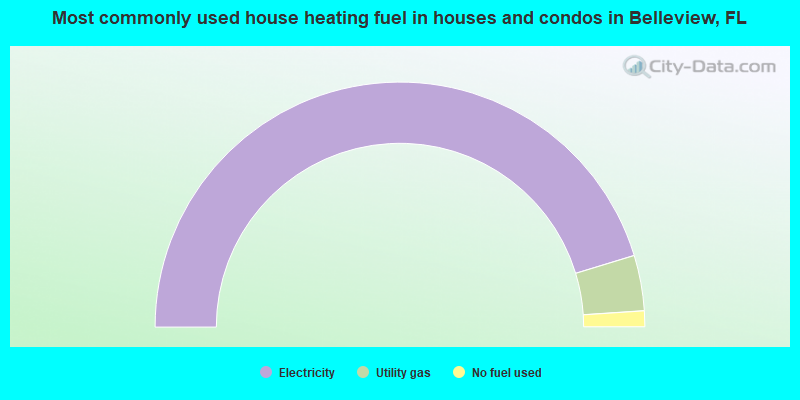
House heating fuel used in houses and condos - Utility gas (%)
House heating fuel used in houses and condos - Bottled, tank, or LP gas (%)
House heating fuel used in houses and condos - Electricity (%)
House heating fuel used in houses and condos - Fuel oil, kerosene, etc. (%)
House heating fuel used in houses and condos - Coal or coke (%)
House heating fuel used in houses and condos - Wood (%)
House heating fuel used in houses and condos - Solar energy (%)
House heating fuel used in houses and condos - Other fuel (%)
House heating fuel used in houses and condos - No fuel used (%)
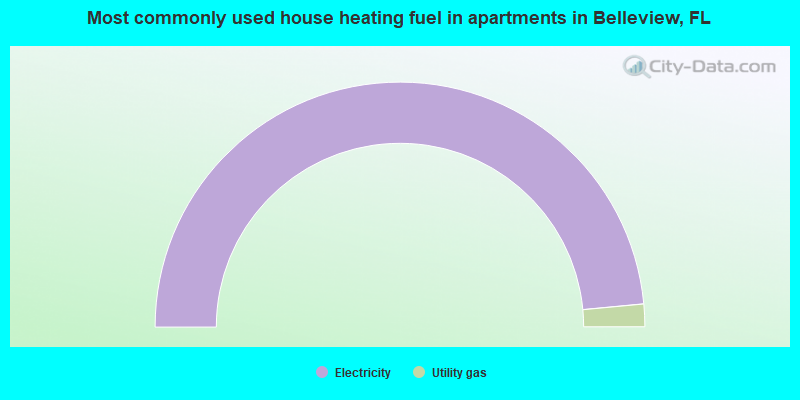
House heating fuel used in apartments - Utility gas (%)
House heating fuel used in apartments - Bottled, tank, or LP gas (%)
House heating fuel used in apartments - Electricity (%)
House heating fuel used in apartments - Fuel oil, kerosene, etc. (%)
House heating fuel used in apartments - Coal or coke (%)
House heating fuel used in apartments - Wood (%)
House heating fuel used in apartments - Solar energy (%)
House heating fuel used in apartments - Other fuel (%)
House heating fuel used in apartments - No fuel used (%)
Armed forces status - In Armed Forces (%)
Armed forces status - Civilian (%)
Armed forces status - Civilian - Veteran (%)
Armed forces status - Civilian - Nonveteran (%)
Fatal accidents locations in years 2005-2021
Fatal accidents locations in 2005
Fatal accidents locations in 2006
Fatal accidents locations in 2007
Fatal accidents locations in 2008
Fatal accidents locations in 2009
Fatal accidents locations in 2010
Fatal accidents locations in 2011
Fatal accidents locations in 2012
Fatal accidents locations in 2013
Fatal accidents locations in 2014
Fatal accidents locations in 2015
Fatal accidents locations in 2016
Fatal accidents locations in 2017
Fatal accidents locations in 2018
Fatal accidents locations in 2019
Fatal accidents locations in 2020
Fatal accidents locations in 2021
Alcohol use - People drinking some alcohol every month (%)
Alcohol use - People not drinking at all (%)
Alcohol use - Average days/month drinking alcohol
Alcohol use - Average drinks/week
Alcohol use - Average days/year people drink much
Audiometry - Average condition of hearing (%)
Audiometry - People that can hear a whisper from across a quiet room (%)
Audiometry - People that can hear normal voice from across a quiet room (%)
Audiometry - Ears ringing, roaring, buzzing (%)
Audiometry - Had a job exposure to loud noise (%)
Audiometry - Had off-work exposure to loud noise (%)
Blood Pressure & Cholesterol - Has high blood pressure (%)
Blood Pressure & Cholesterol - Checking blood pressure at home (%)
Blood Pressure & Cholesterol - Frequently checking blood cholesterol (%)
Blood Pressure & Cholesterol - Has high cholesterol level (%)
Consumer Behavior - Money monthly spent on food at supermarket/grocery store
Consumer Behavior - Money monthly spent on food at other stores
Consumer Behavior - Money monthly spent on eating out
Consumer Behavior - Money monthly spent on carryout/delivered foods
Consumer Behavior - Income spent on food at supermarket/grocery store (%)
Consumer Behavior - Income spent on food at other stores (%)
Consumer Behavior - Income spent on eating out (%)
Consumer Behavior - Income spent on carryout/delivered foods (%)
Current Health Status - General health condition (%)
Current Health Status - Blood donors (%)
Current Health Status - Has blood ever tested for HIV virus (%)
Current Health Status - Left-handed people (%)
Dermatology - People using sunscreen (%)
Diabetes - Diabetics (%)
Diabetes - Had a blood test for high blood sugar (%)
Diabetes - People taking insulin (%)
Diet Behavior & Nutrition - Diet health (%)
Diet Behavior & Nutrition - Milk product consumption (# of products/month)
Diet Behavior & Nutrition - Meals not home prepared (#/week)
Diet Behavior & Nutrition - Meals from fast food or pizza place (#/week)
Diet Behavior & Nutrition - Ready-to-eat foods (#/month)
Diet Behavior & Nutrition - Frozen meals/pizza (#/month)
Drug Use - People that ever used marijuana or hashish (%)
Drug Use - Ever used hard drugs (%)
Drug Use - Ever used any form of cocaine (%)
Drug Use - Ever used heroin (%)
Drug Use - Ever used methamphetamine (%)
Health Insurance - People covered by health insurance (%)
Kidney Conditions-Urology - Avg. # of times urinating at night
Medical Conditions - People with asthma (%)
Medical Conditions - People with anemia (%)
Medical Conditions - People with psoriasis (%)
Medical Conditions - People with overweight (%)
Medical Conditions - Elderly people having difficulties in thinking or remembering (%)
Medical Conditions - People who ever received blood transfusion (%)
Medical Conditions - People having trouble seeing even with glass/contacts (%)
Medical Conditions - People with arthritis (%)
Medical Conditions - People with gout (%)
Medical Conditions - People with congestive heart failure (%)
Medical Conditions - People with coronary heart disease (%)
Medical Conditions - People with angina pectoris (%)
Medical Conditions - People who ever had heart attack (%)
Medical Conditions - People who ever had stroke (%)
Medical Conditions - People with emphysema (%)
Medical Conditions - People with thyroid problem (%)
Medical Conditions - People with chronic bronchitis (%)
Medical Conditions - People with any liver condition (%)
Medical Conditions - People who ever had cancer or malignancy (%)
Mental Health - People who have little interest in doing things (%)
Mental Health - People feeling down, depressed, or hopeless (%)
Mental Health - People who have trouble sleeping or sleeping too much (%)
Mental Health - People feeling tired or having little energy (%)
Mental Health - People with poor appetite or overeating (%)
Mental Health - People feeling bad about themself (%)
Mental Health - People who have trouble concentrating on things (%)
Mental Health - People moving or speaking slowly or too fast (%)
Mental Health - People having thoughts they would be better off dead (%)
Oral Health - Average years since last visit a dentist
Oral Health - People embarrassed because of mouth (%)
Oral Health - People with gum disease (%)
Oral Health - General health of teeth and gums (%)
Oral Health - Average days a week using dental floss/device
Oral Health - Average days a week using mouthwash for dental problem
Oral Health - Average number of teeth
Pesticide Use - Households using pesticides to control insects (%)
Pesticide Use - Households using pesticides to kill weeds (%)
Physical Activity - People doing vigorous-intensity work activities (%)
Physical Activity - People doing moderate-intensity work activities (%)
Physical Activity - People walking or bicycling (%)
Physical Activity - People doing vigorous-intensity recreational activities (%)
Physical Activity - People doing moderate-intensity recreational activities (%)
Physical Activity - Average hours a day doing sedentary activities
Physical Activity - Average hours a day watching TV or videos
Physical Activity - Average hours a day using computer
Physical Functioning - People having limitations keeping them from working (%)
Physical Functioning - People limited in amount of work they can do (%)
Physical Functioning - People that need special equipment to walk (%)
Physical Functioning - People experiencing confusion/memory problems (%)
Physical Functioning - People requiring special healthcare equipment (%)
Prescription Medications - Average number of prescription medicines taking
Preventive Aspirin Use - Adults 40+ taking low-dose aspirin (%)
Reproductive Health - Vaginal deliveries (%)
Reproductive Health - Cesarean deliveries (%)
Reproductive Health - Deliveries resulted in a live birth (%)
Reproductive Health - Pregnancies resulted in a delivery (%)
Reproductive Health - Women breastfeeding newborns (%)
Reproductive Health - Women that had a hysterectomy (%)
Reproductive Health - Women that had both ovaries removed (%)
Reproductive Health - Women that have ever taken birth control pills (%)
Reproductive Health - Women taking birth control pills (%)
Reproductive Health - Women that have ever used Depo-Provera or injectables (%)
Reproductive Health - Women that have ever used female hormones (%)
Sexual Behavior - People 18+ that ever had sex (vaginal, anal, or oral) (%)
Sexual Behavior - Males 18+ that ever had vaginal sex with a woman (%)
Sexual Behavior - Males 18+ that ever performed oral sex on a woman (%)
Sexual Behavior - Males 18+ that ever had anal sex with a woman (%)
Sexual Behavior - Males 18+ that ever had any sex with a man (%)
Sexual Behavior - Females 18+ that ever had vaginal sex with a man (%)
Sexual Behavior - Females 18+ that ever performed oral sex on a man (%)
Sexual Behavior - Females 18+ that ever had anal sex with a man (%)
Sexual Behavior - Females 18+ that ever had any kind of sex with a woman (%)
Sexual Behavior - Average age people first had sex
Sexual Behavior - Average number of female sex partners in lifetime (males 18+)
Sexual Behavior - Average number of female vaginal sex partners in lifetime (males 18+)
Sexual Behavior - Average age people first performed oral sex on a woman (18+)
Sexual Behavior - Average number of woman performed oral sex on in lifetime (18+)
Sexual Behavior - Average number of male sex partners in lifetime (males 18+)
Sexual Behavior - Average number of male anal sex partners in lifetime (males 18+)
Sexual Behavior - Average age people first performed oral sex on a man (18+)
Sexual Behavior - Average number of male oral sex partners in lifetime (18+)
Sexual Behavior - People using protection when performing oral sex (%)
Sexual Behavior - Average number of times people have vaginal or anal sex a year
Sexual Behavior - People having sex without condom (%)
Sexual Behavior - Average number of male sex partners in lifetime (females 18+)
Sexual Behavior - Average number of male vaginal sex partners in lifetime (females 18+)
Sexual Behavior - Average number of female sex partners in lifetime (females 18+)
Sexual Behavior - Circumcised males 18+ (%)
Sleep Disorders - Average hours sleeping at night
Sleep Disorders - People that has trouble sleeping (%)
Smoking-Cigarette Use - People smoking cigarettes (%)
Taste & Smell - People 40+ having problems with smell (%)
Taste & Smell - People 40+ having problems with taste (%)
Taste & Smell - People 40+ that ever had wisdom teeth removed (%)
Taste & Smell - People 40+ that ever had tonsils teeth removed (%)
Taste & Smell - People 40+ that ever had a loss of consciousness because of a head injury (%)
Taste & Smell - People 40+ that ever had a broken nose or other serious injury to face or skull (%)
Taste & Smell - People 40+ that ever had two or more sinus infections (%)
Weight - Average height (inches)
Weight - Average weight (pounds)
Weight - Average BMI
Weight - People that are obese (%)
Weight - People that ever were obese (%)
Weight - People trying to lose weight (%)
Officers per 1,000 residents here:
2.65Florida average:
2.33
Latest news from Belleview, FL collected exclusively by city-data.com from local newspapers, TV, and radio stations
Ancestries: Irish (16.7%), Italian (16.5%), German (16.0%), English (12.1%), American (4.4%), European (4.3%).
Current Local Time:
Land area: 1.83 square miles.
Population density: 3,095 people per square mile (average).
201 residents are foreign born (3.5% Latin America ).
This city:
3.5%Florida:
21.1%
Median real estate property taxes paid for housing units with mortgages in 2022: $1,668 (0.7%)Median real estate property taxes paid for housing units with no mortgage in 2022: $1,150 (0.9%)
Nearest city with pop. 50,000+: Gainesville, FL
Nearest city with pop. 200,000+: Tampa, FL
Nearest city with pop. 1,000,000+: Houston, TX
Nearest cities:
Latitude: 29.06 N, Longitude: 82.05 W
Single-family new house construction building permits:
2022: 52 buildings , average cost: $142,2002021: 41 buildings , average cost: $110,7002020: 61 buildings , average cost: $197,7002019: 35 buildings , average cost: $187,1002018: 42 buildings , average cost: $182,7002017: 25 buildings , average cost: $155,1002016: 25 buildings , average cost: $144,1002015: 21 buildings , average cost: $127,1002014: 25 buildings , average cost: $104,0002013: 12 buildings , average cost: $151,0002012: 6 buildings , average cost: $170,8002011: 1 building , cost: $183,7002010: 2 buildings , average cost: $191,6002009: 5 buildings , average cost: $100,0002008: 2 buildings , average cost: $193,5002007: 16 buildings , average cost: $213,4002006: 56 buildings , average cost: $182,3002005: 78 buildings , average cost: $128,9002004: 71 buildings , average cost: $133,6002003: 46 buildings , average cost: $131,8002002: 35 buildings , average cost: $113,6002001: 24 buildings , average cost: $110,0002000: 3 buildings , average cost: $133,3001999: 12 buildings , average cost: $60,4001998: 14 buildings , average cost: $54,0001997: 3 buildings , average cost: $66,700Unemployment in December 2023:
Most common occupations in Belleview, FL (%)
Both Males Females
Driver/sales workers and truck drivers (7.2%)
Material recording, scheduling, dispatching, and distributing workers (6.2%)
Other sales and related occupations, including supervisors (5.4%)
Cooks and food preparation workers (5.1%)
Information and record clerks, except customer service representatives (4.7%)
Other production occupations, including supervisors (3.8%)
Other material moving workers, except laborers (3.1%)
Driver/sales workers and truck drivers (13.9%)
Material recording, scheduling, dispatching, and distributing workers (6.2%)
Other material moving workers, except laborers (5.9%)
Cooks and food preparation workers (5.5%)
Supervisors, construction and extraction workers (5.4%)
Construction laborers (5.2%)
Other production occupations, including supervisors (4.9%)
Information and record clerks, except customer service representatives (9.9%)
Other sales and related occupations, including supervisors (8.5%)
Material recording, scheduling, dispatching, and distributing workers (6.1%)
Nursing, psychiatric, and home health aides (5.3%)
Customer service representatives (5.3%)
Secretaries and administrative assistants (5.2%)
Cooks and food preparation workers (4.7%)
Air pollution and air quality trends(lower is better)
AQI Ozone
Tornado activity:
Belleview-area historical tornado activity is slightly above Florida state average. It is 34% greater than the overall U.S. average.
On 12/31/1975, a category F3 (max. wind speeds 158-206 mph) tornado 7.1 miles away from the Belleview city center killed one person and injured 26 people and caused between $500,000 and $5,000,000 in damages.
On 2/2/2007, a category F3 tornado 12.6 miles away from the city center killed 8 people and injured 25 people and caused $114 million in damages.
Earthquake activity:
Belleview-area historical earthquake activity is significantly above Florida state average. It is 86% smaller than the overall U.S. average. On 9/10/2006 at 14:56:08, a magnitude 5.9 (5.9 MB, 5.5 MS, 5.8 MW, Class: Moderate, Intensity: VI - VII) earthquake occurred 341.1 miles away from the city center On 11/22/1974 at 05:25:55, a magnitude 4.7 (4.7 MB, Class: Light, Intensity: IV - V) earthquake occurred 288.6 miles away from Belleview center On 8/2/1974 at 08:52:09, a magnitude 4.9 (4.3 MB, 4.9 LG) earthquake occurred 333.7 miles away from the city center On 10/24/1997 at 08:35:17, a magnitude 4.9 (4.8 MB, 4.2 MS, 4.9 LG, Depth: 6.2 mi) earthquake occurred 343.2 miles away from Belleview center On 9/4/2016 at 18:29:29, a magnitude 3.8 (3.8 ML, Class: Light, Intensity: II - III) earthquake occurred 167.2 miles away from the city center On 9/21/2016 at 16:30:52, a magnitude 3.8 (3.8 ML) earthquake occurred 168.7 miles away from the city center Magnitude types: regional Lg-wave magnitude (LG), body-wave magnitude (MB), local magnitude (ML), surface-wave magnitude (MS), moment magnitude (MW) Natural disasters: The number of natural disasters in Marion County (18) is near the US average (15).Major Disasters (Presidential) Declared: 10Emergencies Declared: 4Hurricanes: 9, Fires: 4, Tropical Storms: 3, Tornadoes: 2, Flood: 1, Freeze: 1, Wind: 1, Other: 1 (Note: some incidents may be assigned to more than one category). Hospitals and medical centers in Belleview: 107TH PLACE GROUP HOME (5321 SE 107TH PLACE) HOME ADVANTAGE HEALTH CARE (5925 SE ABSHIER BLVD)
Other hospitals and medical centers near Belleview: INNOVATIVE SENIOR CARE HOME HEALTH (Home Health Center, about 8 miles away; OCALA, FL)
OCALA CLUSTER (Hospital, about 8 miles away; OCALA, FL)
OAKHURST CARE AND REHABILITATION CENTER (Nursing Home, about 8 miles away; OCALA, FL)
OCALA HEALTH AND REHABILITATION CENTER (Nursing Home, about 9 miles away; OCALA, FL)
OCALA REGIONAL KIDNEY CENTER EAST (Dialysis Facility, about 9 miles away; OCALA, FL)
MARION COMMUNITY HOME HEALTH CARE (Home Health Center, about 9 miles away; OCALA, FL)
HELPING HANDS HOME CARE INC (Home Health Center, about 9 miles away; OCALA, FL)
Amtrak stations near Belleview: 11 miles: OCALA (531 N.E. 1ST AVE.) Services: ticket office, partially wheelchair accessible, enclosed waiting area, public restrooms, public payphones, vending machines, free short-term parking, free long-term parking, call for taxi service, intercity bus service.
14 miles: WILDWOOD (601 N. MAIN ST.) Services: enclosed waiting area, public restrooms, public payphones, free short-term parking, free long-term parking, call for taxi service.
College/University in Belleview: Taylor College Full-time enrollment: 305; Location: 5190 SE 125th Street; Private, for-profit; Website: taylorcollege.edu)
Colleges/universities with over 2000 students nearest to Belleview:
Rasmussen College-Florida (about 11 miles; Ocala, FL ; Full-time enrollment: 5,736)
College of Central Florida (about 11 miles; Ocala, FL ; FT enrollment: 6,103)
Lake-Sumter State College (about 23 miles; Leesburg, FL ; FT enrollment: 2,983)
University of Florida (about 44 miles; Gainesville, FL ; FT enrollment: 43,357)
Stetson University (about 46 miles; DeLand, FL ; FT enrollment: 2,956)
Saint Johns River State College (about 47 miles; Palatka, FL ; FT enrollment: 4,698)
Santa Fe College (about 49 miles; Gainesville, FL ; FT enrollment: 11,819)
Public high school in Belleview:
Private high school in Belleview: SOULS HARBOR CHRISTIAN ACADEMY Students: 165, Location: 12650 SE COUNTY HIGHWAY 484, Grades: KG-12)
Public elementary/middle schools in Belleview:
Private elementary/middle school in Belleview: BELLEVIEW CHRISTIAN ACADEMY / LFCS Students: 156, Location: 6107 SE AGNEW RD, Grades: PK-8)
See full list of schools located in Belleview
Notable locations in Belleview: (A) , Town Center Plaza (B) , Belleview City Hall (C) , Marion County Fire Rescue Station 18 South Marion (D) , City of Belleview Water Reclamation Center (E) , Belleview Police Department (F) , Belleview Public Library (G) . Display/hide their locations on the map
Shopping Center: (1) . Display/hide its location on the map
Churches in Belleview include: (A) , Belleview First Assembly of God (B) , Saint Pauls Polish National Catholic Church (C) , Belleview United Methodist Church (D) , Episcopal Church of Saint Mary (E) , Belleview Church of God (F) . Display/hide their locations on the map
Lake: (A) . Display/hide its location on the map
Marion County has a predicted average indoor radon screening level between 2 and 4 pCi/L (pico curies per liter) - Moderate Potential Drinking water stations with addresses in Belleview and their reported violations in the past:
FORE OAKS ESTATES (Population served: 462, Groundwater):
Past health violations:
MCL, Monthly (TCR) - In AUG-2006, Contaminant: Coliform. Follow-up actions: St Violation/Reminder Notice (SEP-08-2006), St Public Notif received (SEP-25-2006), St Compliance achieved (OCT-10-2006)
Population served: 270, Groundwater):
Past monitoring violations:
Follow-up Or Routine LCR Tap M/R - In JUL-01-2007, Contaminant: Lead and Copper Rule
Follow-up Or Routine LCR Tap M/R - In JAN-01-2007, Contaminant: Lead and Copper Rule
Population served: 175, Groundwater):
Past monitoring violations:
Follow-up Or Routine LCR Tap M/R - In JAN-01-2006, Contaminant: Lead and Copper Rule
Population served: 25, Groundwater):
Past monitoring violations:
2 regular monitoring violations
Population served: 25, Groundwater):
Past monitoring violations:
One regular monitoring violation
Drinking water stations with addresses in Belleview that have no violations reported:
BELLEVIEW, CITY OF (2 WPS) (Population served: 8,453, Primary Water Source Type: Groundwater)
FLORIDA HEIGHTS S/D (Population served: 347, Primary Water Source Type: Groundwater)
BELLEVIEW OAKS ESTATES (Population served: 294, Primary Water Source Type: Groundwater)
FLOYD CLARK SUBDIVISION (Population served: 224, Primary Water Source Type: Groundwater)
COUNTRY WALK (Population served: 214, Primary Water Source Type: Groundwater)
ELEVEN OAKS SUBDIVISION (Population served: 126, Primary Water Source Type: Groundwater)
KNIGHTS OF COLUMBUS (Population served: 25, Primary Water Source Type: Groundwater)
MARKET OF MARION (Population served: 25, Primary Water Source Type: Groundwater)
SOUTHEAST MILK INC (Population served: 25, Primary Water Source Type: Groundwater)
MARIE'S FAMILY RESTAURANT (Population served: 25, Primary Water Source Type: Groundwater)
Average household size: This city:
2.3 peopleFlorida:
2.5 people
Percentage of family households: This city:
60.2%Whole state:
65.2%
Percentage of households with unmarried partners: This city:
9.0%Whole state:
7.3%
Likely homosexual households (counted as self-reported same-sex unmarried-partner households)
Lesbian couples: 0.5% of all households Gay men: 0.3% of all households
People in group quarters in Belleview in 2010:
13 people in group homes for juveniles (non-correctional)
6 people in group homes intended for adults
4 people in emergency and transitional shelters (with sleeping facilities) for people experiencing homelessness
people in other noninstitutional group quarters in 2000Banks with branches in Belleview (2011 data):
CenterState Bank of Florida, National Association: Central Florida State Bank Branch at 11800 Se U.S. Highway 441, branch established on 2002/05/24; Belleview Branch at 10990 U.S. Highway 441 Southeast, branch established on 1999/02/08. Info updated 2012/01/30: Bank assets: $2,082.6 mil, Deposits: $1,779.8 mil, headquarters in Winter Haven, FL, positive income , Commercial Lending Specialization, 65 total offices , Holding Company: Centerstate Banks, Inc.
Wells Fargo Bank, National Association: Belleview Branch at 5407 S.E. 111th Street, branch established on 1994/07/11. Info updated 2011/04/05: Bank assets: $1,161,490.0 mil, Deposits: $905,653.0 mil, headquarters in Sioux Falls, SD, positive income , 6395 total offices , Holding Company: Wells Fargo & Company
Regions Bank: Belleview Branch at 10715 S.E. Highway 441, branch established on 1924/01/01. Info updated 2011/02/24: Bank assets: $123,368.2 mil, Deposits: $98,301.3 mil, headquarters in Birmingham, AL, positive income , Commercial Lending Specialization, 1778 total offices , Holding Company: Regions Financial Corporation
Community Bank and Trust of Florida: Belleview Branch at 10131 S.E.u.s. Highway 441, branch established on 2000/11/30. Info updated 2006/11/03: Bank assets: $543.2 mil, Deposits: $475.2 mil, headquarters in Ocala, FL, positive income , 8 total offices , Holding Company: Florida Community Bankshares, Inc.
SunTrust Bank: Belleview Branch at 5760 State Road 484, branch established on 1979/03/12. Info updated 2010/05/27: Bank assets: $171,291.7 mil, Deposits: $129,833.2 mil, headquarters in Atlanta, GA, positive income , Commercial Lending Specialization, 1716 total offices , Holding Company: Suntrust Banks, Inc.
Bank of America, National Association: Belleview Branch at 5222 S.E. Abshier Boulevard, branch established on 1980/02/20. Info updated 2009/11/18: Bank assets: $1,451,969.3 mil, Deposits: $1,077,176.8 mil, headquarters in Charlotte, NC, positive income , 5782 total offices , Holding Company: Bank Of America Corporation
For population 15 years and over in Belleview:
Never married: 29.3%Now married: 43.4%Separated: 2.0%Widowed: 10.7%Divorced: 14.7% For population 25 years and over in Belleview:
High school or higher: 89.6%Bachelor's degree or higher: 24.4%Graduate or professional degree: 11.0%Unemployed: 8.8%Mean travel time to work (commute): 23.7 minutes
Education Gini index (Inequality in education) Here:
10.6Florida average:
12.2
Religion statistics for Belleview, FL (based on Marion County data)
Religion Adherents Congregations Evangelical Protestant 59,057 236 Catholic 31,957 11 Mainline Protestant 16,032 59 Other 4,456 27 Black Protestant 3,996 28 Orthodox 82 3 None 215,718 -
Source: Clifford Grammich, Kirk Hadaway, Richard Houseal, Dale E.Jones, Alexei Krindatch, Richie Stanley and Richard H.Taylor. 2012. 2010 U.S.Religion Census: Religious Congregations & Membership Study. Association of Statisticians of American Religious Bodies. Jones, Dale E., et al. 2002. Congregations and Membership in the United States 2000. Nashville, TN: Glenmary Research Center. Graphs represent county-level data
Food Environment Statistics: Number of grocery stores : 51This county :
1.57 / 10,000 pop.State :
2.04 / 10,000 pop.
Number of supercenters and club stores : 4This county :
0.12 / 10,000 pop.Florida :
0.11 / 10,000 pop.
Number of convenience stores (no gas) : 31Marion County :
0.96 / 10,000 pop.Florida :
1.28 / 10,000 pop.
Number of convenience stores (with gas) : 151Here :
4.66 / 10,000 pop.Florida :
3.04 / 10,000 pop.
Number of full-service restaurants : 152Marion County :
4.69 / 10,000 pop.Florida :
7.45 / 10,000 pop.
Adult diabetes rate : Marion County :
11.7%State :
9.2%
Adult obesity rate : Marion County :
25.0%Florida :
23.7%
Low-income preschool obesity rate : This county :
11.4%Florida :
14.0%
Health and Nutrition:
Average overall health of teeth and gums : Belleview:
49.3%Florida:
49.4%
Average BMI : Belleview:
28.5Florida:
28.6
People feeling badly about themselves : Belleview:
18.4%Florida:
19.5%
People not drinking alcohol at all : This city:
10.9%State:
10.7%
Average hours sleeping at night : Overweight people : Belleview:
35.2%Florida:
34.7%
General health condition : Average condition of hearing : Belleview:
76.3%Florida:
79.2%
More about Health and Nutrition of Belleview, FL Residents
Local government employment and payroll (March 2022)
Function
Full-time employees
Monthly full-time payroll
Average yearly full-time wage
Part-time employees
Monthly part-time payroll
Police Protection - Officers
15 $80,460 $64,368 0 $0 Financial Administration
10 $48,463 $58,156 0 $0 Other Government Administration
9 $49,847 $66,463 5 $1,232 Sewerage
6 $27,181 $54,362 0 $0 Water Supply
6 $27,181 $54,362 0 $0 Other and Unallocable
4 $19,950 $59,850 0 $0 Streets and Highways
4 $10,183 $30,549 0 $0 Police - Other
2 $7,376 $44,256 1 $285
Totals for Government
56 $270,641 $57,995 6 $1,516
Belleview government finances - Expenditure in 2017 (per resident):
Current Operations - Police Protection: $1,291,000 ($228.50)
Sewerage: $988,000 ($174.87)Financial Administration: $757,000 ($133.98)Central Staff Services: $519,000 ($91.86)Regular Highways: $376,000 ($66.55)Solid Waste Management: $297,000 ($52.57)General - Other: $157,000 ($27.79)Parks and Recreation: $121,000 ($21.42)Natural Resources - Other: $1,000 ($0.18)General - Interest on Debt: $42,000 ($7.43)
Other Capital Outlay - Parks and Recreation: $198,000 ($35.04)
General - Other: $66,000 ($11.68)Regular Highways: $49,000 ($8.67)Police Protection: $44,000 ($7.79)Water Utilities - Interest on Debt: $76,000 ($13.45)
Belleview government finances - Revenue in 2017 (per resident):
Charges - Solid Waste Management: $254,000 ($44.96)
Natural Resources - Other: $50,000 ($8.85)Other: $42,000 ($7.43)Parks and Recreation: $30,000 ($5.31)Miscellaneous Commercial Activities: $11,000 ($1.95)Federal Intergovernmental - Other: $12,000 ($2.12)
Local Intergovernmental - Other: $592,000 ($104.78)
Miscellaneous - Special Assessments: $207,000 ($36.64)
General Revenue - Other: $133,000 ($23.54)Fines and Forfeits: $79,000 ($13.98)Interest Earnings: $22,000 ($3.89)Revenue - Water Utilities: $2,506,000 ($443.54)
State Intergovernmental - Sewerage: $1,043,000 ($184.60)
General Local Government Support: $477,000 ($84.42)Other: $35,000 ($6.19)Tax - Property: $879,000 ($155.58)
Occupation and Business License - Other: $488,000 ($86.37)Public Utilities Sales: $335,000 ($59.29)Motor Fuels Sales: $304,000 ($53.81)Other License: $176,000 ($31.15)Insurance Premiums Sales: $40,000 ($7.08)
Belleview government finances - Debt in 2017 (per resident):
Long Term Debt - Outstanding Unspecified Public Purpose: $5,011,000 ($886.90)
Beginning Outstanding - Unspecified Public Purpose: $4,449,000 ($787.43)Issue, Unspecified Public Purpose: $1,500,000 ($265.49)Retired Unspecified Public Purpose: $851,000 ($150.62)
Belleview government finances - Cash and Securities in 2017 (per resident):
Other Funds - Cash and Securities: $8,030,000 ($1421.24)
10.03% of this county's 2021 resident taxpayers lived in other counties in 2020 ($59,847 average adjusted gross income )
Here:
10.03%Florida average:
8.80%
0.04% of residents moved from foreign countries ($190 average AGI )Marion County:
0.04%Florida average:
0.05%
Top counties from which taxpayers relocated into this county between 2020 and 2021:
6.78% of this county's 2020 resident taxpayers moved to other counties in 2021 ($46,379 average adjusted gross income )
Here:
6.78%Florida average:
7.45%
0.02% of residents moved to foreign countries ($131 average AGI )Marion County:
0.02%Florida average:
0.04%
Top counties to which taxpayers relocated from this county between 2020 and 2021:
Businesses in Belleview, FL
Name Count Name Count
Advance Auto Parts 1 MasterBrand Cabinets 4 AutoZone 1 McDonald's 1 Blockbuster 1 Pizza Hut 1 CVS 1 Publix Super Markets 1 Decora Cabinetry 1 Quiznos 1 Domino's Pizza 1 RadioShack 1 FedEx 3 Sears 1 GNC 1 Subway 2 H&R Block 1 T-Mobile 1 KFC 1 Taco Bell 1 Kmart 1 True Value 2 Lane Furniture 1 U-Haul 4 Little Caesars Pizza 1 UPS 3 Long John Silver's 1 Walgreens 1
Strongest AM radio stations in Belleview:
WCFI (1290 AM; 10 kW; OCALA, FL; Owner: VECTOR COMMUNICATIONS, INC.)
WFLF (540 AM; 50 kW; PINE HILLS, FL; Owner: CLEAR CHANNEL BROADCASTING LICENSES, INC.)
WQTM (740 AM; 50 kW; ORLANDO, FL; Owner: CLEAR CHANNEL BROADCASTING LICENSES, INC.)
WOCA (1370 AM; 5 kW; OCALA, FL; Owner: WESTSHORE BROADCASTING, INC.)
WRZN (720 AM; 10 kW; HERNANDO, FL; Owner: 6 JOHNSON ROAD LICENSES, INC.)
WDYZ (990 AM; 50 kW; ORLANDO, FL; Owner: ABC, INC.)
WQBQ (1410 AM; 10 kW; LEESBURG, FL)
WONQ (1030 AM; 45 kW; OVIEDO, FL; Owner: FLORIDA BROADCASTERS)
WLBE (790 AM; 5 kW; LEESBURG-EUSTIS, FL; Owner: WLBE 790, INC.)
WVLG (640 AM; 1 kW; WILDWOOD, FL; Owner: SENIOR BROADCASTING CORPORATION)
WOKV (690 AM; 50 kW; JACKSONVILLE, FL; Owner: COX RADIO, INC.)
WQYK (1010 AM; 50 kW; SEFFNER, FL; Owner: INFINITY BROADCASTING CORPORATION OF TAMPA)
WIXC (1060 AM; 50 kW; TITUSVILLE, FL; Owner: GENESIS COMMUNICATIONS I, INC.)
Strongest FM radio stations in Belleview:
WMFQ (92.9 FM; OCALA, FL; Owner: ASTERISK COMMUNICATIONS, INC)
WOGK (93.7 FM; OCALA, FL; Owner: OCALA BROADCASTING, L.L.C.)
WWKO (91.3 FM; BELLEVIEW, FL; Owner: WALKER INFORMATION & ED INSTITUTE INC)
W244BC (96.7 FM; OCALA, FL; Owner: RADIO TRAINING NETWORK, INC)
WHIJ (88.1 FM; OCALA, FL; Owner: RADIO TRAINING NETWORK, INC.)
WCFB (94.5 FM; DAYTONA BEACH, FL; Owner: COX RADIO, INC.)
WKSG (89.5 FM; CEDAR CREEK, FL; Owner: DAYSTAR PUBLIC RADIO, INC.)
WXXL (106.7 FM; TAVARES, FL; Owner: AMFM RADIO LICENSES, L.L.C.)
WOCL (105.9 FM; DELAND, FL; Owner: INFINITY RADIO OPERATIONS INC.)
WMGF (107.7 FM; MOUNT DORA, FL; Owner: CLEAR CHANNEL BROADCASTING LICENSES, INC.)
WKTK (98.5 FM; CRYSTAL RIVER, FL; Owner: ENTERCOM GAINESVILLE LICENSE, LLC)
WNDD (95.5 FM; SILVER SPRINGS, FL; Owner: OCALA B/CASTING CORP., L.L.C.)
WJHM (101.9 FM; DAYTONA BEACH, FL; Owner: INFINITY RADIO OPERATIONS INC.)
W212BF (90.3 FM; LEESBURG, FL; Owner: CTRAL FLORIDA EDUCATIONAL FOUNDATION)
WSKY-FM (97.3 FM; MICANOPY, FL; Owner: ENTERCOM GAINESVILLE LICENSE, LLC)
W257BD (99.3 FM; OCALA, FL; Owner: BIBLE BROADCASTING NETWORK, INC)
WTRS (102.3 FM; DUNNELLON, FL; Owner: ASTERISK COMMUNICATIONS, INC.)
WXCV (95.3 FM; HOMOSASSA SPRINGS, FL; Owner: WXOF, INC.)
WAQV (90.9 FM; CRYSTAL RIVER, FL; Owner: RADIO TRAINING NETWORK, INC.)
TV broadcast stations around Belleview:
WESH (Channel 2; DAYTONA BEACH, FL; Owner: ORLANDO HEARST-ARGYLE TELEVISION, INC.)
W07BP (Channel 7; OCALA, FL; Owner: THE SCH. BD. OF MARION CTY., FLORIDA)
WOGX (Channel 51; OCALA, FL; Owner: FOX TELEVISION STATIONS, INC.)
WZXZ-CA (Channel 11; ORLANDO, ETC., FL; Owner: THE BOX WORLDWIDE LLC)
WXXU-LP (Channel 12; ALTAMONTE SPRINGS, FL; Owner: RAMA COMMUNICATIONS)
WVEN-TV (Channel 26; DAYTONA BEACH, FL; Owner: ENTRAVISION HOLDINGS, LLC)
WCEU (Channel 15; NEW SMYRNA BEACH, FL; Owner: DAYTONA BEACH COMMUNITY COLLEGE)
WCJB-TV (Channel 20; GAINESVILLE, FL; Owner: DIVERSIFIED BROADCASTING, INC.)
W61AK (Channel 61; INVERNESS, FL; Owner: VIACOM INTERNATIONAL INC.)
National Bridge Inventory (NBI) Statistics 5 Number of bridges49ft / 14.8m Total length39,800 Total average daily traffic3,498 Total average daily truck traffic69,051 Total future (year 2042) average daily traffic
FCC Registered Cell Phone Towers: 2 (
See the full list of FCC Registered Cell Phone Towers in Belleview )
FCC Registered Antenna Towers: 87 (
See the full list of FCC Registered Antenna Towers )
FCC Registered Broadcast Land Mobile Towers: 7
5343 Se Abshier Blvd (Lat: 29.061639 Lon: -82.063417), Call Sign: KNCS218, Licensee ID: L00433699, Assigned Frequencies: 154.995 MHz, Grant Date: 11/09/2011, Expiration Date: 01/21/2022, Cancellation Date: 03/26/2022, Registrant: City Of Belleview, 5343 Se Abshier Blvd, Belleview, FL 32620, Phone: (904) 245-7044 .9 Mi E Sr 25a .4 Mi S Jcksn St (Lat: 29.048583 Lon: -82.010639), Call Sign: KNBH372, Assigned Frequencies: 462.175 MHz, Grant Date: 08/29/1996, Expiration Date: 09/11/2001, Cancellation Date: 02/10/2002, Registrant: Ring Power Corp, North Hwy 441, Ocala, FL 32670, Phone: (904) 737-7730 14545 Se 36 Ave (Lat: 29.010806 Lon: -82.085917), Type: Tower, Structure height: 82 m, Overall height: 85 m, Call Sign: WPCY410, Assigned Frequencies: 37.4800 MHz, 37.7800 MHz, Grant Date: 09/27/2013, Expiration Date: 10/01/2023, Cancellation Date: 12/02/2023, Certifier: R Dean Sever, Registrant: Federal Licensing Inc, 1588 Fairfield Road, Gettysburg, PA 17325, Phone: (717) 334-9262, Fax: (717) 334-6440, Email:
TRI-001, 11845 Del Webb Blvd (Lat: 29.050000 Lon: -81.999722), Type: Tower, Structure height: 6.1 m, Call Sign: WQMF234, Assigned Frequencies: 218.450 MHz, Grant Date: 04/30/2020, Expiration Date: 07/22/2030, Certifier: Flip Mellinger, Registrant: Data Flow Systems, Inc., 605 N. John Rodes Blvd., Melbourne, FL 32940, Phone: (321) 259-5009, Fax: (321) 259-4006, Email:
BELLEVIEW WATER TOWE, 0.1 Mile Off 110th Pl, City Of Belleview Water Tower (Lat: 29.061389 Lon: -82.055556), Type: Tank, Structure height: 38.1 m, Call Sign: WREY646, Assigned Frequencies: 774.631 MHz, 774.381 MHz, 773.881 MHz, 773.631 MHz, 773.231 MHz, 772.981 MHz, Grant Date: 01/03/2020, Expiration Date: 01/03/2030, Certifier: Alphonso Gordon, Registrant: Marion County Board Of County Commissioners Public Safety Communicatio, 2631 Se 3rd Street, Ocala, FL 34471, Phone: (352) 816-0851, Email:
AdventHealth Bellevi, 6006 Se Abshier Boulevard (Lat: 29.058333 Lon: -82.050833), Type: Building, Structure height: 9 m, Call Sign: WRNC604, Assigned Frequencies: 462.850 MHz, Grant Date: 07/14/2021, Expiration Date: 07/14/2031, Certifier: Robert Branch, Registrant: Visiplex, 1287 Barclay Boulevard, Buffalo Grove, IL 60089, Phone: (847) 229-0250, Email:
BELLEVIEW INTERMEDIA, 320ft Nw Of Se Robinson Rd And Rr Xing (Lat: 29.063722 Lon: -82.050500), Type: Mast, Structure height: 18.3 m, Overall height: 21.3 m, Call Sign: WRVV586, Assigned Frequencies: 160.920 MHz, 161.100 MHz, 160.785 MHz, 160.500 MHz, 161.085 MHz, Grant Date: 01/10/2023, Expiration Date: 01/10/2033, Certifier: Alejandro Madariaga, Registrant: Csx Transportation, 6735 Southpoint Dr South Suite 400, Jacksonville, FL 32216, Phone: (904) 279-6938, Fax: (904) 490-3093, Email:
FCC Registered Microwave Towers: 5 (
See the full list of FCC Registered Microwave Towers in this town )
FCC Registered Paging Towers: 3 (
See the full list of FCC Registered Paging Towers )
FCC Registered Amateur Radio Licenses: 92 (
See the full list of FCC Registered Amateur Radio Licenses in Belleview )
FAA Registered Aircraft Manufacturers and Dealers: 1 (
See the full list of FAA Registered Manufacturers and Dealers in Belleview )
FAA Registered Aircraft: 32 (
See the full list of FAA Registered Aircraft )
Home Mortgage Disclosure Act Aggregated Statistics For Year 2009(Based on 1 partial tract) A) FHA, FSA/RHS & VA B) Conventional C) Refinancings Number Average Value Number Average Value Number Average Value
LOANS ORIGINATED 1 $75,760 1 $76,350 2 $191,870 APPLICATIONS APPROVED, NOT ACCEPTED 0 $0 0 $0 0 $0 APPLICATIONS DENIED 1 $83,140 0 $0 2 $172,430 APPLICATIONS WITHDRAWN 0 $0 0 $0 1 $148,950 FILES CLOSED FOR INCOMPLETENESS 0 $0 0 $0 0 $0
Aggregated Statistics For Year 2008(Based on 1 partial tract) A) FHA, FSA/RHS & VA B) Conventional C) Refinancings D) Home Improvement Loans F) Non-occupant Loans on Number Average Value Number Average Value Number Average Value Number Average Value Number Average Value
LOANS ORIGINATED 1 $163,710 2 $147,545 4 $168,128 0 $0 2 $118,390 APPLICATIONS APPROVED, NOT ACCEPTED 0 $0 0 $0 1 $101,880 0 $0 0 $0 APPLICATIONS DENIED 1 $104,100 1 $187,010 4 $149,478 1 $75,530 0 $0 APPLICATIONS WITHDRAWN 0 $0 0 $0 1 $161,480 0 $0 0 $0 FILES CLOSED FOR INCOMPLETENESS 0 $0 0 $0 0 $0 0 $0 0 $0
Aggregated Statistics For Year 2007(Based on 1 partial tract) B) Conventional C) Refinancings D) Home Improvement Loans F) Non-occupant Loans on G) Loans On Manufactured Number Average Value Number Average Value Number Average Value Number Average Value Number Average Value
LOANS ORIGINATED 5 $131,292 6 $115,227 1 $67,570 2 $91,340 1 $40,870 APPLICATIONS APPROVED, NOT ACCEPTED 2 $147,605 1 $183,610 0 $0 1 $80,330 0 $0 APPLICATIONS DENIED 5 $133,002 5 $125,040 0 $0 1 $143,450 0 $0 APPLICATIONS WITHDRAWN 1 $165,930 3 $132,557 0 $0 0 $0 0 $0 FILES CLOSED FOR INCOMPLETENESS 1 $121,550 1 $118,040 0 $0 0 $0 0 $0
Aggregated Statistics For Year 2006(Based on 1 partial tract) B) Conventional C) Refinancings D) Home Improvement Loans F) Non-occupant Loans on G) Loans On Manufactured Number Average Value Number Average Value Number Average Value Number Average Value Number Average Value
LOANS ORIGINATED 14 $131,679 9 $121,914 1 $87,470 8 $118,535 0 $0 APPLICATIONS APPROVED, NOT ACCEPTED 2 $112,535 2 $99,770 0 $0 0 $0 0 $0 APPLICATIONS DENIED 5 $138,388 4 $134,695 1 $34,080 1 $84,660 1 $45,320 APPLICATIONS WITHDRAWN 1 $161,950 4 $122,985 0 $0 1 $121,550 0 $0 FILES CLOSED FOR INCOMPLETENESS 0 $0 1 $169,210 0 $0 0 $0 0 $0
Aggregated Statistics For Year 2005(Based on 1 partial tract) A) FHA, FSA/RHS & VA B) Conventional C) Refinancings D) Home Improvement Loans F) Non-occupant Loans on G) Loans On Manufactured Number Average Value Number Average Value Number Average Value Number Average Value Number Average Value Number Average Value
LOANS ORIGINATED 2 $99,595 13 $95,283 8 $105,170 1 $86,890 3 $131,033 1 $42,980 APPLICATIONS APPROVED, NOT ACCEPTED 0 $0 1 $130,450 3 $89,463 0 $0 1 $57,850 1 $60,310 APPLICATIONS DENIED 0 $0 3 $88,527 6 $99,242 1 $60,070 1 $95,200 1 $56,440 APPLICATIONS WITHDRAWN 0 $0 1 $143,100 5 $125,836 1 $53,980 0 $0 1 $55,620 FILES CLOSED FOR INCOMPLETENESS 0 $0 1 $52,930 1 $71,900 0 $0 0 $0 0 $0
Aggregated Statistics For Year 2004(Based on 1 partial tract) A) FHA, FSA/RHS & VA B) Conventional C) Refinancings D) Home Improvement Loans F) Non-occupant Loans on G) Loans On Manufactured Number Average Value Number Average Value Number Average Value Number Average Value Number Average Value Number Average Value
LOANS ORIGINATED 2 $92,275 9 $109,398 5 $91,338 1 $27,750 2 $126,470 0 $0 APPLICATIONS APPROVED, NOT ACCEPTED 0 $0 0 $0 2 $78,280 0 $0 0 $0 0 $0 APPLICATIONS DENIED 0 $0 1 $141,810 5 $105,764 1 $8,430 0 $0 1 $28,220 APPLICATIONS WITHDRAWN 0 $0 1 $115,340 3 $77,247 0 $0 0 $0 0 $0 FILES CLOSED FOR INCOMPLETENESS 0 $0 0 $0 0 $0 0 $0 0 $0 0 $0
Aggregated Statistics For Year 2003(Based on 1 partial tract) A) FHA, FSA/RHS & VA B) Conventional C) Refinancings D) Home Improvement Loans F) Non-occupant Loans on Number Average Value Number Average Value Number Average Value Number Average Value Number Average Value
LOANS ORIGINATED 1 $69,790 7 $68,854 12 $83,892 1 $29,980 2 $74,415 APPLICATIONS APPROVED, NOT ACCEPTED 0 $0 0 $0 2 $76,055 0 $0 0 $0 APPLICATIONS DENIED 0 $0 3 $71,040 4 $64,317 1 $17,920 0 $0 APPLICATIONS WITHDRAWN 0 $0 0 $0 4 $78,780 0 $0 0 $0 FILES CLOSED FOR INCOMPLETENESS 0 $0 0 $0 1 $58,900 0 $0 0 $0
Aggregated Statistics For Year 2002(Based on 1 partial tract) A) FHA, FSA/RHS & VA B) Conventional C) Refinancings D) Home Improvement Loans F) Non-occupant Loans on Number Average Value Number Average Value Number Average Value Number Average Value Number Average Value
LOANS ORIGINATED 1 $53,750 5 $82,720 8 $67,962 1 $15,810 2 $67,275 APPLICATIONS APPROVED, NOT ACCEPTED 0 $0 1 $68,620 2 $51,815 0 $0 0 $0 APPLICATIONS DENIED 0 $0 1 $46,720 7 $59,403 1 $30,680 0 $0 APPLICATIONS WITHDRAWN 0 $0 0 $0 3 $72,720 0 $0 0 $0 FILES CLOSED FOR INCOMPLETENESS 0 $0 0 $0 1 $45,430 0 $0 0 $0
Aggregated Statistics For Year 2001(Based on 1 partial tract) A) FHA, FSA/RHS & VA B) Conventional C) Refinancings D) Home Improvement Loans F) Non-occupant Loans on Number Average Value Number Average Value Number Average Value Number Average Value Number Average Value
LOANS ORIGINATED 1 $88,880 6 $64,190 7 $63,803 1 $7,490 1 $62,180 APPLICATIONS APPROVED, NOT ACCEPTED 0 $0 0 $0 1 $47,190 0 $0 0 $0 APPLICATIONS DENIED 0 $0 2 $55,680 5 $71,830 1 $18,150 0 $0 APPLICATIONS WITHDRAWN 0 $0 0 $0 3 $61,557 0 $0 0 $0 FILES CLOSED FOR INCOMPLETENESS 0 $0 0 $0 1 $28,100 0 $0 0 $0
Aggregated Statistics For Year 2000(Based on 1 partial tract) A) FHA, FSA/RHS & VA B) Conventional C) Refinancings D) Home Improvement Loans F) Non-occupant Loans on Number Average Value Number Average Value Number Average Value Number Average Value Number Average Value
LOANS ORIGINATED 1 $94,150 4 $52,752 3 $36,107 1 $8,670 1 $30,450 APPLICATIONS APPROVED, NOT ACCEPTED 0 $0 1 $64,640 1 $72,130 0 $0 0 $0 APPLICATIONS DENIED 0 $0 4 $53,778 3 $46,060 1 $9,840 0 $0 APPLICATIONS WITHDRAWN 0 $0 1 $42,390 1 $72,950 0 $0 0 $0 FILES CLOSED FOR INCOMPLETENESS 0 $0 0 $0 1 $43,440 0 $0 0 $0
Aggregated Statistics For Year 1999(Based on 1 partial tract) A) FHA, FSA/RHS & VA B) Conventional C) Refinancings D) Home Improvement Loans F) Non-occupant Loans on Number Average Value Number Average Value Number Average Value Number Average Value Number Average Value
LOANS ORIGINATED 1 $90,400 4 $62,178 5 $52,838 1 $30,510 1 $40,000 APPLICATIONS APPROVED, NOT ACCEPTED 0 $0 1 $38,760 2 $46,895 1 $13,000 0 $0 APPLICATIONS DENIED 0 $0 2 $47,290 4 $52,460 1 $23,500 0 $0 APPLICATIONS WITHDRAWN 0 $0 0 $0 2 $59,945 0 $0 0 $0 FILES CLOSED FOR INCOMPLETENESS 0 $0 0 $0 1 $69,830 0 $0 0 $0
Detailed HMDA statistics for the following Tracts:
0011.02
Private Mortgage Insurance Companies Aggregated Statistics For Year 2008(Based on 1 partial tract) A) Conventional Number Average Value
LOANS ORIGINATED 1 $78,110 APPLICATIONS APPROVED, NOT ACCEPTED 0 $0 APPLICATIONS DENIED 0 $0 APPLICATIONS WITHDRAWN 0 $0 FILES CLOSED FOR INCOMPLETENESS 0 $0
Aggregated Statistics For Year 2007(Based on 1 partial tract) A) Conventional B) Refinancings Number Average Value Number Average Value
LOANS ORIGINATED 1 $167,220 1 $139,350 APPLICATIONS APPROVED, NOT ACCEPTED 0 $0 0 $0 APPLICATIONS DENIED 0 $0 0 $0 APPLICATIONS WITHDRAWN 0 $0 0 $0 FILES CLOSED FOR INCOMPLETENESS 0 $0 0 $0
Aggregated Statistics For Year 2006(Based on 1 partial tract) A) Conventional Number Average Value
LOANS ORIGINATED 2 $125,765 APPLICATIONS APPROVED, NOT ACCEPTED 0 $0 APPLICATIONS DENIED 0 $0 APPLICATIONS WITHDRAWN 0 $0 FILES CLOSED FOR INCOMPLETENESS 0 $0
Aggregated Statistics For Year 2005(Based on 1 partial tract) A) Conventional C) Non-occupant Loans on Number Average Value Number Average Value
LOANS ORIGINATED 1 $177,760 1 $83,840 APPLICATIONS APPROVED, NOT ACCEPTED 0 $0 0 $0 APPLICATIONS DENIED 0 $0 0 $0 APPLICATIONS WITHDRAWN 0 $0 0 $0 FILES CLOSED FOR INCOMPLETENESS 0 $0 0 $0
Aggregated Statistics For Year 2004(Based on 1 partial tract) A) Conventional B) Refinancings C) Non-occupant Loans on Number Average Value Number Average Value Number Average Value
LOANS ORIGINATED 2 $85,425 1 $71,550 1 $41,340 APPLICATIONS APPROVED, NOT ACCEPTED 0 $0 0 $0 0 $0 APPLICATIONS DENIED 0 $0 0 $0 0 $0 APPLICATIONS WITHDRAWN 0 $0 0 $0 0 $0 FILES CLOSED FOR INCOMPLETENESS 0 $0 0 $0 0 $0
Aggregated Statistics For Year 2003(Based on 1 partial tract) A) Conventional B) Refinancings Number Average Value Number Average Value
LOANS ORIGINATED 1 $117,570 1 $124,240 APPLICATIONS APPROVED, NOT ACCEPTED 0 $0 0 $0 APPLICATIONS DENIED 0 $0 0 $0 APPLICATIONS WITHDRAWN 0 $0 0 $0 FILES CLOSED FOR INCOMPLETENESS 0 $0 0 $0
Aggregated Statistics For Year 2002(Based on 1 partial tract) A) Conventional Number Average Value
LOANS ORIGINATED 2 $81,560 APPLICATIONS APPROVED, NOT ACCEPTED 0 $0 APPLICATIONS DENIED 0 $0 APPLICATIONS WITHDRAWN 0 $0 FILES CLOSED FOR INCOMPLETENESS 0 $0
Aggregated Statistics For Year 2001(Based on 1 partial tract) A) Conventional B) Refinancings Number Average Value Number Average Value
LOANS ORIGINATED 2 $86,535 1 $64,410 APPLICATIONS APPROVED, NOT ACCEPTED 0 $0 0 $0 APPLICATIONS DENIED 0 $0 0 $0 APPLICATIONS WITHDRAWN 0 $0 0 $0 FILES CLOSED FOR INCOMPLETENESS 0 $0 0 $0
Aggregated Statistics For Year 2000(Based on 1 partial tract) A) Conventional Number Average Value
LOANS ORIGINATED 1 $47,780 APPLICATIONS APPROVED, NOT ACCEPTED 0 $0 APPLICATIONS DENIED 0 $0 APPLICATIONS WITHDRAWN 0 $0 FILES CLOSED FOR INCOMPLETENESS 0 $0
Aggregated Statistics For Year 1999(Based on 1 partial tract) A) Conventional Number Average Value
LOANS ORIGINATED 1 $56,050 APPLICATIONS APPROVED, NOT ACCEPTED 0 $0 APPLICATIONS DENIED 0 $0 APPLICATIONS WITHDRAWN 0 $0 FILES CLOSED FOR INCOMPLETENESS 0 $0
Detailed PMIC statistics for the following Tracts:
0011.02
Most common first names in Belleview, FL among deceased individuals Name Count Lived (average)
John 71 75.7 years Robert 68 72.4 years William 64 74.2 years James 63 71.6 years Mary 52 81.9 years Dorothy 41 79.0 years Charles 38 74.7 years Joseph 37 77.4 years Helen 34 79.5 years Richard 34 71.2 years
Most common last names in Belleview, FL among deceased individuals Last name Count Lived (average)
Smith 42 76.6 years Davis 21 71.7 years Williams 19 77.8 years Johnson 19 77.2 years Jones 18 80.6 years Brown 16 79.9 years Miller 16 76.9 years Hall 10 74.1 years Thompson 10 70.7 years Wilson 10 75.3 years
Belleview compared to Florida state average:
Median house value below state average. Black race population percentage significantly below state average. Foreign-born population percentage significantly below state average. Length of stay since moving in significantly above state average.
Top Patent Applicants
Steven Colquitt (2)
Leroy C. Stephens (1)
Roman Radon (1)
Peter M. Field (1)
Vincent Peter Biel (1)
Edward Alyn Long (1)
Dwayne Cyr (1)
Vincent P. Biel (1)
Total of 9 patent applications in 2008-2024.


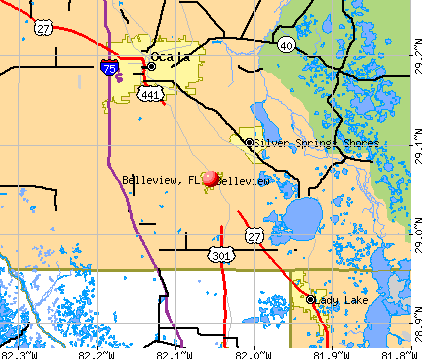


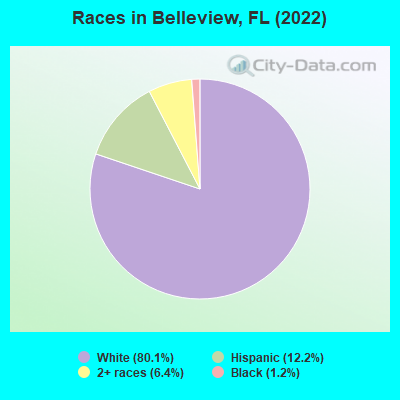
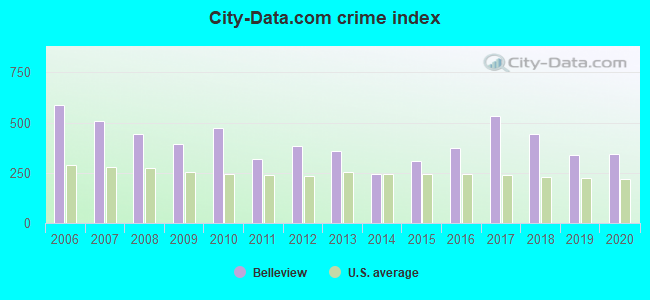
 Recent articles from our blog. Our writers, many of them Ph.D. graduates or candidates, create easy-to-read articles on a wide variety of topics.

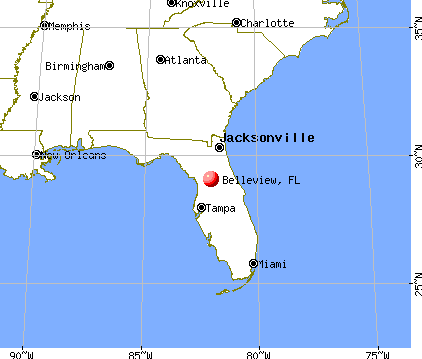
 (45.1 miles
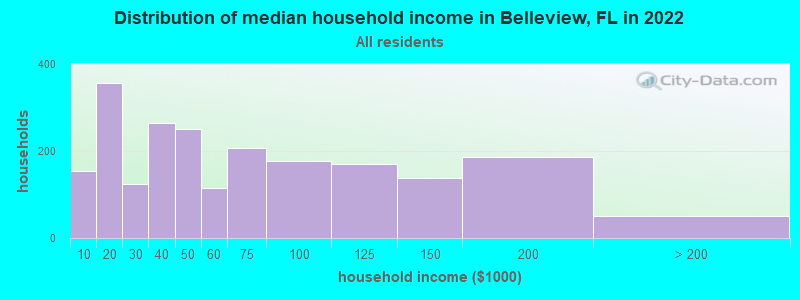
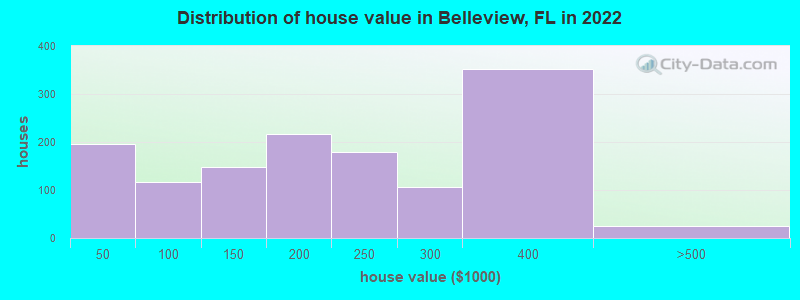
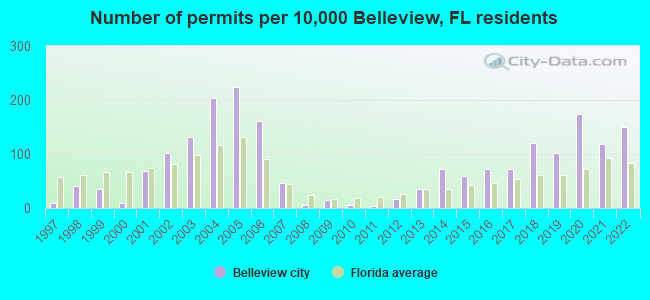
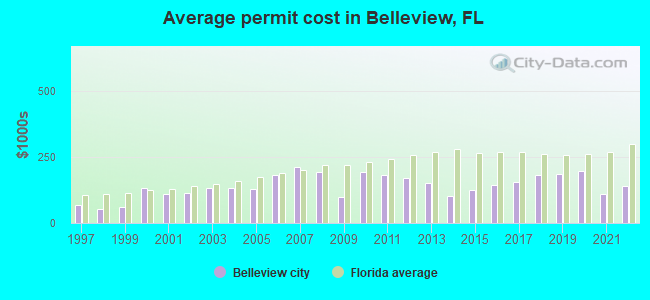
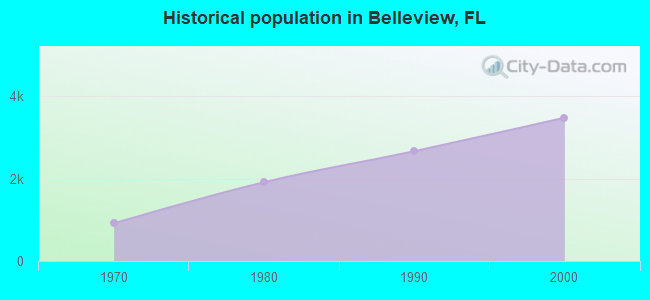
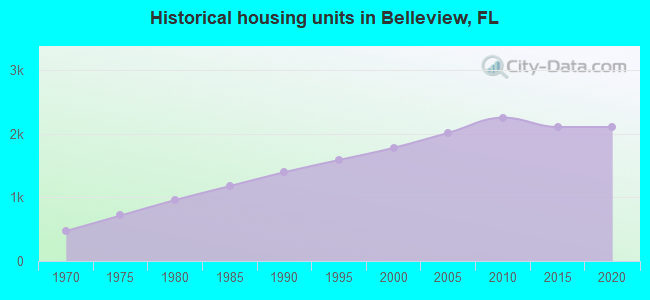
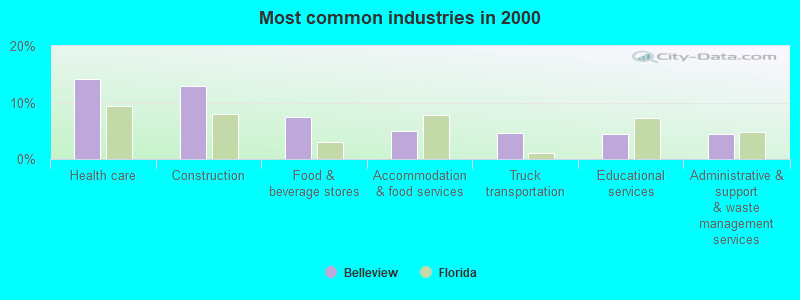
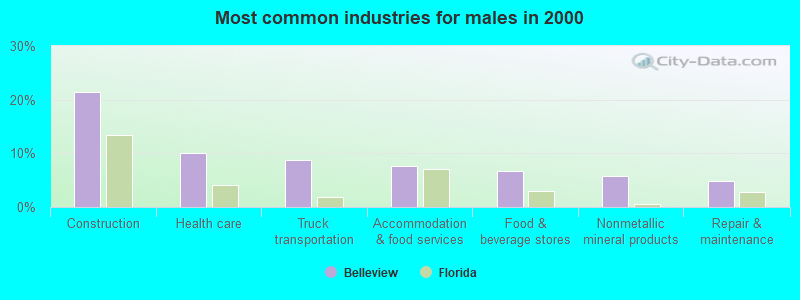
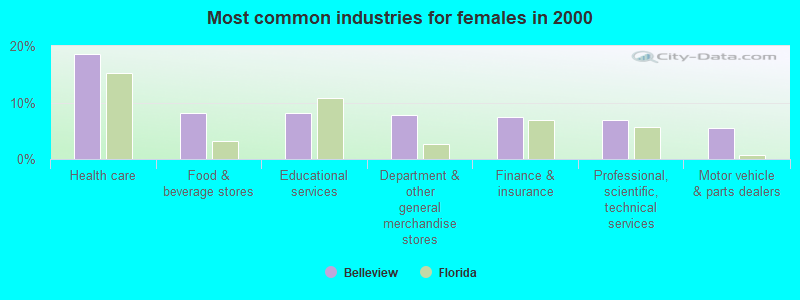
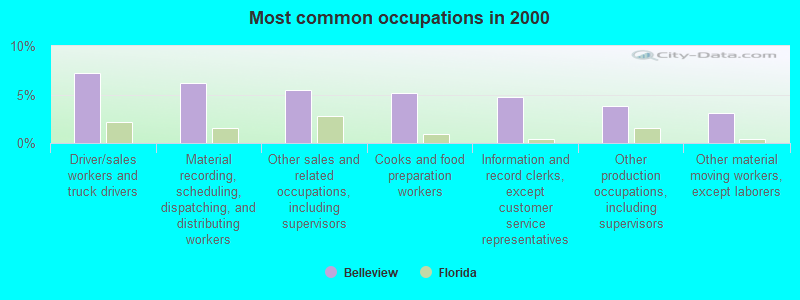
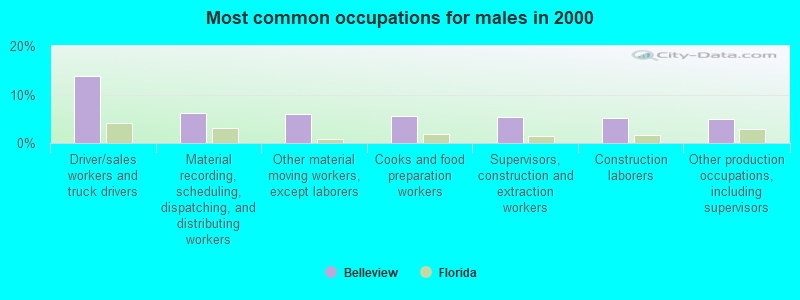
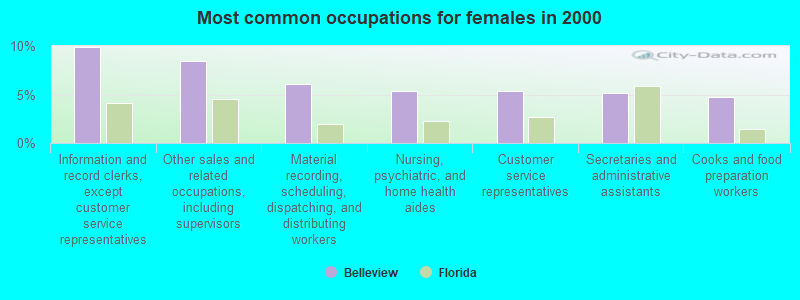
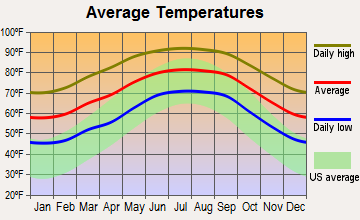
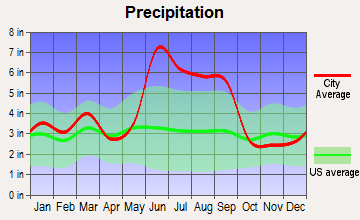
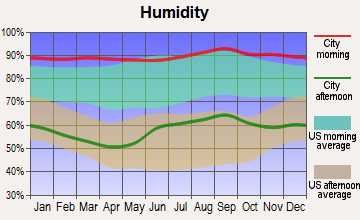
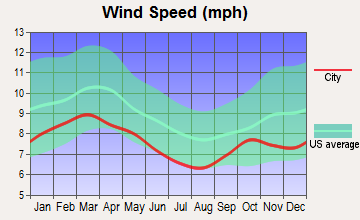
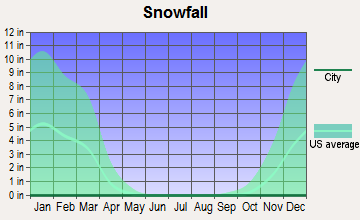
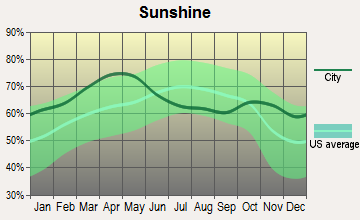
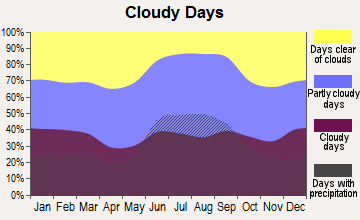


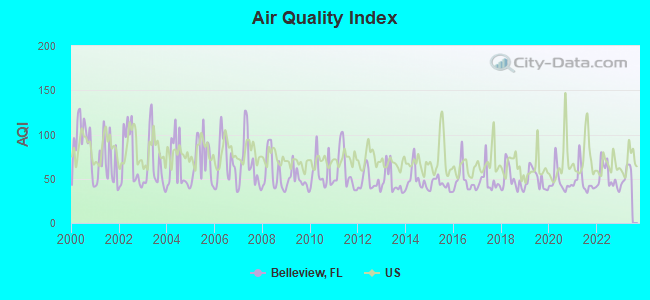
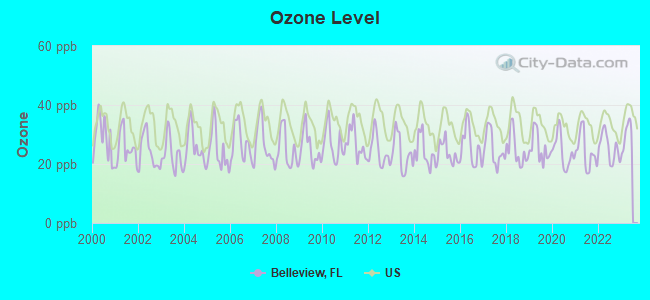
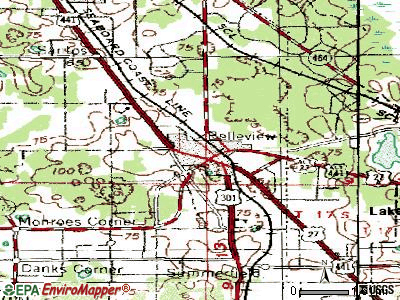
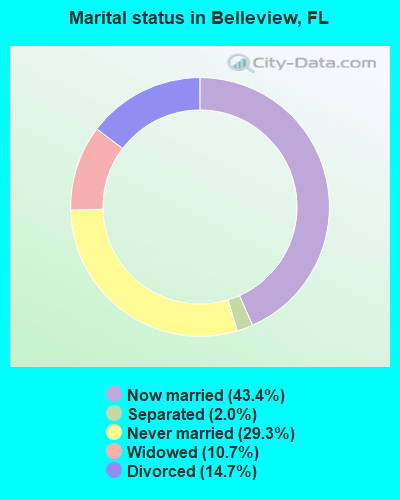
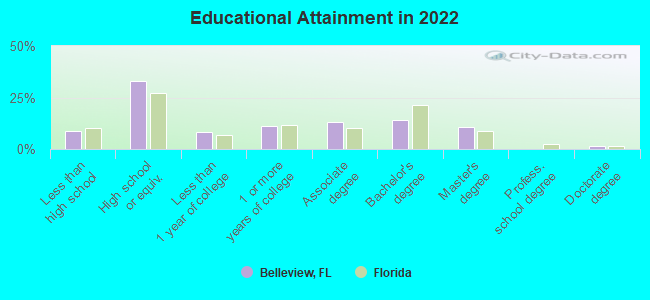
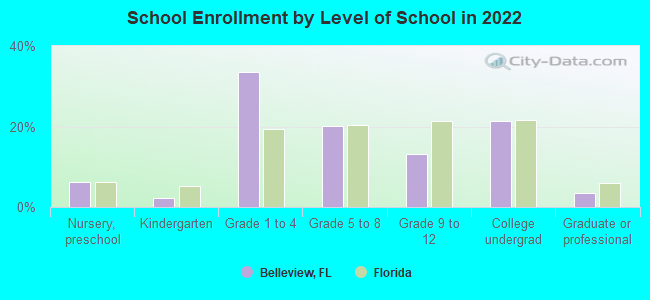
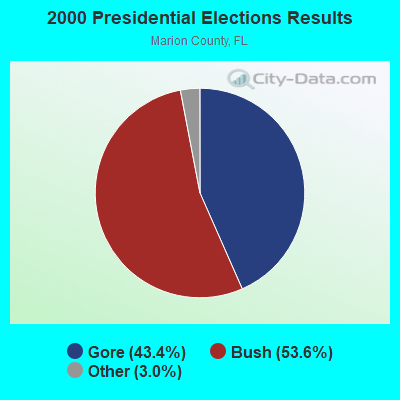
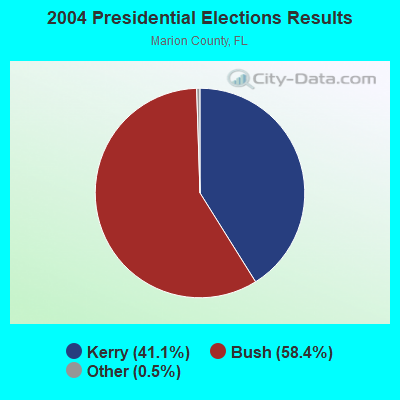
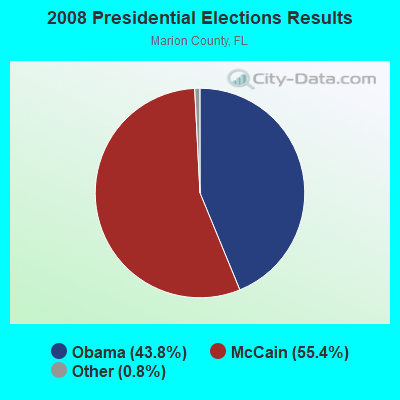
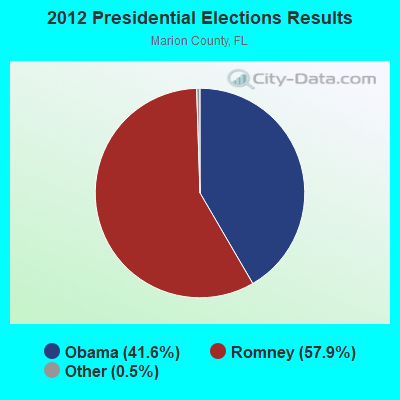
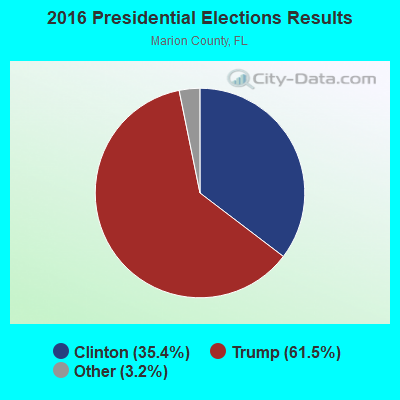
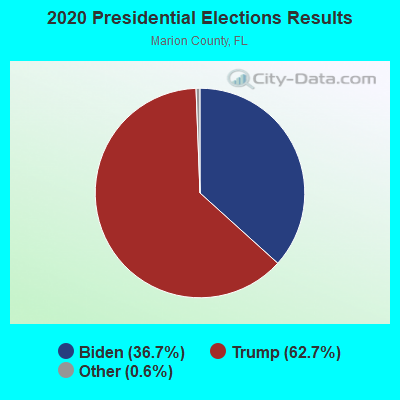
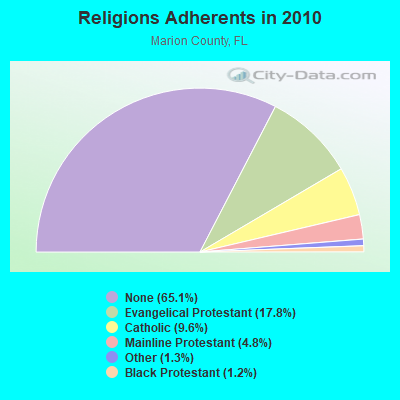
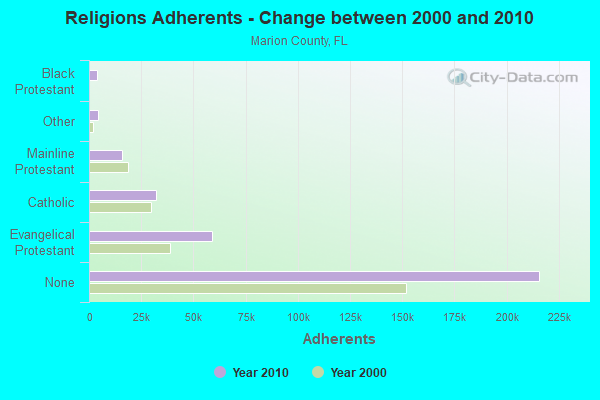
 According to the data from the years 2005 - 2018 the average number of fire incidents per year is 79. The highest number of fire incidents - 185 took place in 2006, and the least - 35 in 2014. The data has a growing trend.
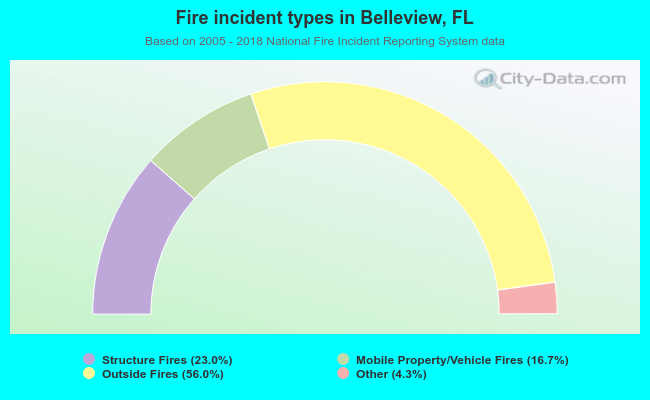 When looking into fire subcategories, the most reports belonged to: Outside Fires (56.0%), and Structure Fires (23.0%).