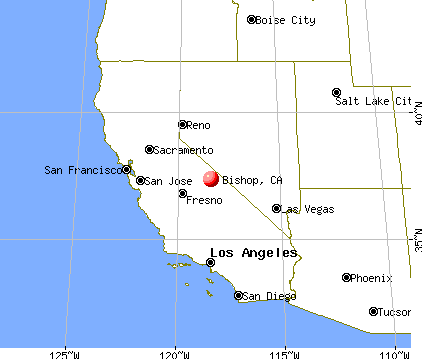
Bishop, California
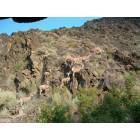
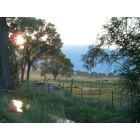
Bishop: BH Sheep near Bishop
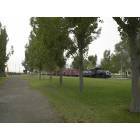
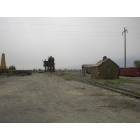
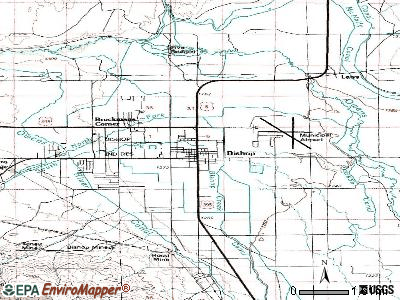
Bishop: Laws Museum, just outside of Bishop
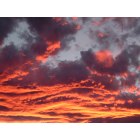
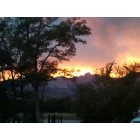
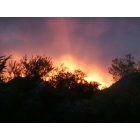
Bishop: The Sierra Sunset in Bishop, California
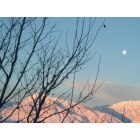
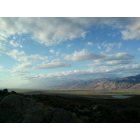
Bishop: From the Whites looking to the Sierra's
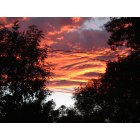
Bishop: Beautiful sunset, Bishop, california
Bishop: Bishop California
Bishop: Big Pine California

Bishop: Big Pine California
Bishop: Bishop California
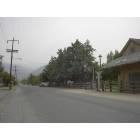
Bishop: Country road in Bishop, california
Bishop: Laws Museum, just outside of Bishop
Bishop: Laws Museum, just outside of Bishop
- add
your
Submit your own pictures of this city and show them to the world
- OSM Map
- General Map
- Google Map
- MSN Map
Population change since 2000: +5.5%
 |
| Males: 1,546 | |
| Females: 2,225 |
| Median resident age: | 49.4 years |
| California median age: | 37.9 years |
Zip codes: 93514.
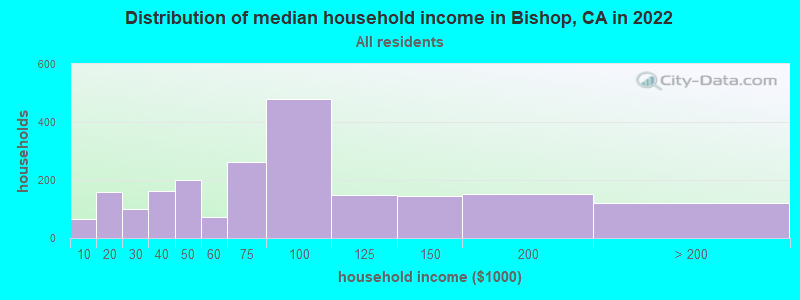
| Bishop: | $75,160 |
| CA: | $91,551 |
Estimated per capita income in 2022: $48,169 (it was $17,660 in 2000)
Bishop city income, earnings, and wages data
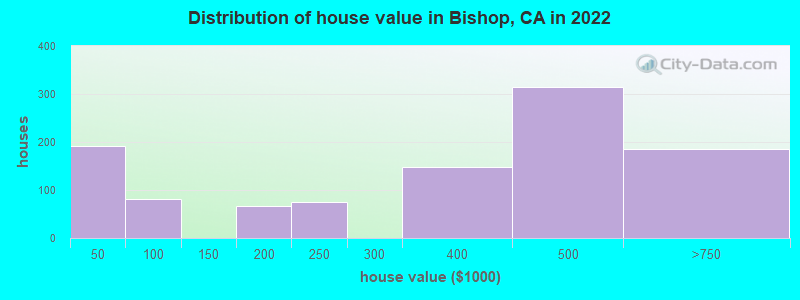
Estimated median house or condo value in 2022: $420,441 (it was $119,100 in 2000)
| Bishop: | $420,441 |
| CA: | $715,900 |
Median gross rent in 2022: $1,304.
(7.5% for White Non-Hispanic residents, 5.1% for Hispanic or Latino residents, 6.7% for two or more races residents)
Detailed information about poverty and poor residents in Bishop, CA


Compare current foreclosures near Bishop, CA:
| Photo | Address | Area | Beds / Baths | Price | Details |
|---|---|---|---|---|---|

|
#1
Bar M Ln
Bishop, CA 93514
|
2,039 sq. feet
|
3 baths 3 beds |
show details | |

|
#2
Locust St
Bishop, CA 93514
|
1,620 sq. feet
|
2 baths 3 beds |
show details | |

|
#3
Bar M Ln
Bishop, CA 93514
|
- sq. feet
|
3 baths 3 beds |
show details | |

|
#4
Fulton St
Bishop, CA 93514
|
- sq. feet
|
2 baths 3 beds |
show details | |

|
#5
Sunset Rd
Bishop, CA 93514
|
- sq. feet
|
2 baths 2 beds |
show details | |

|
#6
N Tu Su Ln
Bishop, CA 93514
|
- sq. feet
|
- baths - beds |
show details | |

|
#7
Mountain View Ave
Bishop, CA 93514
|
- sq. feet
|
- baths - beds |
show details | |

|
Check over 1 million property listings on Foreclosure.com!
|
browse all offers | |||


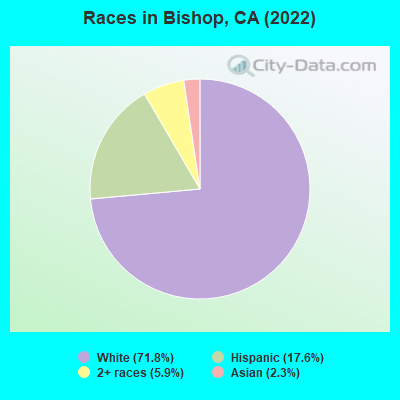
- 2,70871.8%White alone
- 66417.6%Hispanic
- 2245.9%Two or more races
- 872.3%Asian alone
- 30.08%American Indian alone
According to our research of California and other state lists, there were 21 registered sex offenders living in Bishop, California as of April 27, 2024.
The ratio of all residents to sex offenders in Bishop is 185 to 1.
Type |
2009 |
2010 |
2011 |
2012 |
2013 |
2014 |
2015 |
2016 |
2017 |
2018 |
2019 |
2020 |
2022 |
|---|---|---|---|---|---|---|---|---|---|---|---|---|---|
| Murders (per 100,000) | 0 (0.0) | 0 (0.0) | 0 (0.0) | 0 (0.0) | 0 (0.0) | 0 (0.0) | 0 (0.0) | 1 (26.4) | 0 (0.0) | 0 (0.0) | 0 (0.0) | 0 (0.0) | 0 (0.0) |
| Rapes (per 100,000) | 3 (88.4) | 2 (51.6) | 1 (25.5) | 0 (0.0) | 0 (0.0) | 3 (77.7) | 2 (52.2) | 1 (26.4) | 10 (265.5) | 6 (160.3) | 9 (241.2) | 2 (53.6) | 2 (52.4) |
| Robberies (per 100,000) | 1 (29.5) | 3 (77.3) | 1 (25.5) | 0 (0.0) | 4 (103.6) | 0 (0.0) | 4 (104.4) | 5 (131.8) | 5 (132.7) | 4 (106.8) | 6 (160.8) | 10 (267.9) | 3 (78.6) |
| Assaults (per 100,000) | 16 (471.6) | 17 (438.3) | 14 (356.7) | 16 (410.3) | 24 (621.6) | 24 (621.8) | 32 (834.9) | 22 (580.0) | 29 (769.8) | 31 (828.0) | 19 (509.2) | 14 (375.0) | 26 (681.2) |
| Burglaries (per 100,000) | 19 (560.0) | 19 (489.8) | 29 (738.9) | 31 (794.9) | 24 (621.6) | 33 (854.9) | 12 (313.1) | 31 (817.3) | 68 (1,805) | 26 (694.4) | 29 (777.3) | 25 (669.7) | 34 (890.8) |
| Thefts (per 100,000) | 86 (2,535) | 62 (1,598) | 79 (2,013) | 102 (2,615) | 80 (2,072) | 91 (2,358) | 85 (2,218) | 114 (3,006) | 217 (5,761) | 201 (5,369) | 150 (4,020) | 98 (2,625) | 160 (4,192) |
| Auto thefts (per 100,000) | 4 (117.9) | 3 (77.3) | 2 (51.0) | 4 (102.6) | 4 (103.6) | 4 (103.6) | 8 (208.7) | 11 (290.0) | 11 (292.0) | 5 (133.5) | 4 (107.2) | 10 (267.9) | 12 (314.4) |
| Arson (per 100,000) | 0 (0.0) | 0 (0.0) | 0 (0.0) | 0 (0.0) | 0 (0.0) | 0 (0.0) | 0 (0.0) | 0 (0.0) | 0 (0.0) | 0 (0.0) | 0 (0.0) | 0 (0.0) | 0 (0.0) |
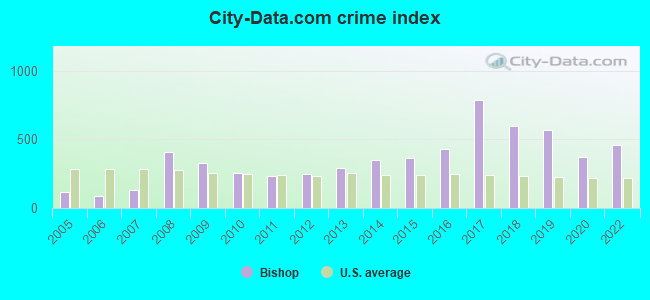
| City-Data.com crime index | 323.9 | 256.5 | 235.7 | 250.5 | 290.1 | 349.0 | 367.3 | 430.0 | 786.3 | 599.9 | 566.9 | 371.6 | 456.9 |
The City-Data.com crime index weighs serious crimes and violent crimes more heavily. Higher means more crime, U.S. average is 246.1. It adjusts for the number of visitors and daily workers commuting into cities.
Crime rate in Bishop detailed stats: murders, rapes, robberies, assaults, burglaries, thefts, arson
Full-time law enforcement employees in 2021, including police officers: 20 (12 officers - 11 male; 1 female).
| Officers per 1,000 residents here: | 3.18 |
| California average: | 2.30 |
 Recent articles from our blog. Our writers, many of them Ph.D. graduates or candidates, create easy-to-read articles on a wide variety of topics.

 | Bishop, Ca? (19 replies) |
| Bishop Ranch Area (0 replies) |
| Failed proposal to build highway connecting Fresno and Bishop (0 replies) |
| SF/Bay Area Crime Thread (1410 replies) |
| Demographics and changes in the outer East Bay (675 replies) |
| Going to stay up in Bishop, CA from June 17-21. Any advice, opinions, or suggestions? (22 replies) |
Latest news from Bishop, CA collected exclusively by city-data.com from local newspapers, TV, and radio stations
Ancestries: American (13.4%), German (11.0%), European (6.8%), English (6.0%), Polish (5.1%), Italian (4.1%).
Current Local Time: PST time zone
Elevation: 4147 feet
Land area: 1.75 square miles.
Population density: 2,155 people per square mile (low).
262 residents are foreign born (4.4% Latin America, 1.4% Asia, 0.7% North America).
| This city: | 6.9% |
| California: | 26.5% |
Median real estate property taxes paid for housing units with mortgages in 2022: $3,113 (0.6%)
Median real estate property taxes paid for housing units with no mortgage in 2022: $2,067 (0.9%)
Nearest city with pop. 50,000+: Clovis, CA  (81.0 miles , pop. 68,468).
Nearest city with pop. 200,000+: Fresno, CA (87.0 miles , pop. 427,652).
Nearest city with pop. 1,000,000+: Los Angeles, CA (226.8 miles , pop. 3,694,820).
Nearest cities:
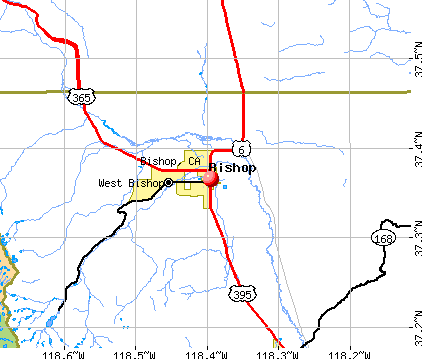
), ), ), ), ), ), )Latitude: 37.37 N, Longitude: 118.39 W
Daytime population change due to commuting: +2,012 (+53.4%)
Workers who live and work in this city: 1,678 (75.5%)
Area code: 760

Bishop, California accommodation & food services, waste management - Economy and Business Data
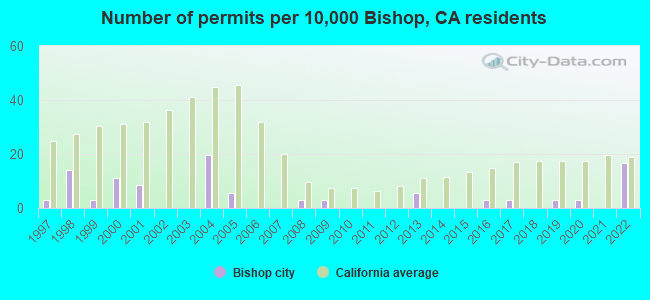
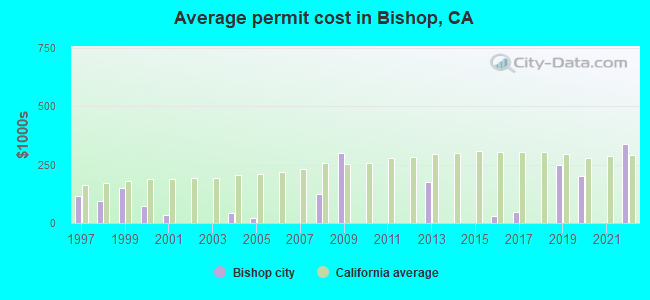
Single-family new house construction building permits:
- 2022: 6 buildings, average cost: $337,500
- 2020: 1 building, cost: $200,000
- 2019: 1 building, cost: $250,000
- 2017: 1 building, cost: $47,500
- 2016: 1 building, cost: $30,000
- 2013: 2 buildings, average cost: $176,900
- 2009: 1 building, cost: $300,000
- 2008: 1 building, cost: $122,600
- 2005: 2 buildings, average cost: $20,500
- 2004: 7 buildings, average cost: $40,700
- 2001: 3 buildings, average cost: $34,100
- 2000: 4 buildings, average cost: $73,500
- 1999: 1 building, cost: $149,600
- 1998: 5 buildings, average cost: $93,200
- 1997: 1 building, cost: $113,700
| Here: | 4.2% |
| California: | 5.1% |
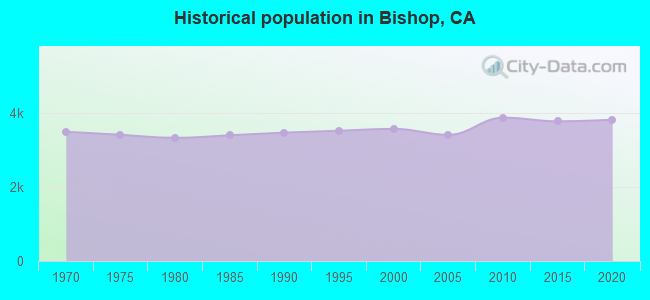
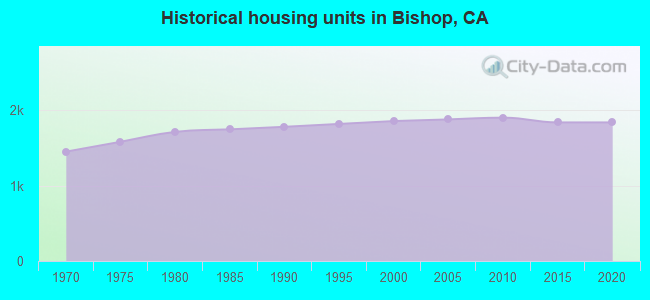
Population change in the 1990s: +77 (+2.2%).
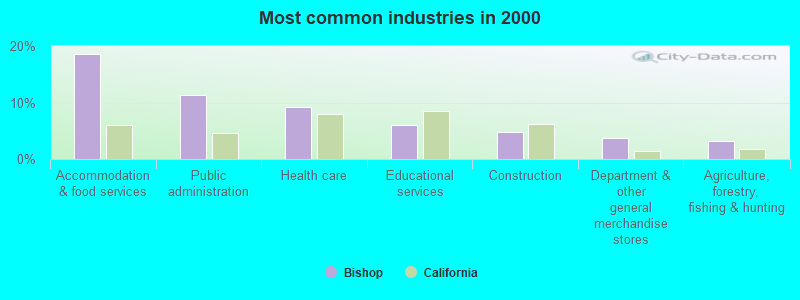
- Accommodation & food services (18.7%)
- Public administration (11.3%)
- Health care (9.2%)
- Educational services (6.0%)
- Construction (4.8%)
- Department & other general merchandise stores (3.7%)
- Agriculture, forestry, fishing & hunting (3.1%)
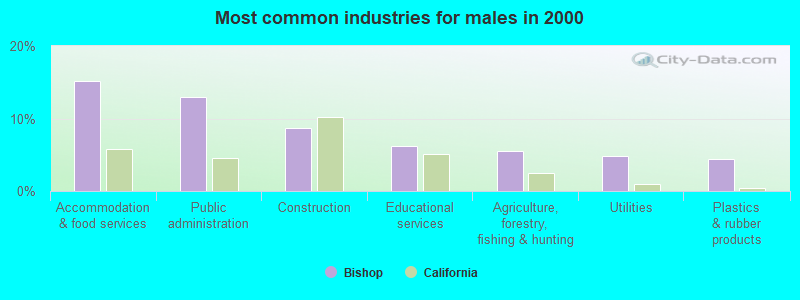
- Accommodation & food services (15.2%)
- Public administration (12.9%)
- Construction (8.7%)
- Educational services (6.2%)
- Agriculture, forestry, fishing & hunting (5.5%)
- Utilities (4.8%)
- Plastics & rubber products (4.4%)
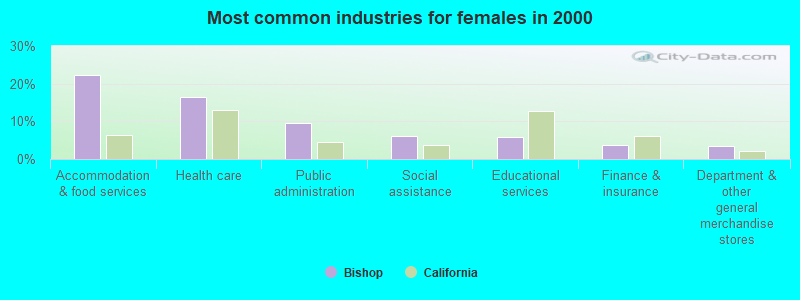
- Accommodation & food services (22.2%)
- Health care (16.4%)
- Public administration (9.6%)
- Social assistance (6.0%)
- Educational services (5.8%)
- Finance & insurance (3.8%)
- Department & other general merchandise stores (3.5%)
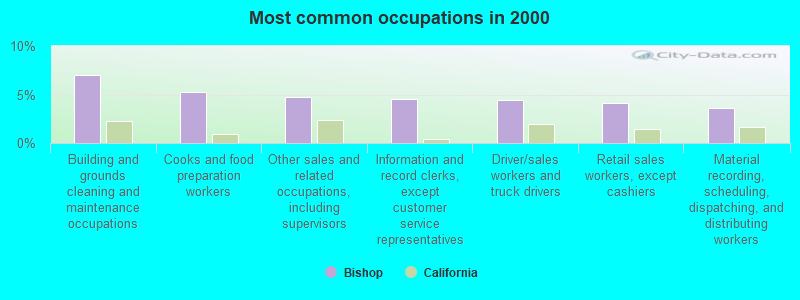
- Building and grounds cleaning and maintenance occupations (7.0%)
- Cooks and food preparation workers (5.3%)
- Other sales and related occupations, including supervisors (4.8%)
- Information and record clerks, except customer service representatives (4.6%)
- Driver/sales workers and truck drivers (4.4%)
- Retail sales workers, except cashiers (4.1%)
- Material recording, scheduling, dispatching, and distributing workers (3.6%)
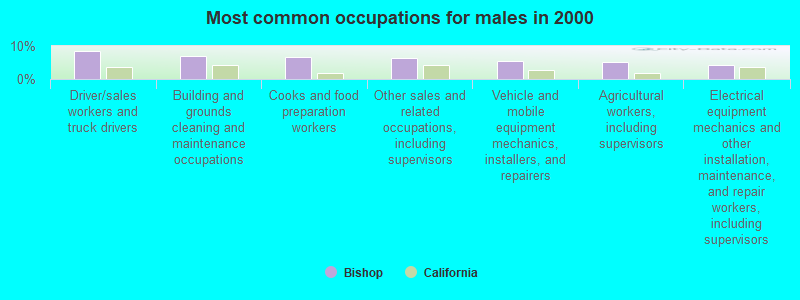
- Driver/sales workers and truck drivers (8.6%)
- Building and grounds cleaning and maintenance occupations (7.1%)
- Cooks and food preparation workers (6.7%)
- Other sales and related occupations, including supervisors (6.3%)
- Vehicle and mobile equipment mechanics, installers, and repairers (5.4%)
- Agricultural workers, including supervisors (5.3%)
- Electrical equipment mechanics and other installation, maintenance, and repair workers, including supervisors (4.3%)
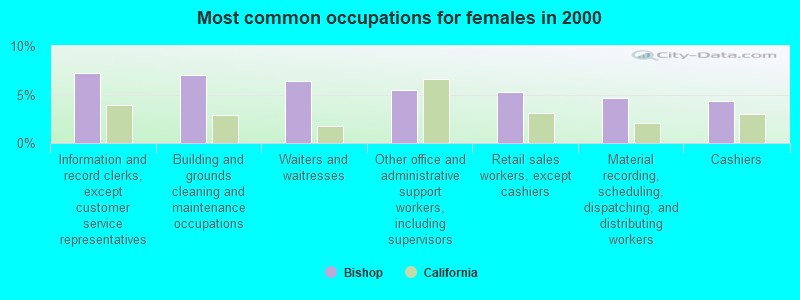
- Information and record clerks, except customer service representatives (7.2%)
- Building and grounds cleaning and maintenance occupations (7.0%)
- Waiters and waitresses (6.4%)
- Other office and administrative support workers, including supervisors (5.5%)
- Retail sales workers, except cashiers (5.2%)
- Material recording, scheduling, dispatching, and distributing workers (4.6%)
- Cashiers (4.4%)
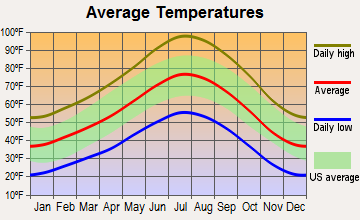
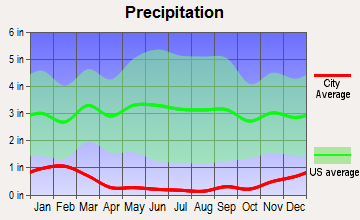
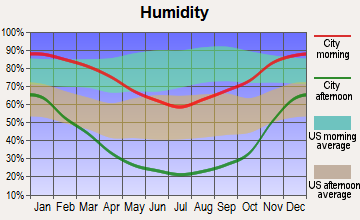
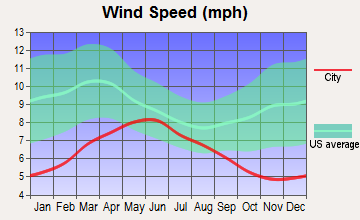
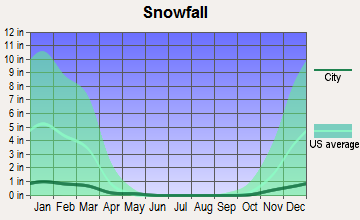
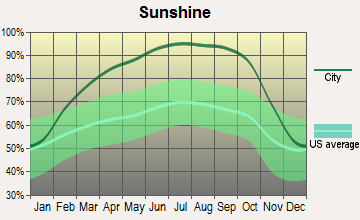
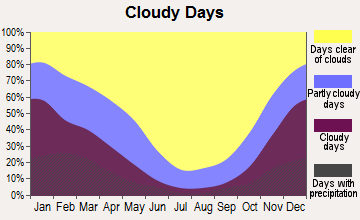
Average climate in Bishop, California
Based on data reported by over 4,000 weather stations
|
|

(lower is better)
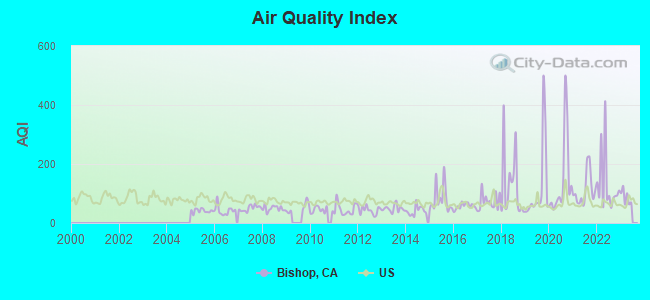
Air Quality Index (AQI) level in 2022 was 132. This is significantly worse than average.
| City: | 132 |
| U.S.: | 73 |
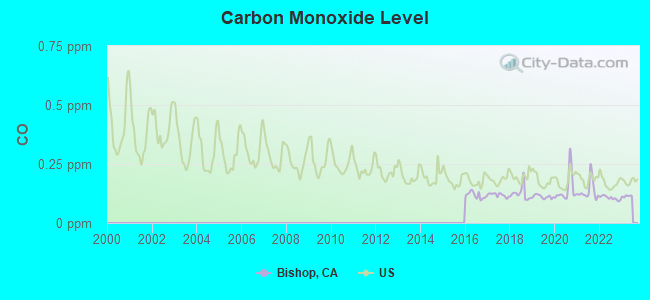
Carbon Monoxide (CO) [ppm] level in 2022 was 0.106. This is significantly better than average. Closest monitor was 0.3 miles away from the city center.
| City: | 0.106 |
| U.S.: | 0.251 |
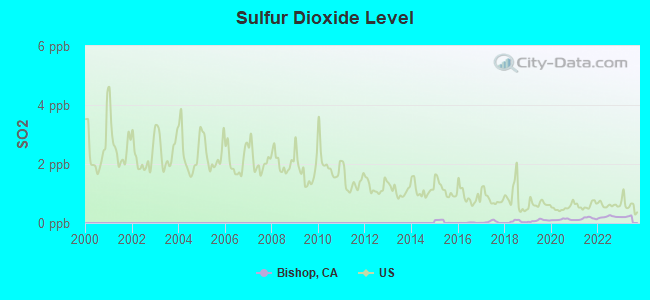
Sulfur Dioxide (SO2) [ppb] level in 2022 was 0.208. This is significantly better than average. Closest monitor was 3.5 miles away from the city center.
| City: | 0.208 |
| U.S.: | 1.515 |
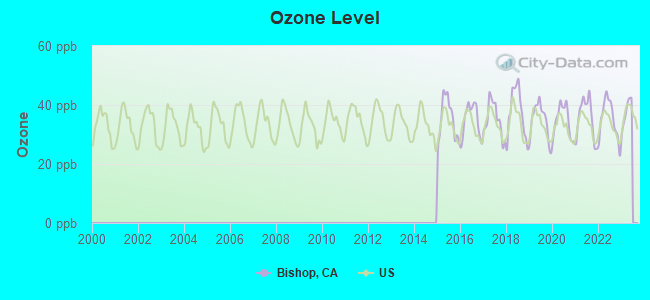
Ozone [ppb] level in 2022 was 35.1. This is about average. Closest monitor was 0.3 miles away from the city center.
| City: | 35.1 |
| U.S.: | 33.3 |
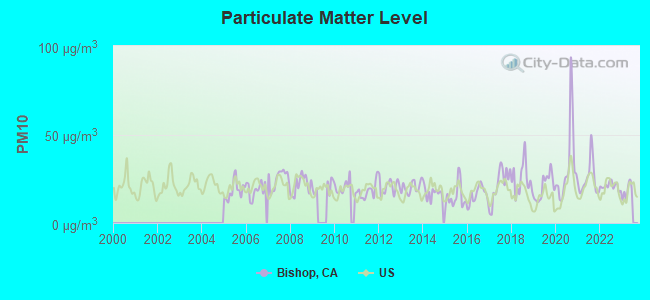
Particulate Matter (PM10) [µg/m3] level in 2022 was 20.8. This is about average. Closest monitor was 0.1 miles away from the city center.
| City: | 20.8 |
| U.S.: | 19.2 |
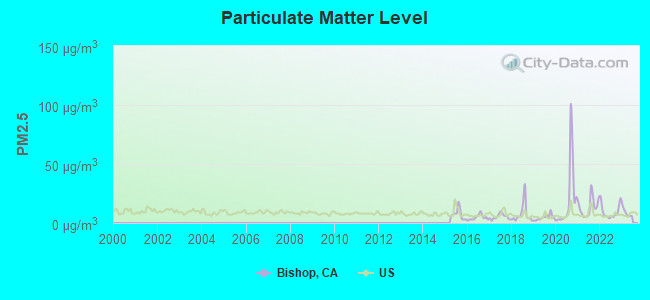
Particulate Matter (PM2.5) [µg/m3] level in 2022 was 9.73. This is about average. Closest monitor was 1.3 miles away from the city center.
| City: | 9.73 |
| U.S.: | 8.11 |
Earthquake activity:
Bishop-area historical earthquake activity is significantly above California state average. It is 8484% greater than the overall U.S. average.On 7/21/1952 at 11:52:14, a magnitude 7.7 (7.7 UK, Class: Major, Intensity: VIII - XII) earthquake occurred 167.0 miles away from the city center, causing $50,000,000 total damage
On 12/21/1932 at 06:10:09, a magnitude 7.2 (7.2 UK) earthquake occurred 81.0 miles away from the city center
On 4/18/1906 at 13:12:21, a magnitude 7.9 (7.9 UK) earthquake occurred 255.9 miles away from the city center, causing $524,000,000 total damage
On 10/3/1915 at 06:52:48, a magnitude 7.6 (7.6 UK) earthquake occurred 222.1 miles away from the city center
On 6/28/1992 at 11:57:34, a magnitude 7.6 (6.2 MB, 7.6 MS, 7.3 MW, Depth: 0.7 mi) earthquake occurred 243.6 miles away from the city center, causing 3 deaths (1 shaking deaths, 2 other deaths) and 400 injuries, causing $100,000,000 total damage and $40,000,000 insured losses
On 11/4/1927 at 13:51:53, a magnitude 7.5 (7.5 UK) earthquake occurred 224.5 miles away from Bishop center
Magnitude types: body-wave magnitude (MB), surface-wave magnitude (MS), moment magnitude (MW)
Natural disasters:
The number of natural disasters in Inyo County (11) is smaller than the US average (15).Major Disasters (Presidential) Declared: 5
Emergencies Declared: 2
Causes of natural disasters: Floods: 7, Winter Storms: 4, Mudslides: 3, Storms: 3, Drought: 1, Fire: 1, Hurricane: 1, Landslide: 1, Other: 1 (Note: some incidents may be assigned to more than one category).
Hospitals and medical centers in Bishop:
Airports and heliports located in Bishop:
- Bishop Airport (BIH) (Runways: 5, Itinerant Ops: 16,000, Local Ops: 7,000, Military Ops: 3,000)
- North Valley Airport (9CA6) (Runways: 1)
- Inyo County Sheriff Search & Rescue Heliport (4CL7)
Colleges/universities with over 2000 students nearest to Bishop:
- Reedley College (about 79 miles; Reedley, CA; Full-time enrollment: 8,144)
- Institute of Technology Inc (about 82 miles; Clovis, CA; FT enrollment: 2,483)
- California State University-Fresno (about 84 miles; Fresno, CA; FT enrollment: 18,993)
- University of Phoenix-Central Valley Campus (about 85 miles; Fresno, CA; FT enrollment: 2,109)
- Heald College-Fresno (about 86 miles; Fresno, CA; FT enrollment: 2,199)
- Fresno Pacific University (about 87 miles; Fresno, CA; FT enrollment: 3,083)
- Fresno City College (about 88 miles; Fresno, CA; FT enrollment: 12,994)
Public high schools in Bishop:
- JILL KINMONT BOOTHE (Students: 12, Location: 166 GRANDVIEW LN., Grades: KG-12)
- COMMUNITY DAY SCHOOL III (Students: 7, Location: 301 N. FOWLER, Grades: 9-12)
- INYO COUNTY ROP (Location: 166 GRANDVIEW DR., Grades: 9-12)
- BISHOP UNION HIGH (Location: 301 N. FOWLER ST., Grades: 9-12)
Public elementary/middle schools in Bishop:
- ROUND VALLEY ELEMENTARY (Students: 90, Location: 300 N. ROUND VALLEY RD., Grades: KG-8)
- ELM STREET ELEMENTARY (Location: 800 W. ELM ST., Grades: KG-2)
- HOME STREET MIDDLE (Location: 201 HOME ST., Grades: 6-8)
- PINE STREET ELEMENTARY (Location: 800 W. PINE ST., Grades: 3-5)
- BISHOP UNION ELEMENTARY COMMUNITY DAY (Location: 163 GRANDVIEW AVE., Grades: 5-8)
- BISHOP UNION ELEMENTARY COMMUNITY DAY II (Location: 800 W. ELM ST., Grades: KG-4)
Private elementary/middle school in Bishop:
- BISHOP SDA ELEMENTARY SCHOOL (Students: 31, Location: 730 HOME ST, Grades: 1-8)
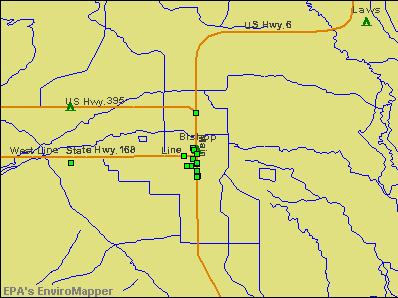
Points of interest:
Notable locations in Bishop: White Mountain Ranger Station (A), Inyo National Forest Supervisors Ofiice (B), Northern Inyo Hospital Medical Library (C), Bishop Visitors Center (D), Bishop Fire Department Station 1 Headquarters (E), Bishop City Hall (F), Symons Emergency Specialties (G), United States Forest Service White Mountain Ranger Station (H), Meadow Farms Fire Department Station 3 (I). Display/hide their locations on the map
Churches in Bishop include: Bethel Chapel Community Church (A), Church of Christ (B), The Church of Jesus Christ of Latter Day Saints (C), First Presbyterian Church (D), First Southern Baptist Church (E), First United Methodist Church (F), Foursquare Gospel Church (G), Grace Lutheran Church (H), Kingdom Hall of Jehovahs Witnesses (I). Display/hide their locations on the map
Parks in Bishop include: Tri-County Fairgrounds (1), Bishop City Park (2). Display/hide their locations on the map
Tourist attractions: Keough's Hot Springs (Recreation Areas; 800 Keough Hot Springs Rd), Chamber of Commerce-Area Information - Mammoth Lakes (690 North Main Street), Bishop Area Chamber of Commerce and Visitors Bureu (690 North Main Street).
Hotels: Best Western Creekside Inn (725 North Main Street), Best Western Bishop Holiday Sp (1025 North Main Street), Village Motel (286 West Elm Street), Bishop Holiday Spa Lodge (1025 North Main Street), Bishop-Days Inn (724 W Line St), Bishop Thunderbird Motel (190 West Pine Street).
Court: Inyo County - Courts Superior Unified- Department 4 Bishop (301 West Line Street).
Birthplace of: Matt Williams (third baseman) - Baseball player, Stanton Barrett - Race car driver and movie stunt driver, Stanton Barrett Jr. - Nextel Cup series NASCAR driver (born: Dec 1, 1972).
Drinking water stations with addresses in Bishop and their reported violations in the past:
BISHOP, CITY OF (Population served: 3,879, Groundwater):Past health violations:MAMMOTH LAKES BASIN (Population served: 1,000, Groundwater):Past monitoring violations:
- MCL, Monthly (TCR) - In MAR-2009, Contaminant: Coliform. Follow-up actions: St AO (w/o penalty) issued (JUL-15-2010)
- 2 regular monitoring violations
Past health violations:CDF - OWENS VALLEY CONSERVATION CORP (Population served: 250, Groundwater):
- MCL, Monthly (TCR) - In AUG-2005, Contaminant: Coliform. Follow-up actions: St Public Notif requested (SEP-16-2005)
- MCL, Monthly (TCR) - In AUG-2005, Contaminant: Coliform. Follow-up actions: St Public Notif requested (SEP-16-2005)
Past health violations:EAST FORK CAMPGROUND (Population served: 200, Groundwater):Past monitoring violations:
- MCL, Monthly (TCR) - In NOV-2011, Contaminant: Coliform. Follow-up actions: St Compliance achieved (JAN-30-2012)
- Initial Tap Sampling for Pb and Cu - In JUL-01-1993, Contaminant: Lead and Copper Rule. Follow-up actions: Fed Compliance achieved (SEP-30-2005)
Past monitoring violations:HIGH SIERRA WATER COMPANY (Population served: 200, Groundwater):
- 4 routine major monitoring violations
Past monitoring violations:PETITE PANTRY (Population served: 100, Groundwater):
- 2 routine major monitoring violations
Past health violations:ASPENDELL MUTUAL WATER COMPANY (Population served: 60, Groundwater):
- MCL, Monthly (TCR) - In NOV-2006, Contaminant: Coliform. Follow-up actions: St Tech Assistance Visit (NOV-13-2006), St Public Notif requested (NOV-16-2006), St Violation/Reminder Notice (NOV-16-2006), St Public Notif received (DEC-05-2006)
- MCL, Monthly (TCR) - In NOV-2006, Contaminant: Coliform. Follow-up actions: St Tech Assistance Visit (NOV-13-2006), St Public Notif requested (NOV-16-2006), St Violation/Reminder Notice (NOV-16-2006), St Public Notif received (DEC-05-2006)
Past monitoring violations:JUNE MTN. SKI AREA, STEW POT SLIM S (Population served: 50, Groundwater):
- Initial Tap Sampling for Pb and Cu - In JUL-01-1993, Contaminant: Lead and Copper Rule. Follow-up actions: Fed Compliance achieved (SEP-30-2005)
Past monitoring violations:
- 9 routine major monitoring violations
- One minor monitoring violation
Drinking water stations with addresses in Bishop that have no violations reported:
- FOUR JEFFREY CAMPGROUND (Population served: 318, Primary Water Source Type: Groundwater)
- KATHERINA MULLER WATER SYSTEM (Population served: 250, Primary Water Source Type: Groundwater)
- SCHOBER LANE CAMPGROUND (Population served: 150, Primary Water Source Type: Groundwater)
- FRENCH CAMPGROUND (Population served: 150, Primary Water Source Type: Groundwater)
- EASTERN SIERRA TRI COUNTY FAIR (Population served: 100, Primary Water Source Type: Groundwater)
- TUFF CAMPGROUND (Population served: 80, Primary Water Source Type: Groundwater)
- ROCK CREEK LAKES RESORT (Population served: 56, Primary Water Source Type: Groundwater)
- PARCHER S RESORT (Population served: 45, Primary Water Source Type: Groundwater)
- WHITE MOUNTAIN RESEARCH CENTER (Population served: 45, Primary Water Source Type: Groundwater)
- SABRINA CAMPGROUND (Population served: 30, Primary Water Source Type: Groundwater)
| This city: | 2.2 people |
| California: | 2.9 people |
| This city: | 48.9% |
| Whole state: | 68.7% |
| This city: | 8.8% |
| Whole state: | 7.2% |
Likely homosexual households (counted as self-reported same-sex unmarried-partner households)
- Lesbian couples: 0.2% of all households
- Gay men: 0.3% of all households
People in group quarters in Bishop in 2010:
- 72 people in nursing facilities/skilled-nursing facilities
- 26 people in other noninstitutional facilities
- 9 people in group homes intended for adults
People in group quarters in Bishop in 2000:
- 65 people in nursing homes
- 10 people in homes for the mentally ill
- 2 people in other noninstitutional group quarters
Banks with branches in Bishop (2011 data):
- JPMorgan Chase Bank, National Association: 400 North Main Street Branch at 400 North Main Street, branch established on 1976/05/18. Info updated 2011/11/10: Bank assets: $1,811,678.0 mil, Deposits: $1,190,738.0 mil, headquarters in Columbus, OH, positive income, International Specialization, 5577 total offices, Holding Company: Jpmorgan Chase & Co.
- Oak Valley Community Bank: Bishop Branch at 351 North Main Street, branch established on 2002/05/29. Info updated 2006/11/03: Bank assets: $612.4 mil, Deposits: $536.2 mil, headquarters in Oakdale, CA, positive income, Commercial Lending Specialization, 14 total offices, Holding Company: Oak Valley Bancorp
- Union Bank, National Association: Bishop Branch at 362 North Main Street, branch established on 1964/10/02. Info updated 2011/09/01: Bank assets: $88,967.5 mil, Deposits: $65,286.4 mil, headquarters in San Francisco, CA, positive income, Commercial Lending Specialization, 403 total offices, Holding Company: Mitsubishi Ufj Financial Group, Inc.
- El Dorado Savings Bank, F.S.B.: Bishop Branch at 515 N Main St, branch established on 1956/01/01. Info updated 2011/07/21: Bank assets: $1,706.7 mil, Deposits: $1,536.5 mil, headquarters in Placerville, CA, positive income, Mortgage Lending Specialization, 35 total offices
- Bank of America, National Association: Bishop Branch at 536 North Main Street, branch established on 1934/12/23. Info updated 2009/11/18: Bank assets: $1,451,969.3 mil, Deposits: $1,077,176.8 mil, headquarters in Charlotte, NC, positive income, 5782 total offices, Holding Company: Bank Of America Corporation
For population 15 years and over in Bishop:
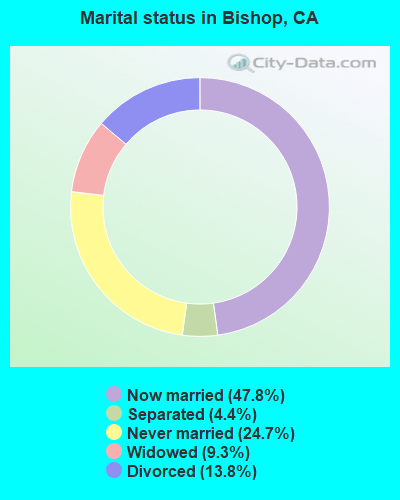
- Never married: 24.7%
- Now married: 47.8%
- Separated: 4.4%
- Widowed: 9.3%
- Divorced: 13.8%
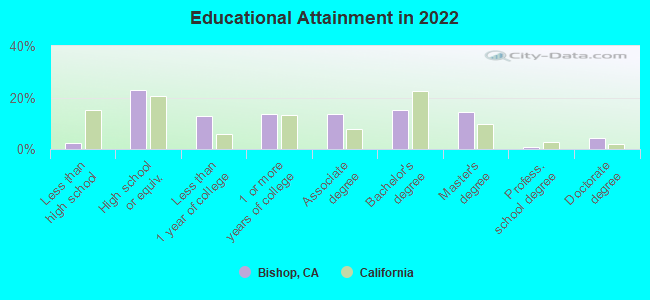
For population 25 years and over in Bishop:
- High school or higher: 97.3%
- Bachelor's degree or higher: 33.4%
- Graduate or professional degree: 18.4%
- Unemployed: 5.3%
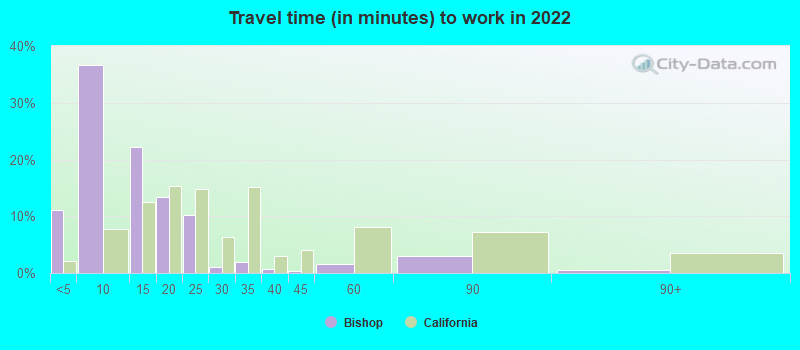
- Mean travel time to work (commute): 14.5 minutes
| Here: | 9.7 |
| California average: | 15.5 |
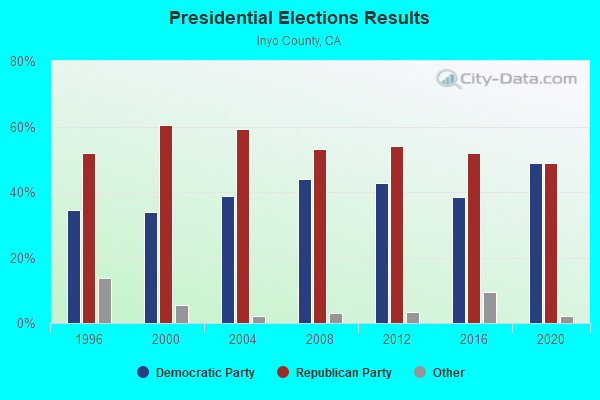
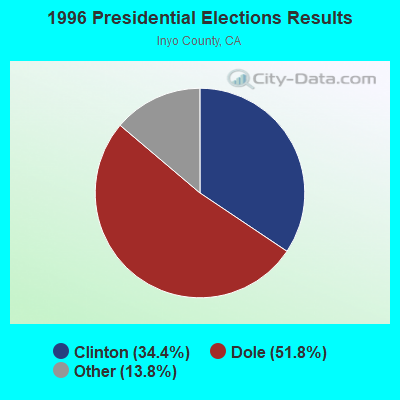
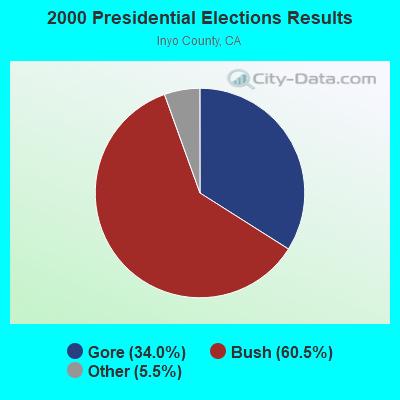
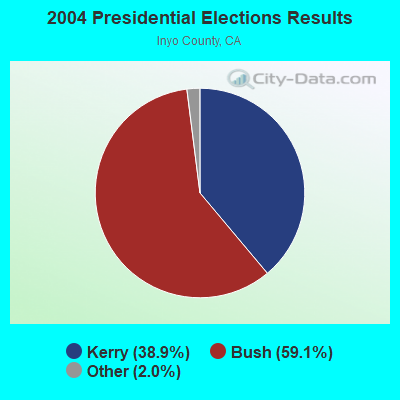
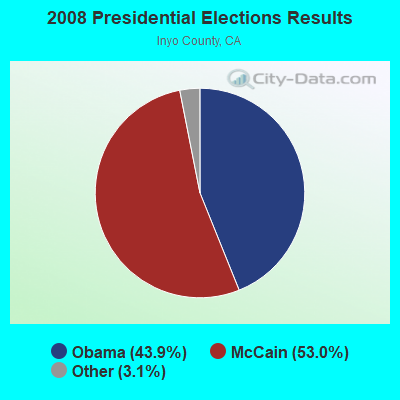
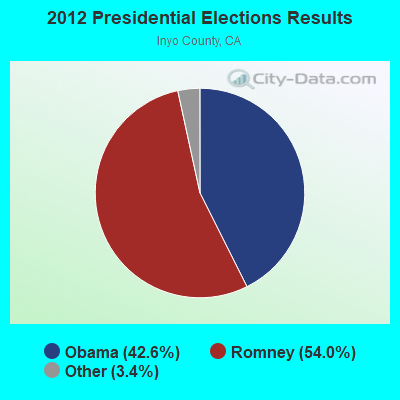
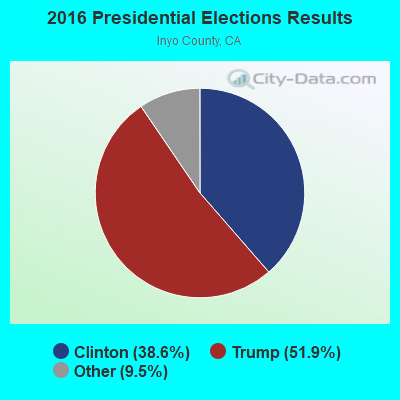
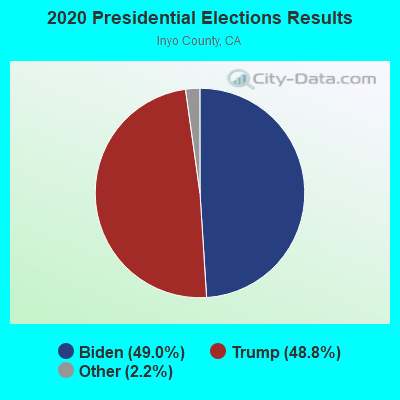
Graphs represent county-level data. Detailed 2008 Election Results
Religion statistics for Bishop, CA (based on Inyo County data)
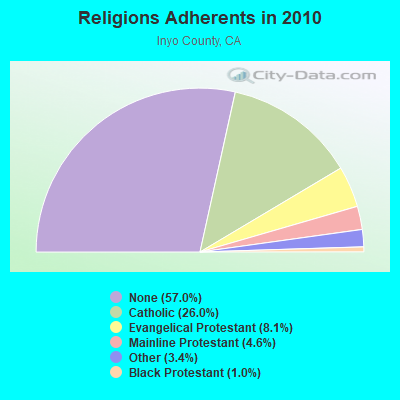

| Religion | Adherents | Congregations |
|---|---|---|
| Catholic | 4,827 | 5 |
| Evangelical Protestant | 1,494 | 23 |
| Mainline Protestant | 845 | 5 |
| Other | 629 | 4 |
| Black Protestant | 178 | 1 |
| None | 10,573 | - |
Food Environment Statistics:
| Inyo County: | 3.45 / 10,000 pop. |
| California: | 2.14 / 10,000 pop. |
| Inyo County: | 0.57 / 10,000 pop. |
| California: | 0.62 / 10,000 pop. |
| Inyo County: | 9.77 / 10,000 pop. |
| California: | 1.49 / 10,000 pop. |
| Here: | 16.67 / 10,000 pop. |
| California: | 7.42 / 10,000 pop. |
| Inyo County: | 8.1% |
| State: | 7.3% |
| Here: | 23.1% |
| State: | 21.3% |
| Inyo County: | 13.9% |
| California: | 17.9% |
Health and Nutrition:
| Bishop: | 51.2% |
| California: | 49.4% |
| This city: | 49.0% |
| California: | 48.0% |
| Here: | 28.5 |
| State: | 28.1 |
| This city: | 20.1% |
| California: | 20.2% |
| Bishop: | 10.7% |
| California: | 11.2% |
| Bishop: | 6.9 |
| California: | 6.8 |
| This city: | 34.1% |
| California: | 31.5% |
| Bishop: | 57.3% |
| California: | 56.4% |
| Bishop: | 78.0% |
| California: | 80.9% |
More about Health and Nutrition of Bishop, CA Residents
| Local government employment and payroll (March 2022) | |||||
| Function | Full-time employees | Monthly full-time payroll | Average yearly full-time wage | Part-time employees | Monthly part-time payroll |
|---|---|---|---|---|---|
| Police Protection - Officers | 12 | $100,452 | $100,452 | 0 | $0 |
| Police - Other | 6 | $32,509 | $65,018 | 3 | $1,428 |
| Other Government Administration | 4 | $18,252 | $54,756 | 10 | $3,475 |
| Water Supply | 3 | $19,411 | $77,644 | 0 | $0 |
| Parks and Recreation | 3 | $18,577 | $74,308 | 19 | $18,537 |
| Fire - Other | 2 | $8,170 | $49,020 | 0 | $0 |
| Sewerage | 2 | $13,424 | $80,544 | 0 | $0 |
| Streets and Highways | 2 | $23,128 | $138,768 | 0 | $0 |
| Firefighters | 2 | $27,383 | $164,298 | 0 | $0 |
| Financial Administration | 2 | $14,040 | $84,240 | 2 | $3,149 |
| Housing and Community Development (Local) | 0 | $0 | 1 | $995 | |
| Totals for Government | 38 | $275,346 | $86,951 | 35 | $27,584 |
Bishop government finances - Expenditure in 2017 (per resident):
- Construction - Regular Highways: $379,000 ($100.50)
Water Utilities: $268,000 ($71.07)
Sewerage: $137,000 ($36.33)
- Current Operations - Police Protection: $3,329,000 ($882.79)
Central Staff Services: $1,290,000 ($342.08)
Parks and Recreation: $822,000 ($217.98)
Water Utilities: $744,000 ($197.30)
Sewerage: $743,000 ($197.03)
Regular Highways: $498,000 ($132.06)
Local Fire Protection: $358,000 ($94.94)
Housing and Community Development: $105,000 ($27.84)
- General - Interest on Debt: $4,000 ($1.06)
- Other Capital Outlay - Local Fire Protection: $87,000 ($23.07)
Police Protection: $45,000 ($11.93)
Central Staff Services: $17,000 ($4.51)
Parks and Recreation: $7,000 ($1.86)
- Water Utilities - Interest on Debt: $9,000 ($2.39)
Bishop government finances - Revenue in 2017 (per resident):
- Charges - Sewerage: $1,061,000 ($281.36)
Parks and Recreation: $144,000 ($38.19)
Other: $98,000 ($25.99)
Housing and Community Development: $90,000 ($23.87)
- Federal Intergovernmental - General Local Government Support: $59,000 ($15.65)
Other: $11,000 ($2.92)
- Miscellaneous - General Revenue - Other: $436,000 ($115.62)
Rents: $127,000 ($33.68)
Interest Earnings: $58,000 ($15.38)
Sale of Property: $34,000 ($9.02)
Fines and Forfeits: $10,000 ($2.65)
- Revenue - Water Utilities: $1,252,000 ($332.01)
- State Intergovernmental - Other: $334,000 ($88.57)
Highways: $81,000 ($21.48)
General Local Government Support: $3,000 ($0.80)
- Tax - Other Selective Sales: $2,618,000 ($694.25)
General Sales and Gross Receipts: $1,945,000 ($515.78)
Property: $827,000 ($219.31)
Other: $640,000 ($169.72)
Other License: $69,000 ($18.30)
Occupation and Business License - Other: $55,000 ($14.58)
Public Utilities Sales: $42,000 ($11.14)
Documentary and Stock Transfer: $7,000 ($1.86)
Bishop government finances - Debt in 2017 (per resident):
- Long Term Debt - Outstanding Unspecified Public Purpose: $769,000 ($203.92)
Beginning Outstanding - Unspecified Public Purpose: $621,000 ($164.68)
Issue, Unspecified Public Purpose: $270,000 ($71.60)
Retired Unspecified Public Purpose: $122,000 ($32.35)
Bishop government finances - Cash and Securities in 2017 (per resident):
- Bond Funds - Cash and Securities: $72,000 ($19.09)
- Other Funds - Cash and Securities: $8,922,000 ($2365.95)
| Businesses in Bishop, CA | ||||
| Name | Count | Name | Count | |
|---|---|---|---|---|
| AT&T | 1 | MasterBrand Cabinets | 4 | |
| Ace Hardware | 1 | McDonald's | 1 | |
| Best Western | 2 | Motel 6 | 1 | |
| Carl\s Jr. | 1 | New Balance | 1 | |
| Comfort Inn | 1 | Nike | 2 | |
| Curves | 1 | RadioShack | 1 | |
| Days Inn | 1 | Ramada | 1 | |
| Dennys | 1 | Rite Aid | 1 | |
| FedEx | 3 | Rodeway Inn | 1 | |
| Ford | 1 | Safeway | 1 | |
| GNC | 1 | Sears | 1 | |
| H&R Block | 1 | Starbucks | 2 | |
| Holiday Inn | 1 | Super 8 | 1 | |
| Honda | 1 | Taco Bell | 1 | |
| JCPenney | 1 | Toyota | 1 | |
| Jack In The Box | 1 | True Value | 1 | |
| KFC | 1 | U-Haul | 1 | |
| Kmart | 1 | UPS | 6 | |
| La Quinta | 1 | Vans | 1 | |
| La-Z-Boy | 1 | Vons | 1 | |
| Lane Furniture | 1 | |||
Strongest AM radio stations in Bishop:
- KBOV (1230 AM; 1 kW; BISHOP, CA; Owner: GREAT COUNTRY BROADCASTING, INC.)
- KMJ (580 AM; 50 kW; FRESNO, CA; Owner: INFINITY RADIO OPERATIONS INC.)
- KWRU (940 AM; 50 kW; FRESNO, CA)
- KCBC (770 AM; 50 kW; RIVERBANK, CA; Owner: KIERTRON, INC.)
- KERI (1180 AM; 50 kW; WASCO-GREENACRES, CA; Owner: KWSO, INC.)
- KKOH (780 AM; 50 kW; RENO, NV; Owner: CITADEL BROADCASTING COMPANY)
- KOOR (790 AM; 10 kW; CLOVIS, CA; Owner: INFINITY RADIO OPERATIONS INC.)
- KGDP (660 AM; 50 kW; ORCUTT, CA; Owner: RADIO REPRESENTATIVES, INC.)
- KLAC (570 AM; 50 kW; LOS ANGELES, CA; Owner: AMFM RADIO LICENSES, L.L.C.)
- KNBR (680 AM; 50 kW; SAN FRANCISCO, CA; Owner: KNBR LICO, INC.)
- KHTK (1140 AM; 50 kW; SACRAMENTO, CA; Owner: INFINITY RADIO SUBSIDIARY OPERATIONS INC.)
- KDWN (720 AM; 50 kW; LAS VEGAS, NV; Owner: RADIO NEVADA CORP.)
- KGO (810 AM; 50 kW; SAN FRANCISCO, CA; Owner: KGO-AM RADIO, INC.)
Strongest FM radio stations in Bishop:
- KRHV (93.3 FM; BIG PINE, CA; Owner: DAVID A. AND MARYANN M. DIGERNESS)
- K208BS (89.5 FM; BISHOP, CA; Owner: WESTERN INSPIRATIONAL B/CASTERS, INC)
- KWTW (88.5 FM; BISHOP, CA; Owner: LIVING PROOF, INC.)
- KIBS (100.7 FM; BISHOP, CA; Owner: GREAT COUNTRY BROADCASTING, INC.)
- KDAY (92.5 FM; INDEPENDENCE, CA; Owner: MS. BENETT KESSLER)
- K205ET (88.9 FM; BIG PINE, ETC., CA; Owner: WESTERN INSPIRATIONAL BROADCASTERS, INC)
- KMMT (106.5 FM; MAMMOTH LAKES, CA; Owner: MAMMOTH MOUNTAIN FM ASSOCIATES,INC.)
- KFNO (90.3 FM; FRESNO, CA; Owner: FAMILY STATIONS, INC.)
- KLBN (105.1 FM; AUBERRY, CA; Owner: LOTUS COMMUNICATIONS CORP.)
- KRNC (105.9 FM; FRESNO, CA; Owner: INFINITY RADIO OPERATIONS INC.)
- KOQO-FM (101.9 FM; FRESNO, CA; Owner: INFINITY RADIO OPERATIONS INC.)
- K203CM (88.5 FM; SANGER, CA; Owner: EDUCATIONAL MEDIA FOUNDATION)
- KSKS (93.7 FM; FRESNO, CA; Owner: INFINITY RADIO OPERATIONS INC.)
- KFCF (88.1 FM; FRESNO, CA; Owner: FRESNO FREE COLLEGE FOUNDATION)
- KVPR (89.3 FM; FRESNO, CA; Owner: WHITE ASH BROADCASTING, INC.)
- K201GA (88.1 FM; BISHOP, CA; Owner: CALVARY CHAPEL OF TWIN FALLS, INC.)
- K217EE (91.3 FM; BISHOP, CA; Owner: FAMILY WORSHIP CENTER CHURCH, INC.)
TV broadcast stations around Bishop:
- K70AA (Channel 70; BISHOP, ETC., CA; Owner: MONO COUNTY SERVICE AREA NO. 5)
- K73AA (Channel 73; BISHOP, ETC., CA; Owner: MONO COUNTY SERVICE AREA NO. 5)
- K79AT (Channel 79; BISHOP, ETC., CA; Owner: MONO COUNTY SERVICE AREA NO. 5)
- National Bridge Inventory (NBI) Statistics
- 13Number of bridges
- 62ft / 19.3mTotal length
- 131,326Total average daily traffic
- 13,797Total average daily truck traffic
- 156,558Total future (year 2038) average daily traffic
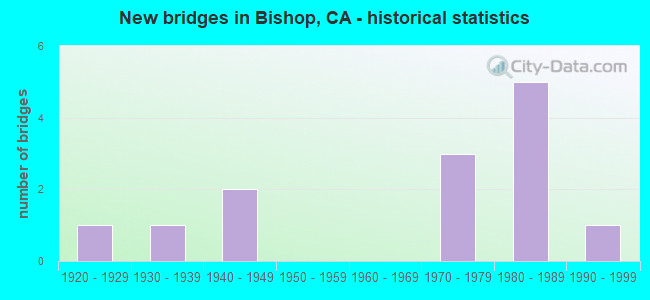
- New bridges - historical statistics
- 11920-1929
- 11930-1939
- 21940-1949
- 31970-1979
- 51980-1989
- 11990-1999
FCC Registered Antenna Towers: 144 (See the full list of FCC Registered Antenna Towers)
FCC Registered Commercial Land Mobile Towers: 1 (See the full list of FCC Registered Commercial Land Mobile Towers in Bishop, CA)
FCC Registered Broadcast Land Mobile Towers: 44 (See the full list of FCC Registered Broadcast Land Mobile Towers)
FCC Registered Microwave Towers: 56 (See the full list of FCC Registered Microwave Towers in this town)
FCC Registered Paging Towers: 8 (See the full list of FCC Registered Paging Towers)
FCC Registered Maritime Coast & Aviation Ground Towers: 8 (See the full list of FCC Registered Maritime Coast & Aviation Ground Towers)
FCC Registered Amateur Radio Licenses: 246 (See the full list of FCC Registered Amateur Radio Licenses in Bishop)
FAA Registered Aircraft Manufacturers and Dealers: 4 (See the full list of FAA Registered Manufacturers and Dealers in Bishop)
FAA Registered Aircraft: 44 (See the full list of FAA Registered Aircraft)
2005 - 2018 National Fire Incident Reporting System (NFIRS) incidents
- Fire incident types reported to NFIRS in Bishop, CA
- 7449.7%Outside Fires
- 5637.6%Structure Fires
- 1711.4%Mobile Property/Vehicle Fires
- 21.3%Other
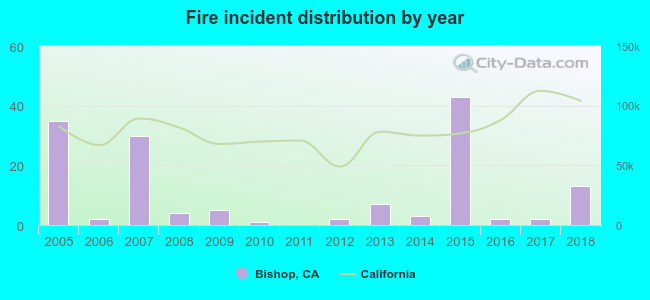 Based on the data from the years 2005 - 2018 the average number of fires per year is 11. The highest number of fires - 43 took place in 2015, and the least - 0 in 2011. The data has a declining trend.
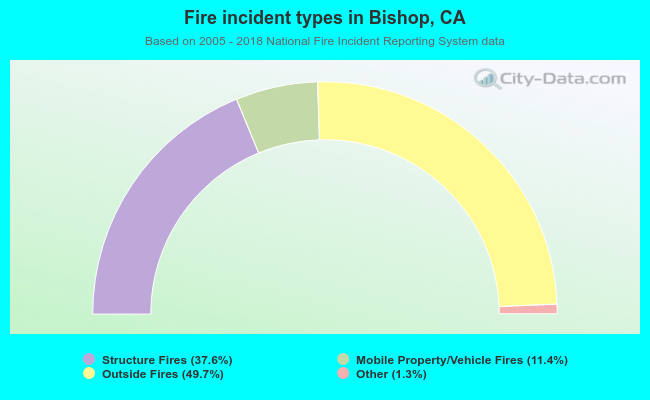 When looking into fire subcategories, the most reports belonged to: Outside Fires (49.7%), and Structure Fires (37.6%).
Fire-safe hotels and motels in Bishop, California:
- Rodeway Inn, 150 E Elm St, Bishop, California 93514 , Phone: (760) 873-3564, Fax: (760) 873-6936
- Best Western Holiday Spa Lodge, 1025 N Main St, Bishop, California 93514 , Phone: (760) 873-3543, Fax: (760) 872-4777
- La Quinta Inn, 651 N Main St, Bishop, California 93514 , Phone: (760) 873-6380
- Motel 6, 1005 N Main St, Bishop, California 93514 , Phone: (760) 873-8426, Fax: (760) 873-8060
| Most common first names in Bishop, CA among deceased individuals | ||
| Name | Count | Lived (average) |
|---|---|---|
| John | 114 | 74.7 years |
| Robert | 106 | 74.3 years |
| William | 103 | 76.0 years |
| James | 82 | 72.3 years |
| Mary | 82 | 80.9 years |
| Charles | 72 | 74.0 years |
| George | 61 | 76.8 years |
| Dorothy | 60 | 78.3 years |
| Richard | 45 | 72.4 years |
| Margaret | 40 | 79.7 years |
| Most common last names in Bishop, CA among deceased individuals | ||
| Last name | Count | Lived (average) |
|---|---|---|
| Smith | 45 | 70.6 years |
| Williams | 34 | 72.3 years |
| Brown | 31 | 74.0 years |
| Johnson | 27 | 76.7 years |
| Wilson | 21 | 76.5 years |
| Young | 19 | 79.9 years |
| Thompson | 18 | 84.8 years |
| Jones | 18 | 81.1 years |
| Clark | 17 | 77.7 years |
| Nelson | 17 | 77.2 years |
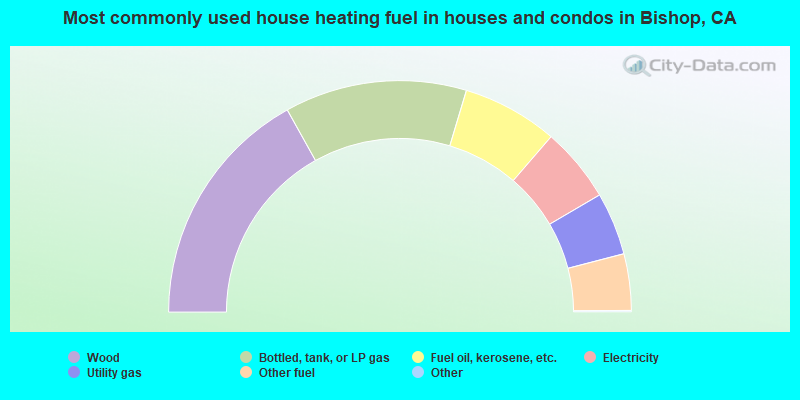
- 33.9%Wood
- 25.5%Bottled, tank, or LP gas
- 13.4%Fuel oil, kerosene, etc.
- 10.5%Electricity
- 8.8%Utility gas
- 7.9%Other fuel
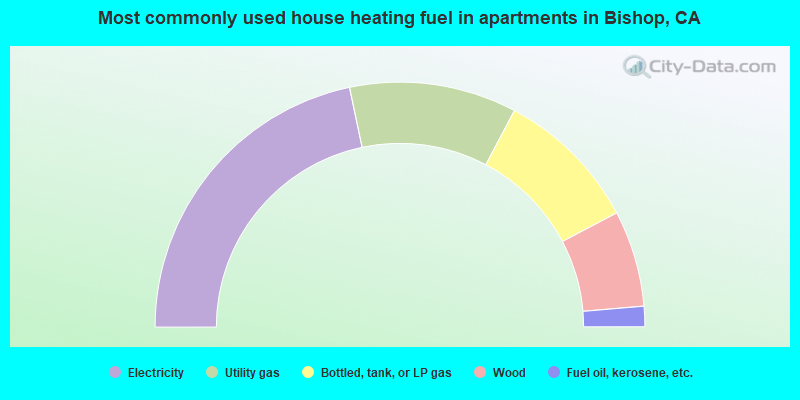
- 43.4%Electricity
- 22.1%Utility gas
- 19.1%Bottled, tank, or LP gas
- 12.7%Wood
- 2.7%Fuel oil, kerosene, etc.
Bishop compared to California state average:
- Median house value below state average.
- Unemployed percentage significantly below state average.
- Black race population percentage significantly below state average.
- Hispanic race population percentage below state average.
- Median age above state average.
- Foreign-born population percentage significantly below state average.
- Length of stay since moving in significantly above state average.

|
|
Total of 10 patent applications in 2008-2024.