Black Forest, Colorado Submit your own pictures of this place and show them to the world
OSM Map
General Map
Google Map
MSN Map
OSM Map
General Map
Google Map
MSN Map
OSM Map
General Map
Google Map
MSN Map
OSM Map
General Map
Google Map
MSN Map
Please wait while loading the map...
Population in 2010: 13,116. Population change since 2000: -1.0%Males: 6,507 Females: 6,609
March 2022 cost of living index in Black Forest: 95.2 (less than average, U.S. average is 100) Percentage of residents living in poverty in 2022: 2.0%for White Non-Hispanic residents , 4.7% for Black residents , 0.7% for Hispanic or Latino residents )
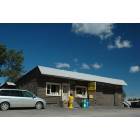
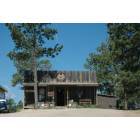
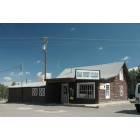
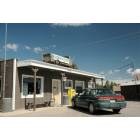
Profiles of local businesses
Business Search - 14 Million verified businesses
Data:
Median household income ($)
Median household income (% change since 2000)
Household income diversity
Ratio of average income to average house value (%)
Ratio of average income to average rent
Median household income ($) - White
Median household income ($) - Black or African American
Median household income ($) - Asian
Median household income ($) - Hispanic or Latino
Median household income ($) - American Indian and Alaska Native
Median household income ($) - Multirace
Median household income ($) - Other Race
Median household income for houses/condos with a mortgage ($)
Median household income for apartments without a mortgage ($)
Races - White alone (%)
Races - White alone (% change since 2000)
Races - Black alone (%)
Races - Black alone (% change since 2000)
Races - American Indian alone (%)
Races - American Indian alone (% change since 2000)
Races - Asian alone (%)
Races - Asian alone (% change since 2000)
Races - Hispanic (%)
Races - Hispanic (% change since 2000)
Races - Native Hawaiian and Other Pacific Islander alone (%)
Races - Native Hawaiian and Other Pacific Islander alone (% change since 2000)
Races - Two or more races (%)
Races - Two or more races (% change since 2000)
Races - Other race alone (%)
Races - Other race alone (% change since 2000)
Racial diversity
Unemployment (%)
Unemployment (% change since 2000)
Unemployment (%) - White
Unemployment (%) - Black or African American
Unemployment (%) - Asian
Unemployment (%) - Hispanic or Latino
Unemployment (%) - American Indian and Alaska Native
Unemployment (%) - Multirace
Unemployment (%) - Other Race
Population density (people per square mile)
Population - Males (%)
Population - Females (%)
Population - Males (%) - White
Population - Males (%) - Black or African American
Population - Males (%) - Asian
Population - Males (%) - Hispanic or Latino
Population - Males (%) - American Indian and Alaska Native
Population - Males (%) - Multirace
Population - Males (%) - Other Race
Population - Females (%) - White
Population - Females (%) - Black or African American
Population - Females (%) - Asian
Population - Females (%) - Hispanic or Latino
Population - Females (%) - American Indian and Alaska Native
Population - Females (%) - Multirace
Population - Females (%) - Other Race
Coronavirus confirmed cases (Apr 27, 2024)
Deaths caused by coronavirus (Apr 27, 2024)
Coronavirus confirmed cases (per 100k population) (Apr 27, 2024)
Deaths caused by coronavirus (per 100k population) (Apr 27, 2024)
Daily increase in number of cases (Apr 27, 2024)
Weekly increase in number of cases (Apr 27, 2024)
Cases doubled (in days) (Apr 27, 2024)
Hospitalized patients (Apr 18, 2022)
Negative test results (Apr 18, 2022)
Total test results (Apr 18, 2022)
COVID Vaccine doses distributed (per 100k population) (Sep 19, 2023)
COVID Vaccine doses administered (per 100k population) (Sep 19, 2023)
COVID Vaccine doses distributed (Sep 19, 2023)
COVID Vaccine doses administered (Sep 19, 2023)
Likely homosexual households (%)
Likely homosexual households (% change since 2000)
Likely homosexual households - Lesbian couples (%)
Likely homosexual households - Lesbian couples (% change since 2000)
Likely homosexual households - Gay men (%)
Likely homosexual households - Gay men (% change since 2000)
Cost of living index
Median gross rent ($)
Median contract rent ($)
Median monthly housing costs ($)
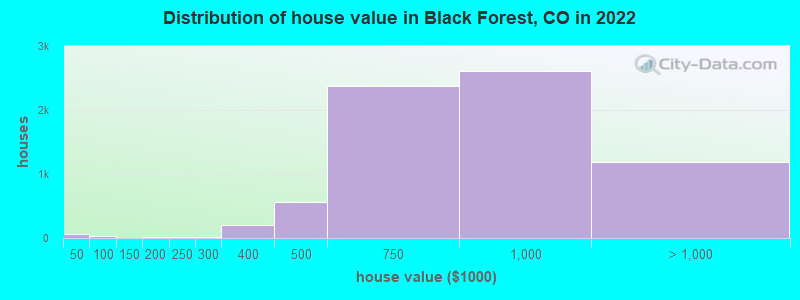
Median house or condo value ($)
Median house or condo value ($ change since 2000)
Mean house or condo value by units in structure - 1, detached ($)
Mean house or condo value by units in structure - 1, attached ($)
Mean house or condo value by units in structure - 2 ($)
Mean house or condo value by units in structure by units in structure - 3 or 4 ($)
Mean house or condo value by units in structure - 5 or more ($)
Mean house or condo value by units in structure - Boat, RV, van, etc. ($)
Mean house or condo value by units in structure - Mobile home ($)
Median house or condo value ($) - White
Median house or condo value ($) - Black or African American
Median house or condo value ($) - Asian
Median house or condo value ($) - Hispanic or Latino
Median house or condo value ($) - American Indian and Alaska Native
Median house or condo value ($) - Multirace
Median house or condo value ($) - Other Race
Median resident age
Resident age diversity
Median resident age - Males
Median resident age - Females
Median resident age - White
Median resident age - Black or African American
Median resident age - Asian
Median resident age - Hispanic or Latino
Median resident age - American Indian and Alaska Native
Median resident age - Multirace
Median resident age - Other Race
Median resident age - Males - White
Median resident age - Males - Black or African American
Median resident age - Males - Asian
Median resident age - Males - Hispanic or Latino
Median resident age - Males - American Indian and Alaska Native
Median resident age - Males - Multirace
Median resident age - Males - Other Race
Median resident age - Females - White
Median resident age - Females - Black or African American
Median resident age - Females - Asian
Median resident age - Females - Hispanic or Latino
Median resident age - Females - American Indian and Alaska Native
Median resident age - Females - Multirace
Median resident age - Females - Other Race
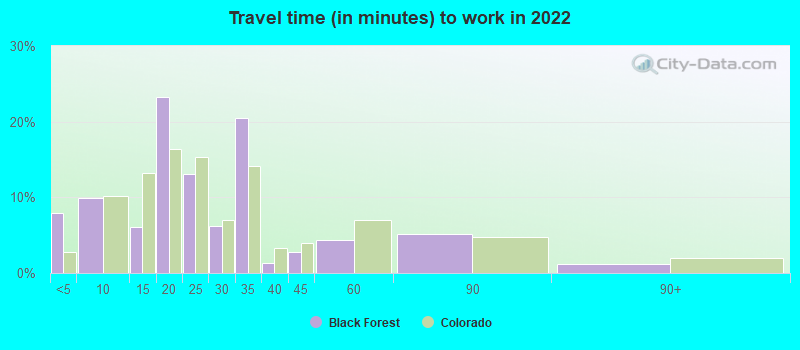
Commute - mean travel time to work (minutes)
Travel time to work - Less than 5 minutes (%)
Travel time to work - Less than 5 minutes (% change since 2000)
Travel time to work - 5 to 9 minutes (%)
Travel time to work - 5 to 9 minutes (% change since 2000)
Travel time to work - 10 to 19 minutes (%)
Travel time to work - 10 to 19 minutes (% change since 2000)
Travel time to work - 20 to 29 minutes (%)
Travel time to work - 20 to 29 minutes (% change since 2000)
Travel time to work - 30 to 39 minutes (%)
Travel time to work - 30 to 39 minutes (% change since 2000)
Travel time to work - 40 to 59 minutes (%)
Travel time to work - 40 to 59 minutes (% change since 2000)
Travel time to work - 60 to 89 minutes (%)
Travel time to work - 60 to 89 minutes (% change since 2000)
Travel time to work - 90 or more minutes (%)
Travel time to work - 90 or more minutes (% change since 2000)
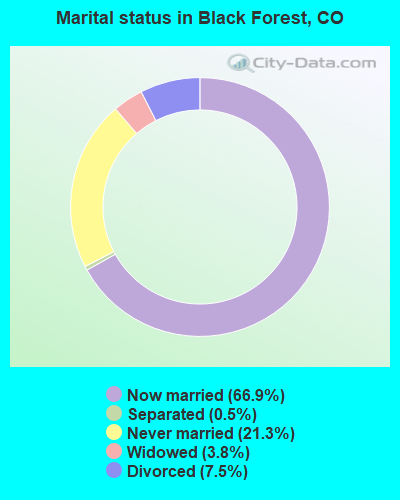
Marital status - Never married (%)
Marital status - Now married (%)
Marital status - Separated (%)
Marital status - Widowed (%)
Marital status - Divorced (%)
Median family income ($)
Median family income (% change since 2000)
Median non-family income ($)
Median non-family income (% change since 2000)
Median per capita income ($)
Median per capita income (% change since 2000)
Median family income ($) - White
Median family income ($) - Black or African American
Median family income ($) - Asian
Median family income ($) - Hispanic or Latino
Median family income ($) - American Indian and Alaska Native
Median family income ($) - Multirace
Median family income ($) - Other Race
Median year house/condo built
Median year apartment built
Year house built - Built 2005 or later (%)
Year house built - Built 2000 to 2004 (%)
Year house built - Built 1990 to 1999 (%)
Year house built - Built 1980 to 1989 (%)
Year house built - Built 1970 to 1979 (%)
Year house built - Built 1960 to 1969 (%)
Year house built - Built 1950 to 1959 (%)
Year house built - Built 1940 to 1949 (%)
Year house built - Built 1939 or earlier (%)
Average household size
Household density (households per square mile)
Average household size - White
Average household size - Black or African American
Average household size - Asian
Average household size - Hispanic or Latino
Average household size - American Indian and Alaska Native
Average household size - Multirace
Average household size - Other Race
Occupied housing units (%)
Vacant housing units (%)
Owner occupied housing units (%)
Renter occupied housing units (%)
Vacancy status - For rent (%)
Vacancy status - For sale only (%)
Vacancy status - Rented or sold, not occupied (%)
Vacancy status - For seasonal, recreational, or occasional use (%)
Vacancy status - For migrant workers (%)
Vacancy status - Other vacant (%)
Residents with income below the poverty level (%)
Residents with income below 50% of the poverty level (%)
Children below poverty level (%)
Poor families by family type - Married-couple family (%)
Poor families by family type - Male, no wife present (%)
Poor families by family type - Female, no husband present (%)
Poverty status for native-born residents (%)
Poverty status for foreign-born residents (%)
Poverty among high school graduates not in families (%)
Poverty among people who did not graduate high school not in families (%)
Residents with income below the poverty level (%) - White
Residents with income below the poverty level (%) - Black or African American
Residents with income below the poverty level (%) - Asian
Residents with income below the poverty level (%) - Hispanic or Latino
Residents with income below the poverty level (%) - American Indian and Alaska Native
Residents with income below the poverty level (%) - Multirace
Residents with income below the poverty level (%) - Other Race
Air pollution - Air Quality Index (AQI)
Air pollution - CO
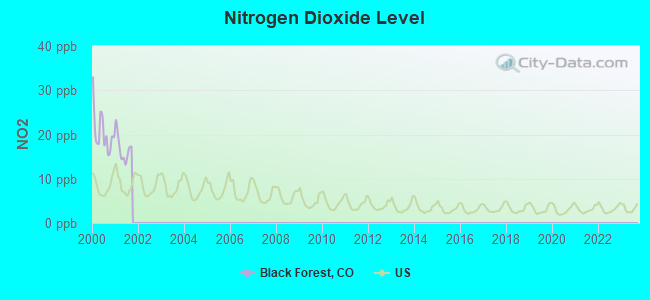
Air pollution - NO2
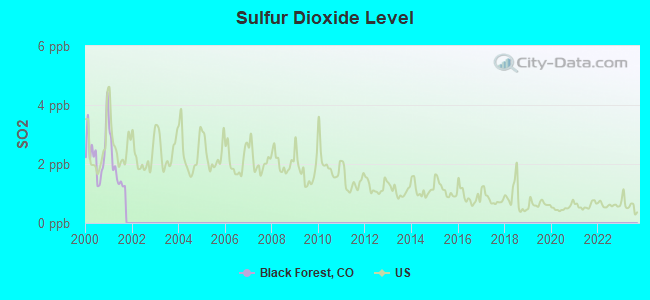
Air pollution - SO2
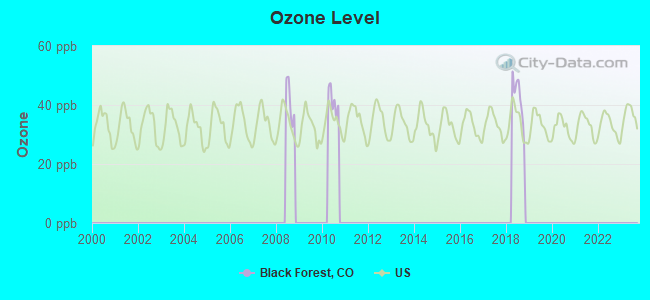
Air pollution - Ozone
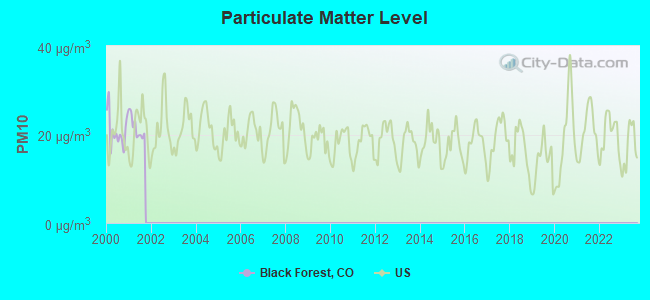
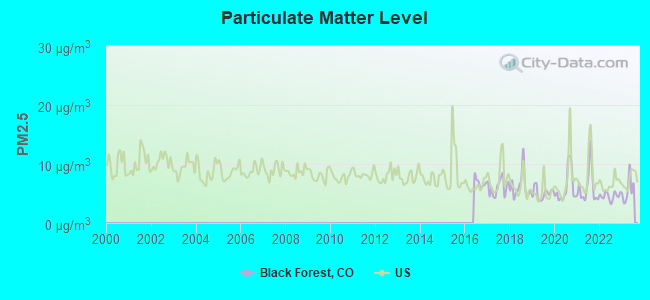
Air pollution - PM10
Air pollution - PM25
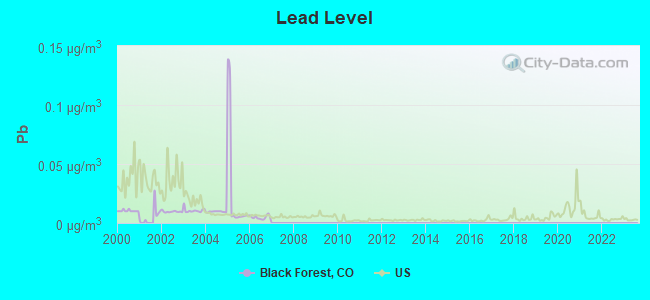
Air pollution - Pb
Crime - Murders per 100,000 population
Crime - Rapes per 100,000 population
Crime - Robberies per 100,000 population
Crime - Assaults per 100,000 population
Crime - Burglaries per 100,000 population
Crime - Thefts per 100,000 population
Crime - Auto thefts per 100,000 population
Crime - Arson per 100,000 population
Crime - City-data.com crime index
Crime - Violent crime index
Crime - Property crime index
Crime - Murders per 100,000 population (5 year average)
Crime - Rapes per 100,000 population (5 year average)
Crime - Robberies per 100,000 population (5 year average)
Crime - Assaults per 100,000 population (5 year average)
Crime - Burglaries per 100,000 population (5 year average)
Crime - Thefts per 100,000 population (5 year average)
Crime - Auto thefts per 100,000 population (5 year average)
Crime - Arson per 100,000 population (5 year average)
Crime - City-data.com crime index (5 year average)
Crime - Violent crime index (5 year average)
Crime - Property crime index (5 year average)
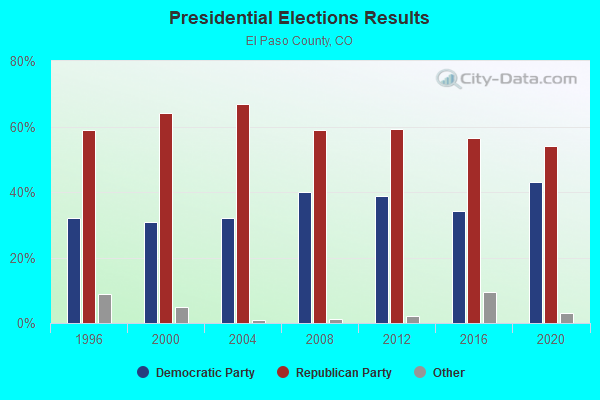
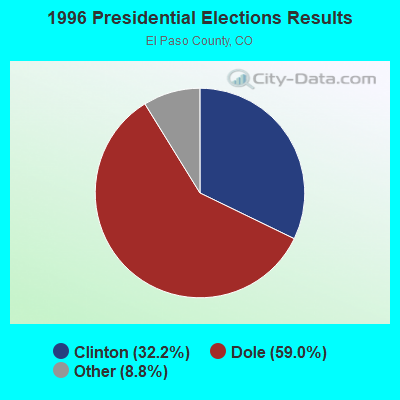
1996 Presidential Elections Results (%) - Democratic Party (Clinton)
1996 Presidential Elections Results (%) - Republican Party (Dole)
1996 Presidential Elections Results (%) - Other
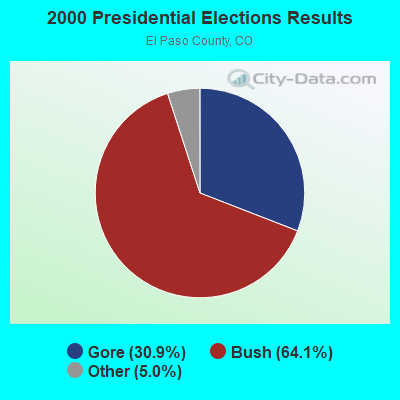
2000 Presidential Elections Results (%) - Democratic Party (Gore)
2000 Presidential Elections Results (%) - Republican Party (Bush)
2000 Presidential Elections Results (%) - Other
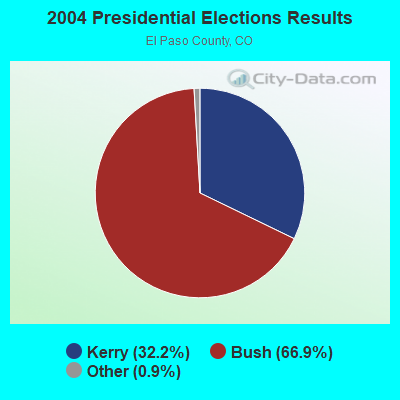
2004 Presidential Elections Results (%) - Democratic Party (Kerry)
2004 Presidential Elections Results (%) - Republican Party (Bush)
2004 Presidential Elections Results (%) - Other
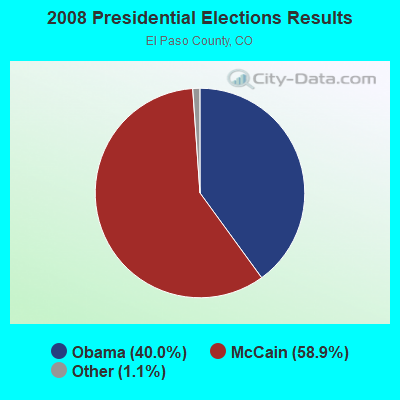
2008 Presidential Elections Results (%) - Democratic Party (Obama)
2008 Presidential Elections Results (%) - Republican Party (McCain)
2008 Presidential Elections Results (%) - Other
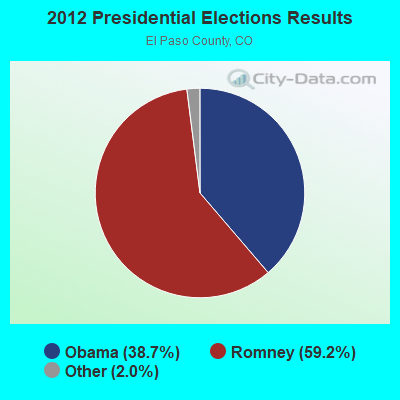
2012 Presidential Elections Results (%) - Democratic Party (Obama)
2012 Presidential Elections Results (%) - Republican Party (Romney)
2012 Presidential Elections Results (%) - Other
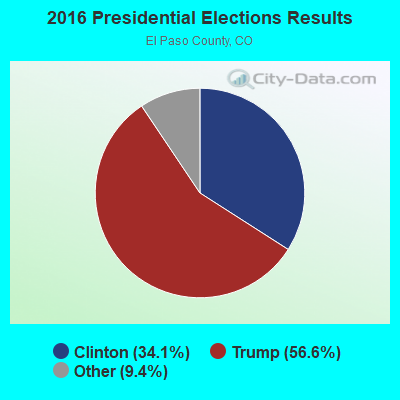
2016 Presidential Elections Results (%) - Democratic Party (Clinton)
2016 Presidential Elections Results (%) - Republican Party (Trump)
2016 Presidential Elections Results (%) - Other
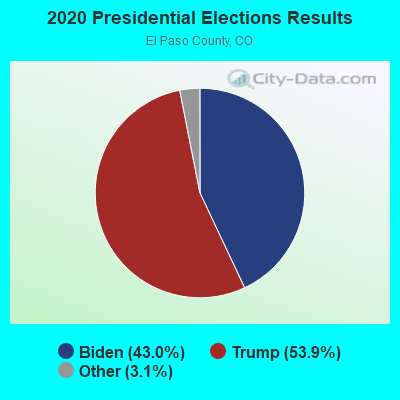
2020 Presidential Elections Results (%) - Democratic Party (Biden)
2020 Presidential Elections Results (%) - Republican Party (Trump)
2020 Presidential Elections Results (%) - Other
Ancestries Reported - Arab (%)
Ancestries Reported - Czech (%)
Ancestries Reported - Danish (%)
Ancestries Reported - Dutch (%)
Ancestries Reported - English (%)
Ancestries Reported - French (%)
Ancestries Reported - French Canadian (%)
Ancestries Reported - German (%)
Ancestries Reported - Greek (%)
Ancestries Reported - Hungarian (%)
Ancestries Reported - Irish (%)
Ancestries Reported - Italian (%)
Ancestries Reported - Lithuanian (%)
Ancestries Reported - Norwegian (%)
Ancestries Reported - Polish (%)
Ancestries Reported - Portuguese (%)
Ancestries Reported - Russian (%)
Ancestries Reported - Scotch-Irish (%)
Ancestries Reported - Scottish (%)
Ancestries Reported - Slovak (%)
Ancestries Reported - Subsaharan African (%)
Ancestries Reported - Swedish (%)
Ancestries Reported - Swiss (%)
Ancestries Reported - Ukrainian (%)
Ancestries Reported - United States (%)
Ancestries Reported - Welsh (%)
Ancestries Reported - West Indian (%)
Ancestries Reported - Other (%)
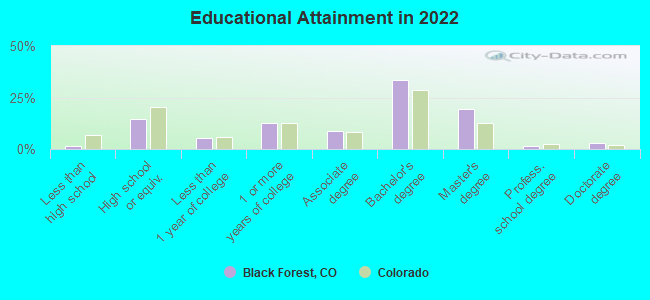
Educational Attainment - No schooling completed (%)
Educational Attainment - Less than high school (%)
Educational Attainment - High school or equivalent (%)
Educational Attainment - Less than 1 year of college (%)
Educational Attainment - 1 or more years of college (%)
Educational Attainment - Associate degree (%)
Educational Attainment - Bachelor's degree (%)
Educational Attainment - Master's degree (%)
Educational Attainment - Professional school degree (%)
Educational Attainment - Doctorate degree (%)
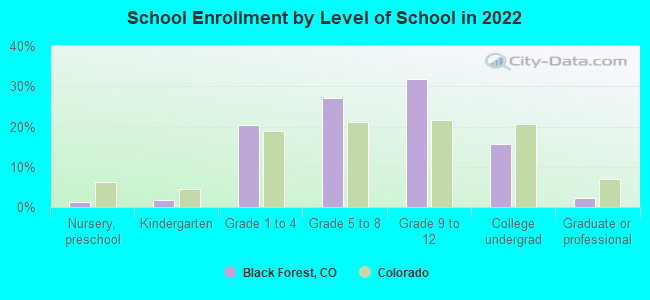
School Enrollment - Nursery, preschool (%)
School Enrollment - Kindergarten (%)
School Enrollment - Grade 1 to 4 (%)
School Enrollment - Grade 5 to 8 (%)
School Enrollment - Grade 9 to 12 (%)
School Enrollment - College undergrad (%)
School Enrollment - Graduate or professional (%)
School Enrollment - Not enrolled in school (%)
School enrollment - Public schools (%)
School enrollment - Private schools (%)
School enrollment - Not enrolled (%)
Median number of rooms in houses and condos
Median number of rooms in apartments
Housing units lacking complete plumbing facilities (%)
Housing units lacking complete kitchen facilities (%)
Density of houses
Urban houses (%)
Rural houses (%)
Households with people 60 years and over (%)
Households with people 65 years and over (%)
Households with people 75 years and over (%)
Households with one or more nonrelatives (%)
Households with no nonrelatives (%)
Population in households (%)
Family households (%)
Nonfamily households (%)
Population in families (%)
Family households with own children (%)
Median number of bedrooms in owner occupied houses
Mean number of bedrooms in owner occupied houses
Median number of bedrooms in renter occupied houses
Mean number of bedrooms in renter occupied houses
Median number of vehichles in owner occupied houses
Mean number of vehichles in owner occupied houses
Median number of vehichles in renter occupied houses
Mean number of vehichles in renter occupied houses
Mortgage status - with mortgage (%)
Mortgage status - with second mortgage (%)
Mortgage status - with home equity loan (%)
Mortgage status - with both second mortgage and home equity loan (%)
Mortgage status - without a mortgage (%)
Average family size
Average family size - White
Average family size - Black or African American
Average family size - Asian
Average family size - Hispanic or Latino
Average family size - American Indian and Alaska Native
Average family size - Multirace
Average family size - Other Race
Geographical mobility - Same house 1 year ago (%)
Geographical mobility - Moved within same county (%)
Geographical mobility - Moved from different county within same state (%)
Geographical mobility - Moved from different state (%)
Geographical mobility - Moved from abroad (%)
Place of birth - Born in state of residence (%)
Place of birth - Born in other state (%)
Place of birth - Native, outside of US (%)
Place of birth - Foreign born (%)
Housing units in structures - 1, detached (%)
Housing units in structures - 1, attached (%)
Housing units in structures - 2 (%)
Housing units in structures - 3 or 4 (%)
Housing units in structures - 5 to 9 (%)
Housing units in structures - 10 to 19 (%)
Housing units in structures - 20 to 49 (%)
Housing units in structures - 50 or more (%)
Housing units in structures - Mobile home (%)
Housing units in structures - Boat, RV, van, etc. (%)
House/condo owner moved in on average (years ago)
Renter moved in on average (years ago)
Year householder moved into unit - Moved in 1999 to March 2000 (%)
Year householder moved into unit - Moved in 1995 to 1998 (%)
Year householder moved into unit - Moved in 1990 to 1994 (%)
Year householder moved into unit - Moved in 1980 to 1989 (%)
Year householder moved into unit - Moved in 1970 to 1979 (%)
Year householder moved into unit - Moved in 1969 or earlier (%)
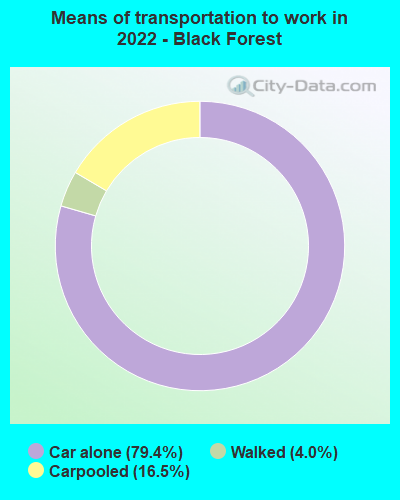
Means of transportation to work - Drove car alone (%)
Means of transportation to work - Carpooled (%)
Means of transportation to work - Public transportation (%)
Means of transportation to work - Bus or trolley bus (%)
Means of transportation to work - Streetcar or trolley car (%)
Means of transportation to work - Subway or elevated (%)
Means of transportation to work - Railroad (%)
Means of transportation to work - Ferryboat (%)
Means of transportation to work - Taxicab (%)
Means of transportation to work - Motorcycle (%)
Means of transportation to work - Bicycle (%)
Means of transportation to work - Walked (%)
Means of transportation to work - Other means (%)
Working at home (%)
Industry diversity
Most Common Industries - Agriculture, forestry, fishing and hunting, and mining (%)
Most Common Industries - Agriculture, forestry, fishing and hunting (%)
Most Common Industries - Mining, quarrying, and oil and gas extraction (%)
Most Common Industries - Construction (%)
Most Common Industries - Manufacturing (%)
Most Common Industries - Wholesale trade (%)
Most Common Industries - Retail trade (%)
Most Common Industries - Transportation and warehousing, and utilities (%)
Most Common Industries - Transportation and warehousing (%)
Most Common Industries - Utilities (%)
Most Common Industries - Information (%)
Most Common Industries - Finance and insurance, and real estate and rental and leasing (%)
Most Common Industries - Finance and insurance (%)
Most Common Industries - Real estate and rental and leasing (%)
Most Common Industries - Professional, scientific, and management, and administrative and waste management services (%)
Most Common Industries - Professional, scientific, and technical services (%)
Most Common Industries - Management of companies and enterprises (%)
Most Common Industries - Administrative and support and waste management services (%)
Most Common Industries - Educational services, and health care and social assistance (%)
Most Common Industries - Educational services (%)
Most Common Industries - Health care and social assistance (%)
Most Common Industries - Arts, entertainment, and recreation, and accommodation and food services (%)
Most Common Industries - Arts, entertainment, and recreation (%)
Most Common Industries - Accommodation and food services (%)
Most Common Industries - Other services, except public administration (%)
Most Common Industries - Public administration (%)
Occupation diversity
Most Common Occupations - Management, business, science, and arts occupations (%)
Most Common Occupations - Management, business, and financial occupations (%)
Most Common Occupations - Management occupations (%)
Most Common Occupations - Business and financial operations occupations (%)
Most Common Occupations - Computer, engineering, and science occupations (%)
Most Common Occupations - Computer and mathematical occupations (%)
Most Common Occupations - Architecture and engineering occupations (%)
Most Common Occupations - Life, physical, and social science occupations (%)
Most Common Occupations - Education, legal, community service, arts, and media occupations (%)
Most Common Occupations - Community and social service occupations (%)
Most Common Occupations - Legal occupations (%)
Most Common Occupations - Education, training, and library occupations (%)
Most Common Occupations - Arts, design, entertainment, sports, and media occupations (%)
Most Common Occupations - Healthcare practitioners and technical occupations (%)
Most Common Occupations - Health diagnosing and treating practitioners and other technical occupations (%)
Most Common Occupations - Health technologists and technicians (%)
Most Common Occupations - Service occupations (%)
Most Common Occupations - Healthcare support occupations (%)
Most Common Occupations - Protective service occupations (%)
Most Common Occupations - Fire fighting and prevention, and other protective service workers including supervisors (%)
Most Common Occupations - Law enforcement workers including supervisors (%)
Most Common Occupations - Food preparation and serving related occupations (%)
Most Common Occupations - Building and grounds cleaning and maintenance occupations (%)
Most Common Occupations - Personal care and service occupations (%)
Most Common Occupations - Sales and office occupations (%)
Most Common Occupations - Sales and related occupations (%)
Most Common Occupations - Office and administrative support occupations (%)
Most Common Occupations - Natural resources, construction, and maintenance occupations (%)
Most Common Occupations - Farming, fishing, and forestry occupations (%)
Most Common Occupations - Construction and extraction occupations (%)
Most Common Occupations - Installation, maintenance, and repair occupations (%)
Most Common Occupations - Production, transportation, and material moving occupations (%)
Most Common Occupations - Production occupations (%)
Most Common Occupations - Transportation occupations (%)
Most Common Occupations - Material moving occupations (%)
People in Group quarters - Institutionalized population (%)
People in Group quarters - Correctional institutions (%)
People in Group quarters - Federal prisons and detention centers (%)
People in Group quarters - Halfway houses (%)
People in Group quarters - Local jails and other confinement facilities (including police lockups) (%)
People in Group quarters - Military disciplinary barracks (%)
People in Group quarters - State prisons (%)
People in Group quarters - Other types of correctional institutions (%)
People in Group quarters - Nursing homes (%)
People in Group quarters - Hospitals/wards, hospices, and schools for the handicapped (%)
People in Group quarters - Hospitals/wards and hospices for chronically ill (%)
People in Group quarters - Hospices or homes for chronically ill (%)
People in Group quarters - Military hospitals or wards for chronically ill (%)
People in Group quarters - Other hospitals or wards for chronically ill (%)
People in Group quarters - Hospitals or wards for drug/alcohol abuse (%)
People in Group quarters - Mental (Psychiatric) hospitals or wards (%)
People in Group quarters - Schools, hospitals, or wards for the mentally retarded (%)
People in Group quarters - Schools, hospitals, or wards for the physically handicapped (%)
People in Group quarters - Institutions for the deaf (%)
People in Group quarters - Institutions for the blind (%)
People in Group quarters - Orthopedic wards and institutions for the physically handicapped (%)
People in Group quarters - Wards in general hospitals for patients who have no usual home elsewhere (%)
People in Group quarters - Wards in military hospitals for patients who have no usual home elsewhere (%)
People in Group quarters - Juvenile institutions (%)
People in Group quarters - Long-term care (%)
People in Group quarters - Homes for abused, dependent, and neglected children (%)
People in Group quarters - Residential treatment centers for emotionally disturbed children (%)
People in Group quarters - Training schools for juvenile delinquents (%)
People in Group quarters - Short-term care, detention or diagnostic centers for delinquent children (%)
People in Group quarters - Type of juvenile institution unknown (%)
People in Group quarters - Noninstitutionalized population (%)
People in Group quarters - College dormitories (includes college quarters off campus) (%)
People in Group quarters - Military quarters (%)
People in Group quarters - On base (%)
People in Group quarters - Barracks, unaccompanied personnel housing (UPH), (Enlisted/Officer), ;and similar group living quarters for military personnel (%)
People in Group quarters - Transient quarters for temporary residents (%)
People in Group quarters - Military ships (%)
People in Group quarters - Group homes (%)
People in Group quarters - Homes or halfway houses for drug/alcohol abuse (%)
People in Group quarters - Homes for the mentally ill (%)
People in Group quarters - Homes for the mentally retarded (%)
People in Group quarters - Homes for the physically handicapped (%)
People in Group quarters - Other group homes (%)
People in Group quarters - Religious group quarters (%)
People in Group quarters - Dormitories (%)
People in Group quarters - Agriculture workers' dormitories on farms (%)
People in Group quarters - Job Corps and vocational training facilities (%)
People in Group quarters - Other workers' dormitories (%)
People in Group quarters - Crews of maritime vessels (%)
People in Group quarters - Other nonhousehold living situations (%)
People in Group quarters - Other noninstitutional group quarters (%)
Residents speaking English at home (%)
Residents speaking English at home - Born in the United States (%)
Residents speaking English at home - Native, born elsewhere (%)
Residents speaking English at home - Foreign born (%)
Residents speaking Spanish at home (%)
Residents speaking Spanish at home - Born in the United States (%)
Residents speaking Spanish at home - Native, born elsewhere (%)
Residents speaking Spanish at home - Foreign born (%)
Residents speaking other language at home (%)
Residents speaking other language at home - Born in the United States (%)
Residents speaking other language at home - Native, born elsewhere (%)
Residents speaking other language at home - Foreign born (%)
Class of Workers - Employee of private company (%)
Class of Workers - Self-employed in own incorporated business (%)
Class of Workers - Private not-for-profit wage and salary workers (%)
Class of Workers - Local government workers (%)
Class of Workers - State government workers (%)
Class of Workers - Federal government workers (%)
Class of Workers - Self-employed workers in own not incorporated business and Unpaid family workers (%)
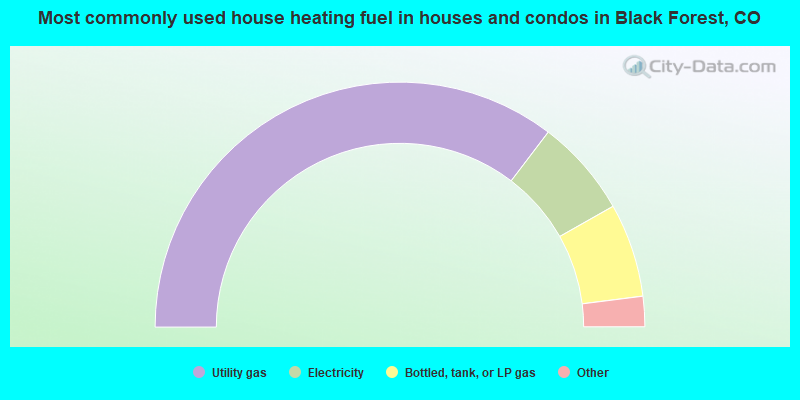
House heating fuel used in houses and condos - Utility gas (%)
House heating fuel used in houses and condos - Bottled, tank, or LP gas (%)
House heating fuel used in houses and condos - Electricity (%)
House heating fuel used in houses and condos - Fuel oil, kerosene, etc. (%)
House heating fuel used in houses and condos - Coal or coke (%)
House heating fuel used in houses and condos - Wood (%)
House heating fuel used in houses and condos - Solar energy (%)
House heating fuel used in houses and condos - Other fuel (%)
House heating fuel used in houses and condos - No fuel used (%)
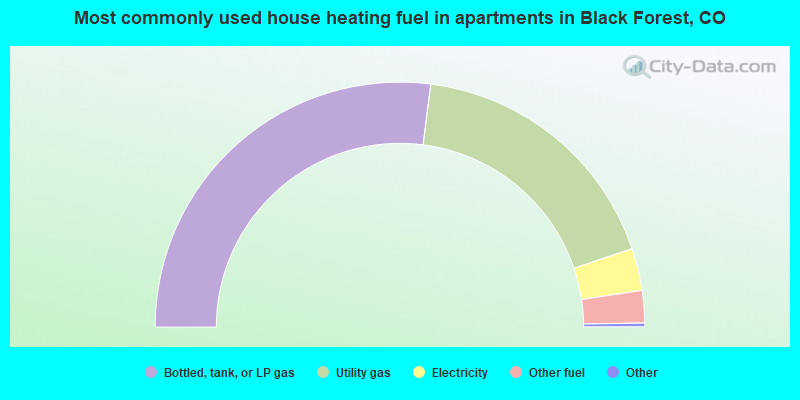
House heating fuel used in apartments - Utility gas (%)
House heating fuel used in apartments - Bottled, tank, or LP gas (%)
House heating fuel used in apartments - Electricity (%)
House heating fuel used in apartments - Fuel oil, kerosene, etc. (%)
House heating fuel used in apartments - Coal or coke (%)
House heating fuel used in apartments - Wood (%)
House heating fuel used in apartments - Solar energy (%)
House heating fuel used in apartments - Other fuel (%)
House heating fuel used in apartments - No fuel used (%)
Armed forces status - In Armed Forces (%)
Armed forces status - Civilian (%)
Armed forces status - Civilian - Veteran (%)
Armed forces status - Civilian - Nonveteran (%)
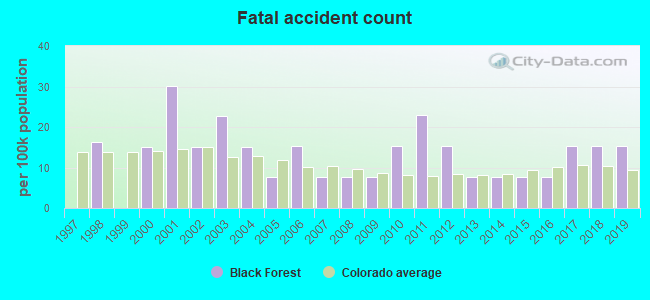
Fatal accidents locations in years 2005-2021
Fatal accidents locations in 2005
Fatal accidents locations in 2006
Fatal accidents locations in 2007
Fatal accidents locations in 2008
Fatal accidents locations in 2009
Fatal accidents locations in 2010
Fatal accidents locations in 2011
Fatal accidents locations in 2012
Fatal accidents locations in 2013
Fatal accidents locations in 2014
Fatal accidents locations in 2015
Fatal accidents locations in 2016
Fatal accidents locations in 2017
Fatal accidents locations in 2018
Fatal accidents locations in 2019
Fatal accidents locations in 2020
Fatal accidents locations in 2021
Alcohol use - People drinking some alcohol every month (%)
Alcohol use - People not drinking at all (%)
Alcohol use - Average days/month drinking alcohol
Alcohol use - Average drinks/week
Alcohol use - Average days/year people drink much
Audiometry - Average condition of hearing (%)
Audiometry - People that can hear a whisper from across a quiet room (%)
Audiometry - People that can hear normal voice from across a quiet room (%)
Audiometry - Ears ringing, roaring, buzzing (%)
Audiometry - Had a job exposure to loud noise (%)
Audiometry - Had off-work exposure to loud noise (%)
Blood Pressure & Cholesterol - Has high blood pressure (%)
Blood Pressure & Cholesterol - Checking blood pressure at home (%)
Blood Pressure & Cholesterol - Frequently checking blood cholesterol (%)
Blood Pressure & Cholesterol - Has high cholesterol level (%)
Consumer Behavior - Money monthly spent on food at supermarket/grocery store
Consumer Behavior - Money monthly spent on food at other stores
Consumer Behavior - Money monthly spent on eating out
Consumer Behavior - Money monthly spent on carryout/delivered foods
Consumer Behavior - Income spent on food at supermarket/grocery store (%)
Consumer Behavior - Income spent on food at other stores (%)
Consumer Behavior - Income spent on eating out (%)
Consumer Behavior - Income spent on carryout/delivered foods (%)
Current Health Status - General health condition (%)
Current Health Status - Blood donors (%)
Current Health Status - Has blood ever tested for HIV virus (%)
Current Health Status - Left-handed people (%)
Dermatology - People using sunscreen (%)
Diabetes - Diabetics (%)
Diabetes - Had a blood test for high blood sugar (%)
Diabetes - People taking insulin (%)
Diet Behavior & Nutrition - Diet health (%)
Diet Behavior & Nutrition - Milk product consumption (# of products/month)
Diet Behavior & Nutrition - Meals not home prepared (#/week)
Diet Behavior & Nutrition - Meals from fast food or pizza place (#/week)
Diet Behavior & Nutrition - Ready-to-eat foods (#/month)
Diet Behavior & Nutrition - Frozen meals/pizza (#/month)
Drug Use - People that ever used marijuana or hashish (%)
Drug Use - Ever used hard drugs (%)
Drug Use - Ever used any form of cocaine (%)
Drug Use - Ever used heroin (%)
Drug Use - Ever used methamphetamine (%)
Health Insurance - People covered by health insurance (%)
Kidney Conditions-Urology - Avg. # of times urinating at night
Medical Conditions - People with asthma (%)
Medical Conditions - People with anemia (%)
Medical Conditions - People with psoriasis (%)
Medical Conditions - People with overweight (%)
Medical Conditions - Elderly people having difficulties in thinking or remembering (%)
Medical Conditions - People who ever received blood transfusion (%)
Medical Conditions - People having trouble seeing even with glass/contacts (%)
Medical Conditions - People with arthritis (%)
Medical Conditions - People with gout (%)
Medical Conditions - People with congestive heart failure (%)
Medical Conditions - People with coronary heart disease (%)
Medical Conditions - People with angina pectoris (%)
Medical Conditions - People who ever had heart attack (%)
Medical Conditions - People who ever had stroke (%)
Medical Conditions - People with emphysema (%)
Medical Conditions - People with thyroid problem (%)
Medical Conditions - People with chronic bronchitis (%)
Medical Conditions - People with any liver condition (%)
Medical Conditions - People who ever had cancer or malignancy (%)
Mental Health - People who have little interest in doing things (%)
Mental Health - People feeling down, depressed, or hopeless (%)
Mental Health - People who have trouble sleeping or sleeping too much (%)
Mental Health - People feeling tired or having little energy (%)
Mental Health - People with poor appetite or overeating (%)
Mental Health - People feeling bad about themself (%)
Mental Health - People who have trouble concentrating on things (%)
Mental Health - People moving or speaking slowly or too fast (%)
Mental Health - People having thoughts they would be better off dead (%)
Oral Health - Average years since last visit a dentist
Oral Health - People embarrassed because of mouth (%)
Oral Health - People with gum disease (%)
Oral Health - General health of teeth and gums (%)
Oral Health - Average days a week using dental floss/device
Oral Health - Average days a week using mouthwash for dental problem
Oral Health - Average number of teeth
Pesticide Use - Households using pesticides to control insects (%)
Pesticide Use - Households using pesticides to kill weeds (%)
Physical Activity - People doing vigorous-intensity work activities (%)
Physical Activity - People doing moderate-intensity work activities (%)
Physical Activity - People walking or bicycling (%)
Physical Activity - People doing vigorous-intensity recreational activities (%)
Physical Activity - People doing moderate-intensity recreational activities (%)
Physical Activity - Average hours a day doing sedentary activities
Physical Activity - Average hours a day watching TV or videos
Physical Activity - Average hours a day using computer
Physical Functioning - People having limitations keeping them from working (%)
Physical Functioning - People limited in amount of work they can do (%)
Physical Functioning - People that need special equipment to walk (%)
Physical Functioning - People experiencing confusion/memory problems (%)
Physical Functioning - People requiring special healthcare equipment (%)
Prescription Medications - Average number of prescription medicines taking
Preventive Aspirin Use - Adults 40+ taking low-dose aspirin (%)
Reproductive Health - Vaginal deliveries (%)
Reproductive Health - Cesarean deliveries (%)
Reproductive Health - Deliveries resulted in a live birth (%)
Reproductive Health - Pregnancies resulted in a delivery (%)
Reproductive Health - Women breastfeeding newborns (%)
Reproductive Health - Women that had a hysterectomy (%)
Reproductive Health - Women that had both ovaries removed (%)
Reproductive Health - Women that have ever taken birth control pills (%)
Reproductive Health - Women taking birth control pills (%)
Reproductive Health - Women that have ever used Depo-Provera or injectables (%)
Reproductive Health - Women that have ever used female hormones (%)
Sexual Behavior - People 18+ that ever had sex (vaginal, anal, or oral) (%)
Sexual Behavior - Males 18+ that ever had vaginal sex with a woman (%)
Sexual Behavior - Males 18+ that ever performed oral sex on a woman (%)
Sexual Behavior - Males 18+ that ever had anal sex with a woman (%)
Sexual Behavior - Males 18+ that ever had any sex with a man (%)
Sexual Behavior - Females 18+ that ever had vaginal sex with a man (%)
Sexual Behavior - Females 18+ that ever performed oral sex on a man (%)
Sexual Behavior - Females 18+ that ever had anal sex with a man (%)
Sexual Behavior - Females 18+ that ever had any kind of sex with a woman (%)
Sexual Behavior - Average age people first had sex
Sexual Behavior - Average number of female sex partners in lifetime (males 18+)
Sexual Behavior - Average number of female vaginal sex partners in lifetime (males 18+)
Sexual Behavior - Average age people first performed oral sex on a woman (18+)
Sexual Behavior - Average number of woman performed oral sex on in lifetime (18+)
Sexual Behavior - Average number of male sex partners in lifetime (males 18+)
Sexual Behavior - Average number of male anal sex partners in lifetime (males 18+)
Sexual Behavior - Average age people first performed oral sex on a man (18+)
Sexual Behavior - Average number of male oral sex partners in lifetime (18+)
Sexual Behavior - People using protection when performing oral sex (%)
Sexual Behavior - Average number of times people have vaginal or anal sex a year
Sexual Behavior - People having sex without condom (%)
Sexual Behavior - Average number of male sex partners in lifetime (females 18+)
Sexual Behavior - Average number of male vaginal sex partners in lifetime (females 18+)
Sexual Behavior - Average number of female sex partners in lifetime (females 18+)
Sexual Behavior - Circumcised males 18+ (%)
Sleep Disorders - Average hours sleeping at night
Sleep Disorders - People that has trouble sleeping (%)
Smoking-Cigarette Use - People smoking cigarettes (%)
Taste & Smell - People 40+ having problems with smell (%)
Taste & Smell - People 40+ having problems with taste (%)
Taste & Smell - People 40+ that ever had wisdom teeth removed (%)
Taste & Smell - People 40+ that ever had tonsils teeth removed (%)
Taste & Smell - People 40+ that ever had a loss of consciousness because of a head injury (%)
Taste & Smell - People 40+ that ever had a broken nose or other serious injury to face or skull (%)
Taste & Smell - People 40+ that ever had two or more sinus infections (%)
Weight - Average height (inches)
Weight - Average weight (pounds)
Weight - Average BMI
Weight - People that are obese (%)
Weight - People that ever were obese (%)
Weight - People trying to lose weight (%)
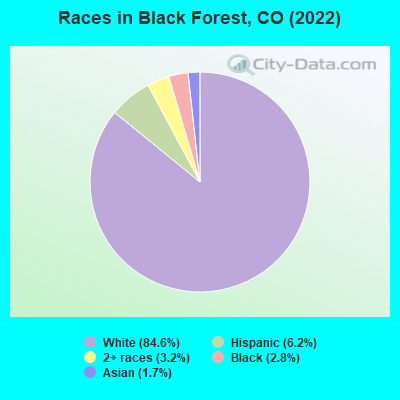
12,382 84.6% White alone 907 6.2% Hispanic 469 3.2% Two or more races 417 2.8% Black alone 245 1.7% Asian alone 7 0.05% American Indian alone
Latest news from Black Forest, CO collected exclusively by city-data.com from local newspapers, TV, and radio stations
Ancestries: German (16.3%), English (15.7%), American (9.0%), Irish (7.9%), European (5.0%), Scottish (3.0%).
Current Local Time:
Land area: 127.5 square miles.
Population density: 103 people per square mile (very low).
805 residents are foreign born (1.8% Europe , 1.3% North America , 1.1% Asia , 0.6% Africa ).
This place:
5.5%Colorado:
9.5%
Median real estate property taxes paid for housing units with mortgages in 2022: $3,075 (0.3%)Median real estate property taxes paid for housing units with no mortgage in 2022: $3,162 (0.4%)
Nearest city with pop. 50,000+: Colorado Springs, CO
Nearest city with pop. 1,000,000+: Phoenix, AZ
Nearest cities:
Latitude: 39.04 N, Longitude: 104.68 W
Daytime population change due to commuting: -3,939 (-26.9%)Workers who live and work in this place: 2,337 (33.4%)
Area code commonly used in this area: 719
Unemployment in December 2023:
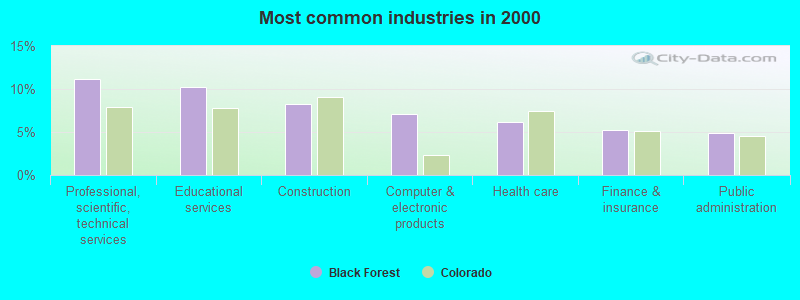
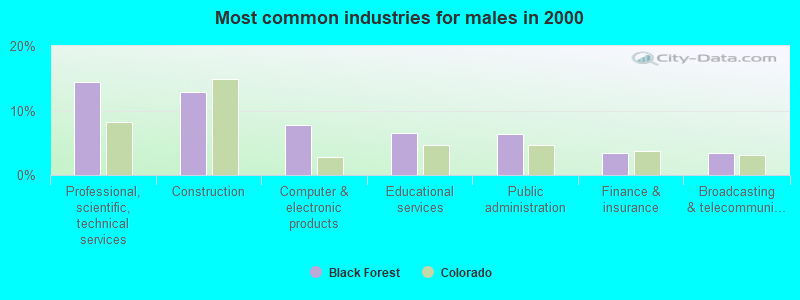
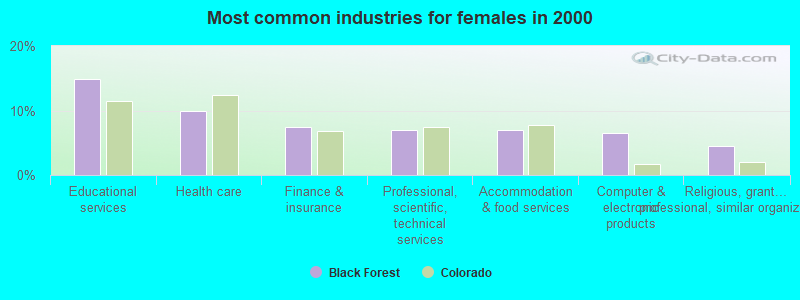
Most common industries in Black Forest, CO (%)
Both Males Females
Professional, scientific, technical services (11.1%)
Educational services (10.2%)
Construction (8.2%)
Computer & electronic products (7.1%)
Health care (6.1%)
Finance & insurance (5.3%)
Public administration (4.9%)
Professional, scientific, technical services (14.4%)
Construction (12.8%)
Computer & electronic products (7.7%)
Educational services (6.5%)
Public administration (6.3%)
Finance & insurance (3.5%)
Broadcasting & telecommunications (3.4%)
Educational services (14.9%)
Health care (9.9%)
Finance & insurance (7.5%)
Professional, scientific, technical services (7.0%)
Accommodation & food services (6.9%)
Computer & electronic products (6.5%)
Religious, grantmaking, civic, professional, similar organizations (4.5%)
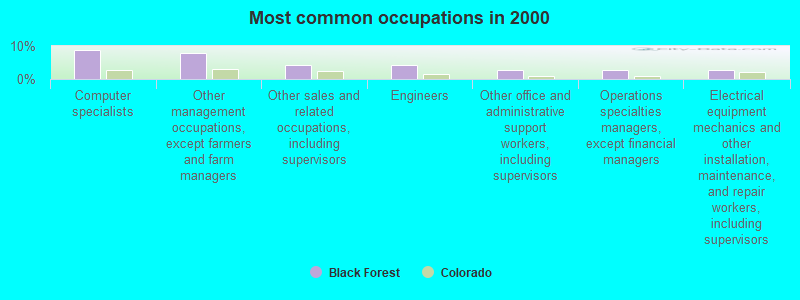
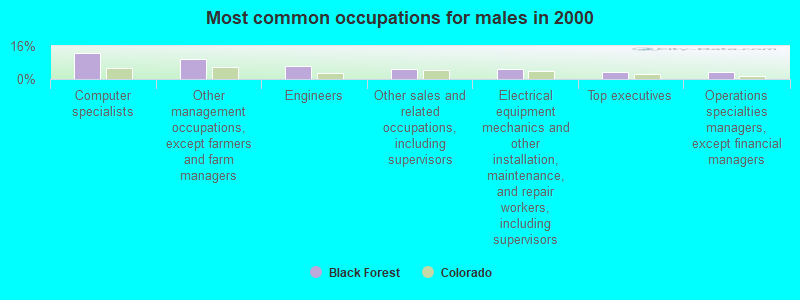
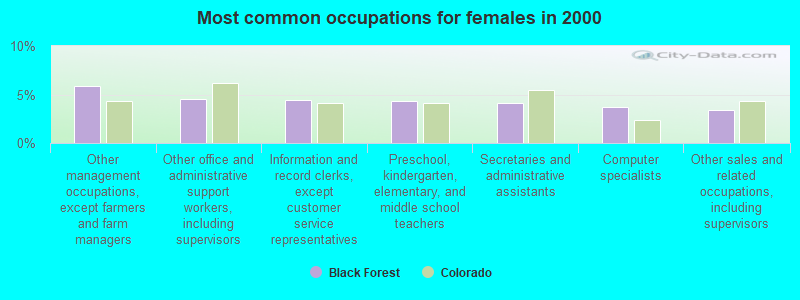
Most common occupations in Black Forest, CO (%)
Both Males Females
Computer specialists (8.7%)
Other management occupations, except farmers and farm managers (8.0%)
Other sales and related occupations, including supervisors (4.3%)
Engineers (4.2%)
Other office and administrative support workers, including supervisors (2.8%)
Operations specialties managers, except financial managers (2.8%)
Electrical equipment mechanics and other installation, maintenance, and repair workers, including supervisors (2.6%)
Computer specialists (12.7%)
Other management occupations, except farmers and farm managers (9.6%)
Engineers (6.5%)
Other sales and related occupations, including supervisors (5.0%)
Electrical equipment mechanics and other installation, maintenance, and repair workers, including supervisors (4.6%)
Top executives (3.3%)
Operations specialties managers, except financial managers (3.2%)
Other management occupations, except farmers and farm managers (5.9%)
Other office and administrative support workers, including supervisors (4.5%)
Information and record clerks, except customer service representatives (4.5%)
Preschool, kindergarten, elementary, and middle school teachers (4.3%)
Secretaries and administrative assistants (4.2%)
Computer specialists (3.7%)
Other sales and related occupations, including supervisors (3.4%)
Tornado activity:
Black Forest-area historical tornado activity is slightly above Colorado state average. It is 3% smaller than the overall U.S. average.
On 6/13/1977, a category F3 (max. wind speeds 158-206 mph) tornado 15.3 miles away from the Black Forest place center .
On 6/24/1979, a category F3 tornado 16.5 miles away from the place center injured one person and caused between $50,000 and $500,000 in damages.
Earthquake activity:
Black Forest-area historical earthquake activity is significantly above Colorado state average. It is 702% greater than the overall U.S. average. On 8/18/1959 at 06:37:13, a magnitude 7.7 (7.7 UK, Class: Major, Intensity: VIII - XII) earthquake occurred 490.9 miles away from the city center, causing $26,000,000 total damage On 8/23/2011 at 05:46:18, a magnitude 5.3 (5.3 MW, Depth: 2.5 mi, Class: Moderate, Intensity: VI - VII) earthquake occurred 136.5 miles away from Black Forest center On 10/18/1984 at 15:30:23, a magnitude 5.5 (5.4 MB, 5.1 MS, 5.5 ML) earthquake occurred 236.9 miles away from Black Forest center On 8/10/2005 at 22:08:22, a magnitude 5.0 (5.0 MW, Depth: 3.1 mi) earthquake occurred 144.8 miles away from Black Forest center On 8/10/2005 at 22:08:22, a magnitude 5.0 (5.0 MB, 4.7 MS, 5.0 MW) earthquake occurred 146.5 miles away from the city center On 10/28/1983 at 14:06:06, a magnitude 7.3 (6.2 MB, 7.3 MS, 7.0 MW) earthquake occurred 586.4 miles away from Black Forest center, causing 2 deaths ( 2 shaking deaths) and 3 injuries, causing $15,000,000 total damage Magnitude types: body-wave magnitude (MB), local magnitude (ML), surface-wave magnitude (MS), moment magnitude (MW) Natural disasters: The number of natural disasters in El Paso County (17) is near the US average (15).Major Disasters (Presidential) Declared: 10Emergencies Declared: 5Floods: 7, Storms: 7, Fires: 4, Landslides: 4, Mudslides: 4, Snows: 2, Tornadoes: 2, Drought: 1, Flash Flood: 1, Heavy Rain: 1, Hurricane: 1, Snowstorm: 1, Other: 1 (Note: some incidents may be assigned to more than one category). Hospitals and medical centers near Black Forest: LANI'S CARE NETWORK, INC (Home Health Center, about 6 miles away; COLORADO SPRINGS, CO)
LIBERTY HEIGHTS (Nursing Home, about 7 miles away; COLORADO SPRINGS, CO)
SUMMIT HOME HEALTH CARE INC (Home Health Center, about 10 miles away; COLORADO SPRINGS, CO)
TEAMSELECT HOME CARE (Home Health Center, about 10 miles away; COLORADO SPRINGS, CO)
VISITING NURSE ASSOCIATION-COLORADO SPRINGS (Home Health Center, about 11 miles away; COLORADO SPRINGS, CO)
ODYSSEY HEALTHCARE OF COLORADO SPRINGS (Hospital, about 11 miles away; COLORADO SPRINGS, CO)
NURSING AND THERAPY SERVICES OF COLORADO INC (Home Health Center, about 12 miles away; COLORADO SPRINGS, CO)
Airports located in Black Forest: Amtrak station near Black Forest: 17 miles: COLORADO SPRINGS (120 S. WEBER) - Bus Station Services: enclosed waiting area, call for taxi service.
Colleges/universities with over 2000 students nearest to Black Forest:
United States Air Force Academy (about 12 miles; USAFA, CO ; Full-time enrollment: 5,088)
University of Colorado Colorado Springs (about 12 miles; Colorado Springs, CO ; FT enrollment: 8,700)
Colorado Technical University-Colorado Springs (about 13 miles; Colorado Springs, CO ; FT enrollment: 2,049)
Colorado Technical University-Online (about 13 miles; Colorado Springs, CO ; FT enrollment: 22,771)
Colorado College (about 16 miles; Colorado Springs, CO ; FT enrollment: 2,199)
Pikes Peak Community College (about 20 miles; Colorado Springs, CO ; FT enrollment: 10,395)
Jones International University (about 39 miles; Centennial, CO ; FT enrollment: 2,556)
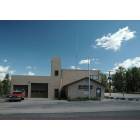
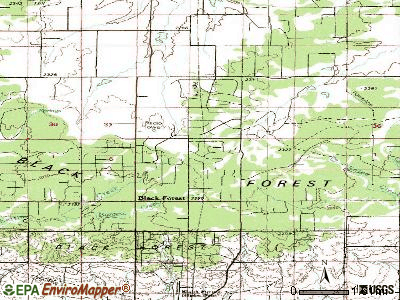
Notable locations in Black Forest: (A) , Pine Park Ranch (B) , Ayer Ranch (C) , Pine Cone Ranch (D) , Old Bar X Ranch (E) , Brentwood Country Club (F) , Shamrock Ranch (G) , Flying Horse Ranch (H) , Bridle Bit Ranch (I) , Falcon Fire Department Station 2 (J) , Black Forest Fire / Rescue Protection District Station 2 (K) , Black Forest Fire / Rescue Protection District Station 1 (L) . Display/hide their locations on the map
Church in Black Forest: (A) . Display/hide its location on the map
Cemeteries: (1) , Bluff Cemetery (2) , Table Rock Cemetery (3) . Display/hide their locations on the map
Reservoirs: (A) , Kiowa Creek Watershed K-79 Reservoir (B) , Kiowa Creek Watershed 1-G-20 Reservoir (C) , Kiowa Creek Watershed 1-G-30 Reservoir (D) , Kiowa Creek Watershed 1-N-10 Reservoir (E) , Kiowa Creek Watershed 1-P-10 Reservoir (F) , Kiowa Creek Watershed H-21 Reservoir (G) , Kiowa Creek Watershed J-33 Reservoir (H) . Display/hide their locations on the map
Rivers and creeks: (A) , Snipe Creek (B) , Burgess River (C) . Display/hide their locations on the map
Parks in Black Forest include: (1) , Black Forest Regional Park (2) . Display/hide their locations on the map
El Paso County has a predicted average indoor radon screening level greater than 4 pCi/L (pico curies per liter) - Highest Potential Drinking water stations with addresses in Black Forest and their reported violations in the past:
SPIRIT KEEPER (Population served: 53, Groundwater):
Past monitoring violations:
Monitoring, Repeat Major (TCR) - Between JAN-2008 and MAR-2008, Contaminant: Coliform (TCR). Follow-up actions: St Public Notif requested (MAY-01-2008), St Violation/Reminder Notice (MAY-01-2008), St Public Notif received (JUN-04-2008), St Compliance achieved (FEB-02-2009)
2 routine major monitoring violations
Average household size: This place:
2.8 peopleColorado:
2.5 people
Percentage of family households: This place:
83.9%Whole state:
63.9%
Percentage of households with unmarried partners: This place:
3.0%Whole state:
6.5%
Likely homosexual households (counted as self-reported same-sex unmarried-partner households)
Lesbian couples: 0.4% of all households Gay men: 0.3% of all households
17 people in religious group quarters in 2000
For population 15 years and over in Black Forest:
Never married: 21.3%Now married: 66.9%Separated: 0.5%Widowed: 3.8%Divorced: 7.5% For population 25 years and over in Black Forest:
High school or higher: 98.1%Bachelor's degree or higher: 54.8%Graduate or professional degree: 22.1%Unemployed: 3.2%Mean travel time to work (commute): 20.4 minutes
Education Gini index (Inequality in education) Here:
8.5Colorado average:
11.1
Religion statistics for Black Forest, CO (based on El Paso County data)
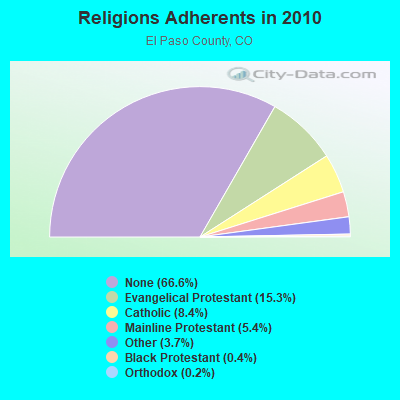
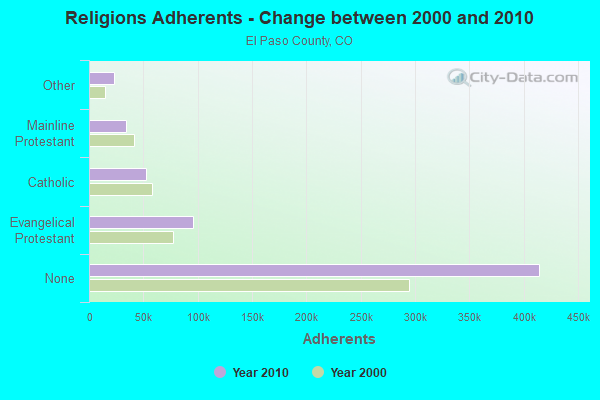
Religion Adherents Congregations Evangelical Protestant 95,284 265 Catholic 52,310 23 Mainline Protestant 33,697 61 Other 22,775 62 Black Protestant 2,686 11 Orthodox 947 4 None 414,564 -
Source: Clifford Grammich, Kirk Hadaway, Richard Houseal, Dale E.Jones, Alexei Krindatch, Richie Stanley and Richard H.Taylor. 2012. 2010 U.S.Religion Census: Religious Congregations & Membership Study. Association of Statisticians of American Religious Bodies. Jones, Dale E., et al. 2002. Congregations and Membership in the United States 2000. Nashville, TN: Glenmary Research Center. Graphs represent county-level data
Food Environment Statistics: Number of grocery stores : 57El Paso County :
0.97 / 10,000 pop.Colorado :
1.50 / 10,000 pop.
Number of supercenters and club stores : 9Here :
0.15 / 10,000 pop.Colorado :
0.15 / 10,000 pop.
Number of convenience stores (no gas) : 20Here :
0.34 / 10,000 pop.Colorado :
0.45 / 10,000 pop.
Number of convenience stores (with gas) : 168El Paso County :
2.87 / 10,000 pop.State :
3.13 / 10,000 pop.
Number of full-service restaurants : 389El Paso County :
6.64 / 10,000 pop.Colorado :
8.99 / 10,000 pop.
Adult diabetes rate : This county :
5.5%State :
5.3%
Adult obesity rate : This county :
19.8%Colorado :
18.4%
Low-income preschool obesity rate : El Paso County :
7.0%Colorado :
9.6%
Health and Nutrition: Healthy diet rate : Black Forest:
56.1%State:
49.4%
Average overall health of teeth and gums : This city:
57.1%Colorado:
47.8%
Average BMI : Black Forest:
28.2Colorado:
28.5
People feeling badly about themselves : This city:
20.3%Colorado:
20.7%
People not drinking alcohol at all : Black Forest:
7.1%Colorado:
9.7%
Average hours sleeping at night : General health condition : This city:
62.3%Colorado:
57.3%
Average condition of hearing : Black Forest:
81.6%Colorado:
80.2%
More about Health and Nutrition of Black Forest, CO Residents
9.81% of this county's 2021 resident taxpayers lived in other counties in 2020 ($64,463 average adjusted gross income )
Here:
9.81%Colorado average:
11.28%
0.28% of residents moved from foreign countries ($1,844 average AGI )El Paso County:
0.28%Colorado average:
0.05%
Top counties from which taxpayers relocated into this county between 2020 and 2021:
9.66% of this county's 2020 resident taxpayers moved to other counties in 2021 ($62,154 average adjusted gross income )
Here:
9.66%Colorado average:
11.05%
0.19% of residents moved to foreign countries ($1,409 average AGI )El Paso County:
0.19%Colorado average:
0.03%
Top counties to which taxpayers relocated from this county between 2020 and 2021: Businesses in Black Forest, CO
Strongest AM radio stations in Black Forest:
KVOR (740 AM; 3 kW; COLORADO SPRINGS, CO; Owner: CITADEL BROADCASTING COMPANY)
KCBR (1040 AM; daytime; 15 kW; MONUMENT, CO; Owner: KLZ RADIO, INC.)
KOA (850 AM; 50 kW; DENVER, CO; Owner: JACOR BROADCASTING OF COLORADO, INC.)
KCMN (1530 AM; 15 kW; COLORADO SPRINGS, CO)
KMXA (1090 AM; 50 kW; AURORA, CO; Owner: ENTRAVISION HOLDINGS, LLC)
KLTT (670 AM; 50 kW; COMMERCE CITY, CO; Owner: KLZ RADIO, INC.)
KKCS (1460 AM; 5 kW; COLORADO SPRINGS, CO; Owner: WALTON STATIONS - COLORADO, INC.)
KKZN (760 AM; 50 kW; THORNTON, CO; Owner: JACOR BROADCASTING OF COLORADO, INC.)
KWYD (1580 AM; 10 kW; COLORADO SPRINGS, CO; Owner: PILGRIM COMMUNICATIONS, INC.)
KBZC (1300 AM; 5 kW; COLORADO SPRINGS, CO; Owner: CITADEL BROADCASTING COMPANY)
KCUV (1510 AM; 25 kW; LITTLETON, CO; Owner: PEOPLE WIRELESS, INC.)
KNRC (1150 AM; 10 kW; ENGLEWOOD, CO; Owner: NRC BROADCASTING, INC.)
KEZW (1430 AM; 10 kW; AURORA, CO; Owner: ENTERCOM DENVER LICENSE, LLC)
Strongest FM radio stations in Black Forest:
KBIQ (102.7 FM; MANITOU SPRINGS, CO; Owner: BISON MEDIA, INC.)
KKCS-FM (101.9 FM; COLORADO SPRINGS, CO; Owner: WALTON STATIONS - COLORADO, INC.)
KKFM (98.1 FM; COLORADO SPRINGS, CO; Owner: CITADEL BROADCASTING COMPANY)
KRCC (91.5 FM; COLORADO SPRINGS, CO; Owner: THE COLORADO COLLEGE)
KSKX (105.5 FM; SECURITY, CO; Owner: OPTIMA COMMUNICATIONS, INC.)
KGFT (100.7 FM; PUEBLO, CO; Owner: BISON MEDIA, INC)
KKLI (106.3 FM; WIDEFIELD, CO; Owner: CAPSTAR TX LIMITED PARTNERSHIP)
KMOM (96.1 FM; FOUNTAIN, CO; Owner: AMFM TEXAS LICENSES LIMITED PARTNERSHIP)
KTLF (90.5 FM; COLORADO SPRINGS, CO; Owner: EDUCATIONAL COMMUNICATIONS OF COLORADO SPRINGS, INC.)
KSPZ (92.9 FM; COLORADO SPRINGS, CO; Owner: CITADEL BROADCASTING COMPANY)
KVUU (99.9 FM; PUEBLO, CO; Owner: CAPSTAR TX LIMITED PARTNERSHIP)
KCME (88.7 FM; MANITOU SPRINGS, CO; Owner: CHEYENNE MOUNTAIN PUBLIC BROADCAST HOUSE, INC)
KILO (94.3 FM; COLORADO SPRINGS, CO; Owner: COLORADO SPRINGS RADIO BCSTERS, INC.)
KRDO-FM (95.1 FM; COLORADO SPRINGS, CO; Owner: THE PIKES PEAK BROADCASTING CO.)
KEPC (89.7 FM; COLORADO SPRINGS, CO; Owner: PIKES PEAK COMMUNITY COLLEGE)
KJMN (92.1 FM; CASTLE ROCK, CO; Owner: ENTRAVISION HOLDINGS, LLC)
KCCY (96.9 FM; PUEBLO, CO; Owner: CAPSTAR TX LIMITED PARTNERSHIP)
KKMG (98.9 FM; PUEBLO, CO; Owner: CITADEL BROADCASTING COMPANY)
KYZX (103.9 FM; PUEBLO WEST, CO; Owner: COLORADO SPRINGS RADIO B/CASTRS, INC)
KTLC (89.1 FM; CANON CITY, CO; Owner: MAKE A DIFFERENCE FOUNDATION, INC.)
TV broadcast stations around Black Forest:
KKTV (Channel 11; COLORADO SPRINGS, CO; Owner: GRAY MIDAMERICA TV LICENSEE CORP.)
KTSC (Channel 8; PUEBLO, CO; Owner: ROCKY MOUNTAIN PUBLIC BROADCASTING NETWORK, INC.)
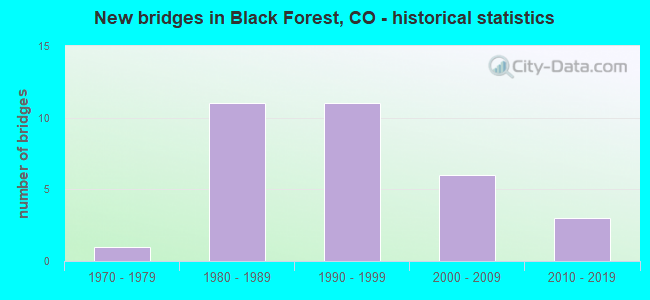
National Bridge Inventory (NBI) Statistics 32 Number of bridges194ft / 59.2m Total length $15,000 Total costs75,790 Total average daily traffic4,152 Total average daily truck traffic109,197 Total future (year 2040) average daily traffic
New bridges - historical statistics
1 1970-1979 11 1980-1989 11 1990-1999 6 2000-2009 3 2010-2019
See full National Bridge Inventory statistics for Black Forest, CO
FCC Registered Cell Phone Towers: 1 (
See the full list of FCC Registered Cell Phone Towers in Black Forest )
FCC Registered Antenna Towers: 57 (
See the full list of FCC Registered Antenna Towers )
FCC Registered Broadcast Land Mobile Towers: 1
Hodgen Rd 4.2 Mi Nnw (Lat: 39.070000 Lon: -104.743028), Structure height: 43 m, Call Sign: WNRB562, Assigned Frequencies: 154.463 MHz, 154.463 MHz, Grant Date: 12/18/2014, Expiration Date: 01/09/2025, Certifier: Ronald D Obermueller, Registrant: Lerman Senter Pllc, 2001 L Street, Nw, Suite 400, Washington, DC 20036, Phone: (202) 416-6749, Fax: (202) 293-7783, Email:
FCC Registered Microwave Towers: 9 (
See the full list of FCC Registered Microwave Towers in this town )
FCC Registered Paging Towers: 2 (
See the full list of FCC Registered Paging Towers )
FCC Registered Amateur Radio Licenses: 27 (
See the full list of FCC Registered Amateur Radio Licenses in Black Forest )
Home Mortgage Disclosure Act Aggregated Statistics For Year 2009(Based on 1 full and 3 partial tracts) A) FHA, FSA/RHS & VA B) Conventional C) Refinancings D) Home Improvement Loans E) Loans on Dwellings For 5+ Families F) Non-occupant Loans on G) Loans On Manufactured Number Average Value Number Average Value Number Average Value Number Average Value Number Average Value Number Average Value Number Average Value
LOANS ORIGINATED 265 $278,133 221 $297,482 1,476 $279,405 53 $106,593 0 $0 45 $254,702 15 $177,827 APPLICATIONS APPROVED, NOT ACCEPTED 20 $310,258 18 $356,464 132 $292,982 3 $38,217 0 $0 7 $252,019 2 $119,500 APPLICATIONS DENIED 22 $256,102 32 $333,763 290 $324,810 27 $59,320 1 $4,848,610 9 $262,913 7 $143,524 APPLICATIONS WITHDRAWN 31 $250,955 28 $285,185 229 $322,709 14 $60,156 0 $0 9 $227,589 4 $199,512 FILES CLOSED FOR INCOMPLETENESS 2 $361,110 4 $358,455 49 $293,305 2 $157,810 0 $0 1 $193,030 0 $0
Aggregated Statistics For Year 2008(Based on 1 full and 3 partial tracts) A) FHA, FSA/RHS & VA B) Conventional C) Refinancings D) Home Improvement Loans F) Non-occupant Loans on G) Loans On Manufactured Number Average Value Number Average Value Number Average Value Number Average Value Number Average Value Number Average Value
LOANS ORIGINATED 235 $277,134 330 $291,239 572 $284,399 59 $66,472 66 $257,271 11 $175,465 APPLICATIONS APPROVED, NOT ACCEPTED 17 $254,054 44 $346,639 93 $286,234 12 $59,454 8 $260,634 6 $169,953 APPLICATIONS DENIED 17 $253,076 57 $459,022 273 $323,390 49 $125,592 12 $237,511 2 $165,225 APPLICATIONS WITHDRAWN 14 $256,429 44 $362,557 146 $303,110 11 $83,667 10 $224,460 3 $185,813 FILES CLOSED FOR INCOMPLETENESS 1 $167,450 4 $678,570 38 $327,771 2 $118,280 1 $369,800 1 $203,970
Aggregated Statistics For Year 2007(Based on 1 full and 3 partial tracts) A) FHA, FSA/RHS & VA B) Conventional C) Refinancings D) Home Improvement Loans F) Non-occupant Loans on G) Loans On Manufactured Number Average Value Number Average Value Number Average Value Number Average Value Number Average Value Number Average Value
LOANS ORIGINATED 118 $278,244 592 $270,937 610 $275,626 136 $82,927 97 $268,761 16 $152,618 APPLICATIONS APPROVED, NOT ACCEPTED 9 $299,109 77 $292,640 123 $279,423 31 $91,248 15 $275,733 3 $182,783 APPLICATIONS DENIED 11 $197,447 100 $301,686 348 $306,807 59 $78,798 36 $303,111 7 $160,334 APPLICATIONS WITHDRAWN 11 $270,642 84 $245,485 201 $279,570 13 $91,101 16 $275,678 0 $0 FILES CLOSED FOR INCOMPLETENESS 0 $0 9 $406,591 48 $294,333 2 $186,335 4 $219,122 0 $0
Aggregated Statistics For Year 2006(Based on 1 full and 3 partial tracts) A) FHA, FSA/RHS & VA B) Conventional C) Refinancings D) Home Improvement Loans F) Non-occupant Loans on G) Loans On Manufactured Number Average Value Number Average Value Number Average Value Number Average Value Number Average Value Number Average Value
LOANS ORIGINATED 119 $292,987 987 $239,492 798 $239,001 146 $70,009 137 $212,312 9 $185,871 APPLICATIONS APPROVED, NOT ACCEPTED 7 $320,870 126 $261,661 153 $284,561 23 $101,145 19 $223,069 1 $123,330 APPLICATIONS DENIED 9 $316,531 147 $284,935 354 $289,542 53 $106,054 25 $434,343 12 $136,833 APPLICATIONS WITHDRAWN 16 $259,033 150 $243,282 273 $258,168 27 $108,896 21 $206,767 8 $152,998 FILES CLOSED FOR INCOMPLETENESS 1 $292,190 25 $240,850 50 $274,913 4 $32,815 5 $188,688 1 $160,670
Aggregated Statistics For Year 2005(Based on 1 full and 3 partial tracts) A) FHA, FSA/RHS & VA B) Conventional C) Refinancings D) Home Improvement Loans F) Non-occupant Loans on G) Loans On Manufactured Number Average Value Number Average Value Number Average Value Number Average Value Number Average Value Number Average Value
LOANS ORIGINATED 115 $271,016 1,076 $223,139 861 $223,761 108 $91,684 134 $206,525 16 $130,976 APPLICATIONS APPROVED, NOT ACCEPTED 10 $271,035 125 $212,049 124 $242,680 18 $99,678 13 $188,826 2 $141,430 APPLICATIONS DENIED 8 $227,438 173 $247,684 358 $248,831 50 $89,313 34 $228,321 8 $162,302 APPLICATIONS WITHDRAWN 11 $256,911 192 $206,369 260 $240,316 18 $107,500 30 $186,420 3 $161,423 FILES CLOSED FOR INCOMPLETENESS 2 $187,745 25 $217,621 79 $270,877 5 $43,332 2 $138,415 0 $0
Aggregated Statistics For Year 2004(Based on 1 full and 3 partial tracts) A) FHA, FSA/RHS & VA B) Conventional C) Refinancings D) Home Improvement Loans F) Non-occupant Loans on G) Loans On Manufactured Number Average Value Number Average Value Number Average Value Number Average Value Number Average Value Number Average Value
LOANS ORIGINATED 66 $222,123 796 $216,506 859 $237,888 84 $64,747 73 $190,477 17 $145,565 APPLICATIONS APPROVED, NOT ACCEPTED 7 $236,960 69 $231,492 116 $237,094 16 $45,552 7 $166,730 4 $84,672 APPLICATIONS DENIED 8 $206,276 122 $196,106 286 $231,767 38 $40,991 18 $182,248 7 $111,513 APPLICATIONS WITHDRAWN 12 $231,966 109 $232,627 235 $225,900 12 $85,225 13 $176,932 6 $137,788 FILES CLOSED FOR INCOMPLETENESS 0 $0 15 $172,095 59 $224,520 8 $50,412 2 $225,255 1 $48,100
Aggregated Statistics For Year 2003(Based on 1 full and 3 partial tracts) A) FHA, FSA/RHS & VA B) Conventional C) Refinancings D) Home Improvement Loans E) Loans on Dwellings For 5+ Families F) Non-occupant Loans on Number Average Value Number Average Value Number Average Value Number Average Value Number Average Value Number Average Value
LOANS ORIGINATED 76 $221,080 588 $232,929 2,153 $201,474 72 $74,091 1 $238,810 89 $168,181 APPLICATIONS APPROVED, NOT ACCEPTED 5 $233,350 63 $255,010 223 $219,051 5 $38,128 0 $0 8 $197,326 APPLICATIONS DENIED 5 $214,804 79 $246,282 385 $227,887 22 $67,359 0 $0 20 $161,992 APPLICATIONS WITHDRAWN 13 $224,505 90 $240,865 303 $220,451 22 $106,932 0 $0 14 $145,134 FILES CLOSED FOR INCOMPLETENESS 2 $164,955 8 $289,762 44 $220,939 0 $0 0 $0 1 $381,940
Aggregated Statistics For Year 1999(Based on 1 full tract) A) FHA, FSA/RHS & VA B) Conventional C) Refinancings D) Home Improvement Loans F) Non-occupant Loans on Number Average Value Number Average Value Number Average Value Number Average Value Number Average Value
LOANS ORIGINATED 51 $168,868 311 $177,561 378 $153,584 90 $31,216 23 $129,235 APPLICATIONS APPROVED, NOT ACCEPTED 3 $165,503 37 $180,606 61 $147,699 13 $28,370 4 $109,832 APPLICATIONS DENIED 5 $170,778 67 $169,876 106 $143,112 31 $35,353 3 $109,277 APPLICATIONS WITHDRAWN 9 $166,033 42 $186,357 85 $181,608 12 $52,177 3 $172,177 FILES CLOSED FOR INCOMPLETENESS 0 $0 4 $201,560 18 $151,844 2 $32,880 0 $0
Detailed HMDA statistics for the following Tracts:
0039.02
, 0072.00 , 0075.00 , 0076.00
Private Mortgage Insurance Companies Aggregated Statistics For Year 2009(Based on 1 full and 3 partial tracts) A) Conventional B) Refinancings C) Non-occupant Loans on Number Average Value Number Average Value Number Average Value
LOANS ORIGINATED 35 $290,021 41 $287,019 0 $0 APPLICATIONS APPROVED, NOT ACCEPTED 9 $274,860 8 $303,419 0 $0 APPLICATIONS DENIED 22 $320,109 18 $276,692 1 $78,670 APPLICATIONS WITHDRAWN 7 $332,347 4 $355,358 0 $0 FILES CLOSED FOR INCOMPLETENESS 2 $201,005 1 $228,370 0 $0
Aggregated Statistics For Year 2008(Based on 1 full and 3 partial tracts) A) Conventional B) Refinancings C) Non-occupant Loans on D) Loans On Manufactured Number Average Value Number Average Value Number Average Value Number Average Value
LOANS ORIGINATED 62 $291,618 43 $322,759 5 $276,182 1 $134,860 APPLICATIONS APPROVED, NOT ACCEPTED 22 $316,798 17 $281,379 3 $247,570 1 $134,860 APPLICATIONS DENIED 9 $316,221 3 $263,097 1 $326,300 0 $0 APPLICATIONS WITHDRAWN 6 $302,265 7 $348,249 1 $194,420 0 $0 FILES CLOSED FOR INCOMPLETENESS 2 $233,650 3 $532,657 2 $545,565 0 $0
Aggregated Statistics For Year 2007(Based on 1 full and 3 partial tracts) A) Conventional B) Refinancings C) Non-occupant Loans on D) Loans On Manufactured Number Average Value Number Average Value Number Average Value Number Average Value
LOANS ORIGINATED 79 $294,209 41 $323,306 8 $308,948 1 $196,380 APPLICATIONS APPROVED, NOT ACCEPTED 10 $275,571 8 $257,956 3 $241,757 0 $0 APPLICATIONS DENIED 1 $807,380 1 $736,010 0 $0 0 $0 APPLICATIONS WITHDRAWN 2 $439,940 3 $517,803 0 $0 0 $0 FILES CLOSED FOR INCOMPLETENESS 1 $925,930 1 $761,980 0 $0 0 $0
Aggregated Statistics For Year 2006(Based on 1 full and 3 partial tracts) A) Conventional B) Refinancings C) Non-occupant Loans on Number Average Value Number Average Value Number Average Value
LOANS ORIGINATED 29 $267,952 17 $333,131 4 $300,988 APPLICATIONS APPROVED, NOT ACCEPTED 8 $442,481 7 $292,253 0 $0 APPLICATIONS DENIED 2 $283,365 0 $0 0 $0 APPLICATIONS WITHDRAWN 2 $397,660 2 $328,465 0 $0 FILES CLOSED FOR INCOMPLETENESS 0 $0 0 $0 0 $0
Aggregated Statistics For Year 2005(Based on 1 full and 3 partial tracts) A) Conventional B) Refinancings C) Non-occupant Loans on Number Average Value Number Average Value Number Average Value
LOANS ORIGINATED 32 $306,889 29 $273,773 5 $310,100 APPLICATIONS APPROVED, NOT ACCEPTED 12 $301,570 9 $282,878 0 $0 APPLICATIONS DENIED 0 $0 0 $0 0 $0 APPLICATIONS WITHDRAWN 2 $342,790 5 $293,056 0 $0 FILES CLOSED FOR INCOMPLETENESS 0 $0 0 $0 0 $0
Aggregated Statistics For Year 2004(Based on 1 full and 3 partial tracts) A) Conventional B) Refinancings C) Non-occupant Loans on Number Average Value Number Average Value Number Average Value
LOANS ORIGINATED 49 $256,807 30 $273,453 8 $248,914 APPLICATIONS APPROVED, NOT ACCEPTED 18 $265,890 19 $228,249 2 $246,180 APPLICATIONS DENIED 1 $270,270 0 $0 0 $0 APPLICATIONS WITHDRAWN 4 $217,248 7 $224,276 1 $246,800 FILES CLOSED FOR INCOMPLETENESS 0 $0 0 $0 0 $0
Aggregated Statistics For Year 2003(Based on 1 full and 3 partial tracts) A) Conventional B) Refinancings C) Non-occupant Loans on Number Average Value Number Average Value Number Average Value
LOANS ORIGINATED 99 $254,604 128 $233,182 9 $215,413 APPLICATIONS APPROVED, NOT ACCEPTED 12 $256,252 32 $245,562 2 $179,810 APPLICATIONS DENIED 2 $205,680 0 $0 0 $0 APPLICATIONS WITHDRAWN 3 $295,683 4 $324,728 0 $0 FILES CLOSED FOR INCOMPLETENESS 1 $142,310 1 $222,000 0 $0
Aggregated Statistics For Year 1999(Based on 1 full tract) A) Conventional B) Refinancings C) Non-occupant Loans on Number Average Value Number Average Value Number Average Value
LOANS ORIGINATED 93 $189,360 23 $186,498 2 $123,415 APPLICATIONS APPROVED, NOT ACCEPTED 2 $177,735 7 $208,571 0 $0 APPLICATIONS DENIED 6 $237,138 3 $190,600 0 $0 APPLICATIONS WITHDRAWN 3 $276,370 6 $184,088 0 $0 FILES CLOSED FOR INCOMPLETENESS 2 $190,125 1 $190,600 0 $0
Detailed PMIC statistics for the following Tracts:
0039.02
, 0072.00 , 0075.00 , 0076.00 Black Forest compared to Colorado state average:
Median household income above state average. Median house value above state average. Unemployed percentage significantly below state average. Hispanic race population percentage significantly below state average. Median age above state average. Foreign-born population percentage below state average. Renting percentage significantly below state average. Length of stay since moving in significantly above state average. Number of rooms per house significantly above state average. House age below state average. Percentage of population with a bachelor's degree or higher above state average. Black Forest on our top lists :
#11 on the list of "Top 100 highest located cities (pop. 5,000+)"
#29 on the list of "Top 101 cities with the least people driving a car to work alone (population 5,000+)"
#73 on the list of "Top 101 cities with the most cars per house, population 5,000+"
#92 on the list of "Top 101 cities with largest percentage of females in occupations: architecture and engineering occupations (population 5,000+)"
#30 on the list of "Top 101 counties with the highest percentage of residents relocating from foreign countries between 2010 and 2011 (pop. 50,000+)"
#32 on the list of "Top 101 counties with the lowest average weight of females"
#39 on the list of "Top 101 counties with the highest percentage of residents that exercised in the past month"
#42 on the list of "Top 101 counties with the highest percentage of residents relocating to foreign countries in 2011 (pop. 50,000+)"
#43 on the list of "Top 101 counties with the highest Particulate Matter (PM10 ) Annual air pollution readings in 2012 (µg/m3 )"
Top Patent Applicants
Roger V. Ritchie (2)
James E. Cannon (1)
John Meleski (1)
Total of 4 patent applications in 2008-2024.


 Recent articles from our blog. Our writers, many of them Ph.D. graduates or candidates, create easy-to-read articles on a wide variety of topics.

 (13.5 miles
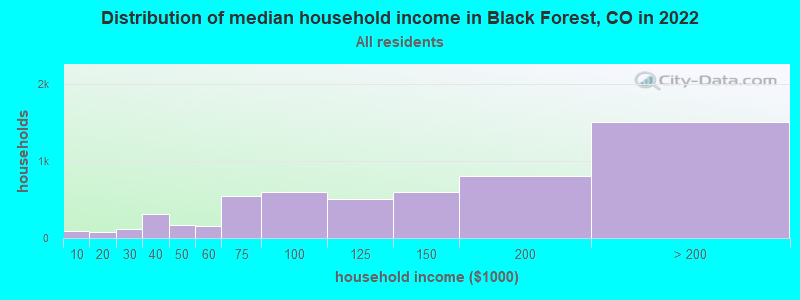
 Based on the data from the years 2003 - 2018 the average number of fire incidents per year is 25. The highest number of fires - 113 took place in 2013, and the least - 3 in 2003. The data has a growing trend.
 When looking into fire subcategories, the most incidents belonged to: Outside Fires (53.0%), and Structure Fires (38.6%).