Blytheville, Arkansas Submit your own pictures of this city and show them to the world
OSM Map
General Map
Google Map
MSN Map
OSM Map
General Map
Google Map
MSN Map
OSM Map
General Map
Google Map
MSN Map
OSM Map
General Map
Google Map
MSN Map
Please wait while loading the map...
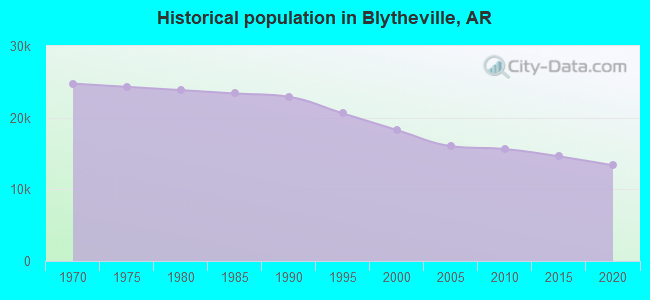
Population in 2022: 12,706 (92% urban, 8% rural). Population change since 2000: -30.5%Males: 5,502 Females: 7,204
March 2022 cost of living index in Blytheville: 78.3 (low, U.S. average is 100) Percentage of residents living in poverty in 2022: 23.4%for White Non-Hispanic residents , 31.0% for Black residents , 9.0% for Hispanic or Latino residents , 100.0% for Native Hawaiian and other Pacific Islander residents , 2.4% for other race residents , 19.0% for two or more races residents )
Profiles of local businesses
Business Search - 14 Million verified businesses
Data:
Median household income ($)
Median household income (% change since 2000)
Household income diversity
Ratio of average income to average house value (%)
Ratio of average income to average rent
Median household income ($) - White
Median household income ($) - Black or African American
Median household income ($) - Asian
Median household income ($) - Hispanic or Latino
Median household income ($) - American Indian and Alaska Native
Median household income ($) - Multirace
Median household income ($) - Other Race
Median household income for houses/condos with a mortgage ($)
Median household income for apartments without a mortgage ($)
Races - White alone (%)
Races - White alone (% change since 2000)
Races - Black alone (%)
Races - Black alone (% change since 2000)
Races - American Indian alone (%)
Races - American Indian alone (% change since 2000)
Races - Asian alone (%)
Races - Asian alone (% change since 2000)
Races - Hispanic (%)
Races - Hispanic (% change since 2000)
Races - Native Hawaiian and Other Pacific Islander alone (%)
Races - Native Hawaiian and Other Pacific Islander alone (% change since 2000)
Races - Two or more races (%)
Races - Two or more races (% change since 2000)
Races - Other race alone (%)
Races - Other race alone (% change since 2000)
Racial diversity
Unemployment (%)
Unemployment (% change since 2000)
Unemployment (%) - White
Unemployment (%) - Black or African American
Unemployment (%) - Asian
Unemployment (%) - Hispanic or Latino
Unemployment (%) - American Indian and Alaska Native
Unemployment (%) - Multirace
Unemployment (%) - Other Race
Population density (people per square mile)
Population - Males (%)
Population - Females (%)
Population - Males (%) - White
Population - Males (%) - Black or African American
Population - Males (%) - Asian
Population - Males (%) - Hispanic or Latino
Population - Males (%) - American Indian and Alaska Native
Population - Males (%) - Multirace
Population - Males (%) - Other Race
Population - Females (%) - White
Population - Females (%) - Black or African American
Population - Females (%) - Asian
Population - Females (%) - Hispanic or Latino
Population - Females (%) - American Indian and Alaska Native
Population - Females (%) - Multirace
Population - Females (%) - Other Race
Coronavirus confirmed cases (Apr 27, 2024)
Deaths caused by coronavirus (Apr 27, 2024)
Coronavirus confirmed cases (per 100k population) (Apr 27, 2024)
Deaths caused by coronavirus (per 100k population) (Apr 27, 2024)
Daily increase in number of cases (Apr 27, 2024)
Weekly increase in number of cases (Apr 27, 2024)
Cases doubled (in days) (Apr 27, 2024)
Hospitalized patients (Apr 18, 2022)
Negative test results (Apr 18, 2022)
Total test results (Apr 18, 2022)
COVID Vaccine doses distributed (per 100k population) (Sep 19, 2023)
COVID Vaccine doses administered (per 100k population) (Sep 19, 2023)
COVID Vaccine doses distributed (Sep 19, 2023)
COVID Vaccine doses administered (Sep 19, 2023)
Likely homosexual households (%)
Likely homosexual households (% change since 2000)
Likely homosexual households - Lesbian couples (%)
Likely homosexual households - Lesbian couples (% change since 2000)
Likely homosexual households - Gay men (%)
Likely homosexual households - Gay men (% change since 2000)
Cost of living index
Median gross rent ($)
Median contract rent ($)
Median monthly housing costs ($)
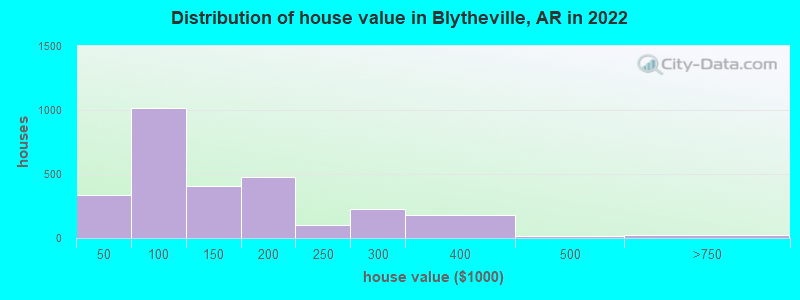
Median house or condo value ($)
Median house or condo value ($ change since 2000)
Mean house or condo value by units in structure - 1, detached ($)
Mean house or condo value by units in structure - 1, attached ($)
Mean house or condo value by units in structure - 2 ($)
Mean house or condo value by units in structure by units in structure - 3 or 4 ($)
Mean house or condo value by units in structure - 5 or more ($)
Mean house or condo value by units in structure - Boat, RV, van, etc. ($)
Mean house or condo value by units in structure - Mobile home ($)
Median house or condo value ($) - White
Median house or condo value ($) - Black or African American
Median house or condo value ($) - Asian
Median house or condo value ($) - Hispanic or Latino
Median house or condo value ($) - American Indian and Alaska Native
Median house or condo value ($) - Multirace
Median house or condo value ($) - Other Race
Median resident age
Resident age diversity
Median resident age - Males
Median resident age - Females
Median resident age - White
Median resident age - Black or African American
Median resident age - Asian
Median resident age - Hispanic or Latino
Median resident age - American Indian and Alaska Native
Median resident age - Multirace
Median resident age - Other Race
Median resident age - Males - White
Median resident age - Males - Black or African American
Median resident age - Males - Asian
Median resident age - Males - Hispanic or Latino
Median resident age - Males - American Indian and Alaska Native
Median resident age - Males - Multirace
Median resident age - Males - Other Race
Median resident age - Females - White
Median resident age - Females - Black or African American
Median resident age - Females - Asian
Median resident age - Females - Hispanic or Latino
Median resident age - Females - American Indian and Alaska Native
Median resident age - Females - Multirace
Median resident age - Females - Other Race
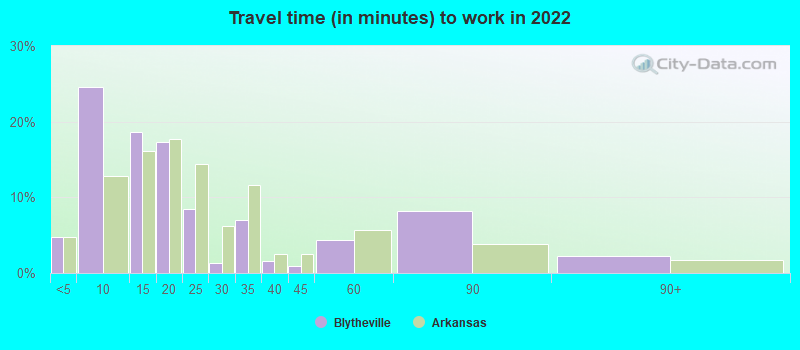
Commute - mean travel time to work (minutes)
Travel time to work - Less than 5 minutes (%)
Travel time to work - Less than 5 minutes (% change since 2000)
Travel time to work - 5 to 9 minutes (%)
Travel time to work - 5 to 9 minutes (% change since 2000)
Travel time to work - 10 to 19 minutes (%)
Travel time to work - 10 to 19 minutes (% change since 2000)
Travel time to work - 20 to 29 minutes (%)
Travel time to work - 20 to 29 minutes (% change since 2000)
Travel time to work - 30 to 39 minutes (%)
Travel time to work - 30 to 39 minutes (% change since 2000)
Travel time to work - 40 to 59 minutes (%)
Travel time to work - 40 to 59 minutes (% change since 2000)
Travel time to work - 60 to 89 minutes (%)
Travel time to work - 60 to 89 minutes (% change since 2000)
Travel time to work - 90 or more minutes (%)
Travel time to work - 90 or more minutes (% change since 2000)
Marital status - Never married (%)
Marital status - Now married (%)
Marital status - Separated (%)
Marital status - Widowed (%)
Marital status - Divorced (%)
Median family income ($)
Median family income (% change since 2000)
Median non-family income ($)
Median non-family income (% change since 2000)
Median per capita income ($)
Median per capita income (% change since 2000)
Median family income ($) - White
Median family income ($) - Black or African American
Median family income ($) - Asian
Median family income ($) - Hispanic or Latino
Median family income ($) - American Indian and Alaska Native
Median family income ($) - Multirace
Median family income ($) - Other Race
Median year house/condo built
Median year apartment built
Year house built - Built 2005 or later (%)
Year house built - Built 2000 to 2004 (%)
Year house built - Built 1990 to 1999 (%)
Year house built - Built 1980 to 1989 (%)
Year house built - Built 1970 to 1979 (%)
Year house built - Built 1960 to 1969 (%)
Year house built - Built 1950 to 1959 (%)
Year house built - Built 1940 to 1949 (%)
Year house built - Built 1939 or earlier (%)
Average household size
Household density (households per square mile)
Average household size - White
Average household size - Black or African American
Average household size - Asian
Average household size - Hispanic or Latino
Average household size - American Indian and Alaska Native
Average household size - Multirace
Average household size - Other Race
Occupied housing units (%)
Vacant housing units (%)
Owner occupied housing units (%)
Renter occupied housing units (%)
Vacancy status - For rent (%)
Vacancy status - For sale only (%)
Vacancy status - Rented or sold, not occupied (%)
Vacancy status - For seasonal, recreational, or occasional use (%)
Vacancy status - For migrant workers (%)
Vacancy status - Other vacant (%)
Residents with income below the poverty level (%)
Residents with income below 50% of the poverty level (%)
Children below poverty level (%)
Poor families by family type - Married-couple family (%)
Poor families by family type - Male, no wife present (%)
Poor families by family type - Female, no husband present (%)
Poverty status for native-born residents (%)
Poverty status for foreign-born residents (%)
Poverty among high school graduates not in families (%)
Poverty among people who did not graduate high school not in families (%)
Residents with income below the poverty level (%) - White
Residents with income below the poverty level (%) - Black or African American
Residents with income below the poverty level (%) - Asian
Residents with income below the poverty level (%) - Hispanic or Latino
Residents with income below the poverty level (%) - American Indian and Alaska Native
Residents with income below the poverty level (%) - Multirace
Residents with income below the poverty level (%) - Other Race
Air pollution - Air Quality Index (AQI)
Air pollution - CO
Air pollution - NO2
Air pollution - SO2
Air pollution - Ozone
Air pollution - PM10
Air pollution - PM25
Air pollution - Pb
Crime - Murders per 100,000 population
Crime - Rapes per 100,000 population
Crime - Robberies per 100,000 population
Crime - Assaults per 100,000 population
Crime - Burglaries per 100,000 population
Crime - Thefts per 100,000 population
Crime - Auto thefts per 100,000 population
Crime - Arson per 100,000 population
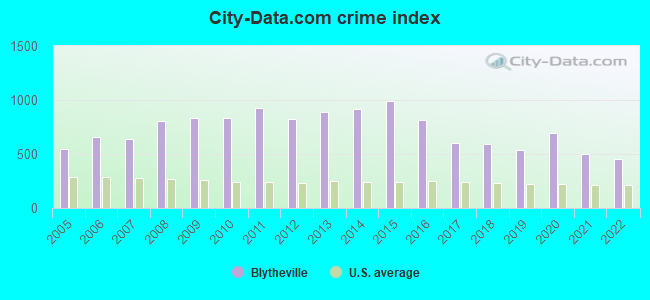
Crime - City-data.com crime index
Crime - Violent crime index
Crime - Property crime index
Crime - Murders per 100,000 population (5 year average)
Crime - Rapes per 100,000 population (5 year average)
Crime - Robberies per 100,000 population (5 year average)
Crime - Assaults per 100,000 population (5 year average)
Crime - Burglaries per 100,000 population (5 year average)
Crime - Thefts per 100,000 population (5 year average)
Crime - Auto thefts per 100,000 population (5 year average)
Crime - Arson per 100,000 population (5 year average)
Crime - City-data.com crime index (5 year average)
Crime - Violent crime index (5 year average)
Crime - Property crime index (5 year average)
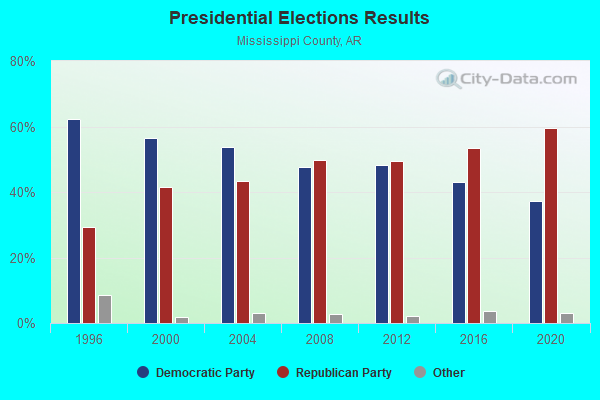
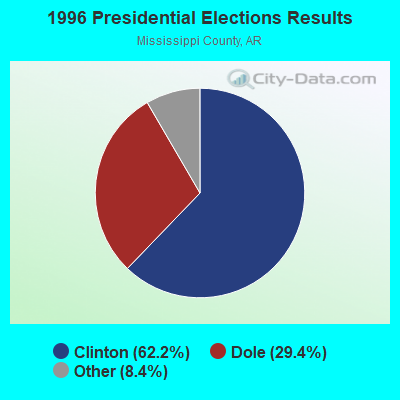
1996 Presidential Elections Results (%) - Democratic Party (Clinton)
1996 Presidential Elections Results (%) - Republican Party (Dole)
1996 Presidential Elections Results (%) - Other
2000 Presidential Elections Results (%) - Democratic Party (Gore)
2000 Presidential Elections Results (%) - Republican Party (Bush)
2000 Presidential Elections Results (%) - Other
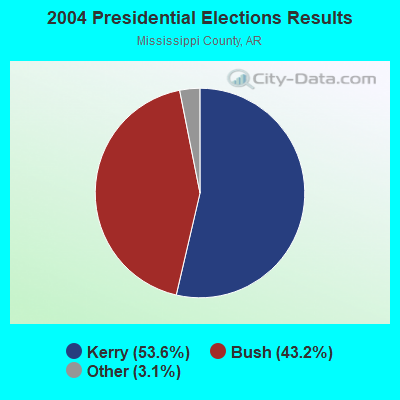
2004 Presidential Elections Results (%) - Democratic Party (Kerry)
2004 Presidential Elections Results (%) - Republican Party (Bush)
2004 Presidential Elections Results (%) - Other
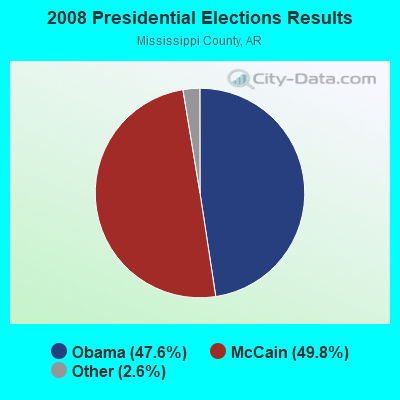
2008 Presidential Elections Results (%) - Democratic Party (Obama)
2008 Presidential Elections Results (%) - Republican Party (McCain)
2008 Presidential Elections Results (%) - Other
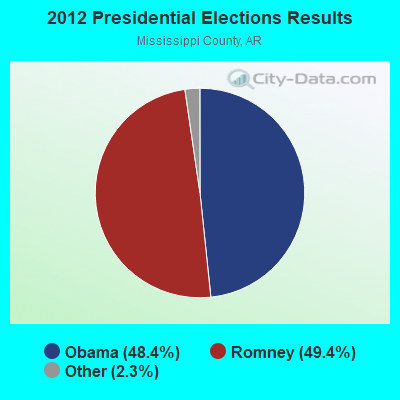
2012 Presidential Elections Results (%) - Democratic Party (Obama)
2012 Presidential Elections Results (%) - Republican Party (Romney)
2012 Presidential Elections Results (%) - Other
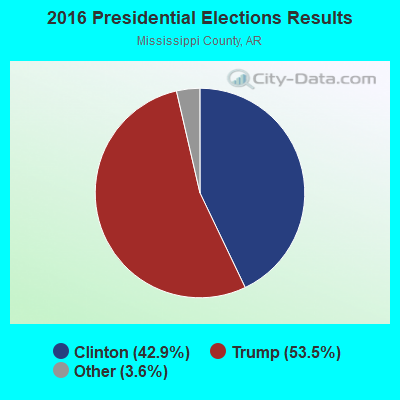
2016 Presidential Elections Results (%) - Democratic Party (Clinton)
2016 Presidential Elections Results (%) - Republican Party (Trump)
2016 Presidential Elections Results (%) - Other
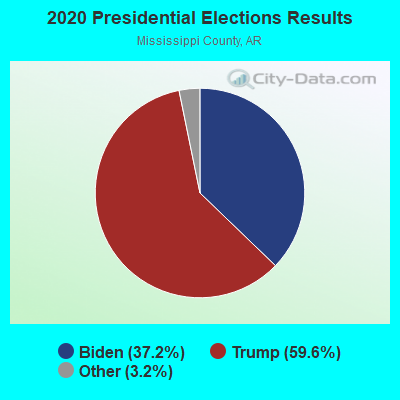
2020 Presidential Elections Results (%) - Democratic Party (Biden)
2020 Presidential Elections Results (%) - Republican Party (Trump)
2020 Presidential Elections Results (%) - Other
Ancestries Reported - Arab (%)
Ancestries Reported - Czech (%)
Ancestries Reported - Danish (%)
Ancestries Reported - Dutch (%)
Ancestries Reported - English (%)
Ancestries Reported - French (%)
Ancestries Reported - French Canadian (%)
Ancestries Reported - German (%)
Ancestries Reported - Greek (%)
Ancestries Reported - Hungarian (%)
Ancestries Reported - Irish (%)
Ancestries Reported - Italian (%)
Ancestries Reported - Lithuanian (%)
Ancestries Reported - Norwegian (%)
Ancestries Reported - Polish (%)
Ancestries Reported - Portuguese (%)
Ancestries Reported - Russian (%)
Ancestries Reported - Scotch-Irish (%)
Ancestries Reported - Scottish (%)
Ancestries Reported - Slovak (%)
Ancestries Reported - Subsaharan African (%)
Ancestries Reported - Swedish (%)
Ancestries Reported - Swiss (%)
Ancestries Reported - Ukrainian (%)
Ancestries Reported - United States (%)
Ancestries Reported - Welsh (%)
Ancestries Reported - West Indian (%)
Ancestries Reported - Other (%)
Educational Attainment - No schooling completed (%)
Educational Attainment - Less than high school (%)
Educational Attainment - High school or equivalent (%)
Educational Attainment - Less than 1 year of college (%)
Educational Attainment - 1 or more years of college (%)
Educational Attainment - Associate degree (%)
Educational Attainment - Bachelor's degree (%)
Educational Attainment - Master's degree (%)
Educational Attainment - Professional school degree (%)
Educational Attainment - Doctorate degree (%)
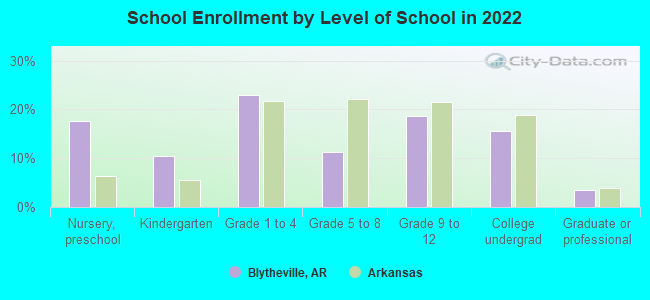
School Enrollment - Nursery, preschool (%)
School Enrollment - Kindergarten (%)
School Enrollment - Grade 1 to 4 (%)
School Enrollment - Grade 5 to 8 (%)
School Enrollment - Grade 9 to 12 (%)
School Enrollment - College undergrad (%)
School Enrollment - Graduate or professional (%)
School Enrollment - Not enrolled in school (%)
School enrollment - Public schools (%)
School enrollment - Private schools (%)
School enrollment - Not enrolled (%)
Median number of rooms in houses and condos
Median number of rooms in apartments
Housing units lacking complete plumbing facilities (%)
Housing units lacking complete kitchen facilities (%)
Density of houses
Urban houses (%)
Rural houses (%)
Households with people 60 years and over (%)
Households with people 65 years and over (%)
Households with people 75 years and over (%)
Households with one or more nonrelatives (%)
Households with no nonrelatives (%)
Population in households (%)
Family households (%)
Nonfamily households (%)
Population in families (%)
Family households with own children (%)
Median number of bedrooms in owner occupied houses
Mean number of bedrooms in owner occupied houses
Median number of bedrooms in renter occupied houses
Mean number of bedrooms in renter occupied houses
Median number of vehichles in owner occupied houses
Mean number of vehichles in owner occupied houses
Median number of vehichles in renter occupied houses
Mean number of vehichles in renter occupied houses
Mortgage status - with mortgage (%)
Mortgage status - with second mortgage (%)
Mortgage status - with home equity loan (%)
Mortgage status - with both second mortgage and home equity loan (%)
Mortgage status - without a mortgage (%)
Average family size
Average family size - White
Average family size - Black or African American
Average family size - Asian
Average family size - Hispanic or Latino
Average family size - American Indian and Alaska Native
Average family size - Multirace
Average family size - Other Race
Geographical mobility - Same house 1 year ago (%)
Geographical mobility - Moved within same county (%)
Geographical mobility - Moved from different county within same state (%)
Geographical mobility - Moved from different state (%)
Geographical mobility - Moved from abroad (%)
Place of birth - Born in state of residence (%)
Place of birth - Born in other state (%)
Place of birth - Native, outside of US (%)
Place of birth - Foreign born (%)
Housing units in structures - 1, detached (%)
Housing units in structures - 1, attached (%)
Housing units in structures - 2 (%)
Housing units in structures - 3 or 4 (%)
Housing units in structures - 5 to 9 (%)
Housing units in structures - 10 to 19 (%)
Housing units in structures - 20 to 49 (%)
Housing units in structures - 50 or more (%)
Housing units in structures - Mobile home (%)
Housing units in structures - Boat, RV, van, etc. (%)
House/condo owner moved in on average (years ago)
Renter moved in on average (years ago)
Year householder moved into unit - Moved in 1999 to March 2000 (%)
Year householder moved into unit - Moved in 1995 to 1998 (%)
Year householder moved into unit - Moved in 1990 to 1994 (%)
Year householder moved into unit - Moved in 1980 to 1989 (%)
Year householder moved into unit - Moved in 1970 to 1979 (%)
Year householder moved into unit - Moved in 1969 or earlier (%)
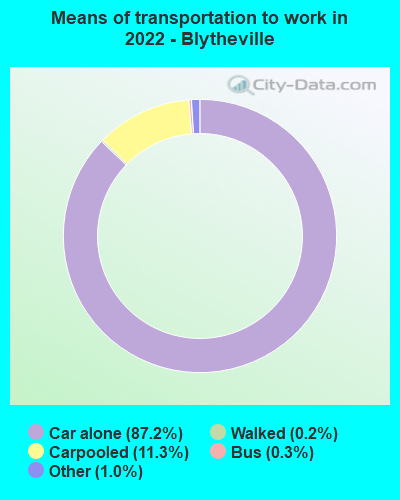
Means of transportation to work - Drove car alone (%)
Means of transportation to work - Carpooled (%)
Means of transportation to work - Public transportation (%)
Means of transportation to work - Bus or trolley bus (%)
Means of transportation to work - Streetcar or trolley car (%)
Means of transportation to work - Subway or elevated (%)
Means of transportation to work - Railroad (%)
Means of transportation to work - Ferryboat (%)
Means of transportation to work - Taxicab (%)
Means of transportation to work - Motorcycle (%)
Means of transportation to work - Bicycle (%)
Means of transportation to work - Walked (%)
Means of transportation to work - Other means (%)
Working at home (%)
Industry diversity
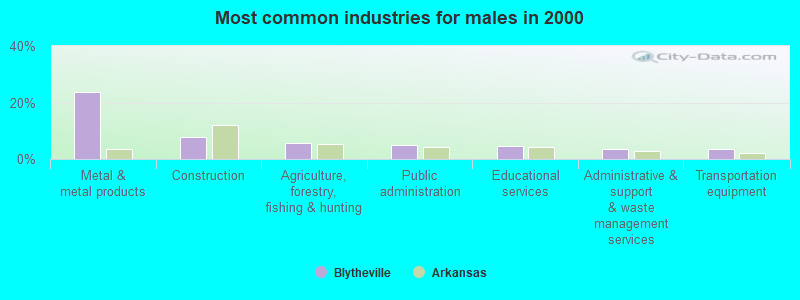
Most Common Industries - Agriculture, forestry, fishing and hunting, and mining (%)
Most Common Industries - Agriculture, forestry, fishing and hunting (%)
Most Common Industries - Mining, quarrying, and oil and gas extraction (%)
Most Common Industries - Construction (%)
Most Common Industries - Manufacturing (%)
Most Common Industries - Wholesale trade (%)
Most Common Industries - Retail trade (%)
Most Common Industries - Transportation and warehousing, and utilities (%)
Most Common Industries - Transportation and warehousing (%)
Most Common Industries - Utilities (%)
Most Common Industries - Information (%)
Most Common Industries - Finance and insurance, and real estate and rental and leasing (%)
Most Common Industries - Finance and insurance (%)
Most Common Industries - Real estate and rental and leasing (%)
Most Common Industries - Professional, scientific, and management, and administrative and waste management services (%)
Most Common Industries - Professional, scientific, and technical services (%)
Most Common Industries - Management of companies and enterprises (%)
Most Common Industries - Administrative and support and waste management services (%)
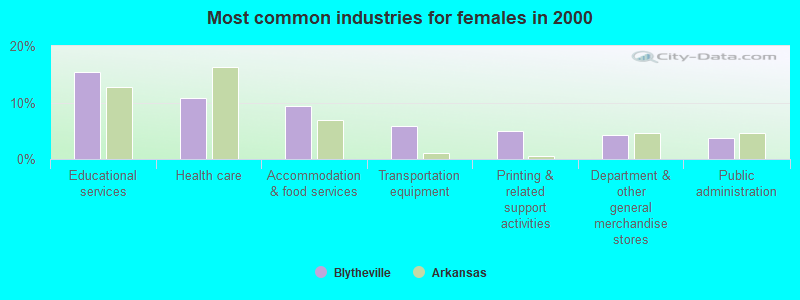
Most Common Industries - Educational services, and health care and social assistance (%)
Most Common Industries - Educational services (%)
Most Common Industries - Health care and social assistance (%)
Most Common Industries - Arts, entertainment, and recreation, and accommodation and food services (%)
Most Common Industries - Arts, entertainment, and recreation (%)
Most Common Industries - Accommodation and food services (%)
Most Common Industries - Other services, except public administration (%)
Most Common Industries - Public administration (%)
Occupation diversity
Most Common Occupations - Management, business, science, and arts occupations (%)
Most Common Occupations - Management, business, and financial occupations (%)
Most Common Occupations - Management occupations (%)
Most Common Occupations - Business and financial operations occupations (%)
Most Common Occupations - Computer, engineering, and science occupations (%)
Most Common Occupations - Computer and mathematical occupations (%)
Most Common Occupations - Architecture and engineering occupations (%)
Most Common Occupations - Life, physical, and social science occupations (%)
Most Common Occupations - Education, legal, community service, arts, and media occupations (%)
Most Common Occupations - Community and social service occupations (%)
Most Common Occupations - Legal occupations (%)
Most Common Occupations - Education, training, and library occupations (%)
Most Common Occupations - Arts, design, entertainment, sports, and media occupations (%)
Most Common Occupations - Healthcare practitioners and technical occupations (%)
Most Common Occupations - Health diagnosing and treating practitioners and other technical occupations (%)
Most Common Occupations - Health technologists and technicians (%)
Most Common Occupations - Service occupations (%)
Most Common Occupations - Healthcare support occupations (%)
Most Common Occupations - Protective service occupations (%)
Most Common Occupations - Fire fighting and prevention, and other protective service workers including supervisors (%)
Most Common Occupations - Law enforcement workers including supervisors (%)
Most Common Occupations - Food preparation and serving related occupations (%)
Most Common Occupations - Building and grounds cleaning and maintenance occupations (%)
Most Common Occupations - Personal care and service occupations (%)
Most Common Occupations - Sales and office occupations (%)
Most Common Occupations - Sales and related occupations (%)
Most Common Occupations - Office and administrative support occupations (%)
Most Common Occupations - Natural resources, construction, and maintenance occupations (%)
Most Common Occupations - Farming, fishing, and forestry occupations (%)
Most Common Occupations - Construction and extraction occupations (%)
Most Common Occupations - Installation, maintenance, and repair occupations (%)
Most Common Occupations - Production, transportation, and material moving occupations (%)
Most Common Occupations - Production occupations (%)
Most Common Occupations - Transportation occupations (%)
Most Common Occupations - Material moving occupations (%)
People in Group quarters - Institutionalized population (%)
People in Group quarters - Correctional institutions (%)
People in Group quarters - Federal prisons and detention centers (%)
People in Group quarters - Halfway houses (%)
People in Group quarters - Local jails and other confinement facilities (including police lockups) (%)
People in Group quarters - Military disciplinary barracks (%)
People in Group quarters - State prisons (%)
People in Group quarters - Other types of correctional institutions (%)
People in Group quarters - Nursing homes (%)
People in Group quarters - Hospitals/wards, hospices, and schools for the handicapped (%)
People in Group quarters - Hospitals/wards and hospices for chronically ill (%)
People in Group quarters - Hospices or homes for chronically ill (%)
People in Group quarters - Military hospitals or wards for chronically ill (%)
People in Group quarters - Other hospitals or wards for chronically ill (%)
People in Group quarters - Hospitals or wards for drug/alcohol abuse (%)
People in Group quarters - Mental (Psychiatric) hospitals or wards (%)
People in Group quarters - Schools, hospitals, or wards for the mentally retarded (%)
People in Group quarters - Schools, hospitals, or wards for the physically handicapped (%)
People in Group quarters - Institutions for the deaf (%)
People in Group quarters - Institutions for the blind (%)
People in Group quarters - Orthopedic wards and institutions for the physically handicapped (%)
People in Group quarters - Wards in general hospitals for patients who have no usual home elsewhere (%)
People in Group quarters - Wards in military hospitals for patients who have no usual home elsewhere (%)
People in Group quarters - Juvenile institutions (%)
People in Group quarters - Long-term care (%)
People in Group quarters - Homes for abused, dependent, and neglected children (%)
People in Group quarters - Residential treatment centers for emotionally disturbed children (%)
People in Group quarters - Training schools for juvenile delinquents (%)
People in Group quarters - Short-term care, detention or diagnostic centers for delinquent children (%)
People in Group quarters - Type of juvenile institution unknown (%)
People in Group quarters - Noninstitutionalized population (%)
People in Group quarters - College dormitories (includes college quarters off campus) (%)
People in Group quarters - Military quarters (%)
People in Group quarters - On base (%)
People in Group quarters - Barracks, unaccompanied personnel housing (UPH), (Enlisted/Officer), ;and similar group living quarters for military personnel (%)
People in Group quarters - Transient quarters for temporary residents (%)
People in Group quarters - Military ships (%)
People in Group quarters - Group homes (%)
People in Group quarters - Homes or halfway houses for drug/alcohol abuse (%)
People in Group quarters - Homes for the mentally ill (%)
People in Group quarters - Homes for the mentally retarded (%)
People in Group quarters - Homes for the physically handicapped (%)
People in Group quarters - Other group homes (%)
People in Group quarters - Religious group quarters (%)
People in Group quarters - Dormitories (%)
People in Group quarters - Agriculture workers' dormitories on farms (%)
People in Group quarters - Job Corps and vocational training facilities (%)
People in Group quarters - Other workers' dormitories (%)
People in Group quarters - Crews of maritime vessels (%)
People in Group quarters - Other nonhousehold living situations (%)
People in Group quarters - Other noninstitutional group quarters (%)
Residents speaking English at home (%)
Residents speaking English at home - Born in the United States (%)
Residents speaking English at home - Native, born elsewhere (%)
Residents speaking English at home - Foreign born (%)
Residents speaking Spanish at home (%)
Residents speaking Spanish at home - Born in the United States (%)
Residents speaking Spanish at home - Native, born elsewhere (%)
Residents speaking Spanish at home - Foreign born (%)
Residents speaking other language at home (%)
Residents speaking other language at home - Born in the United States (%)
Residents speaking other language at home - Native, born elsewhere (%)
Residents speaking other language at home - Foreign born (%)
Class of Workers - Employee of private company (%)
Class of Workers - Self-employed in own incorporated business (%)
Class of Workers - Private not-for-profit wage and salary workers (%)
Class of Workers - Local government workers (%)
Class of Workers - State government workers (%)
Class of Workers - Federal government workers (%)
Class of Workers - Self-employed workers in own not incorporated business and Unpaid family workers (%)
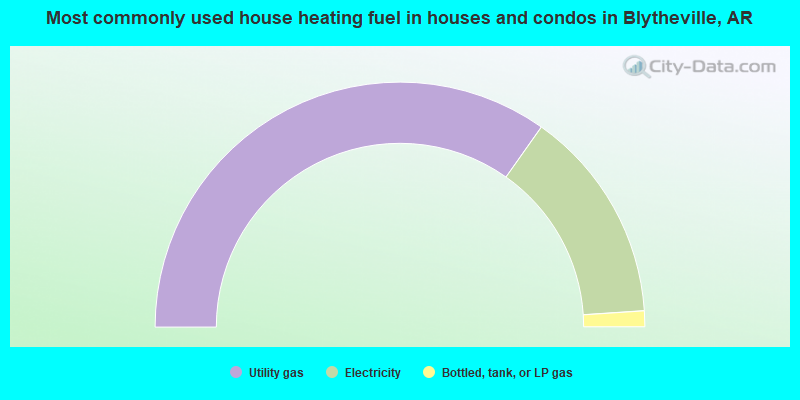
House heating fuel used in houses and condos - Utility gas (%)
House heating fuel used in houses and condos - Bottled, tank, or LP gas (%)
House heating fuel used in houses and condos - Electricity (%)
House heating fuel used in houses and condos - Fuel oil, kerosene, etc. (%)
House heating fuel used in houses and condos - Coal or coke (%)
House heating fuel used in houses and condos - Wood (%)
House heating fuel used in houses and condos - Solar energy (%)
House heating fuel used in houses and condos - Other fuel (%)
House heating fuel used in houses and condos - No fuel used (%)
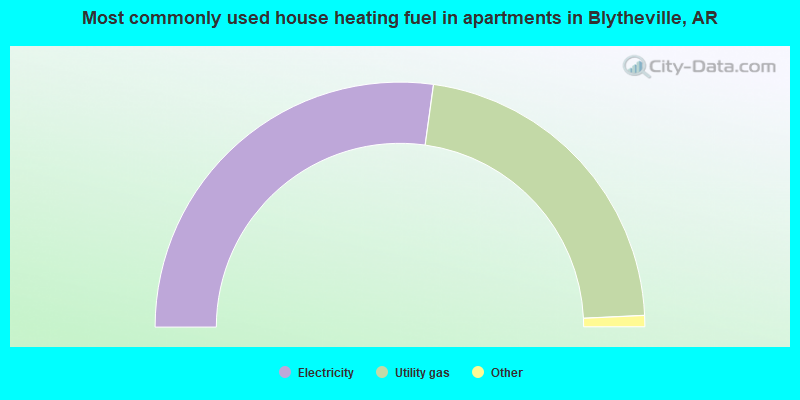
House heating fuel used in apartments - Utility gas (%)
House heating fuel used in apartments - Bottled, tank, or LP gas (%)
House heating fuel used in apartments - Electricity (%)
House heating fuel used in apartments - Fuel oil, kerosene, etc. (%)
House heating fuel used in apartments - Coal or coke (%)
House heating fuel used in apartments - Wood (%)
House heating fuel used in apartments - Solar energy (%)
House heating fuel used in apartments - Other fuel (%)
House heating fuel used in apartments - No fuel used (%)
Armed forces status - In Armed Forces (%)
Armed forces status - Civilian (%)
Armed forces status - Civilian - Veteran (%)
Armed forces status - Civilian - Nonveteran (%)
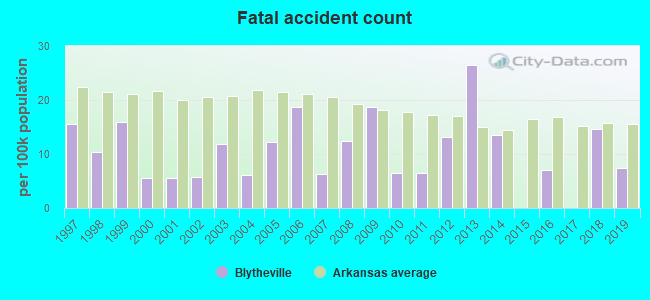
Fatal accidents locations in years 2005-2021
Fatal accidents locations in 2005
Fatal accidents locations in 2006
Fatal accidents locations in 2007
Fatal accidents locations in 2008
Fatal accidents locations in 2009
Fatal accidents locations in 2010
Fatal accidents locations in 2011
Fatal accidents locations in 2012
Fatal accidents locations in 2013
Fatal accidents locations in 2014
Fatal accidents locations in 2015
Fatal accidents locations in 2016
Fatal accidents locations in 2017
Fatal accidents locations in 2018
Fatal accidents locations in 2019
Fatal accidents locations in 2020
Fatal accidents locations in 2021
Alcohol use - People drinking some alcohol every month (%)
Alcohol use - People not drinking at all (%)
Alcohol use - Average days/month drinking alcohol
Alcohol use - Average drinks/week
Alcohol use - Average days/year people drink much
Audiometry - Average condition of hearing (%)
Audiometry - People that can hear a whisper from across a quiet room (%)
Audiometry - People that can hear normal voice from across a quiet room (%)
Audiometry - Ears ringing, roaring, buzzing (%)
Audiometry - Had a job exposure to loud noise (%)
Audiometry - Had off-work exposure to loud noise (%)
Blood Pressure & Cholesterol - Has high blood pressure (%)
Blood Pressure & Cholesterol - Checking blood pressure at home (%)
Blood Pressure & Cholesterol - Frequently checking blood cholesterol (%)
Blood Pressure & Cholesterol - Has high cholesterol level (%)
Consumer Behavior - Money monthly spent on food at supermarket/grocery store
Consumer Behavior - Money monthly spent on food at other stores
Consumer Behavior - Money monthly spent on eating out
Consumer Behavior - Money monthly spent on carryout/delivered foods
Consumer Behavior - Income spent on food at supermarket/grocery store (%)
Consumer Behavior - Income spent on food at other stores (%)
Consumer Behavior - Income spent on eating out (%)
Consumer Behavior - Income spent on carryout/delivered foods (%)
Current Health Status - General health condition (%)
Current Health Status - Blood donors (%)
Current Health Status - Has blood ever tested for HIV virus (%)
Current Health Status - Left-handed people (%)
Dermatology - People using sunscreen (%)
Diabetes - Diabetics (%)
Diabetes - Had a blood test for high blood sugar (%)
Diabetes - People taking insulin (%)
Diet Behavior & Nutrition - Diet health (%)
Diet Behavior & Nutrition - Milk product consumption (# of products/month)
Diet Behavior & Nutrition - Meals not home prepared (#/week)
Diet Behavior & Nutrition - Meals from fast food or pizza place (#/week)
Diet Behavior & Nutrition - Ready-to-eat foods (#/month)
Diet Behavior & Nutrition - Frozen meals/pizza (#/month)
Drug Use - People that ever used marijuana or hashish (%)
Drug Use - Ever used hard drugs (%)
Drug Use - Ever used any form of cocaine (%)
Drug Use - Ever used heroin (%)
Drug Use - Ever used methamphetamine (%)
Health Insurance - People covered by health insurance (%)
Kidney Conditions-Urology - Avg. # of times urinating at night
Medical Conditions - People with asthma (%)
Medical Conditions - People with anemia (%)
Medical Conditions - People with psoriasis (%)
Medical Conditions - People with overweight (%)
Medical Conditions - Elderly people having difficulties in thinking or remembering (%)
Medical Conditions - People who ever received blood transfusion (%)
Medical Conditions - People having trouble seeing even with glass/contacts (%)
Medical Conditions - People with arthritis (%)
Medical Conditions - People with gout (%)
Medical Conditions - People with congestive heart failure (%)
Medical Conditions - People with coronary heart disease (%)
Medical Conditions - People with angina pectoris (%)
Medical Conditions - People who ever had heart attack (%)
Medical Conditions - People who ever had stroke (%)
Medical Conditions - People with emphysema (%)
Medical Conditions - People with thyroid problem (%)
Medical Conditions - People with chronic bronchitis (%)
Medical Conditions - People with any liver condition (%)
Medical Conditions - People who ever had cancer or malignancy (%)
Mental Health - People who have little interest in doing things (%)
Mental Health - People feeling down, depressed, or hopeless (%)
Mental Health - People who have trouble sleeping or sleeping too much (%)
Mental Health - People feeling tired or having little energy (%)
Mental Health - People with poor appetite or overeating (%)
Mental Health - People feeling bad about themself (%)
Mental Health - People who have trouble concentrating on things (%)
Mental Health - People moving or speaking slowly or too fast (%)
Mental Health - People having thoughts they would be better off dead (%)
Oral Health - Average years since last visit a dentist
Oral Health - People embarrassed because of mouth (%)
Oral Health - People with gum disease (%)
Oral Health - General health of teeth and gums (%)
Oral Health - Average days a week using dental floss/device
Oral Health - Average days a week using mouthwash for dental problem
Oral Health - Average number of teeth
Pesticide Use - Households using pesticides to control insects (%)
Pesticide Use - Households using pesticides to kill weeds (%)
Physical Activity - People doing vigorous-intensity work activities (%)
Physical Activity - People doing moderate-intensity work activities (%)
Physical Activity - People walking or bicycling (%)
Physical Activity - People doing vigorous-intensity recreational activities (%)
Physical Activity - People doing moderate-intensity recreational activities (%)
Physical Activity - Average hours a day doing sedentary activities
Physical Activity - Average hours a day watching TV or videos
Physical Activity - Average hours a day using computer
Physical Functioning - People having limitations keeping them from working (%)
Physical Functioning - People limited in amount of work they can do (%)
Physical Functioning - People that need special equipment to walk (%)
Physical Functioning - People experiencing confusion/memory problems (%)
Physical Functioning - People requiring special healthcare equipment (%)
Prescription Medications - Average number of prescription medicines taking
Preventive Aspirin Use - Adults 40+ taking low-dose aspirin (%)
Reproductive Health - Vaginal deliveries (%)
Reproductive Health - Cesarean deliveries (%)
Reproductive Health - Deliveries resulted in a live birth (%)
Reproductive Health - Pregnancies resulted in a delivery (%)
Reproductive Health - Women breastfeeding newborns (%)
Reproductive Health - Women that had a hysterectomy (%)
Reproductive Health - Women that had both ovaries removed (%)
Reproductive Health - Women that have ever taken birth control pills (%)
Reproductive Health - Women taking birth control pills (%)
Reproductive Health - Women that have ever used Depo-Provera or injectables (%)
Reproductive Health - Women that have ever used female hormones (%)
Sexual Behavior - People 18+ that ever had sex (vaginal, anal, or oral) (%)
Sexual Behavior - Males 18+ that ever had vaginal sex with a woman (%)
Sexual Behavior - Males 18+ that ever performed oral sex on a woman (%)
Sexual Behavior - Males 18+ that ever had anal sex with a woman (%)
Sexual Behavior - Males 18+ that ever had any sex with a man (%)
Sexual Behavior - Females 18+ that ever had vaginal sex with a man (%)
Sexual Behavior - Females 18+ that ever performed oral sex on a man (%)
Sexual Behavior - Females 18+ that ever had anal sex with a man (%)
Sexual Behavior - Females 18+ that ever had any kind of sex with a woman (%)
Sexual Behavior - Average age people first had sex
Sexual Behavior - Average number of female sex partners in lifetime (males 18+)
Sexual Behavior - Average number of female vaginal sex partners in lifetime (males 18+)
Sexual Behavior - Average age people first performed oral sex on a woman (18+)
Sexual Behavior - Average number of woman performed oral sex on in lifetime (18+)
Sexual Behavior - Average number of male sex partners in lifetime (males 18+)
Sexual Behavior - Average number of male anal sex partners in lifetime (males 18+)
Sexual Behavior - Average age people first performed oral sex on a man (18+)
Sexual Behavior - Average number of male oral sex partners in lifetime (18+)
Sexual Behavior - People using protection when performing oral sex (%)
Sexual Behavior - Average number of times people have vaginal or anal sex a year
Sexual Behavior - People having sex without condom (%)
Sexual Behavior - Average number of male sex partners in lifetime (females 18+)
Sexual Behavior - Average number of male vaginal sex partners in lifetime (females 18+)
Sexual Behavior - Average number of female sex partners in lifetime (females 18+)
Sexual Behavior - Circumcised males 18+ (%)
Sleep Disorders - Average hours sleeping at night
Sleep Disorders - People that has trouble sleeping (%)
Smoking-Cigarette Use - People smoking cigarettes (%)
Taste & Smell - People 40+ having problems with smell (%)
Taste & Smell - People 40+ having problems with taste (%)
Taste & Smell - People 40+ that ever had wisdom teeth removed (%)
Taste & Smell - People 40+ that ever had tonsils teeth removed (%)
Taste & Smell - People 40+ that ever had a loss of consciousness because of a head injury (%)
Taste & Smell - People 40+ that ever had a broken nose or other serious injury to face or skull (%)
Taste & Smell - People 40+ that ever had two or more sinus infections (%)
Weight - Average height (inches)
Weight - Average weight (pounds)
Weight - Average BMI
Weight - People that are obese (%)
Weight - People that ever were obese (%)
Weight - People trying to lose weight (%)
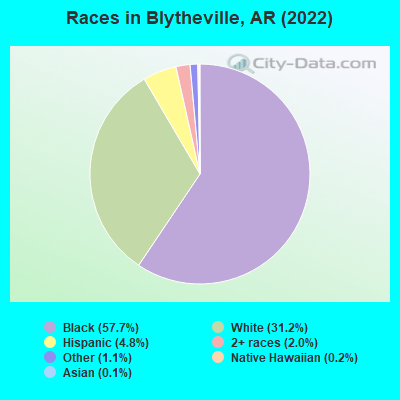
7,735 57.7% Black alone 4,181 31.2% White alone 644 4.8% Hispanic 263 2.0% Two or more races 152 1.1% Other race alone 25 0.2% Native Hawaiian and Other 19 0.1% Asian alone
Officers per 1,000 residents here:
2.54Arkansas average:
2.25
Latest news from Blytheville, AR collected exclusively by city-data.com from local newspapers, TV, and radio stations
Ancestries: American (12.9%), Irish (6.5%), English (4.8%), African (4.3%), German (2.6%).
Current Local Time:
Incorporated on 01/04/1892
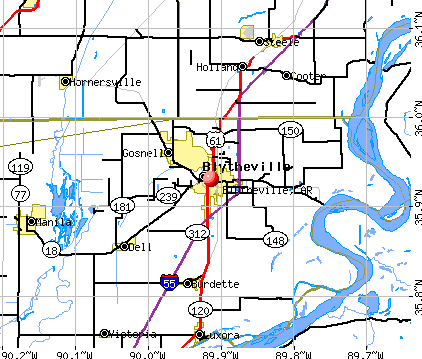
Land area: 20.6 square miles.
Population density: 617 people per square mile (low).
363 residents are foreign born (2.6% Latin America ).
This city:
2.7%Arkansas:
5.0%
Median real estate property taxes paid for housing units with mortgages in 2022: $1,222 (0.7%)Median real estate property taxes paid for housing units with no mortgage in 2022: $354 (0.4%)
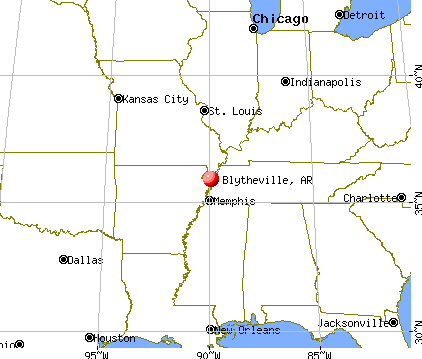
Nearest city with pop. 50,000+: Jonesboro, AR
Nearest city with pop. 200,000+: Memphis, TN
Nearest city with pop. 1,000,000+: Chicago, IL
Nearest cities:
Burdette, AR (2.8 miles),
Rives, MO (3.6 miles)
Latitude: 35.93 N, Longitude: 89.91 W
Daytime population change due to commuting: +495 (+3.7%)Workers who live and work in this city: 3,287 (56.9%)
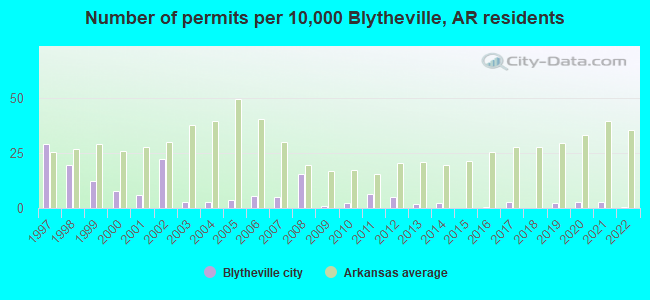
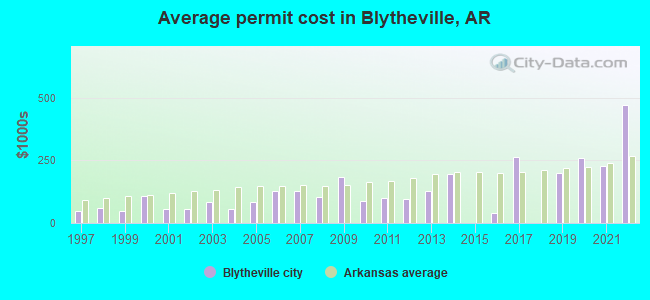
Single-family new house construction building permits:
2022: 1 building , cost: $471,5002021: 5 buildings , average cost: $225,9002020: 5 buildings , average cost: $258,4002019: 4 buildings , average cost: $200,0002017: 5 buildings , average cost: $263,2002016: 1 building , cost: $40,0002014: 4 buildings , average cost: $193,8002013: 3 buildings , average cost: $126,0002012: 9 buildings , average cost: $96,6002011: 12 buildings , average cost: $98,7002010: 4 buildings , average cost: $87,6002009: 2 buildings , average cost: $185,0002008: 28 buildings , average cost: $105,4002007: 9 buildings , average cost: $128,8002006: 10 buildings , average cost: $128,8002005: 7 buildings , average cost: $83,6002004: 5 buildings , average cost: $53,6002003: 5 buildings , average cost: $81,6002002: 41 buildings , average cost: $55,2002001: 11 buildings , average cost: $53,6002000: 14 buildings , average cost: $106,8001999: 22 buildings , average cost: $47,0001998: 36 buildings , average cost: $57,8001997: 53 buildings , average cost: $46,800Unemployment in December 2023:
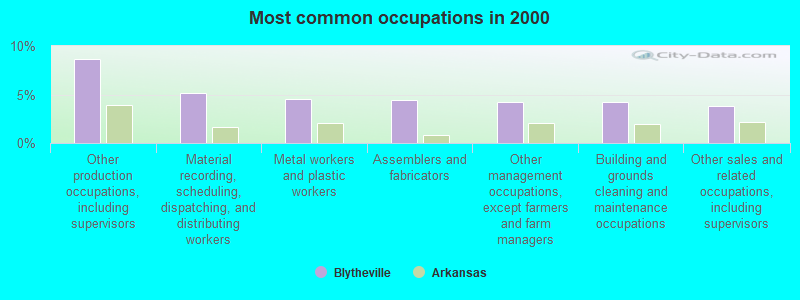
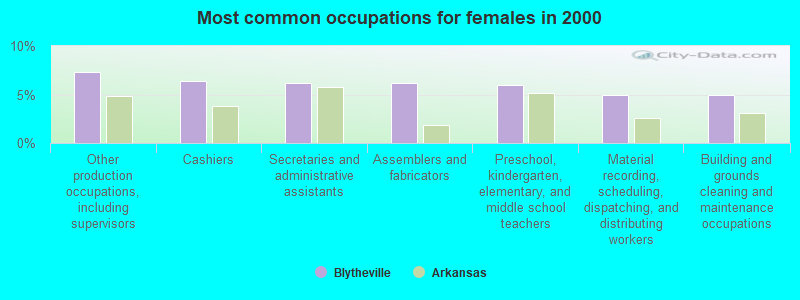
Most common occupations in Blytheville, AR (%)
Both Males Females
Other production occupations, including supervisors (8.6%)
Material recording, scheduling, dispatching, and distributing workers (5.1%)
Metal workers and plastic workers (4.5%)
Assemblers and fabricators (4.5%)
Other management occupations, except farmers and farm managers (4.2%)
Building and grounds cleaning and maintenance occupations (4.2%)
Other sales and related occupations, including supervisors (3.8%)
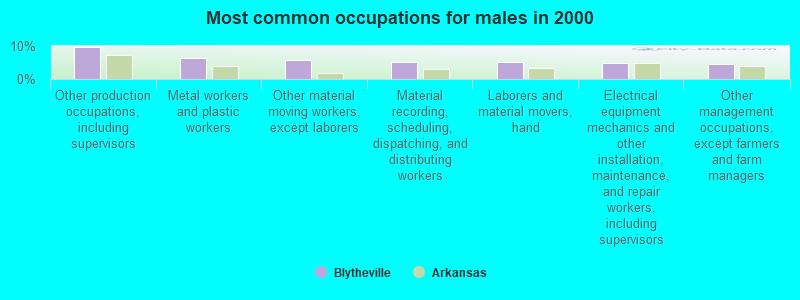
Other production occupations, including supervisors (9.8%)
Metal workers and plastic workers (6.3%)
Other material moving workers, except laborers (5.7%)
Material recording, scheduling, dispatching, and distributing workers (5.2%)
Laborers and material movers, hand (5.0%)
Electrical equipment mechanics and other installation, maintenance, and repair workers, including supervisors (4.9%)
Other management occupations, except farmers and farm managers (4.5%)
Other production occupations, including supervisors (7.3%)
Cashiers (6.4%)
Secretaries and administrative assistants (6.2%)
Assemblers and fabricators (6.1%)
Preschool, kindergarten, elementary, and middle school teachers (6.0%)
Material recording, scheduling, dispatching, and distributing workers (5.0%)
Building and grounds cleaning and maintenance occupations (5.0%)
Tornado activity:
Blytheville-area historical tornado activity is near Arkansas state average. It is 115% greater than the overall U.S. average.
On 5/15/1968, a category F4 (max. wind speeds 207-260 mph) tornado 6.8 miles away from the Blytheville city center killed 35 people and injured 364 people and caused between $5000 and $50,000 in damages.
On 3/21/1952, a category F4 tornado 9.8 miles away from the city center killed 17 people and injured 100 people and caused between $500,000 and $5,000,000 in damages.
Earthquake activity:
Blytheville-area historical earthquake activity is significantly above Arkansas state average. It is 415% greater than the overall U.S. average. On 3/25/1976 at 00:41:20, a magnitude 5.0 (4.9 MB, 5.0 LG, Class: Moderate, Intensity: VI - VII) earthquake occurred 30.8 miles away from Blytheville center On 5/4/1991 at 01:18:54, a magnitude 5.0 (4.4 MB, 4.6 LG, 5.0 LG, Depth: 3.1 mi) earthquake occurred 44.1 miles away from the city center On 4/27/1989 at 16:47:49, a magnitude 4.7 (4.6 MB, 4.7 LG, 4.3 LG, Class: Light, Intensity: IV - V) earthquake occurred 9.7 miles away from the city center On 9/26/1990 at 13:18:51, a magnitude 5.0 (4.7 MB, 4.8 LG, 5.0 LG, Depth: 7.7 mi) earthquake occurred 88.1 miles away from Blytheville center On 4/18/2008 at 09:36:59, a magnitude 5.4 (5.1 MB, 4.8 MS, 5.4 MW, 5.2 MW) earthquake occurred 207.1 miles away from Blytheville center On 3/25/1976 at 01:00:11, a magnitude 4.5 (4.1 MB, 4.5 LG) earthquake occurred 38.7 miles away from Blytheville center Magnitude types: regional Lg-wave magnitude (LG), body-wave magnitude (MB), surface-wave magnitude (MS), moment magnitude (MW) Natural disasters: The number of natural disasters in Mississippi County (15) is near the US average (15).Major Disasters (Presidential) Declared: 9Emergencies Declared: 4Storms: 9, Floods: 8, Tornadoes: 7, Winter Storms: 4, Winds: 2, Hurricane: 1, Other: 1 (Note: some incidents may be assigned to more than one category). Hospitals and medical centers in Blytheville: GREAT RIVER MEDICAL CENTER (Government - Local, provides emergency services, 1520 N DIVISION STREET) BLYTHEVILLE NURSING CENTER (1400 NORTH DIVISION)
HERITAGE SQUARE NURSING AND REHABILITATION CENTER, (710 NO RUDDLE)
KEITH ACRES (112 W CLINTON)
FMCNA - BLYTHEVILLE (1001 E MOULTRIE)
HOME HEALTH PROFESSIONALS INC (509 HUTSON STREET)
MISSISSIPPI COUNTY HEALTH UNIT BLYTHEVILLE (1299 NORTH TENTH STREET)
Airports and heliports located in Blytheville: Arkansas International Airport (BYH) Runways: , Itinerant Ops: 1,000, Local Ops: 10,000, Military Ops: 14,000)Blytheville Municipal Airport (HKA) Runways: , Air Taxi Ops: 1,600, Itinerant Ops: 10,000, Local Ops: 10,000, Military Ops: 400)Great River Medical Center Heliport (AR30) See details about Airports and heliports located in Blytheville, AR
College/University in Blytheville: Arkansas Northeastern College Full-time enrollment: 1,149; Location: 2501 S Division; Public; Website: www.anc.edu)
Colleges/universities with over 2000 students nearest to Blytheville:
Dyersburg State Community College (about 31 miles; Dyersburg, TN ; Full-time enrollment: 2,211)
Arkansas State University-Main Campus (about 44 miles; Jonesboro, AR ; FT enrollment: 12,323)
Rhodes College (about 54 miles; Memphis, TN ; FT enrollment: 2,052)
Southwest Tennessee Community College (about 56 miles; Memphis, TN ; FT enrollment: 8,043)
University of Memphis (about 57 miles; Memphis, TN ; FT enrollment: 17,427)
Union University (about 62 miles; Jackson, TN ; FT enrollment: 4,051)
Three Rivers Community College (about 66 miles; Poplar Bluff, MO ; FT enrollment: 3,360)
Public high schools in Blytheville:
Public elementary/middle schools in Blytheville:
See full list of schools located in Blytheville Library in Blytheville: MISSISSIPPI/CRITTENDEN REGIONAL LIBRARY Operating income: $1,237,485; Location: 200 NORTH 5TH STREET; 268,032 books ; 2,400 audio materials ; 300 video materials ; 82 state licensed databases ; 625 print serial subscriptions )
User-submitted facts and corrections:
Mississippi County Community College is now Arkansas Northeastern College...still located on the highway
Instead of the college being Mississippi County Community College it is now Arkansas Northeaster College. added by both_jrs_rock
Blytheville. Arkansas is near Barfield, Arkansas added by Jim
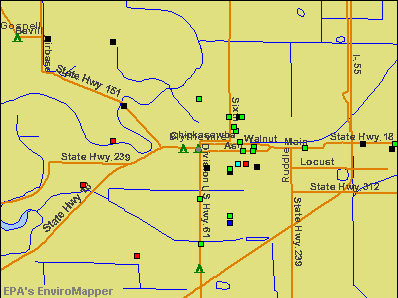
Notable locations in Blytheville: (A) , Mississippi County Fairgrounds (B) , Blytheville Fire Department Station 2 (C) , Mississippi County Nursing Home (D) , Ritz Civic Center (E) , Mississippi County Courthouse (F) , Blytheville Fire Department Station 1 (G) , Blytheville Fire Department Station 3 (H) , Blytheville Police Department (I) , Blytheville City Hall (J) , Blytheville Public Library (K) , Blytheville C B Emergency Squad (L) , Northeast Arkansas Ambulance Service (Advanced Life Support) (M) , Medic One Ambulance Service (N) , Fire Station Number 1 (O) . Display/hide their locations on the map
Shopping Centers: (1) , Colony Square Shopping Center (2) , Day Shopping Center (3) , Downtown Shopping Center (4) , Town North Shopping Center (5) . Display/hide their locations on the map
Churches in Blytheville include: (A) , Blytheville First Assembly of God Church (B) , Church of Christ (C) , Church of God (D) , Church of the Lord Jesus (E) , Church of the Lord Jesus Christ (F) , Eastside Church of Christ (G) , Fairview Baptist Church (H) , Faith Temple Church of God in Christ (I) . Display/hide their locations on the map
Cemeteries: (1) , Sawyer Cemetery (2) , Elmwood Cemetery (3) , Memorial Park Cemetery (4) , Maple Grove Cemetery (5) , Spur Cemetery (6) , Lane Cemetery (7) . Display/hide their locations on the map
Parks in Blytheville include: (1) , Cypress Park (2) , Walker Park (3) , Little Park (4) , Eaker Site (5) . Display/hide their locations on the map
Tourist attraction: (1) . Display/hide its approximate location on the map
Hotels: (1) , Comfort Inn Blytheville (1520 East Main Street) (2) , Best Western Blytheville Inn (1101 Kari Street) (3) , Days Inn (East Highway 18 & I 55) (4) , Royal Inn (1214 South Division Street) (5) , Best Budget Inn (357 South Division Street) (6) , Holiday Inn of Blytheville (1121 West Main Street) (7) , Hampton Inn (301 North Service Road) (8) , Blytheville-Days Inn (PO Box 1342) (9) . Display/hide their approximate locations on the map
Birthplace of: Dee Clark - Singer, Fred Akers - Football player and coach, Junior Walker - Singer, Kathy Webb - Politician, Lawrence Babits - Archaeologist, M. C. Burton, Jr. - Basketball player, Nannerl O. Keohane - Educator, Edgar H. Lloyd - Army Medal of Honor recipient, Kimberly Derrick - Short-track speed skater, Brice Beck - College football player (Iowa State Cyclones).
Mississippi County has a predicted average indoor radon screening level less than 2 pCi/L (pico curies per liter) - Low Potential Drinking water stations with addresses in Blytheville and their reported violations in the past:
BLYTHEVILLE WATERWORKS (Population served: 18,722, Groundwater):
Past health violations:
MCL, Monthly (TCR) - In JUL-2013, Contaminant: Coliform. Follow-up actions: St Public Notif requested (SEP-10-2013), St Public Notif received (OCT-08-2013), St Compliance achieved (DEC-03-2013)
Population served: 1,500, Groundwater):
Past monitoring violations:
Monitoring and Reporting (DBP) - Between JUL-2013 and SEP-2013, Contaminant: Chlorine. Follow-up actions: St Public Notif requested (OCT-02-2013), St Compliance achieved (DEC-03-2013)
One routine major monitoring violation
Drinking water stations with addresses in Blytheville that have no violations reported:
NE MISSISSIPPI CO WATER ASSOC (Population served: 1,122, Primary Water Source Type: Purch groundwater)
Average household size: This city:
2.5 peopleArkansas:
2.5 people
Percentage of family households: This city:
64.1%Whole state:
67.6%
Percentage of households with unmarried partners: This city:
7.0%Whole state:
5.7%
Likely homosexual households (counted as self-reported same-sex unmarried-partner households)
Lesbian couples: 0.2% of all households Gay men: 0.1% of all households
99 people in nursing facilities/skilled-nursing facilities in 2010people in emergency and transitional shelters (with sleeping facilities) for people experiencing homelessness in 2010People in group quarters in Blytheville in 2000:
186 people in nursing homes
76 people in other noninstitutional group quarters
7 people in local jails and other confinement facilities (including police lockups)
5 people in homes or halfway houses for drug/alcohol abuse
Banks with branches in Blytheville (2011 data):
Southern Bancorp Bank: East Branch, North Branch, South Branch, Walmart Branch, Blytheville Branch, Gosnell Branch. Info updated 2010/06/01: Bank assets: $1,146.8 mil, Deposits: $966.8 mil, headquarters in Arkadelphia, AR, positive income , Commercial Lending Specialization, 40 total offices , Holding Company: Southern Bancorp, Inc
Farmers Bank and Trust Company: Blytheville Branch, Northside Branch, Farmers Bank And Trust Company, Teller's Window Branch. Info updated 2006/11/03: Bank assets: $401.8 mil, Deposits: $347.1 mil, local headquarters , positive income , Commercial Lending Specialization, 8 total offices , Holding Company: Farmers Bancorp Inc.
SouthBank, a Federal Savings Bank: Blytheville Branch at 208 North Second Street, branch established on 1947/06/19. Info updated 2011/07/21: Bank assets: $242.2 mil, Deposits: $183.8 mil, headquarters in Huntsville, AL, negative income in the last year , Commercial Lending Specialization, 13 total offices
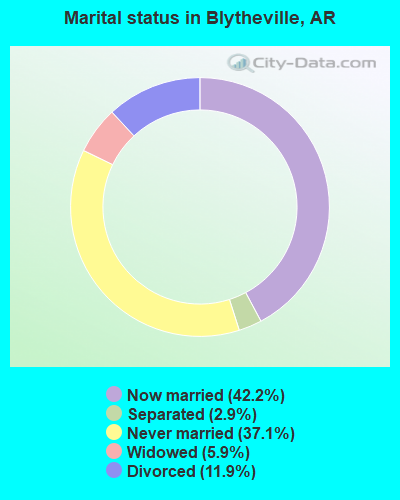
For population 15 years and over in Blytheville:
Never married: 37.1%Now married: 42.2%Separated: 2.9%Widowed: 5.9%Divorced: 11.9% For population 25 years and over in Blytheville:
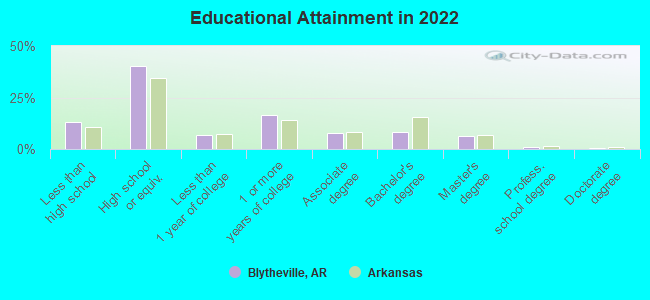
High school or higher: 85.7%Bachelor's degree or higher: 15.2%Graduate or professional degree: 7.3%Unemployed: 11.7%Mean travel time to work (commute): 16.8 minutes
Education Gini index (Inequality in education) Here:
11.2Arkansas average:
11.4
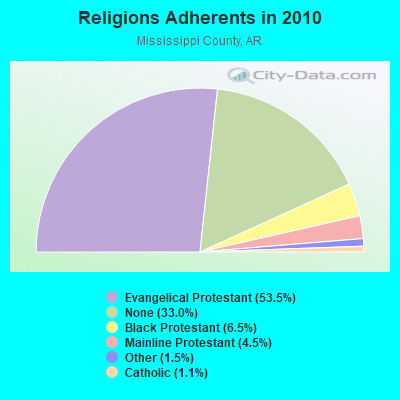
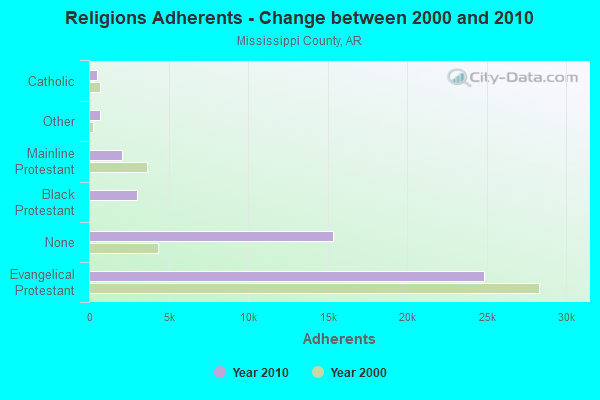
Religion statistics for Blytheville, AR (based on Mississippi County data)
Religion Adherents Congregations Evangelical Protestant 24,845 95 Black Protestant 3,027 16 Mainline Protestant 2,073 15 Other 700 3 Catholic 500 2 None 15,335 -
Source: Clifford Grammich, Kirk Hadaway, Richard Houseal, Dale E.Jones, Alexei Krindatch, Richie Stanley and Richard H.Taylor. 2012. 2010 U.S.Religion Census: Religious Congregations & Membership Study. Association of Statisticians of American Religious Bodies. Jones, Dale E., et al. 2002. Congregations and Membership in the United States 2000. Nashville, TN: Glenmary Research Center. Graphs represent county-level data
Food Environment Statistics: Number of grocery stores : 14This county :
3.00 / 10,000 pop.State :
2.02 / 10,000 pop.
Number of supercenters and club stores : 1This county :
0.21 / 10,000 pop.State :
0.25 / 10,000 pop.
Number of convenience stores (no gas) : 1Mississippi County :
0.21 / 10,000 pop.Arkansas :
0.59 / 10,000 pop.
Number of convenience stores (with gas) : 22Mississippi County :
4.72 / 10,000 pop.State :
4.94 / 10,000 pop.
Number of full-service restaurants : 18Mississippi County :
3.86 / 10,000 pop.Arkansas :
6.66 / 10,000 pop.
Adult diabetes rate : Mississippi County :
11.5%Arkansas :
9.8%
Adult obesity rate : Mississippi County :
32.5%Arkansas :
29.1%
Low-income preschool obesity rate : Mississippi County :
14.3%Arkansas :
13.6%
Health and Nutrition: Healthy diet rate : Blytheville:
48.5%State:
48.2%
Average overall health of teeth and gums : This city:
44.9%Arkansas:
44.2%
People feeling badly about themselves : Blytheville:
21.0%Arkansas:
21.6%
People not drinking alcohol at all : Blytheville:
12.2%Arkansas:
11.3%
Average hours sleeping at night : Overweight people : Blytheville:
34.6%State:
34.0%
General health condition : Blytheville:
53.7%State:
54.4%
Average condition of hearing : Blytheville:
79.9%Arkansas:
78.0%
More about Health and Nutrition of Blytheville, AR Residents
Local government employment and payroll (March 2022)
Function
Full-time employees
Monthly full-time payroll
Average yearly full-time wage
Part-time employees
Monthly part-time payroll
Police Protection - Officers
41 $163,021 $47,713 0 $0 Solid Waste Management
32 $79,323 $29,746 0 $0 Firefighters
29 $120,544 $49,880 0 $0 Water Supply
17 $56,182 $39,658 1 $1,516 Streets and Highways
13 $45,780 $42,258 0 $0 Sewerage
10 $29,458 $35,350 0 $0 Police - Other
8 $23,798 $35,697 5 $4,003 Other and Unallocable
6 $16,844 $33,688 0 $0 Other Government Administration
5 $9,017 $21,641 0 $0 Judicial and Legal
4 $23,407 $70,221 0 $0 Financial Administration
4 $16,494 $49,482 0 $0 Parks and Recreation
2 $5,096 $30,576 0 $0 Health
2 $4,700 $28,200 0 $0 Fire - Other
1 $2,387 $28,644 0 $0
Totals for Government
174 $596,051 $41,107 6 $5,519
Blytheville government finances - Expenditure in 2021 (per resident):
Construction - Air Transportation: $202,000 ($15.90)
Sewerage: $119,000 ($9.37)Regular Highways: $3,000 ($0.24)Current Operations - Police Protection: $3,416,000 ($268.85)
Water Utilities: $2,068,000 ($162.76)Local Fire Protection: $1,918,000 ($150.95)Sewerage: $1,680,000 ($132.22)Regular Highways: $1,311,000 ($103.18)Parks and Recreation: $1,154,000 ($90.82)Solid Waste Management: $1,148,000 ($90.35)Central Staff Services: $583,000 ($45.88)Financial Administration: $252,000 ($19.83)Health - Other: $216,000 ($17.00)General - Other: $125,000 ($9.84)Judicial and Legal Services: $69,000 ($5.43)General Public Buildings: $62,000 ($4.88)Air Transportation: $35,000 ($2.75)General - Interest on Debt: $24,008,000 ($1889.50)
Other Capital Outlay - General - Other: $221,000 ($17.39)
Sewerage: $66,000 ($5.19)Water Utilities: $65,000 ($5.12)Police Protection: $2,000 ($0.16)Local Fire Protection: $2,000 ($0.16)Solid Waste Management: $1,000 ($0.08)Parks and Recreation: $1,000 ($0.08)Central Staff Services: $1,000 ($0.08)Total Salaries and Wages: $490,000 ($38.56)
Blytheville government finances - Revenue in 2021 (per resident):
Charges - Sewerage: $2,046,000 ($161.03)
Solid Waste Management: $1,253,000 ($98.61)Parks and Recreation: $220,000 ($17.31)Other: $215,000 ($16.92)Air Transportation: $27,000 ($2.12)Federal Intergovernmental - Air Transportation: $105,000 ($8.26)
Other: $9,000 ($0.71)Local Intergovernmental - General Local Government Support: $2,337,000 ($183.93)
Miscellaneous - Interest Earnings: $28,412,000 ($2236.11)
Fines and Forfeits: $367,000 ($28.88)General Revenue - Other: $184,000 ($14.48)Revenue - Water Utilities: $2,696,000 ($212.18)
State Intergovernmental - Highways: $1,107,000 ($87.12)
Other: $391,000 ($30.77)General Local Government Support: $277,000 ($21.80)Tax - General Sales and Gross Receipts: $3,461,000 ($272.39)
Public Utilities Sales: $1,229,000 ($96.73)Property: $1,008,000 ($79.33)Other License: $236,000 ($18.57)Other Selective Sales: $137,000 ($10.78)
Blytheville government finances - Debt in 2021 (per resident):
Long Term Debt - Outstanding Nonguaranteed - Industrial Revenue: $712,240,000 ($56055.41)
Beginning Outstanding - Public Debt for Private Purpose: $712,240,000 ($56055.41)
Blytheville government finances - Cash and Securities in 2021 (per resident):
Bond Funds - Cash and Securities: $30,000 ($2.36)
Other Funds - Cash and Securities: $5,455,000 ($429.32)
Sinking Funds - Cash and Securities: $778,789,000 ($61293.01)
Businesses in Blytheville, AR
Name Count Name Count
AT&T 2 Lowe's 1 AutoZone 1 McDonald's 2 Baskin-Robbins 1 Nike 1 Best Western 1 Nissan 1 Burger King 1 Payless 1 Comfort Inn 1 Pizza Hut 1 DHL 1 Quality 1 Days Inn 1 SAS Shoes 1 Domino's Pizza 1 SONIC Drive-In 2 FedEx 5 Sears 1 Ford 1 Subway 2 GameStop 1 Super 8 1 H&R Block 1 Taco Bell 1 Hardee's 1 Travelodge 1 Holiday Inn 1 U-Haul 3 JCPenney 1 UPS 4 Jones New York 1 Vans 1 KFC 1 Verizon Wireless 1 Kroger 1 Walmart 1 Lane Furniture 1 Wendy's 1
Strongest AM radio stations in Blytheville:
KLCN (910 AM; 5 kW; BLYTHEVILLE, AR; Owner: SUDBURY SERVICES, INC.)
KOTC (830 AM; daytime; 10 kW; KENNETT, MO; Owner: EAGLE BLUFF ENTERPRISES)
WDIA (1070 AM; 50 kW; MEMPHIS, TN; Owner: CLEAR CHANNEL BROADCASTING LICENSES, INC.)
WGSF (1030 AM; 50 kW; MEMPHIS, TN; Owner: FLINN BROADCASTING CORPORATION)
WCRV (640 AM; 50 kW; COLLIERVILLE, TN; Owner: BOTT BROADCASTING COMPANY/TENNESSEE)
WMQM (1600 AM; 50 kW; LAKELAND, TN; Owner: WMQM, INC.)
WJCE (680 AM; 10 kW; MEMPHIS, TN; Owner: ENTERCOM MEMPHIS LICENSE, LLC)
KWAM (990 AM; 10 kW; MEMPHIS, TN; Owner: CONCORD MEDIA GROUP, INC.)
KOSE (860 AM; 1 kW; WILSON, AR; Owner: NEWPORT BROADCASTING COMPANY)
WHBQ (560 AM; 5 kW; MEMPHIS, TN; Owner: FLINN BROADCASTING CORPORATION)
WREC (600 AM; 5 kW; MEMPHIS, TN; Owner: CLEAR CHANNEL BROADCASTING LICENSES, INC.)
WCPC (940 AM; 50 kW; HOUSTON, MS; Owner: WCPC BROADCASTING CO., INC.)
WSM (650 AM; 50 kW; NASHVILLE, TN; Owner: GAYLORD ENTERTAINMENT COMPANY)
Strongest FM radio stations in Blytheville:
KAMJ (93.9 FM; GOSNELL, AR; Owner: PHOENIX BROADCASTING GROUP, INC.)
KHLS (96.3 FM; BLYTHEVILLE, AR; Owner: SUDBURY SERVICES, INC.)
KBCM (88.3 FM; BLYTHEVILLE, AR; Owner: AMERICAN FAMILY ASSOCIATION)
WJZN (98.9 FM; MUNFORD, TN; Owner: MEMPHIS III LIMITED PARTNERSHIP)
KQDD (107.3 FM; OSCEOLA, AR; Owner: PHOENIX BROADCASTING GROUP, INC.)
WYPL (89.3 FM; MEMPHIS, TN; Owner: MEMPHIS/SHELBY COUNTY PUBLIC LIBRARY & INFO CNTR.)
WASL (100.1 FM; DYERSBURG, TN; Owner: DR PEPPER PEPSI-COLA BOTTLING CO.)
WKNQ (90.7 FM; DYERSBURG, TN; Owner: MID-SOUTH PUBLIC COMMS. FOUNDATION)
KIYS (101.9 FM; JONESBORO, AR; Owner: ,CAPSTAR TX LIMITED PARTNERSHIP)
W205BN (88.9 FM; DYERSBURG, TN; Owner: WAY-FM MEDIA GROUP, INC.)
KCRV-FM (105.1 FM; CARUTHERSVILLE, MO; Owner: POLLACK BROADCASTING CO.)
KAUF (89.9 FM; KENNETT, MO; Owner: AMERICAN FAMILY ASSOCIATION)
WAPO (90.5 FM; MOUNT VERNON, IL; Owner: AMERICAN FAMILY ASSOCIATION)
WAUV (89.7 FM; RIPLEY, TN; Owner: AMERICAN FAMILY ASSOCIATION)
TV broadcast stations around Blytheville:
WMC-TV (Channel 5; MEMPHIS, TN; Owner: RAYCOM AMERICA, INC.)
KAIT (Channel 8; JONESBORO, AR; Owner: LIBCO, INC.)
KVTJ (Channel 48; JONESBORO, AR; Owner: AGAPE CHURCH, INC.)
WLMT (Channel 30; MEMPHIS, TN; Owner: CLEAR CHANNEL BROADCASTING LICENSES, INC.)
WPTY-TV (Channel 24; MEMPHIS, TN; Owner: CLEAR CHANNEL BROADCASTING LICENSES, INC.)
K46EM (Channel 46; BATESVILLE, AR; Owner: MS COMMUNICATIONS, LLC)
WDYR-CA (Channel 33; DYERSBURG, TN; Owner: TRI-STATE CHRISTIAN TV, INC.)
Medal of Honor Recipients
Medal of Honor Recipient born in Blytheville: Edgar H. Lloyd.
National Bridge Inventory (NBI) Statistics 58 Number of bridges909ft / 277m Total length $3,250,000 Total costs345,168 Total average daily traffic39,164 Total average daily truck traffic
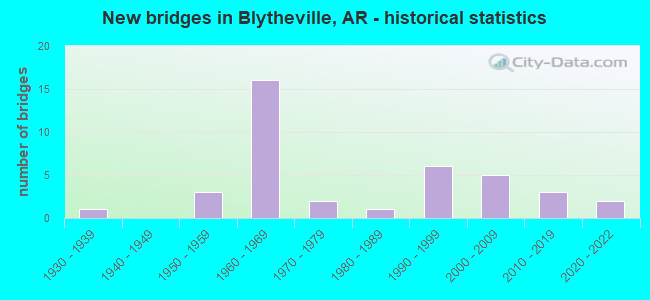
New bridges - historical statistics
1 1930-1939 3 1950-1959 16 1960-1969 2 1970-1979 1 1980-1989 6 1990-1999 5 2000-2009 3 2010-2019 2 2020-2022
See full National Bridge Inventory statistics for Blytheville, AR
Fire-safe hotels and motels in Blytheville, Arkansas:
Thrifty Inn, 201 N I-55 Service Rd, Blytheville, Arkansas 72315 Phone: (870) 763-2300
Americas Best Value Inn, 102a S Porter Dr, Blytheville, Arkansas 72315 Phone: (870) 780-6122, Fax: (870) 780-6936
Comfort Inn and Suites, 1510 E Main St, Blytheville, Arkansas 72315 Phone: (870) 763-0900
Quality Inn, 1520 E Main St, Blytheville, Arkansas 72315 Phone: (870) 763-7081, Fax: (870) 763-7081
All 4 fire-safe hotels and motels in Blytheville, Arkansas
Most common first names in Blytheville, AR among deceased individuals Name Count Lived (average)
James 277 70.8 years Mary 255 77.2 years John 229 71.9 years William 202 74.4 years Willie 143 73.0 years Robert 137 70.6 years Charles 110 71.1 years George 106 75.0 years Annie 71 80.5 years Joe 70 74.4 years
Most common last names in Blytheville, AR among deceased individuals Last name Count Lived (average)
Williams 137 75.3 years Johnson 121 74.3 years Jones 109 70.5 years Davis 105 72.8 years Smith 102 75.1 years Moore 76 73.9 years Brown 73 73.9 years Wilson 65 72.7 years Thompson 64 72.9 years Jackson 60 75.1 years
Blytheville compared to Arkansas state average:
Median house value below state average. Black race population percentage significantly above state average. Hispanic race population percentage below state average. Foreign-born population percentage significantly below state average. Length of stay since moving in significantly above state average. Blytheville on our top lists :
#3 on the list of "Top 101 cities with the lowest percentage of workers working at home, population 5,000+"
#15 on the list of "Top 101 cities with the highest number of murders per 100,000 residents, excludes tourist destinations and others with a lot of outsiders visiting based on city industries data (population 5,000+)"
#23 on the list of "Top 101 cities with the most residents born in Other Western Europe (population 500+)"
#27 on the list of "Top 101 cities with the highest number of burglaries per 100,000 residents, excludes tourist destinations and others with a lot of outsiders visiting based on city industries data (population 5,000+)"
#42 on the list of "Top 100 least-safe cities (highest city-data.com crime index) (pop. 5,000+)"
#47 on the list of "Top 101 cities with the highest city-data.com crime index, excludes tourist destinations and others with a lot of outsiders visiting based on city industries data (population 5,000+)"
#64 on the list of "Top 101 cities with the largest percentage population decrease from 2000 (population 5,000+)"
#80 on the list of "Top 100 cities with declining populations from 2000 to 2014 (pop. 5,000+)"
#81 on the list of "Top 101 cities with the most people below 50% of the poverty level, excluding cities with 15% or more of residents in college and with the median age below 28 (population 5,000+)"
#33 on the list of "Top 101 counties with the smallest number of people without health insurance coverage in 2000 (pop. 50,000+)"
#48 on the list of "Top 101 counties with the smallest number of children under 18 without health insurance coverage in 2000 (pop. 50,000+)"
#50 on the list of "Top 101 counties with the largest number of people moving out compared to moving in (pop. 50,000+)"
#97 on the list of "Top 101 counties with the highest number of deaths per 1000 residents 2007-2013 (pop. 50,000+)"
Top Patent Applicants
Gary Mcquillis (14)
Kevin Keown (3)
Jason D. Pruett (3)
Tim Patterson (3)
Jerome Jenkins (2)
Neil Ross (2)
Neal Ross (2)
Dhiren Panda (2)
Jason Malone (1)
Bruce Cole (1)
Total of 29 patent applications in 2008-2024.


 Recent articles from our blog. Our writers, many of them Ph.D. graduates or candidates, create easy-to-read articles on a wide variety of topics.

 (44.3 miles
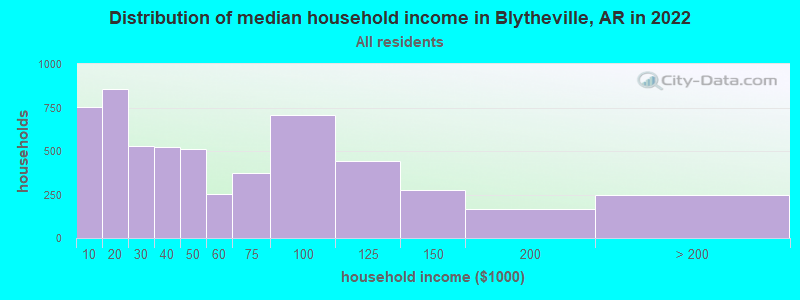


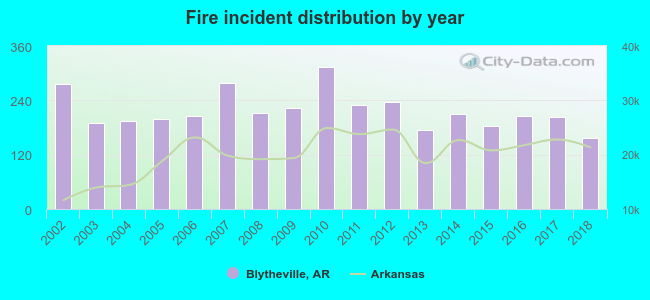 Based on the data from the years 2002 - 2018 the average number of fire incidents per year is 217. The highest number of reported fires - 313 took place in 2010, and the least - 157 in 2018. The data has a declining trend.
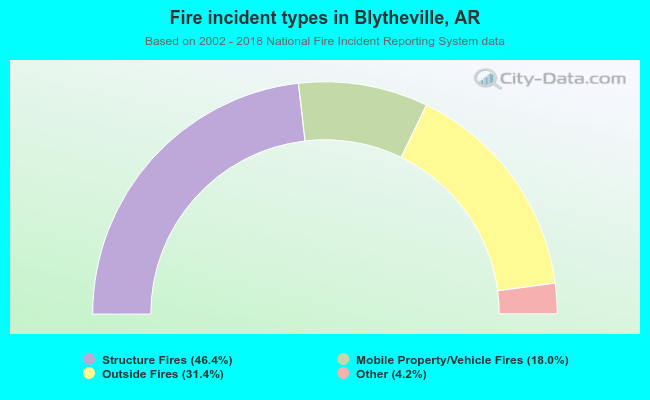 When looking into fire subcategories, the most reports belonged to: Structure Fires (46.4%), and Outside Fires (31.4%).