Bonner Springs, Kansas Submit your own pictures of this city and show them to the world
OSM Map
General Map
Google Map
MSN Map
OSM Map
General Map
Google Map
MSN Map
OSM Map
General Map
Google Map
MSN Map
OSM Map
General Map
Google Map
MSN Map
Please wait while loading the map...
Population in 2022: 7,666 (84% urban, 16% rural). Population change since 2000: +13.3%Males: 3,741 Females: 3,925
March 2022 cost of living index in Bonner Springs: 87.0 (less than average, U.S. average is 100) Percentage of residents living in poverty in 2022: 12.5%for White Non-Hispanic residents , 43.5% for Black residents , 23.5% for Hispanic or Latino residents , 58.8% for American Indian residents , 32.5% for other race residents , 0.2% for two or more races residents )Business Search - 14 Million verified businesses
Data:
Median household income ($)
Median household income (% change since 2000)
Household income diversity
Ratio of average income to average house value (%)
Ratio of average income to average rent
Median household income ($) - White
Median household income ($) - Black or African American
Median household income ($) - Asian
Median household income ($) - Hispanic or Latino
Median household income ($) - American Indian and Alaska Native
Median household income ($) - Multirace
Median household income ($) - Other Race
Median household income for houses/condos with a mortgage ($)
Median household income for apartments without a mortgage ($)
Races - White alone (%)
Races - White alone (% change since 2000)
Races - Black alone (%)
Races - Black alone (% change since 2000)
Races - American Indian alone (%)
Races - American Indian alone (% change since 2000)
Races - Asian alone (%)
Races - Asian alone (% change since 2000)
Races - Hispanic (%)
Races - Hispanic (% change since 2000)
Races - Native Hawaiian and Other Pacific Islander alone (%)
Races - Native Hawaiian and Other Pacific Islander alone (% change since 2000)
Races - Two or more races (%)
Races - Two or more races (% change since 2000)
Races - Other race alone (%)
Races - Other race alone (% change since 2000)
Racial diversity
Unemployment (%)
Unemployment (% change since 2000)
Unemployment (%) - White
Unemployment (%) - Black or African American
Unemployment (%) - Asian
Unemployment (%) - Hispanic or Latino
Unemployment (%) - American Indian and Alaska Native
Unemployment (%) - Multirace
Unemployment (%) - Other Race
Population density (people per square mile)
Population - Males (%)
Population - Females (%)
Population - Males (%) - White
Population - Males (%) - Black or African American
Population - Males (%) - Asian
Population - Males (%) - Hispanic or Latino
Population - Males (%) - American Indian and Alaska Native
Population - Males (%) - Multirace
Population - Males (%) - Other Race
Population - Females (%) - White
Population - Females (%) - Black or African American
Population - Females (%) - Asian
Population - Females (%) - Hispanic or Latino
Population - Females (%) - American Indian and Alaska Native
Population - Females (%) - Multirace
Population - Females (%) - Other Race
Coronavirus confirmed cases (Apr 28, 2024)
Deaths caused by coronavirus (Apr 28, 2024)
Coronavirus confirmed cases (per 100k population) (Apr 28, 2024)
Deaths caused by coronavirus (per 100k population) (Apr 28, 2024)
Daily increase in number of cases (Apr 28, 2024)
Weekly increase in number of cases (Apr 28, 2024)
Cases doubled (in days) (Apr 28, 2024)
Hospitalized patients (Apr 18, 2022)
Negative test results (Apr 18, 2022)
Total test results (Apr 18, 2022)
COVID Vaccine doses distributed (per 100k population) (Sep 19, 2023)
COVID Vaccine doses administered (per 100k population) (Sep 19, 2023)
COVID Vaccine doses distributed (Sep 19, 2023)
COVID Vaccine doses administered (Sep 19, 2023)
Likely homosexual households (%)
Likely homosexual households (% change since 2000)
Likely homosexual households - Lesbian couples (%)
Likely homosexual households - Lesbian couples (% change since 2000)
Likely homosexual households - Gay men (%)
Likely homosexual households - Gay men (% change since 2000)
Cost of living index
Median gross rent ($)
Median contract rent ($)
Median monthly housing costs ($)
Median house or condo value ($)
Median house or condo value ($ change since 2000)
Mean house or condo value by units in structure - 1, detached ($)
Mean house or condo value by units in structure - 1, attached ($)
Mean house or condo value by units in structure - 2 ($)
Mean house or condo value by units in structure by units in structure - 3 or 4 ($)
Mean house or condo value by units in structure - 5 or more ($)
Mean house or condo value by units in structure - Boat, RV, van, etc. ($)
Mean house or condo value by units in structure - Mobile home ($)
Median house or condo value ($) - White
Median house or condo value ($) - Black or African American
Median house or condo value ($) - Asian
Median house or condo value ($) - Hispanic or Latino
Median house or condo value ($) - American Indian and Alaska Native
Median house or condo value ($) - Multirace
Median house or condo value ($) - Other Race
Median resident age
Resident age diversity
Median resident age - Males
Median resident age - Females
Median resident age - White
Median resident age - Black or African American
Median resident age - Asian
Median resident age - Hispanic or Latino
Median resident age - American Indian and Alaska Native
Median resident age - Multirace
Median resident age - Other Race
Median resident age - Males - White
Median resident age - Males - Black or African American
Median resident age - Males - Asian
Median resident age - Males - Hispanic or Latino
Median resident age - Males - American Indian and Alaska Native
Median resident age - Males - Multirace
Median resident age - Males - Other Race
Median resident age - Females - White
Median resident age - Females - Black or African American
Median resident age - Females - Asian
Median resident age - Females - Hispanic or Latino
Median resident age - Females - American Indian and Alaska Native
Median resident age - Females - Multirace
Median resident age - Females - Other Race
Commute - mean travel time to work (minutes)
Travel time to work - Less than 5 minutes (%)
Travel time to work - Less than 5 minutes (% change since 2000)
Travel time to work - 5 to 9 minutes (%)
Travel time to work - 5 to 9 minutes (% change since 2000)
Travel time to work - 10 to 19 minutes (%)
Travel time to work - 10 to 19 minutes (% change since 2000)
Travel time to work - 20 to 29 minutes (%)
Travel time to work - 20 to 29 minutes (% change since 2000)
Travel time to work - 30 to 39 minutes (%)
Travel time to work - 30 to 39 minutes (% change since 2000)
Travel time to work - 40 to 59 minutes (%)
Travel time to work - 40 to 59 minutes (% change since 2000)
Travel time to work - 60 to 89 minutes (%)
Travel time to work - 60 to 89 minutes (% change since 2000)
Travel time to work - 90 or more minutes (%)
Travel time to work - 90 or more minutes (% change since 2000)
Marital status - Never married (%)
Marital status - Now married (%)
Marital status - Separated (%)
Marital status - Widowed (%)
Marital status - Divorced (%)
Median family income ($)
Median family income (% change since 2000)
Median non-family income ($)
Median non-family income (% change since 2000)
Median per capita income ($)
Median per capita income (% change since 2000)
Median family income ($) - White
Median family income ($) - Black or African American
Median family income ($) - Asian
Median family income ($) - Hispanic or Latino
Median family income ($) - American Indian and Alaska Native
Median family income ($) - Multirace
Median family income ($) - Other Race
Median year house/condo built
Median year apartment built
Year house built - Built 2005 or later (%)
Year house built - Built 2000 to 2004 (%)
Year house built - Built 1990 to 1999 (%)
Year house built - Built 1980 to 1989 (%)
Year house built - Built 1970 to 1979 (%)
Year house built - Built 1960 to 1969 (%)
Year house built - Built 1950 to 1959 (%)
Year house built - Built 1940 to 1949 (%)
Year house built - Built 1939 or earlier (%)
Average household size
Household density (households per square mile)
Average household size - White
Average household size - Black or African American
Average household size - Asian
Average household size - Hispanic or Latino
Average household size - American Indian and Alaska Native
Average household size - Multirace
Average household size - Other Race
Occupied housing units (%)
Vacant housing units (%)
Owner occupied housing units (%)
Renter occupied housing units (%)
Vacancy status - For rent (%)
Vacancy status - For sale only (%)
Vacancy status - Rented or sold, not occupied (%)
Vacancy status - For seasonal, recreational, or occasional use (%)
Vacancy status - For migrant workers (%)
Vacancy status - Other vacant (%)
Residents with income below the poverty level (%)
Residents with income below 50% of the poverty level (%)
Children below poverty level (%)
Poor families by family type - Married-couple family (%)
Poor families by family type - Male, no wife present (%)
Poor families by family type - Female, no husband present (%)
Poverty status for native-born residents (%)
Poverty status for foreign-born residents (%)
Poverty among high school graduates not in families (%)
Poverty among people who did not graduate high school not in families (%)
Residents with income below the poverty level (%) - White
Residents with income below the poverty level (%) - Black or African American
Residents with income below the poverty level (%) - Asian
Residents with income below the poverty level (%) - Hispanic or Latino
Residents with income below the poverty level (%) - American Indian and Alaska Native
Residents with income below the poverty level (%) - Multirace
Residents with income below the poverty level (%) - Other Race
Air pollution - Air Quality Index (AQI)
Air pollution - CO
Air pollution - NO2
Air pollution - SO2
Air pollution - Ozone
Air pollution - PM10
Air pollution - PM25
Air pollution - Pb
Crime - Murders per 100,000 population
Crime - Rapes per 100,000 population
Crime - Robberies per 100,000 population
Crime - Assaults per 100,000 population
Crime - Burglaries per 100,000 population
Crime - Thefts per 100,000 population
Crime - Auto thefts per 100,000 population
Crime - Arson per 100,000 population
Crime - City-data.com crime index
Crime - Violent crime index
Crime - Property crime index
Crime - Murders per 100,000 population (5 year average)
Crime - Rapes per 100,000 population (5 year average)
Crime - Robberies per 100,000 population (5 year average)
Crime - Assaults per 100,000 population (5 year average)
Crime - Burglaries per 100,000 population (5 year average)
Crime - Thefts per 100,000 population (5 year average)
Crime - Auto thefts per 100,000 population (5 year average)
Crime - Arson per 100,000 population (5 year average)
Crime - City-data.com crime index (5 year average)
Crime - Violent crime index (5 year average)
Crime - Property crime index (5 year average)
1996 Presidential Elections Results (%) - Democratic Party (Clinton)
1996 Presidential Elections Results (%) - Republican Party (Dole)
1996 Presidential Elections Results (%) - Other
2000 Presidential Elections Results (%) - Democratic Party (Gore)
2000 Presidential Elections Results (%) - Republican Party (Bush)
2000 Presidential Elections Results (%) - Other
2004 Presidential Elections Results (%) - Democratic Party (Kerry)
2004 Presidential Elections Results (%) - Republican Party (Bush)
2004 Presidential Elections Results (%) - Other
2008 Presidential Elections Results (%) - Democratic Party (Obama)
2008 Presidential Elections Results (%) - Republican Party (McCain)
2008 Presidential Elections Results (%) - Other
2012 Presidential Elections Results (%) - Democratic Party (Obama)
2012 Presidential Elections Results (%) - Republican Party (Romney)
2012 Presidential Elections Results (%) - Other
2016 Presidential Elections Results (%) - Democratic Party (Clinton)
2016 Presidential Elections Results (%) - Republican Party (Trump)
2016 Presidential Elections Results (%) - Other
2020 Presidential Elections Results (%) - Democratic Party (Biden)
2020 Presidential Elections Results (%) - Republican Party (Trump)
2020 Presidential Elections Results (%) - Other
Ancestries Reported - Arab (%)
Ancestries Reported - Czech (%)
Ancestries Reported - Danish (%)
Ancestries Reported - Dutch (%)
Ancestries Reported - English (%)
Ancestries Reported - French (%)
Ancestries Reported - French Canadian (%)
Ancestries Reported - German (%)
Ancestries Reported - Greek (%)
Ancestries Reported - Hungarian (%)
Ancestries Reported - Irish (%)
Ancestries Reported - Italian (%)
Ancestries Reported - Lithuanian (%)
Ancestries Reported - Norwegian (%)
Ancestries Reported - Polish (%)
Ancestries Reported - Portuguese (%)
Ancestries Reported - Russian (%)
Ancestries Reported - Scotch-Irish (%)
Ancestries Reported - Scottish (%)
Ancestries Reported - Slovak (%)
Ancestries Reported - Subsaharan African (%)
Ancestries Reported - Swedish (%)
Ancestries Reported - Swiss (%)
Ancestries Reported - Ukrainian (%)
Ancestries Reported - United States (%)
Ancestries Reported - Welsh (%)
Ancestries Reported - West Indian (%)
Ancestries Reported - Other (%)
Educational Attainment - No schooling completed (%)
Educational Attainment - Less than high school (%)
Educational Attainment - High school or equivalent (%)
Educational Attainment - Less than 1 year of college (%)
Educational Attainment - 1 or more years of college (%)
Educational Attainment - Associate degree (%)
Educational Attainment - Bachelor's degree (%)
Educational Attainment - Master's degree (%)
Educational Attainment - Professional school degree (%)
Educational Attainment - Doctorate degree (%)
School Enrollment - Nursery, preschool (%)
School Enrollment - Kindergarten (%)
School Enrollment - Grade 1 to 4 (%)
School Enrollment - Grade 5 to 8 (%)
School Enrollment - Grade 9 to 12 (%)
School Enrollment - College undergrad (%)
School Enrollment - Graduate or professional (%)
School Enrollment - Not enrolled in school (%)
School enrollment - Public schools (%)
School enrollment - Private schools (%)
School enrollment - Not enrolled (%)
Median number of rooms in houses and condos
Median number of rooms in apartments
Housing units lacking complete plumbing facilities (%)
Housing units lacking complete kitchen facilities (%)
Density of houses
Urban houses (%)
Rural houses (%)
Households with people 60 years and over (%)
Households with people 65 years and over (%)
Households with people 75 years and over (%)
Households with one or more nonrelatives (%)
Households with no nonrelatives (%)
Population in households (%)
Family households (%)
Nonfamily households (%)
Population in families (%)
Family households with own children (%)
Median number of bedrooms in owner occupied houses
Mean number of bedrooms in owner occupied houses
Median number of bedrooms in renter occupied houses
Mean number of bedrooms in renter occupied houses
Median number of vehichles in owner occupied houses
Mean number of vehichles in owner occupied houses
Median number of vehichles in renter occupied houses
Mean number of vehichles in renter occupied houses
Mortgage status - with mortgage (%)
Mortgage status - with second mortgage (%)
Mortgage status - with home equity loan (%)
Mortgage status - with both second mortgage and home equity loan (%)
Mortgage status - without a mortgage (%)
Average family size
Average family size - White
Average family size - Black or African American
Average family size - Asian
Average family size - Hispanic or Latino
Average family size - American Indian and Alaska Native
Average family size - Multirace
Average family size - Other Race
Geographical mobility - Same house 1 year ago (%)
Geographical mobility - Moved within same county (%)
Geographical mobility - Moved from different county within same state (%)
Geographical mobility - Moved from different state (%)
Geographical mobility - Moved from abroad (%)
Place of birth - Born in state of residence (%)
Place of birth - Born in other state (%)
Place of birth - Native, outside of US (%)
Place of birth - Foreign born (%)
Housing units in structures - 1, detached (%)
Housing units in structures - 1, attached (%)
Housing units in structures - 2 (%)
Housing units in structures - 3 or 4 (%)
Housing units in structures - 5 to 9 (%)
Housing units in structures - 10 to 19 (%)
Housing units in structures - 20 to 49 (%)
Housing units in structures - 50 or more (%)
Housing units in structures - Mobile home (%)
Housing units in structures - Boat, RV, van, etc. (%)
House/condo owner moved in on average (years ago)
Renter moved in on average (years ago)
Year householder moved into unit - Moved in 1999 to March 2000 (%)
Year householder moved into unit - Moved in 1995 to 1998 (%)
Year householder moved into unit - Moved in 1990 to 1994 (%)
Year householder moved into unit - Moved in 1980 to 1989 (%)
Year householder moved into unit - Moved in 1970 to 1979 (%)
Year householder moved into unit - Moved in 1969 or earlier (%)
Means of transportation to work - Drove car alone (%)
Means of transportation to work - Carpooled (%)
Means of transportation to work - Public transportation (%)
Means of transportation to work - Bus or trolley bus (%)
Means of transportation to work - Streetcar or trolley car (%)
Means of transportation to work - Subway or elevated (%)
Means of transportation to work - Railroad (%)
Means of transportation to work - Ferryboat (%)
Means of transportation to work - Taxicab (%)
Means of transportation to work - Motorcycle (%)
Means of transportation to work - Bicycle (%)
Means of transportation to work - Walked (%)
Means of transportation to work - Other means (%)
Working at home (%)
Industry diversity
Most Common Industries - Agriculture, forestry, fishing and hunting, and mining (%)
Most Common Industries - Agriculture, forestry, fishing and hunting (%)
Most Common Industries - Mining, quarrying, and oil and gas extraction (%)
Most Common Industries - Construction (%)
Most Common Industries - Manufacturing (%)
Most Common Industries - Wholesale trade (%)
Most Common Industries - Retail trade (%)
Most Common Industries - Transportation and warehousing, and utilities (%)
Most Common Industries - Transportation and warehousing (%)
Most Common Industries - Utilities (%)
Most Common Industries - Information (%)
Most Common Industries - Finance and insurance, and real estate and rental and leasing (%)
Most Common Industries - Finance and insurance (%)
Most Common Industries - Real estate and rental and leasing (%)
Most Common Industries - Professional, scientific, and management, and administrative and waste management services (%)
Most Common Industries - Professional, scientific, and technical services (%)
Most Common Industries - Management of companies and enterprises (%)
Most Common Industries - Administrative and support and waste management services (%)
Most Common Industries - Educational services, and health care and social assistance (%)
Most Common Industries - Educational services (%)
Most Common Industries - Health care and social assistance (%)
Most Common Industries - Arts, entertainment, and recreation, and accommodation and food services (%)
Most Common Industries - Arts, entertainment, and recreation (%)
Most Common Industries - Accommodation and food services (%)
Most Common Industries - Other services, except public administration (%)
Most Common Industries - Public administration (%)
Occupation diversity
Most Common Occupations - Management, business, science, and arts occupations (%)
Most Common Occupations - Management, business, and financial occupations (%)
Most Common Occupations - Management occupations (%)
Most Common Occupations - Business and financial operations occupations (%)
Most Common Occupations - Computer, engineering, and science occupations (%)
Most Common Occupations - Computer and mathematical occupations (%)
Most Common Occupations - Architecture and engineering occupations (%)
Most Common Occupations - Life, physical, and social science occupations (%)
Most Common Occupations - Education, legal, community service, arts, and media occupations (%)
Most Common Occupations - Community and social service occupations (%)
Most Common Occupations - Legal occupations (%)
Most Common Occupations - Education, training, and library occupations (%)
Most Common Occupations - Arts, design, entertainment, sports, and media occupations (%)
Most Common Occupations - Healthcare practitioners and technical occupations (%)
Most Common Occupations - Health diagnosing and treating practitioners and other technical occupations (%)
Most Common Occupations - Health technologists and technicians (%)
Most Common Occupations - Service occupations (%)
Most Common Occupations - Healthcare support occupations (%)
Most Common Occupations - Protective service occupations (%)
Most Common Occupations - Fire fighting and prevention, and other protective service workers including supervisors (%)
Most Common Occupations - Law enforcement workers including supervisors (%)
Most Common Occupations - Food preparation and serving related occupations (%)
Most Common Occupations - Building and grounds cleaning and maintenance occupations (%)
Most Common Occupations - Personal care and service occupations (%)
Most Common Occupations - Sales and office occupations (%)
Most Common Occupations - Sales and related occupations (%)
Most Common Occupations - Office and administrative support occupations (%)
Most Common Occupations - Natural resources, construction, and maintenance occupations (%)
Most Common Occupations - Farming, fishing, and forestry occupations (%)
Most Common Occupations - Construction and extraction occupations (%)
Most Common Occupations - Installation, maintenance, and repair occupations (%)
Most Common Occupations - Production, transportation, and material moving occupations (%)
Most Common Occupations - Production occupations (%)
Most Common Occupations - Transportation occupations (%)
Most Common Occupations - Material moving occupations (%)
People in Group quarters - Institutionalized population (%)
People in Group quarters - Correctional institutions (%)
People in Group quarters - Federal prisons and detention centers (%)
People in Group quarters - Halfway houses (%)
People in Group quarters - Local jails and other confinement facilities (including police lockups) (%)
People in Group quarters - Military disciplinary barracks (%)
People in Group quarters - State prisons (%)
People in Group quarters - Other types of correctional institutions (%)
People in Group quarters - Nursing homes (%)
People in Group quarters - Hospitals/wards, hospices, and schools for the handicapped (%)
People in Group quarters - Hospitals/wards and hospices for chronically ill (%)
People in Group quarters - Hospices or homes for chronically ill (%)
People in Group quarters - Military hospitals or wards for chronically ill (%)
People in Group quarters - Other hospitals or wards for chronically ill (%)
People in Group quarters - Hospitals or wards for drug/alcohol abuse (%)
People in Group quarters - Mental (Psychiatric) hospitals or wards (%)
People in Group quarters - Schools, hospitals, or wards for the mentally retarded (%)
People in Group quarters - Schools, hospitals, or wards for the physically handicapped (%)
People in Group quarters - Institutions for the deaf (%)
People in Group quarters - Institutions for the blind (%)
People in Group quarters - Orthopedic wards and institutions for the physically handicapped (%)
People in Group quarters - Wards in general hospitals for patients who have no usual home elsewhere (%)
People in Group quarters - Wards in military hospitals for patients who have no usual home elsewhere (%)
People in Group quarters - Juvenile institutions (%)
People in Group quarters - Long-term care (%)
People in Group quarters - Homes for abused, dependent, and neglected children (%)
People in Group quarters - Residential treatment centers for emotionally disturbed children (%)
People in Group quarters - Training schools for juvenile delinquents (%)
People in Group quarters - Short-term care, detention or diagnostic centers for delinquent children (%)
People in Group quarters - Type of juvenile institution unknown (%)
People in Group quarters - Noninstitutionalized population (%)
People in Group quarters - College dormitories (includes college quarters off campus) (%)
People in Group quarters - Military quarters (%)
People in Group quarters - On base (%)
People in Group quarters - Barracks, unaccompanied personnel housing (UPH), (Enlisted/Officer), ;and similar group living quarters for military personnel (%)
People in Group quarters - Transient quarters for temporary residents (%)
People in Group quarters - Military ships (%)
People in Group quarters - Group homes (%)
People in Group quarters - Homes or halfway houses for drug/alcohol abuse (%)
People in Group quarters - Homes for the mentally ill (%)
People in Group quarters - Homes for the mentally retarded (%)
People in Group quarters - Homes for the physically handicapped (%)
People in Group quarters - Other group homes (%)
People in Group quarters - Religious group quarters (%)
People in Group quarters - Dormitories (%)
People in Group quarters - Agriculture workers' dormitories on farms (%)
People in Group quarters - Job Corps and vocational training facilities (%)
People in Group quarters - Other workers' dormitories (%)
People in Group quarters - Crews of maritime vessels (%)
People in Group quarters - Other nonhousehold living situations (%)
People in Group quarters - Other noninstitutional group quarters (%)
Residents speaking English at home (%)
Residents speaking English at home - Born in the United States (%)
Residents speaking English at home - Native, born elsewhere (%)
Residents speaking English at home - Foreign born (%)
Residents speaking Spanish at home (%)
Residents speaking Spanish at home - Born in the United States (%)
Residents speaking Spanish at home - Native, born elsewhere (%)
Residents speaking Spanish at home - Foreign born (%)
Residents speaking other language at home (%)
Residents speaking other language at home - Born in the United States (%)
Residents speaking other language at home - Native, born elsewhere (%)
Residents speaking other language at home - Foreign born (%)
Class of Workers - Employee of private company (%)
Class of Workers - Self-employed in own incorporated business (%)
Class of Workers - Private not-for-profit wage and salary workers (%)
Class of Workers - Local government workers (%)
Class of Workers - State government workers (%)
Class of Workers - Federal government workers (%)
Class of Workers - Self-employed workers in own not incorporated business and Unpaid family workers (%)
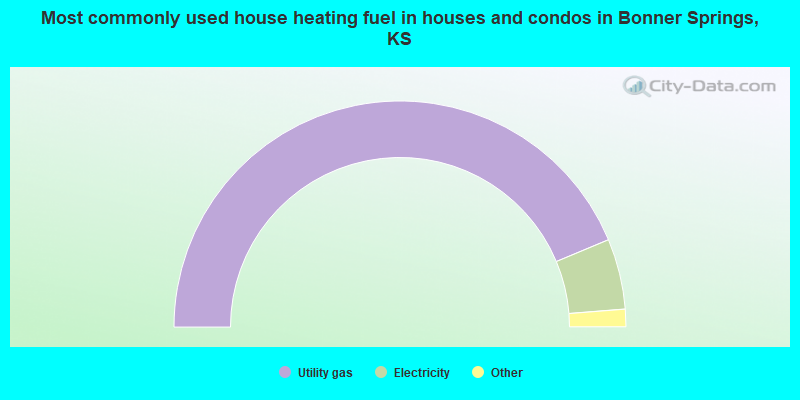
House heating fuel used in houses and condos - Utility gas (%)
House heating fuel used in houses and condos - Bottled, tank, or LP gas (%)
House heating fuel used in houses and condos - Electricity (%)
House heating fuel used in houses and condos - Fuel oil, kerosene, etc. (%)
House heating fuel used in houses and condos - Coal or coke (%)
House heating fuel used in houses and condos - Wood (%)
House heating fuel used in houses and condos - Solar energy (%)
House heating fuel used in houses and condos - Other fuel (%)
House heating fuel used in houses and condos - No fuel used (%)
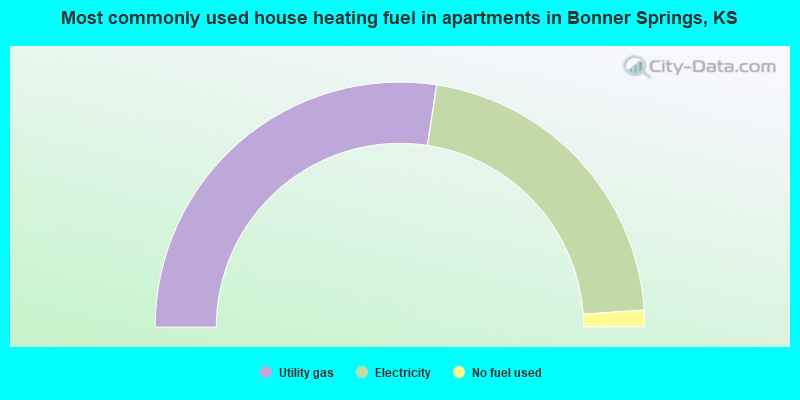
House heating fuel used in apartments - Utility gas (%)
House heating fuel used in apartments - Bottled, tank, or LP gas (%)
House heating fuel used in apartments - Electricity (%)
House heating fuel used in apartments - Fuel oil, kerosene, etc. (%)
House heating fuel used in apartments - Coal or coke (%)
House heating fuel used in apartments - Wood (%)
House heating fuel used in apartments - Solar energy (%)
House heating fuel used in apartments - Other fuel (%)
House heating fuel used in apartments - No fuel used (%)
Armed forces status - In Armed Forces (%)
Armed forces status - Civilian (%)
Armed forces status - Civilian - Veteran (%)
Armed forces status - Civilian - Nonveteran (%)
Fatal accidents locations in years 2005-2021
Fatal accidents locations in 2005
Fatal accidents locations in 2006
Fatal accidents locations in 2007
Fatal accidents locations in 2008
Fatal accidents locations in 2009
Fatal accidents locations in 2010
Fatal accidents locations in 2011
Fatal accidents locations in 2012
Fatal accidents locations in 2013
Fatal accidents locations in 2014
Fatal accidents locations in 2015
Fatal accidents locations in 2016
Fatal accidents locations in 2017
Fatal accidents locations in 2018
Fatal accidents locations in 2019
Fatal accidents locations in 2020
Fatal accidents locations in 2021
Alcohol use - People drinking some alcohol every month (%)
Alcohol use - People not drinking at all (%)
Alcohol use - Average days/month drinking alcohol
Alcohol use - Average drinks/week
Alcohol use - Average days/year people drink much
Audiometry - Average condition of hearing (%)
Audiometry - People that can hear a whisper from across a quiet room (%)
Audiometry - People that can hear normal voice from across a quiet room (%)
Audiometry - Ears ringing, roaring, buzzing (%)
Audiometry - Had a job exposure to loud noise (%)
Audiometry - Had off-work exposure to loud noise (%)
Blood Pressure & Cholesterol - Has high blood pressure (%)
Blood Pressure & Cholesterol - Checking blood pressure at home (%)
Blood Pressure & Cholesterol - Frequently checking blood cholesterol (%)
Blood Pressure & Cholesterol - Has high cholesterol level (%)
Consumer Behavior - Money monthly spent on food at supermarket/grocery store
Consumer Behavior - Money monthly spent on food at other stores
Consumer Behavior - Money monthly spent on eating out
Consumer Behavior - Money monthly spent on carryout/delivered foods
Consumer Behavior - Income spent on food at supermarket/grocery store (%)
Consumer Behavior - Income spent on food at other stores (%)
Consumer Behavior - Income spent on eating out (%)
Consumer Behavior - Income spent on carryout/delivered foods (%)
Current Health Status - General health condition (%)
Current Health Status - Blood donors (%)
Current Health Status - Has blood ever tested for HIV virus (%)
Current Health Status - Left-handed people (%)
Dermatology - People using sunscreen (%)
Diabetes - Diabetics (%)
Diabetes - Had a blood test for high blood sugar (%)
Diabetes - People taking insulin (%)
Diet Behavior & Nutrition - Diet health (%)
Diet Behavior & Nutrition - Milk product consumption (# of products/month)
Diet Behavior & Nutrition - Meals not home prepared (#/week)
Diet Behavior & Nutrition - Meals from fast food or pizza place (#/week)
Diet Behavior & Nutrition - Ready-to-eat foods (#/month)
Diet Behavior & Nutrition - Frozen meals/pizza (#/month)
Drug Use - People that ever used marijuana or hashish (%)
Drug Use - Ever used hard drugs (%)
Drug Use - Ever used any form of cocaine (%)
Drug Use - Ever used heroin (%)
Drug Use - Ever used methamphetamine (%)
Health Insurance - People covered by health insurance (%)
Kidney Conditions-Urology - Avg. # of times urinating at night
Medical Conditions - People with asthma (%)
Medical Conditions - People with anemia (%)
Medical Conditions - People with psoriasis (%)
Medical Conditions - People with overweight (%)
Medical Conditions - Elderly people having difficulties in thinking or remembering (%)
Medical Conditions - People who ever received blood transfusion (%)
Medical Conditions - People having trouble seeing even with glass/contacts (%)
Medical Conditions - People with arthritis (%)
Medical Conditions - People with gout (%)
Medical Conditions - People with congestive heart failure (%)
Medical Conditions - People with coronary heart disease (%)
Medical Conditions - People with angina pectoris (%)
Medical Conditions - People who ever had heart attack (%)
Medical Conditions - People who ever had stroke (%)
Medical Conditions - People with emphysema (%)
Medical Conditions - People with thyroid problem (%)
Medical Conditions - People with chronic bronchitis (%)
Medical Conditions - People with any liver condition (%)
Medical Conditions - People who ever had cancer or malignancy (%)
Mental Health - People who have little interest in doing things (%)
Mental Health - People feeling down, depressed, or hopeless (%)
Mental Health - People who have trouble sleeping or sleeping too much (%)
Mental Health - People feeling tired or having little energy (%)
Mental Health - People with poor appetite or overeating (%)
Mental Health - People feeling bad about themself (%)
Mental Health - People who have trouble concentrating on things (%)
Mental Health - People moving or speaking slowly or too fast (%)
Mental Health - People having thoughts they would be better off dead (%)
Oral Health - Average years since last visit a dentist
Oral Health - People embarrassed because of mouth (%)
Oral Health - People with gum disease (%)
Oral Health - General health of teeth and gums (%)
Oral Health - Average days a week using dental floss/device
Oral Health - Average days a week using mouthwash for dental problem
Oral Health - Average number of teeth
Pesticide Use - Households using pesticides to control insects (%)
Pesticide Use - Households using pesticides to kill weeds (%)
Physical Activity - People doing vigorous-intensity work activities (%)
Physical Activity - People doing moderate-intensity work activities (%)
Physical Activity - People walking or bicycling (%)
Physical Activity - People doing vigorous-intensity recreational activities (%)
Physical Activity - People doing moderate-intensity recreational activities (%)
Physical Activity - Average hours a day doing sedentary activities
Physical Activity - Average hours a day watching TV or videos
Physical Activity - Average hours a day using computer
Physical Functioning - People having limitations keeping them from working (%)
Physical Functioning - People limited in amount of work they can do (%)
Physical Functioning - People that need special equipment to walk (%)
Physical Functioning - People experiencing confusion/memory problems (%)
Physical Functioning - People requiring special healthcare equipment (%)
Prescription Medications - Average number of prescription medicines taking
Preventive Aspirin Use - Adults 40+ taking low-dose aspirin (%)
Reproductive Health - Vaginal deliveries (%)
Reproductive Health - Cesarean deliveries (%)
Reproductive Health - Deliveries resulted in a live birth (%)
Reproductive Health - Pregnancies resulted in a delivery (%)
Reproductive Health - Women breastfeeding newborns (%)
Reproductive Health - Women that had a hysterectomy (%)
Reproductive Health - Women that had both ovaries removed (%)
Reproductive Health - Women that have ever taken birth control pills (%)
Reproductive Health - Women taking birth control pills (%)
Reproductive Health - Women that have ever used Depo-Provera or injectables (%)
Reproductive Health - Women that have ever used female hormones (%)
Sexual Behavior - People 18+ that ever had sex (vaginal, anal, or oral) (%)
Sexual Behavior - Males 18+ that ever had vaginal sex with a woman (%)
Sexual Behavior - Males 18+ that ever performed oral sex on a woman (%)
Sexual Behavior - Males 18+ that ever had anal sex with a woman (%)
Sexual Behavior - Males 18+ that ever had any sex with a man (%)
Sexual Behavior - Females 18+ that ever had vaginal sex with a man (%)
Sexual Behavior - Females 18+ that ever performed oral sex on a man (%)
Sexual Behavior - Females 18+ that ever had anal sex with a man (%)
Sexual Behavior - Females 18+ that ever had any kind of sex with a woman (%)
Sexual Behavior - Average age people first had sex
Sexual Behavior - Average number of female sex partners in lifetime (males 18+)
Sexual Behavior - Average number of female vaginal sex partners in lifetime (males 18+)
Sexual Behavior - Average age people first performed oral sex on a woman (18+)
Sexual Behavior - Average number of woman performed oral sex on in lifetime (18+)
Sexual Behavior - Average number of male sex partners in lifetime (males 18+)
Sexual Behavior - Average number of male anal sex partners in lifetime (males 18+)
Sexual Behavior - Average age people first performed oral sex on a man (18+)
Sexual Behavior - Average number of male oral sex partners in lifetime (18+)
Sexual Behavior - People using protection when performing oral sex (%)
Sexual Behavior - Average number of times people have vaginal or anal sex a year
Sexual Behavior - People having sex without condom (%)
Sexual Behavior - Average number of male sex partners in lifetime (females 18+)
Sexual Behavior - Average number of male vaginal sex partners in lifetime (females 18+)
Sexual Behavior - Average number of female sex partners in lifetime (females 18+)
Sexual Behavior - Circumcised males 18+ (%)
Sleep Disorders - Average hours sleeping at night
Sleep Disorders - People that has trouble sleeping (%)
Smoking-Cigarette Use - People smoking cigarettes (%)
Taste & Smell - People 40+ having problems with smell (%)
Taste & Smell - People 40+ having problems with taste (%)
Taste & Smell - People 40+ that ever had wisdom teeth removed (%)
Taste & Smell - People 40+ that ever had tonsils teeth removed (%)
Taste & Smell - People 40+ that ever had a loss of consciousness because of a head injury (%)
Taste & Smell - People 40+ that ever had a broken nose or other serious injury to face or skull (%)
Taste & Smell - People 40+ that ever had two or more sinus infections (%)
Weight - Average height (inches)
Weight - Average weight (pounds)
Weight - Average BMI
Weight - People that are obese (%)
Weight - People that ever were obese (%)
Weight - People trying to lose weight (%)
Officers per 1,000 residents here:
2.85Kansas average:
2.70
Latest news from Bonner Springs, KS collected exclusively by city-data.com from local newspapers, TV, and radio stations
Ancestries: German (14.9%), American (10.4%), Afghan (9.3%), Irish (8.9%), English (5.0%), Scottish (3.1%).
Current Local Time:
Incorporated on 11/10/1898
Land area: 15.8 square miles.
Population density: 486 people per square mile (low).
630 residents are foreign born (4.6% Asia , 3.4% Latin America ).
This city:
8.2%Kansas:
7.1%
Median real estate property taxes paid for housing units with mortgages in 2022: $3,383 (1.3%)Median real estate property taxes paid for housing units with no mortgage in 2022: $3,582 (1.6%)
Nearest city with pop. 50,000+: Kansas City, KS
Nearest city with pop. 200,000+: Kansas City, MO
Nearest city with pop. 1,000,000+: Chicago, IL
Nearest cities:
Latitude: 39.07 N, Longitude: 94.88 W
Daytime population change due to commuting: +1 (+0.0%)Workers who live and work in this city: 1,096 (29.4%)
Single-family new house construction building permits:
2022: 4 buildings , average cost: $399,5002021: 4 buildings , average cost: $321,3002020: 8 buildings , average cost: $215,0002019: 5 buildings , average cost: $302,2002018: 10 buildings , average cost: $298,0002017: 12 buildings , average cost: $210,9002016: 25 buildings , average cost: $150,2002015: 23 buildings , average cost: $144,8002014: 11 buildings , average cost: $179,3002013: 14 buildings , average cost: $186,6002012: 23 buildings , average cost: $183,1002011: 16 buildings , average cost: $172,5002010: 8 buildings , average cost: $179,8002009: 9 buildings , average cost: $157,7002008: 31 buildings , average cost: $178,2002007: 50 buildings , average cost: $144,1002006: 48 buildings , average cost: $152,1002005: 70 buildings , average cost: $186,5002004: 53 buildings , average cost: $139,6002003: 45 buildings , average cost: $139,8002002: 21 buildings , average cost: $133,8002001: 13 buildings , average cost: $115,0002000: 20 buildings , average cost: $88,2001999: 19 buildings , average cost: $111,8001998: 11 buildings , average cost: $104,8001997: 16 buildings , average cost: $93,800Unemployment in December 2023: Population change in the 1990s: +433 (+6.8%).
Most common occupations in Bonner Springs, KS (%)
Both Males Females
Other office and administrative support workers, including supervisors (4.7%)
Other sales and related occupations, including supervisors (4.4%)
Building and grounds cleaning and maintenance occupations (4.1%)
Preschool, kindergarten, elementary, and middle school teachers (3.7%)
Other management occupations, except farmers and farm managers (3.4%)
Laborers and material movers, hand (3.2%)
Material recording, scheduling, dispatching, and distributing workers (3.0%)
Carpenters (5.1%)
Driver/sales workers and truck drivers (5.1%)
Other sales and related occupations, including supervisors (4.8%)
Electrical equipment mechanics and other installation, maintenance, and repair workers, including supervisors (4.6%)
Material recording, scheduling, dispatching, and distributing workers (4.5%)
Vehicle and mobile equipment mechanics, installers, and repairers (4.3%)
Laborers and material movers, hand (4.3%)
Other office and administrative support workers, including supervisors (7.9%)
Preschool, kindergarten, elementary, and middle school teachers (5.3%)
Secretaries and administrative assistants (4.7%)
Cashiers (4.2%)
Building and grounds cleaning and maintenance occupations (4.2%)
Registered nurses (4.0%)
Other management occupations, except farmers and farm managers (4.0%)
Tornado activity:
Bonner Springs-area historical tornado activity is slightly above Kansas state average. It is 108% greater than the overall U.S. average.
On 5/4/2003, a category F4 (max. wind speeds 207-260 mph) tornado 2.6 miles away from the Bonner Springs city center killed 2 people and injured 30 people and caused $48 million in damages.
On 5/20/1957, a category F5 (max. wind speeds 261-318 mph) tornado 26.4 miles away from the city center killed 44 people and injured 207 people and caused between $500,000 and $5,000,000 in damages.
Earthquake activity:
Bonner Springs-area historical earthquake activity is significantly above Kansas state average. It is 518% greater than the overall U.S. average. On 9/3/2016 at 12:02:44, a magnitude 5.8 (5.8 MW, Depth: 3.5 mi, Class: Moderate, Intensity: VI - VII) earthquake occurred 214.4 miles away from Bonner Springs center On 11/6/2011 at 03:53:10, a magnitude 5.7 (5.7 MW, Depth: 3.2 mi) earthquake occurred 265.6 miles away from Bonner Springs center On 11/12/2014 at 21:40:00, a magnitude 4.9 (4.9 MW, Depth: 2.5 mi, Class: Light, Intensity: IV - V) earthquake occurred 194.0 miles away from Bonner Springs center On 11/7/2016 at 01:44:24, a magnitude 5.0 (5.0 MW, Depth: 2.8 mi) earthquake occurred 237.5 miles away from Bonner Springs center On 2/13/2016 at 17:07:06, a magnitude 5.1 (5.1 MW, Depth: 5.2 mi) earthquake occurred 274.9 miles away from the city center On 1/19/2020 at 19:08:42, a magnitude 4.5 (4.5 MW, Depth: 3.1 mi) earthquake occurred 182.2 miles away from Bonner Springs center Magnitude types: moment magnitude (MW) Natural disasters: The number of natural disasters in Wyandotte County (19) is greater than the US average (15).Major Disasters (Presidential) Declared: 14Emergencies Declared: 3Floods: 13, Storms: 11, Tornadoes: 6, Winter Storms: 3, Winds: 2, Heavy Rain: 1, Hurricane: 1, Ice Storm: 1, Snowstorm: 1, Other: 1 (Note: some incidents may be assigned to more than one category). Hospitals and medical centers in Bonner Springs: BONNER SPRINGS NURSING AND REHABILITATION CENTER (520 E MORSE)
HILLSIDE HEALTH CARE CENTER (510 E MORSE AVE)
Other hospitals and medical centers near Bonner Springs: GOLDEN LIVINGCENTER - KAW RIVER (Nursing Home, about 4 miles away; EDWARDSVILLE, KS)
SUNSHINE HOME HEALTH CARE (Home Health Center, about 5 miles away; BASEHOR, KS)
HEART OF AMERICA SURGERY CENTER (Hospital, about 7 miles away; KANSAS CITY, KS)
PROVIDENCE MEDICAL CENTER (about 7 miles away; KANSAS CITY, KS)
WYANDOTTE WEST DIALYSIS (Dialysis Facility, about 7 miles away; KANSAS CITY, KS)
PROVIDENCE PLACE (Nursing Home, about 7 miles away; KANSAS CITY, KS)
CEDAR RIDGE HOSPITAL (Hospital, about 8 miles away; LENEXA, KS)
Airports located in Bonner Springs: Amtrak station near Bonner Springs: 16 miles: KANSAS CITY (2200 MAIN ST.) Services: ticket office, fully wheelchair accessible, enclosed waiting area, public restrooms, public payphones, snack bar, free short-term parking, paid long-term parking, call for car rental service, taxi stand, public transit connection.
Colleges/universities with over 2000 students nearest to Bonner Springs:
Kansas City Kansas Community College (about 9 miles; Kansas City, KS ; Full-time enrollment: 4,718)
Johnson County Community College (about 13 miles; Overland Park, KS ; FT enrollment: 11,976)
Park University (about 14 miles; Parkville, MO ; FT enrollment: 9,131)
MidAmerica Nazarene University (about 15 miles; Olathe, KS ; FT enrollment: 2,158)
Wright Career College (about 15 miles; Overland Park, KS ; FT enrollment: 3,107)
Metropolitan Community College-Kansas City (about 16 miles; Kansas City, MO ; FT enrollment: 12,834)
University of Missouri-Kansas City (about 17 miles; Kansas City, MO ; FT enrollment: 10,544)
Public high school in Bonner Springs:
Public elementary/middle schools in Bonner Springs:
See full list of schools located in Bonner Springs Library in Bonner Springs: BONNER SPRINGS CITY LIBRARY Operating income: $446,751; Location: 200 E. THIRD STREET; 36,131 books ; 3,494 audio materials ; 2,739 video materials ; 30 state licensed databases ; 86 print serial subscriptions )
Notable locations in Bonner Springs: (A) , North Shawnee Business Park (B) , Camp Tawasee (C) , Sunflower Hills Golf Course (D) , Northridge Centre (E) , Kaw Drive Shops (F) , Bonner Shops (G) , Bonner Springs Industrial Park (H) , Camp Naish (I) , Bonner Springs City Hall Holding Cell (J) , Bonner Springs Police Department (K) , Bonner Springs Community Center (L) , Bonner Springs City Library (M) , Bonner Springs City Hall (N) , George Meyn Center (O) , Wyandotte County Museum and Historical Society (P) , National Agricultural Hall of Fame (Q) , Agriculture Hall of Fame (R) , Centennial Center (S) , Centers for Long Term Care of Bonner Springs (T) . Display/hide their locations on the map
Churches in Bonner Springs include: (A) , Bonner Springs United Methodist Church (B) , Bible Baptist Church (C) , Calvary Bible Church (D) , First Pentecostal Church (E) , Landmark Baptist Church (F) , Emmaus Lutheran Church (G) , Olivet Church of God in Christ (H) , First Baptist Church (I) . Display/hide their locations on the map
Cemetery: (1) . Display/hide its location on the map
Reservoir: (A) . Display/hide its location on the map
Creeks: (A) , Spring Creek (B) . Display/hide their locations on the map
Park in Bonner Springs: (1) . Display/hide its location on the map
Tourist attractions:
Birthplace of: Myra Taylor (jazz singer) - Actress.
Wyandotte County has a predicted average indoor radon screening level greater than 4 pCi/L (pico curies per liter) - Highest Potential Drinking water stations with addresses in Bonner Springs and their reported violations in the past:
BONNER SPRINGS, CITY OF (Population served: 7,419, Purch groundwater under infl of surface water):
Past monitoring violations:
One minor monitoring violation
Drinking water stations with addresses in Bonner Springs that have no violations reported:
LEAVENWORTH CO RWD 7 (Population served: 3,000, Primary Water Source Type: Groundwater)
Average household size: This city:
2.6 peopleKansas:
2.5 people
Percentage of family households: This city:
68.2%Whole state:
66.0%
Percentage of households with unmarried partners: This city:
7.3%Whole state:
5.8%
Likely homosexual households (counted as self-reported same-sex unmarried-partner households)
Lesbian couples: 0.4% of all households Gay men: 0.2% of all households
42 people in nursing facilities/skilled-nursing facilities in 2010people in nursing homes in 2000
Banks with branches in Bonner Springs (2011 data):
U.S. Bank National Association: Bonner Springs Branch at 13020 Canaan Drive, branch established on 2011/03/14. Info updated 2012/01/30: Bank assets: $330,470.8 mil, Deposits: $236,091.5 mil, headquarters in Cincinnati, OH, positive income , 3121 total offices , Holding Company: U.S. Bancorp
Commerce Bank: Bonner Springs Branch at 13010 S Commercial Dr, branch established on 1888/01/01. Info updated 2011/07/07: Bank assets: $20,493.6 mil, Deposits: $16,805.3 mil, headquarters in Kansas City, MO, positive income , 206 total offices , Holding Company: Commerce Bancshares, Inc.
Inter-State Federal Savings and Loan Association of Kansas City: 132 Oak St Branch at 132 Oak Street, branch established on 1889/01/01. Info updated 2011/07/21: Bank assets: $250.8 mil, Deposits: $158.2 mil, headquarters in Kansas City, KS, positive income , Mortgage Lending Specialization, 5 total offices
Armed Forces Bank, National Association: Bonner Springs Wal-Mart Branch # 58 at 12801 Kansas Avenue, branch established on 2002/10/30. Info updated 2010/12/16: Bank assets: $1,839.7 mil, Deposits: $1,387.5 mil, headquarters in Fort Leavenworth, KS, negative income in the last year , Commercial Lending Specialization, 78 total offices , Holding Company: Dickinson Financial Corporation Ii
Mutual Savings Association, FSA: Bonner Springs Branch at 229 Oak, branch established on 1997/12/01. Info updated 2011/07/21: Bank assets: $217.9 mil, Deposits: $159.3 mil, headquarters in Leavenworth, KS, negative income in the last year , Mortgage Lending Specialization, 6 total offices
Union Bank and Trust Company: Commercial State Bk. Of Bonner Sprin at 309 Oak Street, branch established on 1918/01/01. Info updated 2006/06/06: Bank assets: $2,481.6 mil, Deposits: $2,115.9 mil, headquarters in Lincoln, NE, positive income , Commercial Lending Specialization, 37 total offices , Holding Company: Farmers & Merchants Investment, Inc.
KCB Bank: Bonner Springs Lpo Branch at 13100 Kansas Ave., branch established on 2010/11/15. Info updated 2006/10/19: Bank assets: $172.5 mil, Deposits: $144.9 mil, headquarters in Kearney, MO, positive income , Commercial Lending Specialization, 5 total offices , Holding Company: Bancshares Of Missouri, Inc.
For population 15 years and over in Bonner Springs:
Never married: 27.7%Now married: 56.0%Separated: 0.0%Widowed: 5.2%Divorced: 11.1% For population 25 years and over in Bonner Springs:
High school or higher: 88.2%Bachelor's degree or higher: 23.4%Graduate or professional degree: 7.9%Unemployed: 4.4%Mean travel time to work (commute): 20.1 minutes
Education Gini index (Inequality in education) Here:
12.2Kansas average:
11.5
Religion statistics for Bonner Springs, KS (based on Wyandotte County data)
Religion Adherents Congregations Catholic 24,812 11 Evangelical Protestant 24,572 152 Black Protestant 15,670 51 Mainline Protestant 8,426 54 Other 3,532 13 Orthodox 237 4 None 80,256 -
Source: Clifford Grammich, Kirk Hadaway, Richard Houseal, Dale E.Jones, Alexei Krindatch, Richie Stanley and Richard H.Taylor. 2012. 2010 U.S.Religion Census: Religious Congregations & Membership Study. Association of Statisticians of American Religious Bodies. Jones, Dale E., et al. 2002. Congregations and Membership in the United States 2000. Nashville, TN: Glenmary Research Center. Graphs represent county-level data
Food Environment Statistics: Number of grocery stores : 23Here :
1.50 / 10,000 pop.Kansas :
1.96 / 10,000 pop.
Number of supercenters and club stores : 1Wyandotte County :
0.07 / 10,000 pop.Kansas :
0.20 / 10,000 pop.
Number of convenience stores (no gas) : 12Here :
0.78 / 10,000 pop.State :
0.51 / 10,000 pop.
Number of convenience stores (with gas) : 50This county :
3.26 / 10,000 pop.Kansas :
3.84 / 10,000 pop.
Number of full-service restaurants : 83Wyandotte County :
5.40 / 10,000 pop.State :
7.33 / 10,000 pop.
Adult diabetes rate : Wyandotte County :
9.5%Kansas :
8.1%
Adult obesity rate : This county :
31.1%Kansas :
27.9%
Low-income preschool obesity rate : Wyandotte County :
12.1%Kansas :
13.4%
Health and Nutrition: Healthy diet rate : Bonner Springs:
48.3%Kansas:
49.2%
Average overall health of teeth and gums : This city:
45.2%Kansas:
46.3%
People feeling badly about themselves : Bonner Springs:
20.3%State:
21.2%
People not drinking alcohol at all : Bonner Springs:
9.9%Kansas:
10.5%
Average hours sleeping at night : Overweight people : Bonner Springs:
34.3%State:
33.5%
General health condition : This city:
55.8%Kansas:
56.0%
Average condition of hearing : Bonner Springs:
78.7%Kansas:
78.6%
More about Health and Nutrition of Bonner Springs, KS Residents
Local government employment and payroll (March 2022)
Function
Full-time employees
Monthly full-time payroll
Average yearly full-time wage
Part-time employees
Monthly part-time payroll
Police Protection - Officers
23 $123,951 $64,670 0 $0 Firefighters
8 $44,402 $66,603 29 $3,734 Other and Unallocable
7 $44,280 $75,909 1 $494 Parks and Recreation
7 $26,203 $44,919 2 $1,313 Streets and Highways
6 $21,868 $43,736 0 $0 Water Supply
5 $23,694 $56,866 0 $0 Other Government Administration
5 $35,376 $84,902 10 $3,403 Financial Administration
5 $23,691 $56,858 0 $0 Sewerage
4 $15,367 $46,101 0 $0 Police - Other
3 $10,844 $43,376 0 $0 Judicial and Legal
2 $15,103 $90,618 1 $1,654 Transit
0 $0 3 $2,748
Totals for Government
75 $384,780 $61,565 46 $13,345
Bonner Springs government finances - Expenditure in 2021 (per resident):
Construction - Regular Highways: $963,000 ($125.62)
Current Operations - Police Protection: $2,838,000 ($370.21)
General - Other: $1,747,000 ($227.89)Water Utilities: $1,353,000 ($176.49)Regular Highways: $1,217,000 ($158.75)Sewerage: $1,096,000 ($142.97)Central Staff Services: $792,000 ($103.31)Libraries: $715,000 ($93.27)Financial Administration: $620,000 ($80.88)Solid Waste Management: $449,000 ($58.57)Parks and Recreation: $404,000 ($52.70)Housing and Community Development: $339,000 ($44.22)Local Fire Protection: $232,000 ($30.26)Miscellaneous Commercial Activities - Other: $107,000 ($13.96)Transit Utilities: $64,000 ($8.35)Health - Other: $26,000 ($3.39)General - Interest on Debt: $547,000 ($71.35)
Other Capital Outlay - General - Other: $1,427,000 ($186.15)
Parks and Recreation: $1,185,000 ($154.58)Sewerage: $774,000 ($100.97)Police Protection: $750,000 ($97.83)Regular Highways: $428,000 ($55.83)Water Utilities: $403,000 ($52.57)Transit Utilities: $61,000 ($7.96)Miscellaneous Commercial Activities - Other: $23,000 ($3.00)Local Fire Protection: $1,000 ($0.13)Total Salaries and Wages: $6,418,000 ($837.20)
Water Utilities - Interest on Debt: $79,000 ($10.31)
Bonner Springs government finances - Revenue in 2021 (per resident):
Charges - Sewerage: $2,031,000 ($264.94)
Other: $478,000 ($62.35)Solid Waste Management: $444,000 ($57.92)Parks and Recreation: $350,000 ($45.66)Housing and Community Development: $140,000 ($18.26)Miscellaneous Commercial Activities: $45,000 ($5.87)Federal Intergovernmental - Housing and Community Development: $186,000 ($24.26)
Miscellaneous - General Revenue - Other: $1,349,000 ($175.97)
Interest Earnings: $556,000 ($72.53)Fines and Forfeits: $512,000 ($66.79)Special Assessments: $125,000 ($16.31)Revenue - Water Utilities: $2,418,000 ($315.42)
Transit Utilities: $8,000 ($1.04)State Intergovernmental - Other: $755,000 ($98.49)
Highways: $365,000 ($47.61)General Local Government Support: $173,000 ($22.57)Transit Utilities: $99,000 ($12.91)Tax - General Sales and Gross Receipts: $5,658,000 ($738.06)
Property: $3,620,000 ($472.21)Other License: $378,000 ($49.31)Other Selective Sales: $100,000 ($13.04)Amusements License: $29,000 ($3.78)
Bonner Springs government finances - Debt in 2021 (per resident):
Long Term Debt - Beginning Outstanding - Unspecified Public Purpose: $11,956,000 ($1559.61)
Outstanding Unspecified Public Purpose: $9,766,000 ($1273.94)Beginning Outstanding - Public Debt for Private Purpose: $3,974,000 ($518.39)Outstanding Nonguaranteed - Industrial Revenue: $3,808,000 ($496.74)Retired Unspecified Public Purpose: $2,190,000 ($285.68)Retired Nonguaranteed - Public Debt for Private Purpose: $166,000 ($21.65)
Bonner Springs government finances - Cash and Securities in 2021 (per resident):
Bond Funds - Cash and Securities: $686,000 ($89.49)
Other Funds - Cash and Securities: $10,845,000 ($1414.69)
Sinking Funds - Cash and Securities: $6,998,000 ($912.86)
Businesses in Bonner Springs, KS
Name Count Name Count
Arby's 1 RadioShack 1 Burger King 1 SONIC Drive-In 1 Cricket Wireless 1 Subway 3 Dairy Queen 1 Super 8 1 FedEx 2 T-Mobile 2 Ford 1 Taco Bell 1 H&R Block 1 True Value 1 Holiday Inn 1 U-Haul 1 KFC 1 Waffle House 1 McDonald's 1 Walgreens 1 Penske 1 Walmart 1 Pizza Hut 1 Wendy's 1 Quiznos 1 YMCA 1
Strongest AM radio stations in Bonner Springs:
WHB (810 AM; 50 kW; KANSAS CITY, MO; Owner: UNION BROADCASTING, INC.)
KCSP (610 AM; 5 kW; KANSAS CITY, MO; Owner: ENTERCOM KANSAS CITY LICENSE, LLC)
KKHK (1250 AM; 25 kW; KANSAS CITY, KS)
KXTR (1660 AM; 10 kW; KANSAS CITY, KS; Owner: ENTERCOM KANSAS CITY LICENSE, LLC)
KMBZ (980 AM; 5 kW; KANSAS CITY, MO; Owner: ENTERCOM KANSAS CITY LICENSE, LLC)
KCCV (760 AM; daytime; 6 kW; OVERLAND PARK, KS; Owner: BOTT BROADCASTING COMPANY)
KCMO (710 AM; 10 kW; KANSAS CITY, MO; Owner: SUSQUEHANNA KANSAS CITY PARTNERSHIP)
KKLO (1410 AM; 5 kW; LEAVENWORTH, KS; Owner: CHARA COMMUNICATIONS, INC.)
KCNW (1380 AM; 2 kW; FAIRWAY, KS; Owner: KANSAS CITY RADIO, INC.)
KCTE (1510 AM; daytime; 10 kW; INDEPENDENCE, MO; Owner: UNION BROADCASTING, INC.)
KPHN (1190 AM; 5 kW; KANSAS CITY, MO; Owner: ABC, INC.)
KCZZ (1480 AM; 1 kW; MISSION, KS; Owner: HMEB COMMUNICATIONS, L.L.C.)
KCKN (1340 AM; 1 kW; KANSAS CITY, KS; Owner: CARTER BROADCAST GROUP, INC.)
Strongest FM radio stations in Bonner Springs:
KFKF-FM (94.1 FM; KANSAS CITY, KS; Owner: INFINITY RADIO SUBSIDIARY OPERATIONS INC.)
KZPL (97.3 FM; LEE'S SUMMIT, MO; Owner: UNION FIRST BROADCASTING, LLC)
KCCV-FM (92.3 FM; OLATHE, KS; Owner: BOTT BROADCASTING COMPANY)
KCMO-FM (94.9 FM; KANSAS CITY, MO; Owner: SUSQUEHANNA KANSAS CITY PARTNERSHIP)
KQRC-FM (98.9 FM; LEAVENWORTH, KS; Owner: ENTERCOM KANSAS CITY LICENSE, LLC)
KRBZ (96.5 FM; KANSAS CITY, MO; Owner: ENTERCOM KANSAS CITY LICENSE, LLC)
KYYS (99.7 FM; KANSAS CITY, MO; Owner: ENTERCOM KANSAS CITY LICENSE, LLC)
KMXV (93.3 FM; KANSAS CITY, MO; Owner: INFINITY RADIO OPERATIONS INC.)
WDAF-FM (106.5 FM; LIBERTY, MO; Owner: ENTERCOM KANSAS CITY LICENSE, LLC)
KUDL (98.1 FM; KANSAS CITY, KS; Owner: ENTERCOM KANSAS CITY LICENSE, LLC)
KSRC (102.1 FM; KANSAS CITY, MO; Owner: INFINITY RADIO OPERATIONS INC.)
KPRS (103.3 FM; KANSAS CITY, MO; Owner: CARTER BROADCAST GROUP, INC.)
KBEQ-FM (104.3 FM; KANSAS CITY, MO; Owner: INFINITY RADIO SUBSIDIARY OPERATIONS INC.)
KCUR-FM (89.3 FM; KANSAS CITY, MO; Owner: CURATORS OF UNIVERSITY OF MISSOURI)
KLJC (88.5 FM; KANSAS CITY, MO; Owner: CALVARY BIBLE COLLEGE)
KANU (91.5 FM; LAWRENCE, KS; Owner: UNIVERSITY OF KANSAS)
KCFX (101.1 FM; HARRISONVILLE, MO; Owner: SUSQUEHANNA KANSAS CITY PARTNERSHIP)
KKFI (90.1 FM; KANSAS CITY, MO; Owner: MID-COAST RADIO PROJECT, INC.)
KLZR (105.9 FM; LAWRENCE, KS; Owner: ZIMMER RADIO OF MID-MISSOURI, INC)
KCHZ (95.7 FM; OTTAWA, KS; Owner: SYNCOM RADIO CORPORATION)
TV broadcast stations around Bonner Springs:
KCTV (Channel 5; KANSAS CITY, MO; Owner: MEREDITH CORPORATION)
KSHB-TV (Channel 41; KANSAS CITY, MO; Owner: SCRIPPS HOWARD BROADCASTING COMPANY)
KMBC-TV (Channel 9; KANSAS CITY, MO; Owner: KMBC HEARST-ARGYLE TELEVISION, INC.)
WDAF-TV (Channel 4; KANSAS CITY, MO; Owner: WDAF LICENSE, INC.)
KMCI (Channel 38; LAWRENCE, KS; Owner: SCRIPPS HOWARD BROADCASTING COMPANY)
KPXE (Channel 50; KANSAS CITY, MO; Owner: PAXSON KANSAS CITY LICENSE, INC.)
KCWE (Channel 29; KANSAS CITY, MO; Owner: KCWE-TV, INC.)
KCPT (Channel 19; KANSAS CITY, MO; Owner: PUBLIC TELEVISION 19, INC.)
KSMO-TV (Channel 62; KANSAS CITY, MO; Owner: KSMO LICENSEE, INC.)
K35CT (Channel 35; KANSAS CITY, MO; Owner: WORD OF GOD FELLOWSHIP, INC.)
K48FS (Channel 48; KANSAS CITY, MO; Owner: WORD OF GOD FELLOWSHIP, INC.)
K26CR (Channel 26; KANSAS CITY, MO; Owner: VENTANA TELEVISION, INC.)
KTAJ (Channel 16; ST. JOSEPH, MO; Owner: TRINITY BROADCASTING NETWORK)
KUJH-LP (Channel 14; LAWRENCE, KS; Owner: UNIVERSITY OF KANSAS)
K27FR (Channel 27; OVERLAND PARK, KS; Owner: UNIVERSITY OF KANSAS)
National Bridge Inventory (NBI) Statistics 43 Number of bridges991ft / 302m Total length363,096 Total average daily traffic55,075 Total average daily truck traffic
New bridges - historical statistics
1 1920-1929 2 1930-1939 7 1950-1959 4 1960-1969 1 1970-1979 12 1980-1989 2 1990-1999 2 2000-2009 12 2010-2019
See full National Bridge Inventory statistics for Bonner Springs, KS
Home Mortgage Disclosure Act Aggregated Statistics For Year 2009(Based on 2 full and 1 partial tracts) A) FHA, FSA/RHS & VA B) Conventional C) Refinancings D) Home Improvement Loans E) Loans on Dwellings For 5+ Families F) Non-occupant Loans on G) Loans On Manufactured Number Average Value Number Average Value Number Average Value Number Average Value Number Average Value Number Average Value Number Average Value
LOANS ORIGINATED 53 $137,987 29 $142,037 151 $149,386 14 $32,644 1 $544,000 10 $68,222 1 $16,850 APPLICATIONS APPROVED, NOT ACCEPTED 1 $120,650 2 $86,300 14 $145,778 1 $4,720 0 $0 0 $0 2 $66,295 APPLICATIONS DENIED 8 $107,550 7 $108,866 59 $143,746 11 $51,645 0 $0 6 $76,333 0 $0 APPLICATIONS WITHDRAWN 9 $107,032 2 $97,020 37 $147,653 0 $0 0 $0 1 $126,000 1 $69,420 FILES CLOSED FOR INCOMPLETENESS 0 $0 1 $106,490 6 $166,028 2 $25,110 0 $0 0 $0 0 $0
Aggregated Statistics For Year 2008(Based on 2 full and 1 partial tracts) A) FHA, FSA/RHS & VA B) Conventional C) Refinancings D) Home Improvement Loans E) Loans on Dwellings For 5+ Families F) Non-occupant Loans on G) Loans On Manufactured Number Average Value Number Average Value Number Average Value Number Average Value Number Average Value Number Average Value Number Average Value
LOANS ORIGINATED 42 $122,660 47 $128,749 87 $129,728 19 $47,359 2 $389,500 26 $90,839 1 $104,000 APPLICATIONS APPROVED, NOT ACCEPTED 2 $102,500 4 $121,778 19 $120,582 2 $129,055 0 $0 4 $67,735 1 $31,680 APPLICATIONS DENIED 6 $108,433 10 $112,156 73 $127,848 14 $35,554 1 $80,000 7 $56,369 2 $36,500 APPLICATIONS WITHDRAWN 4 $73,250 7 $136,886 37 $152,495 0 $0 0 $0 3 $90,053 0 $0 FILES CLOSED FOR INCOMPLETENESS 0 $0 0 $0 14 $153,390 0 $0 0 $0 0 $0 0 $0
Aggregated Statistics For Year 2007(Based on 2 full and 1 partial tracts) A) FHA, FSA/RHS & VA B) Conventional C) Refinancings D) Home Improvement Loans E) Loans on Dwellings For 5+ Families F) Non-occupant Loans on G) Loans On Manufactured Number Average Value Number Average Value Number Average Value Number Average Value Number Average Value Number Average Value Number Average Value
LOANS ORIGINATED 8 $162,872 126 $115,438 121 $122,846 27 $38,679 1 $445,000 34 $94,520 2 $102,745 APPLICATIONS APPROVED, NOT ACCEPTED 0 $0 13 $111,492 27 $140,660 5 $43,740 0 $0 1 $56,000 1 $21,570 APPLICATIONS DENIED 2 $132,500 22 $116,026 104 $131,128 18 $45,539 0 $0 15 $97,973 2 $87,255 APPLICATIONS WITHDRAWN 1 $158,000 9 $154,328 60 $126,962 6 $73,653 0 $0 4 $125,750 0 $0 FILES CLOSED FOR INCOMPLETENESS 0 $0 2 $70,220 10 $127,470 0 $0 0 $0 2 $104,500 0 $0
Aggregated Statistics For Year 2006(Based on 2 full and 1 partial tracts) A) FHA, FSA/RHS & VA B) Conventional C) Refinancings D) Home Improvement Loans F) Non-occupant Loans on G) Loans On Manufactured Number Average Value Number Average Value Number Average Value Number Average Value Number Average Value Number Average Value
LOANS ORIGINATED 16 $137,322 145 $113,106 119 $98,411 30 $37,155 31 $84,642 2 $70,445 APPLICATIONS APPROVED, NOT ACCEPTED 0 $0 10 $109,416 39 $122,086 4 $31,000 4 $70,145 1 $160,000 APPLICATIONS DENIED 0 $0 24 $77,093 100 $111,805 20 $33,633 8 $76,280 5 $26,976 APPLICATIONS WITHDRAWN 1 $79,000 21 $80,458 62 $129,483 6 $125,705 7 $71,857 0 $0 FILES CLOSED FOR INCOMPLETENESS 0 $0 6 $148,265 24 $111,233 0 $0 1 $47,000 0 $0
Aggregated Statistics For Year 2005(Based on 2 full and 1 partial tracts) A) FHA, FSA/RHS & VA B) Conventional C) Refinancings D) Home Improvement Loans E) Loans on Dwellings For 5+ Families F) Non-occupant Loans on G) Loans On Manufactured Number Average Value Number Average Value Number Average Value Number Average Value Number Average Value Number Average Value Number Average Value
LOANS ORIGINATED 12 $146,047 161 $107,959 191 $113,454 31 $50,411 1 $1,999,000 43 $85,619 3 $52,647 APPLICATIONS APPROVED, NOT ACCEPTED 1 $84,000 15 $84,883 26 $112,569 1 $18,000 0 $0 0 $0 0 $0 APPLICATIONS DENIED 1 $67,400 35 $98,437 132 $126,942 17 $41,898 0 $0 4 $67,500 7 $74,446 APPLICATIONS WITHDRAWN 1 $90,000 34 $100,655 93 $122,761 10 $148,552 0 $0 2 $128,000 3 $135,297 FILES CLOSED FOR INCOMPLETENESS 0 $0 7 $94,963 14 $132,448 1 $27,000 0 $0 0 $0 0 $0
Aggregated Statistics For Year 2004(Based on 2 full and 1 partial tracts) A) FHA, FSA/RHS & VA B) Conventional C) Refinancings D) Home Improvement Loans E) Loans on Dwellings For 5+ Families F) Non-occupant Loans on G) Loans On Manufactured Number Average Value Number Average Value Number Average Value Number Average Value Number Average Value Number Average Value Number Average Value
LOANS ORIGINATED 17 $115,229 121 $104,160 184 $96,257 21 $37,290 1 $1,132,320 29 $74,957 2 $14,250 APPLICATIONS APPROVED, NOT ACCEPTED 1 $123,000 19 $82,774 28 $96,228 2 $15,500 0 $0 4 $76,942 4 $50,878 APPLICATIONS DENIED 3 $104,667 34 $98,425 93 $107,434 22 $31,229 1 $184,000 5 $55,974 4 $55,712 APPLICATIONS WITHDRAWN 1 $88,290 13 $99,782 79 $117,297 4 $104,465 0 $0 3 $104,243 0 $0 FILES CLOSED FOR INCOMPLETENESS 0 $0 9 $114,444 26 $116,272 2 $95,000 0 $0 0 $0 0 $0
Aggregated Statistics For Year 2003(Based on 2 full and 1 partial tracts) A) FHA, FSA/RHS & VA B) Conventional C) Refinancings D) Home Improvement Loans F) Non-occupant Loans on Number Average Value Number Average Value Number Average Value Number Average Value Number Average Value
LOANS ORIGINATED 15 $110,383 92 $103,164 323 $97,237 21 $18,953 40 $70,141 APPLICATIONS APPROVED, NOT ACCEPTED 0 $0 7 $85,571 49 $103,033 2 $20,515 2 $89,500 APPLICATIONS DENIED 0 $0 11 $88,829 129 $108,109 13 $12,154 6 $67,955 APPLICATIONS WITHDRAWN 0 $0 18 $98,119 87 $95,319 2 $20,850 0 $0 FILES CLOSED FOR INCOMPLETENESS 1 $96,000 8 $125,450 21 $98,072 1 $5,000 4 $44,822
Aggregated Statistics For Year 2002(Based on 2 full and 1 partial tracts) A) FHA, FSA/RHS & VA B) Conventional C) Refinancings D) Home Improvement Loans F) Non-occupant Loans on Number Average Value Number Average Value Number Average Value Number Average Value Number Average Value
LOANS ORIGINATED 22 $111,221 85 $106,242 262 $95,779 21 $23,017 13 $77,643 APPLICATIONS APPROVED, NOT ACCEPTED 0 $0 5 $83,208 34 $105,943 3 $9,667 2 $79,500 APPLICATIONS DENIED 1 $114,000 17 $60,495 78 $98,548 9 $14,069 9 $58,713 APPLICATIONS WITHDRAWN 1 $101,000 10 $138,704 82 $97,332 3 $85,000 3 $70,000 FILES CLOSED FOR INCOMPLETENESS 1 $107,000 3 $100,197 39 $104,171 0 $0 0 $0
Aggregated Statistics For Year 2001(Based on 2 full and 1 partial tracts) A) FHA, FSA/RHS & VA B) Conventional C) Refinancings D) Home Improvement Loans F) Non-occupant Loans on Number Average Value Number Average Value Number Average Value Number Average Value Number Average Value
LOANS ORIGINATED 22 $100,397 79 $99,251 206 $90,569 30 $41,098 35 $69,722 APPLICATIONS APPROVED, NOT ACCEPTED 0 $0 11 $81,292 35 $100,338 2 $6,000 4 $54,250 APPLICATIONS DENIED 3 $106,667 32 $50,239 85 $93,152 24 $11,700 1 $49,200 APPLICATIONS WITHDRAWN 1 $93,010 12 $81,340 76 $82,387 5 $12,766 4 $102,750 FILES CLOSED FOR INCOMPLETENESS 0 $0 2 $89,500 24 $87,746 0 $0 0 $0
Aggregated Statistics For Year 2000(Based on 2 full and 1 partial tracts) A) FHA, FSA/RHS & VA B) Conventional C) Refinancings D) Home Improvement Loans E) Loans on Dwellings For 5+ Families F) Non-occupant Loans on Number Average Value Number Average Value Number Average Value Number Average Value Number Average Value Number Average Value
LOANS ORIGINATED 25 $85,561 83 $82,624 92 $78,241 18 $15,297 3 $1,352,727 21 $62,785 APPLICATIONS APPROVED, NOT ACCEPTED 0 $0 9 $60,862 19 $88,474 3 $5,920 0 $0 2 $49,500 APPLICATIONS DENIED 4 $46,378 34 $63,334 33 $62,636 12 $13,750 0 $0 1 $90,320 APPLICATIONS WITHDRAWN 2 $68,550 4 $107,888 29 $63,058 0 $0 0 $0 0 $0 FILES CLOSED FOR INCOMPLETENESS 0 $0 2 $87,000 7 $86,429 0 $0 0 $0 0 $0
Aggregated Statistics For Year 1999(Based on 2 full and 1 partial tracts) A) FHA, FSA/RHS & VA B) Conventional C) Refinancings D) Home Improvement Loans E) Loans on Dwellings For 5+ Families F) Non-occupant Loans on Number Average Value Number Average Value Number Average Value Number Average Value Number Average Value Number Average Value
LOANS ORIGINATED 33 $83,402 105 $67,210 127 $77,324 35 $12,694 3 $275,733 28 $53,792 APPLICATIONS APPROVED, NOT ACCEPTED 0 $0 23 $59,444 19 $72,569 8 $12,322 0 $0 0 $0 APPLICATIONS DENIED 4 $61,760 52 $49,706 36 $59,809 16 $14,836 0 $0 3 $55,700 APPLICATIONS WITHDRAWN 2 $77,665 4 $119,002 32 $72,259 4 $6,490 0 $0 6 $47,130 FILES CLOSED FOR INCOMPLETENESS 0 $0 1 $148,500 6 $73,660 1 $10,030 0 $0 0 $0
Detailed HMDA statistics for the following Tracts:
0448.05
, 0448.06 , 0449.00
Private Mortgage Insurance Companies Aggregated Statistics For Year 2009(Based on 2 full and 1 partial tracts) A) Conventional B) Refinancings Number Average Value Number Average Value
LOANS ORIGINATED 6 $190,953 8 $168,282 APPLICATIONS APPROVED, NOT ACCEPTED 2 $105,300 4 $147,615 APPLICATIONS DENIED 0 $0 2 $176,405 APPLICATIONS WITHDRAWN 1 $279,040 2 $131,500 FILES CLOSED FOR INCOMPLETENESS 0 $0 0 $0
Aggregated Statistics For Year 2008(Based on 2 full and 1 partial tracts) A) Conventional B) Refinancings C) Non-occupant Loans on Number Average Value Number Average Value Number Average Value
LOANS ORIGINATED 24 $158,905 12 $189,033 1 $112,560 APPLICATIONS APPROVED, NOT ACCEPTED 10 $143,646 5 $112,776 2 $101,940 APPLICATIONS DENIED 0 $0 1 $185,000 0 $0 APPLICATIONS WITHDRAWN 1 $370,030 2 $166,000 0 $0 FILES CLOSED FOR INCOMPLETENESS 0 $0 4 $125,162 3 $118,550
Aggregated Statistics For Year 2007(Based on 2 full and 1 partial tracts) A) Conventional B) Refinancings C) Non-occupant Loans on Number Average Value Number Average Value Number Average Value
LOANS ORIGINATED 43 $143,285 19 $148,515 6 $105,667 APPLICATIONS APPROVED, NOT ACCEPTED 2 $199,155 5 $162,200 1 $83,000 APPLICATIONS DENIED 0 $0 4 $191,830 4 $138,245 APPLICATIONS WITHDRAWN 1 $141,540 1 $150,000 0 $0 FILES CLOSED FOR INCOMPLETENESS 1 $110,000 0 $0 0 $0
Aggregated Statistics For Year 2006(Based on 2 full and 1 partial tracts) A) Conventional B) Refinancings C) Non-occupant Loans on Number Average Value Number Average Value Number Average Value
LOANS ORIGINATED 28 $143,154 10 $114,141 3 $121,890 APPLICATIONS APPROVED, NOT ACCEPTED 1 $151,650 3 $131,007 0 $0 APPLICATIONS DENIED 0 $0 1 $110,000 0 $0 APPLICATIONS WITHDRAWN 0 $0 1 $109,860 0 $0 FILES CLOSED FOR INCOMPLETENESS 0 $0 0 $0 0 $0
Aggregated Statistics For Year 2005(Based on 2 full and 1 partial tracts) A) Conventional B) Refinancings C) Non-occupant Loans on Number Average Value Number Average Value Number Average Value
LOANS ORIGINATED 34 $125,624 21 $132,560 5 $104,200 APPLICATIONS APPROVED, NOT ACCEPTED 5 $119,142 8 $136,085 1 $86,000 APPLICATIONS DENIED 0 $0 0 $0 0 $0 APPLICATIONS WITHDRAWN 1 $304,000 3 $152,573 0 $0 FILES CLOSED FOR INCOMPLETENESS 0 $0 0 $0 0 $0
Aggregated Statistics For Year 2004(Based on 1 full and 1 partial tracts) A) Conventional B) Refinancings C) Non-occupant Loans on Number Average Value Number Average Value Number Average Value
LOANS ORIGINATED 27 $121,891 19 $126,674 0 $0 APPLICATIONS APPROVED, NOT ACCEPTED 1 $140,000 8 $116,362 0 $0 APPLICATIONS DENIED 1 $54,590 0 $0 1 $54,590 APPLICATIONS WITHDRAWN 3 $102,273 2 $89,155 0 $0 FILES CLOSED FOR INCOMPLETENESS 1 $109,860 0 $0 0 $0
Aggregated Statistics For Year 2003(Based on 2 full and 1 partial tracts) A) Conventional B) Refinancings C) Non-occupant Loans on Number Average Value Number Average Value Number Average Value
LOANS ORIGINATED 28 $126,163 44 $111,767 4 $79,250 APPLICATIONS APPROVED, NOT ACCEPTED 10 $121,673 14 $110,648 1 $90,000 APPLICATIONS DENIED 0 $0 0 $0 0 $0 APPLICATIONS WITHDRAWN 0 $0 1 $71,440 0 $0 FILES CLOSED FOR INCOMPLETENESS 0 $0 0 $0 0 $0
Aggregated Statistics For Year 2002(Based on 2 full and 1 partial tracts) A) Conventional B) Refinancings C) Non-occupant Loans on Number Average Value Number Average Value Number Average Value
LOANS ORIGINATED 34 $110,745 40 $113,690 2 $83,500 APPLICATIONS APPROVED, NOT ACCEPTED 4 $102,345 10 $103,358 1 $129,000 APPLICATIONS DENIED 0 $0 0 $0 0 $0 APPLICATIONS WITHDRAWN 1 $80,000 4 $105,552 0 $0 FILES CLOSED FOR INCOMPLETENESS 0 $0 1 $126,000 0 $0
Aggregated Statistics For Year 2001(Based on 2 full and 1 partial tracts) A) Conventional B) Refinancings C) Non-occupant Loans on Number Average Value Number Average Value Number Average Value
LOANS ORIGINATED 30 $96,850 30 $112,589 2 $52,000 APPLICATIONS APPROVED, NOT ACCEPTED 1 $89,640 4 $106,058 0 $0 APPLICATIONS DENIED 0 $0 1 $191,420 1 $128,060 APPLICATIONS WITHDRAWN 0 $0 1 $105,000 0 $0 FILES CLOSED FOR INCOMPLETENESS 0 $0 0 $0 0 $0
Aggregated Statistics For Year 2000(Based on 2 full and 1 partial tracts) A) Conventional B) Refinancings C) Non-occupant Loans on Number Average Value Number Average Value Number Average Value
LOANS ORIGINATED 25 $91,992 6 $89,535 5 $96,132 APPLICATIONS APPROVED, NOT ACCEPTED 2 $81,500 2 $92,345 0 $0 APPLICATIONS DENIED 0 $0 0 $0 0 $0 APPLICATIONS WITHDRAWN 1 $84,000 1 $114,000 0 $0 FILES CLOSED FOR INCOMPLETENESS 1 $80,210 0 $0 0 $0
Aggregated Statistics For Year 1999(Based on 2 full and 1 partial tracts) A) Conventional B) Refinancings Number Average Value Number Average Value
LOANS ORIGINATED 27 $85,272 13 $115,666 APPLICATIONS APPROVED, NOT ACCEPTED 4 $90,355 2 $149,485 APPLICATIONS DENIED 0 $0 0 $0 APPLICATIONS WITHDRAWN 1 $38,830 0 $0 FILES CLOSED FOR INCOMPLETENESS 0 $0 0 $0
Detailed PMIC statistics for the following Tracts:
0448.05
, 0448.06 , 0449.00
Most common first names in Bonner Springs, KS among deceased individuals Name Count Lived (average)
Charles 49 77.4 years John 47 73.7 years William 42 72.3 years Mary 37 80.8 years George 36 74.6 years James 33 71.9 years Helen 31 78.1 years Robert 31 71.5 years Ruth 25 81.2 years Anna 25 79.8 years
Most common last names in Bonner Springs, KS among deceased individuals Last name Count Lived (average)
Smith 22 74.7 years Johnson 18 80.2 years Brown 17 76.6 years Jones 15 74.0 years Clark 14 76.8 years Davis 13 68.8 years Williams 12 82.6 years Hill 12 81.7 years Moore 12 75.2 years White 10 69.2 years
Bonner Springs compared to Kansas state average:
Unemployed percentage significantly below state average. Length of stay since moving in significantly above state average.
Top Patent Applicants
Kenneth P. Mortensen (8)
Hsien-Jue Chu (7)
Luke Kelly (6)
Richard A. Carmitchel (3)
Lisa A. Stehno-Bittel (3)
Luke E. Kelly (3)
Tim Baine (2)
Lisa Stehno-Bittel (2)
Michael Todd Young (2)
Alan Schif (1)
Total of 45 patent applications in 2008-2024.
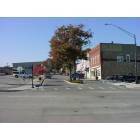
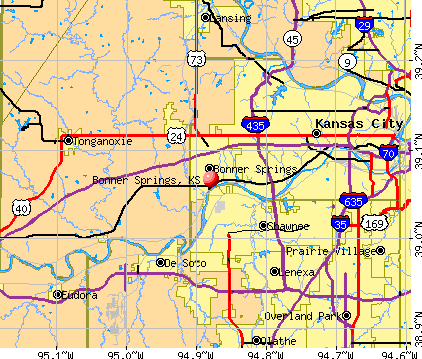


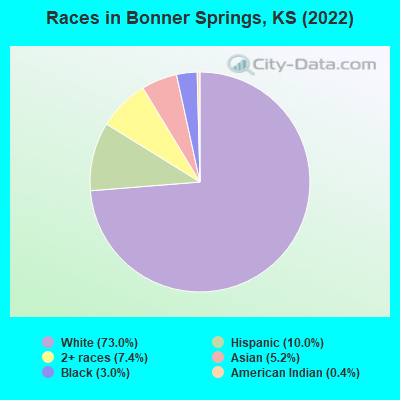
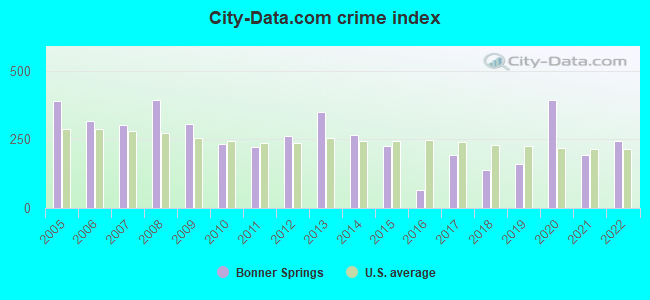
 Recent articles from our blog. Our writers, many of them Ph.D. graduates or candidates, create easy-to-read articles on a wide variety of topics.

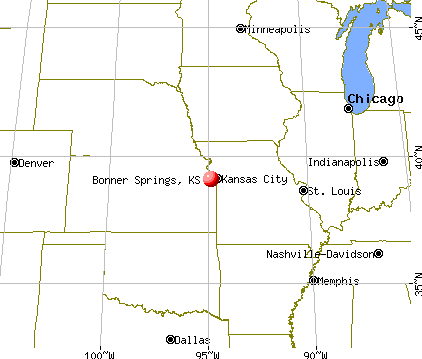
 (11.2 miles
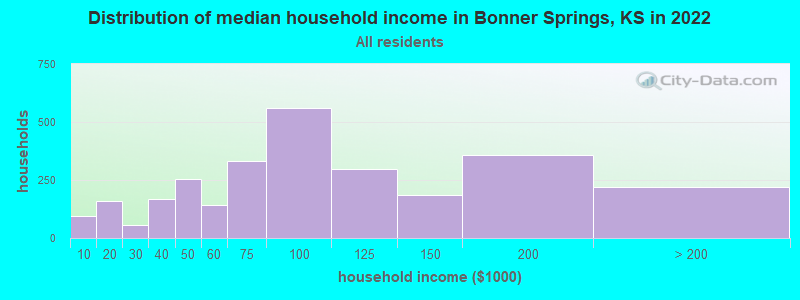
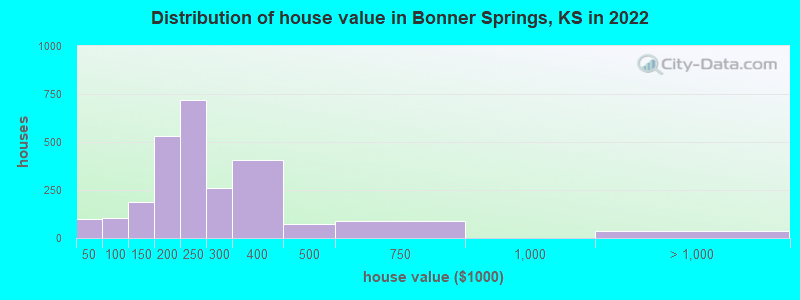
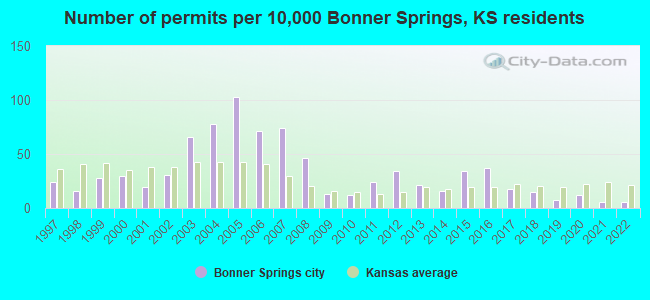
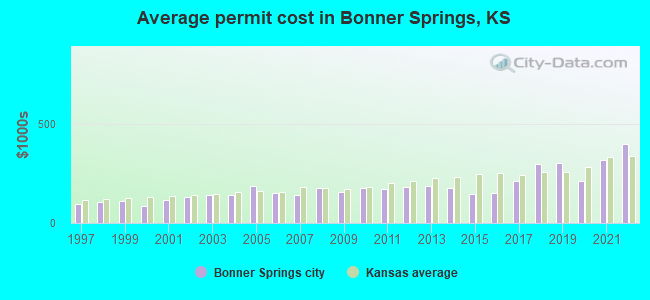
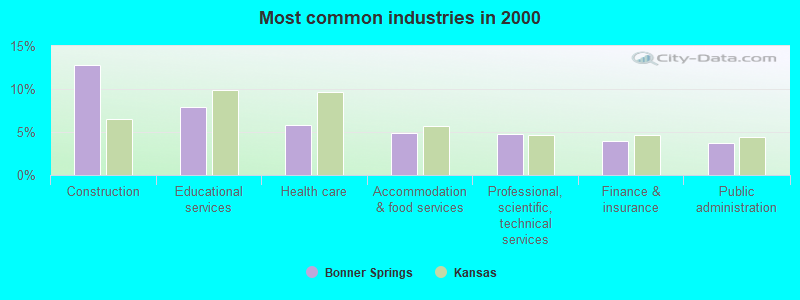
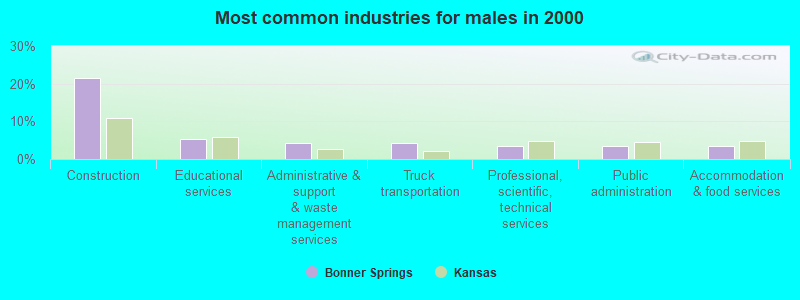
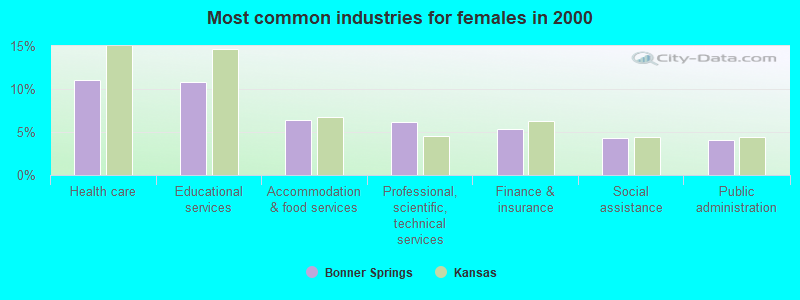
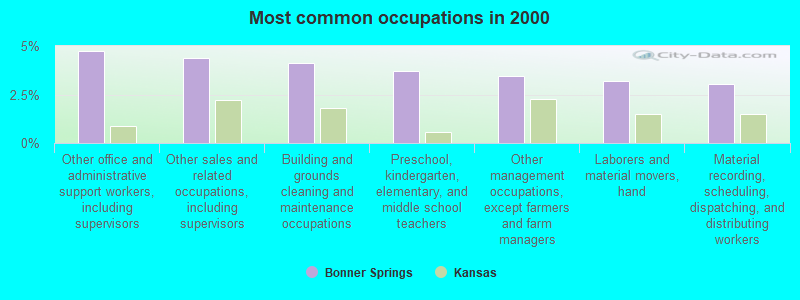
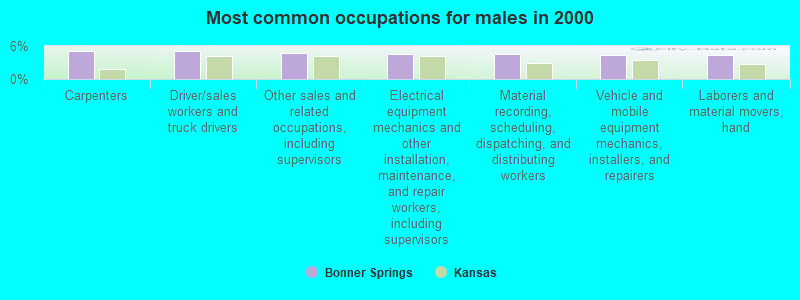
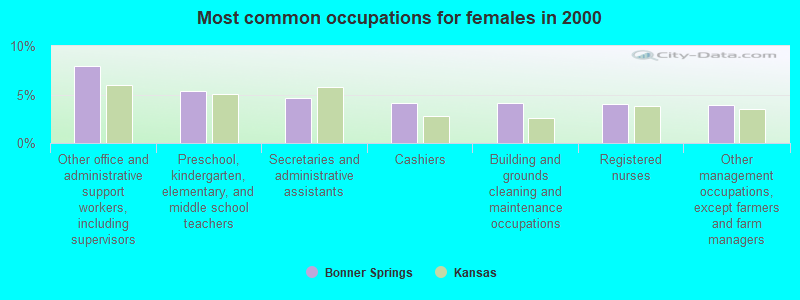
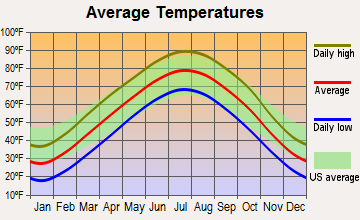
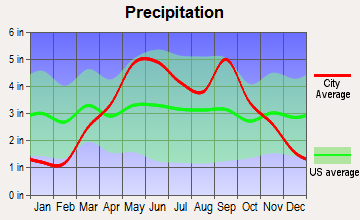
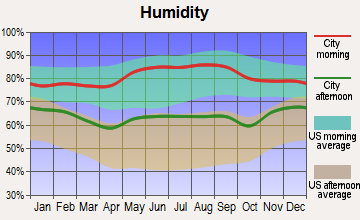
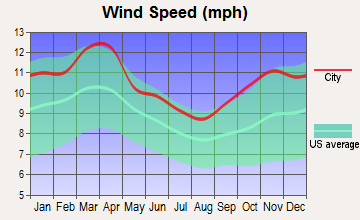
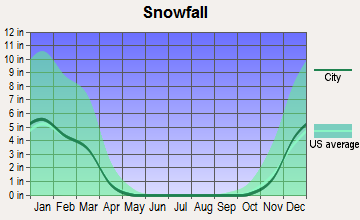
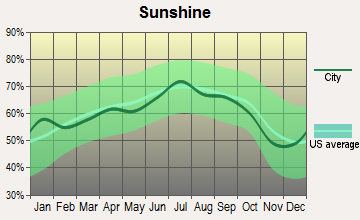
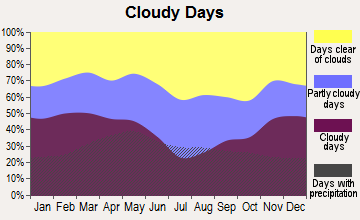


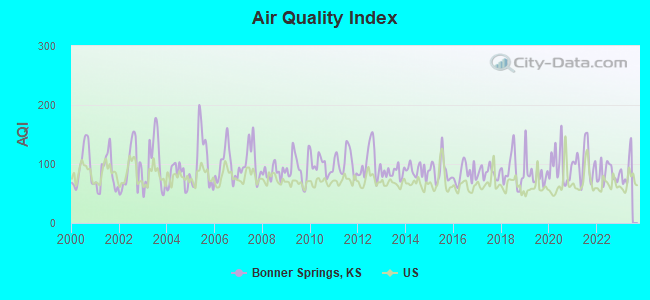
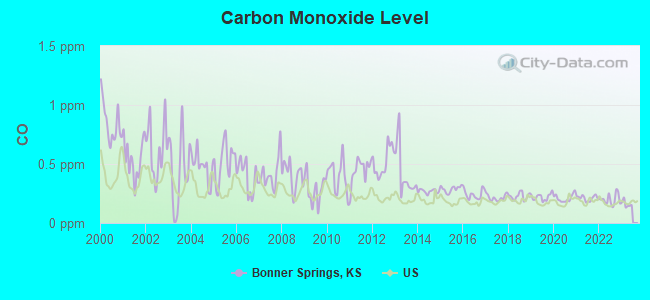
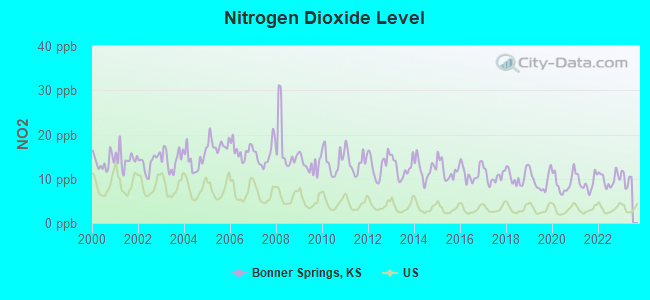
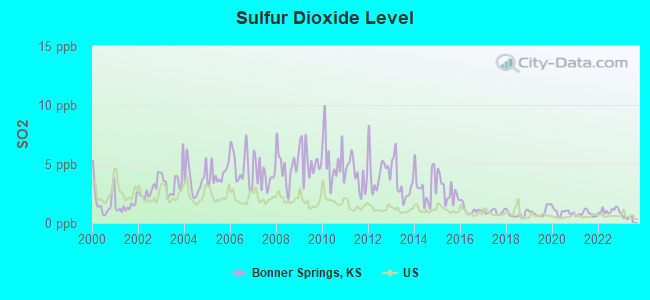
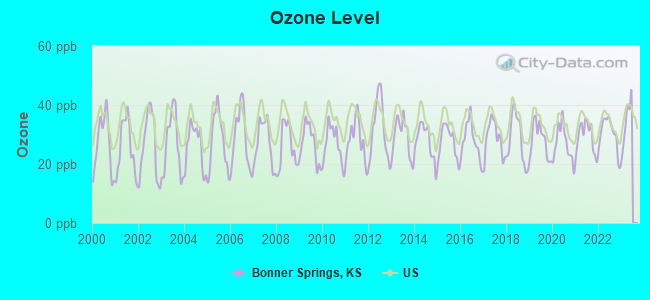
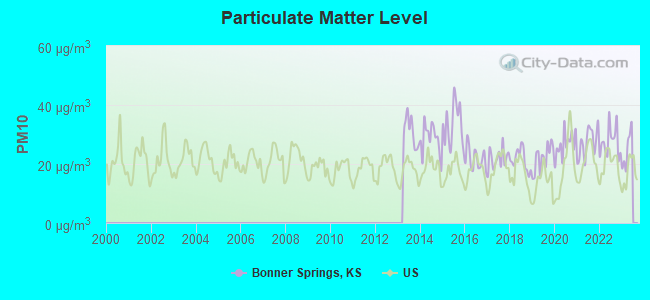
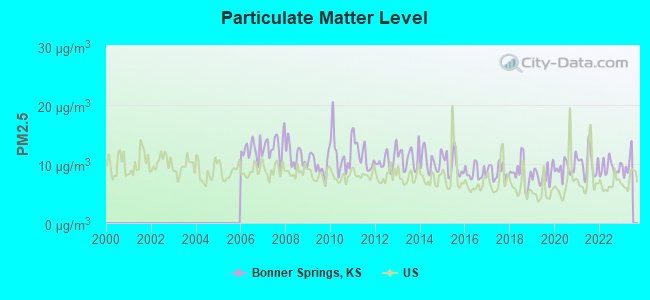

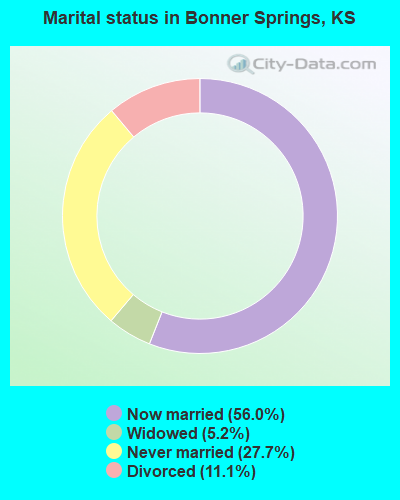
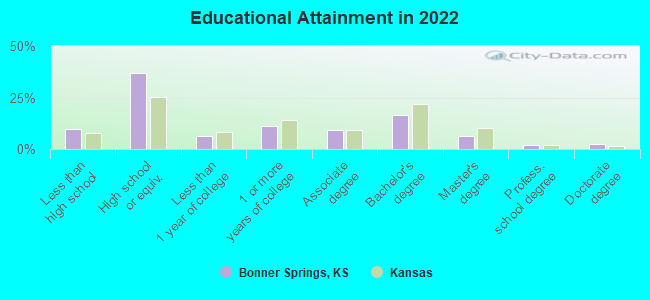
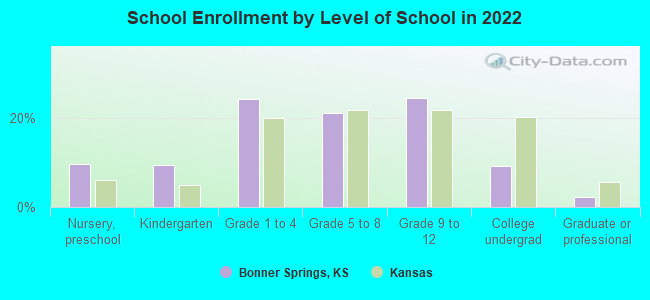
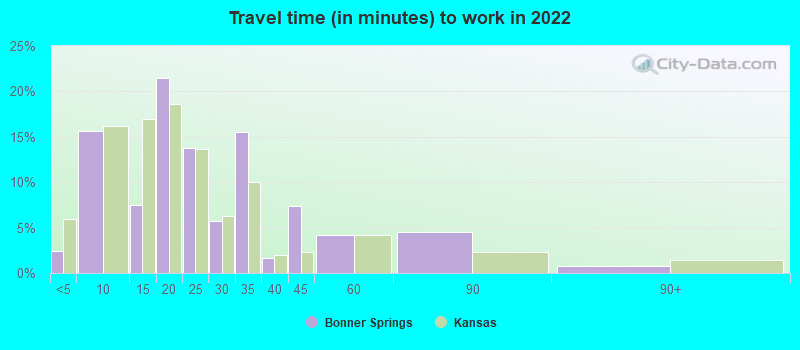
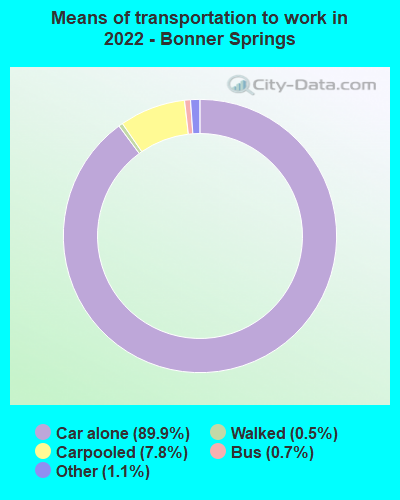
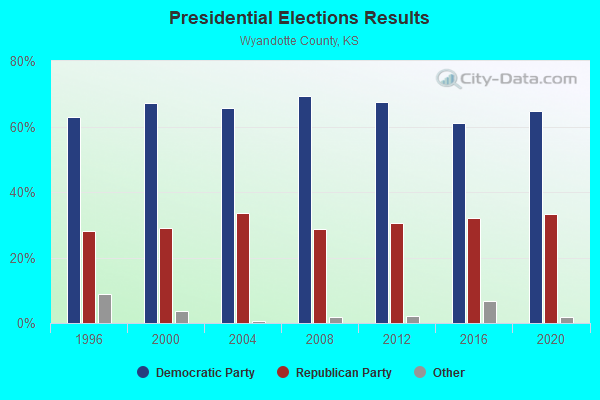
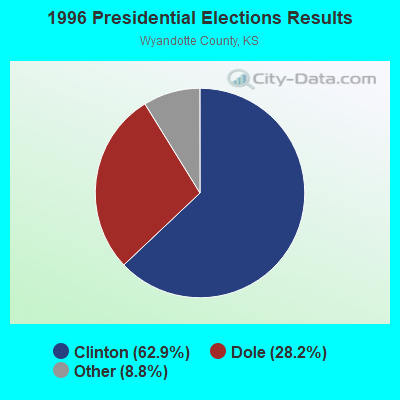
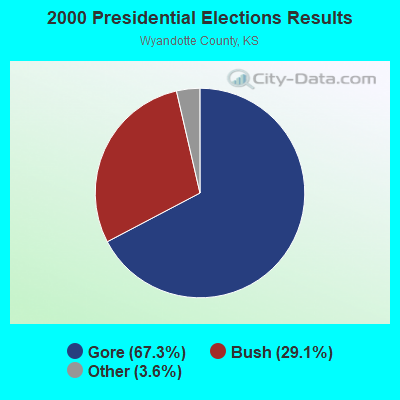
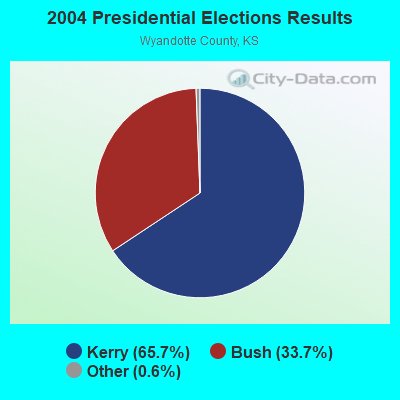
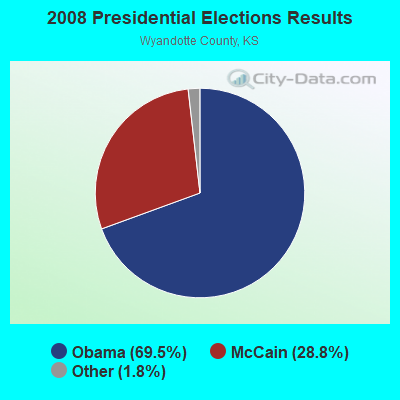
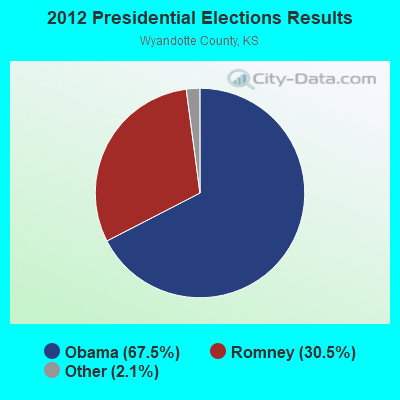
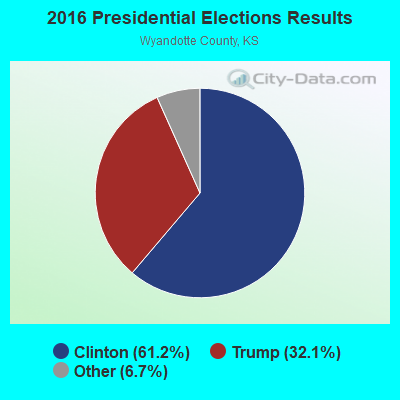
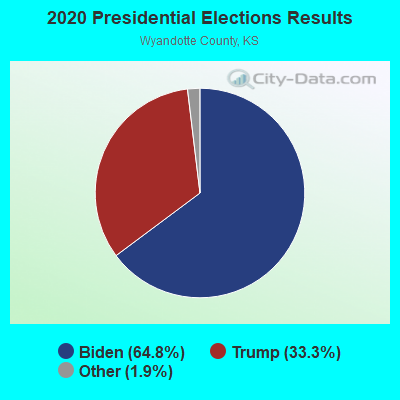
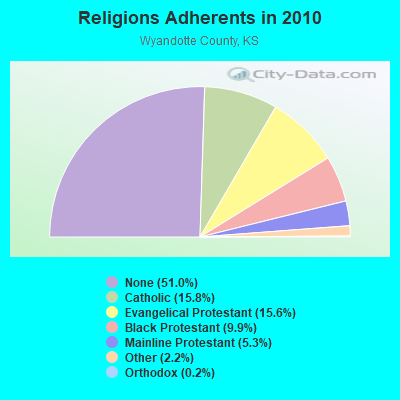
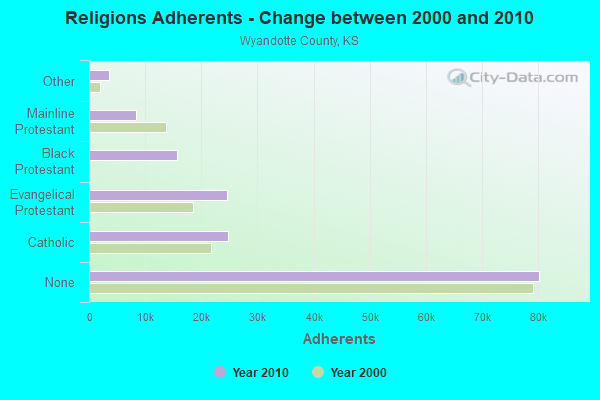
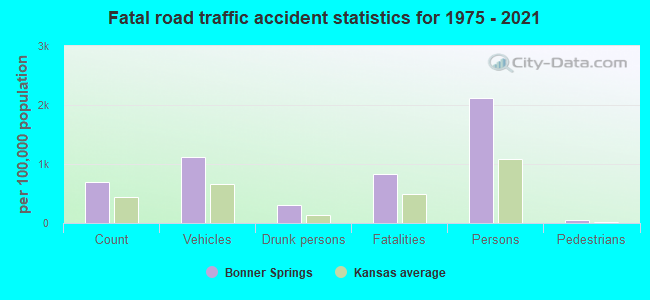
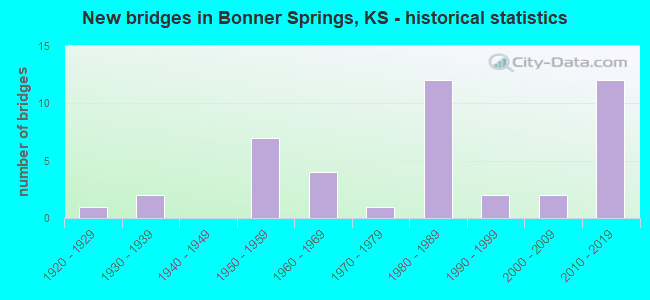
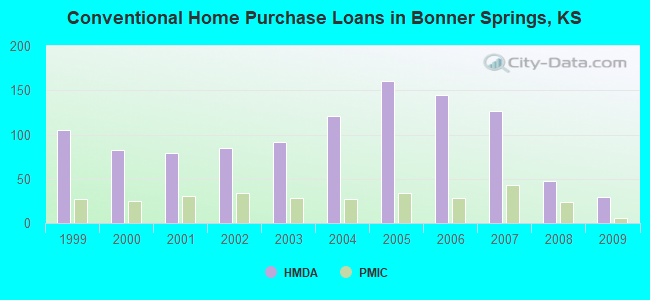
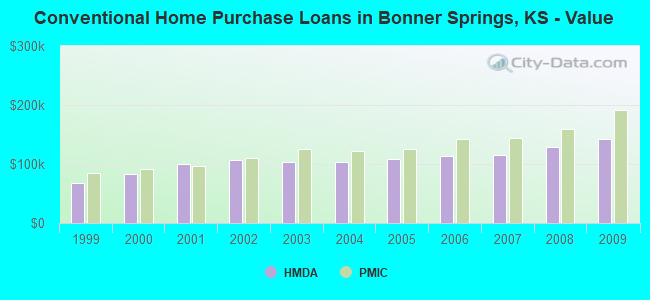
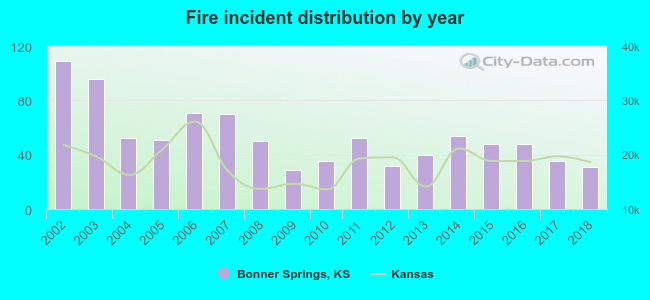 Based on the data from the years 2002 - 2018 the average number of fires per year is 53. The highest number of reported fire incidents - 109 took place in 2002, and the least - 29 in 2009. The data has a declining trend.
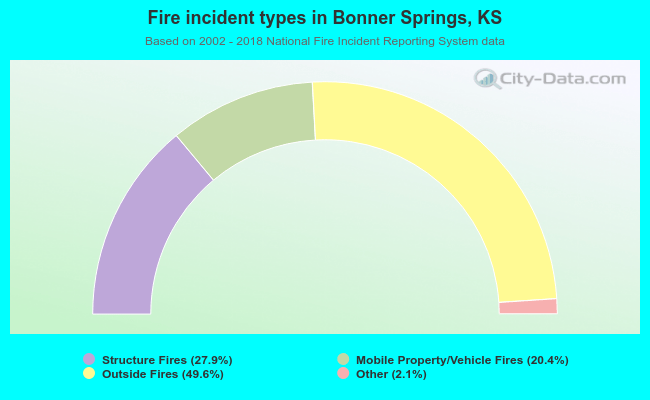 When looking into fire subcategories, the most reports belonged to: Outside Fires (49.6%), and Structure Fires (27.9%).