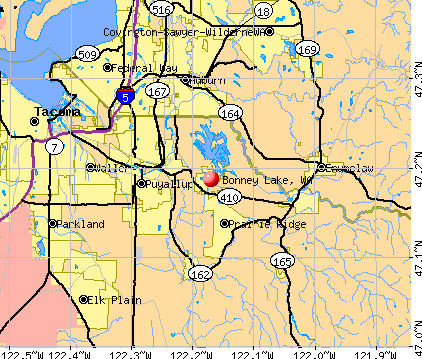
Bonney Lake, Washington
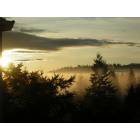
Bonney Lake: Good morning Bonney Lake
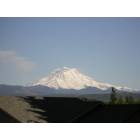
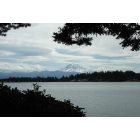
Bonney Lake: Taken from Bonney Lake March, 2005
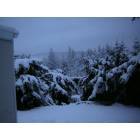
Bonney Lake: Brrrrr - Winter '06

Bonney Lake: Good night Bonney Lake
Bonney Lake: Mt Rainier
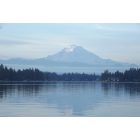
Bonney Lake: Lake Tapps/Mt.Rainier
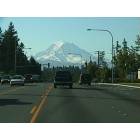
Bonney Lake: Mount Rainier from Hwy 410 & 184th Ave E. in Bonney Lake
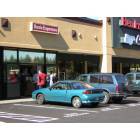
Bonney Lake: Bonney Lake's oldest coffee stand
- add
your
Submit your own pictures of this city and show them to the world
- OSM Map
- General Map
- Google Map
- MSN Map
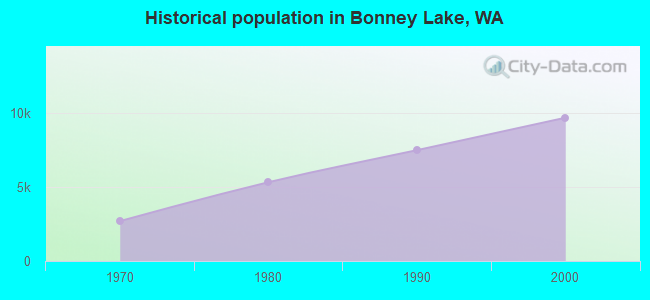
Population change since 2000: +136.2%
| Males: 11,599 | |
| Females: 11,286 |
| Median resident age: | 37.7 years |
| Washington median age: | 38.4 years |
Zip codes: 98321.
| Bonney Lake: | $126,072 |
| WA: | $91,306 |
Estimated per capita income in 2022: $51,290 (it was $21,371 in 2000)
Bonney Lake city income, earnings, and wages data
Estimated median house or condo value in 2022: $601,119 (it was $152,500 in 2000)
| Bonney Lake: | $601,119 |
| WA: | $569,500 |
Mean prices in 2022: all housing units: $571,140; detached houses: $606,667; townhouses or other attached units: $534,248; in 2-unit structures: $606,121; in 3-to-4-unit structures: $262,548; in 5-or-more-unit structures: $407,089; mobile homes: $200,236; occupied boats, rvs, vans, etc.: $40,477
Median gross rent in 2022: $2,114.
(2.7% for White Non-Hispanic residents, 2.7% for Black residents, 23.5% for Hispanic or Latino residents, 5.8% for American Indian residents, 10.2% for other race residents, 9.2% for two or more races residents)
Detailed information about poverty and poor residents in Bonney Lake, WA


Compare current foreclosures in Bonney Lake, WA:
| Photo | Address | Area | Beds / Baths | Price | Details |
|---|---|---|---|---|---|

|
#1
207th Avenue Ct E
Bonney Lake, WA 98391
|
1,953 sq. feet
|
2 baths 4 beds |
show details | |

|
#2
200th Avenue Ct E
Bonney Lake, WA 98391
|
1,176 sq. feet
|
1 baths 3 beds |
show details | |

|
#3
227th Ave E
Bonney Lake, WA 98391
|
1,320 sq. feet
|
1 baths 2 beds |
show details | |

|
#4
203rd Ave E
Bonney Lake, WA 98391
|
2,884 sq. feet
|
2 baths 4 beds |
show details | |

|
#5
28th St E
Bonney Lake, WA 98391
|
3,330 sq. feet
|
3 baths 3 beds |
show details | |

|
#6
191st Avenue Ct E
Bonney Lake, WA 98391
|
2,072 sq. feet
|
2 baths 3 beds |
show details | |

|
#7
182nd Ave E
Bonney Lake, WA 98391
|
2,399 sq. feet
|
2 baths 4 beds |
show details | |

|
#8
32nd Street Ct E
Bonney Lake, WA 98391
|
1,344 sq. feet
|
2 baths 3 beds |
show details | |

|
#9
105th St E
Bonney Lake, WA 98391
|
1,524 sq. feet
|
2 baths 3 beds |
show details | |

|
#10
W Tapps Dr E
Bonney Lake, WA 98391
|
1,440 sq. feet
|
1 baths 3 beds |
show details |
| Photo | Address | Area | Beds / Baths | Price | Details |
|---|---|---|---|---|---|

|
#11
121st St E
Bonney Lake, WA 98391
|
2,706 sq. feet
|
2 baths 3 beds |
show details | |

|
#12
108th Street Ct E
Bonney Lake, WA 98391
|
1,704 sq. feet
|
2 baths 3 beds |
show details | |

|
#13
103rd St E
Bonney Lake, WA 98391
|
2,320 sq. feet
|
2 baths 3 beds |
show details | |

|
#14
176th Ave E
Bonney Lake, WA 98391
|
2,476 sq. feet
|
2 baths 4 beds |
show details | |

|
#15
46th Street Ct E
Bonney Lake, WA 98391
|
3,088 sq. feet
|
3 baths 3 beds |
show details | |

|
#16
214th Ave E
Bonney Lake, WA 98391
|
1,566 sq. feet
|
2 baths 3 beds |
show details | |

|
#17
192nd Ave E
Bonney Lake, WA 98391
|
1,007 sq. feet
|
2 baths 2 beds |
show details | |

|
#18
73rd St E
Bonney Lake, WA 98391
|
2,556 sq. feet
|
2 baths 3 beds |
show details | |

|
#19
101st St E
Bonney Lake, WA 98391
|
2,809 sq. feet
|
2 baths 4 beds |
show details | |

|
#20
81st St E
Bonney Lake, WA 98391
|
2,156 sq. feet
|
2 baths 4 beds |
show details |
| Photo | Address | Area | Beds / Baths | Price | Details |
|---|---|---|---|---|---|

|
#21
94th Street Ct E
Bonney Lake, WA 98391
|
2,460 sq. feet
|
2 baths 4 beds |
show details | |

|
#22
114th Street Ct E
Bonney Lake, WA 98391
|
1,658 sq. feet
|
3 baths 3 beds |
show details | |

|
#23
43rd St E
Bonney Lake, WA 98391
|
1,572 sq. feet
|
2 baths 3 beds |
show details | |

|
#24
126th St E
Bonney Lake, WA 98391
|
1,664 sq. feet
|
2 baths 3 beds |
show details | |

|
#25
100th St E
Bonney Lake, WA 98391
|
1,814 sq. feet
|
2 baths 3 beds |
show details | |

|
#26
207th Ave E
Bonney Lake, WA 98391
|
1,660 sq. feet
|
2 baths 3 beds |
show details | |

|
#27
185th Ave E
Bonney Lake, WA 98391
|
2,344 sq. feet
|
2 baths 3 beds |
show details | |

|
#28
S Tapps Dr E
Bonney Lake, WA 98391
|
1,400 sq. feet
|
2 baths 3 beds |
show details | |

|
#29
17th St E
Bonney Lake, WA 98391
|
1,170 sq. feet
|
1 baths 2 beds |
show details | |

|
#30
Rainier Dr E
Bonney Lake, WA 98391
|
1,008 sq. feet
|
1 baths 3 beds |
show details |
| Photo | Address | Area | Beds / Baths | Price | Details |
|---|---|---|---|---|---|

|
#31
211th Avenue Ct E
Bonney Lake, WA 98391
|
1,142 sq. feet
|
2 baths 3 beds |
show details | |

|
#32
75th St E
Bonney Lake, WA 98391
|
1,564 sq. feet
|
2 baths 3 beds |
show details | |

|
#33
187th Ave E
Bonney Lake, WA 98391
|
1,056 sq. feet
|
1 baths 2 beds |
show details | |

|
#34
107th St E
Bonney Lake, WA 98391
|
1,344 sq. feet
|
2 baths 3 beds |
show details | |

|
#35
131st St E
Bonney Lake, WA 98391
|
1,224 sq. feet
|
2 baths 3 beds |
show details | |

|
#36
209th Ave E
Bonney Lake, WA 98391
|
1,220 sq. feet
|
2 baths 3 beds |
show details | |

|
#37
106th St E
Bonney Lake, WA 98391
|
2,490 sq. feet
|
2 baths 5 beds |
show details | |

|
#38
190th Avenue Ct E
Bonney Lake, WA 98391
|
1,281 sq. feet
|
2 baths 3 beds |
show details | |

|
#39
Springhaven Way E
Bonney Lake, WA 98391
|
2,496 sq. feet
|
2 baths 3 beds |
show details | |

|
#40
131st St E
Bonney Lake, WA 98391
|
1,640 sq. feet
|
2 baths 3 beds |
show details |
| Photo | Address | Area | Beds / Baths | Price | Details |
|---|---|---|---|---|---|

|
#41
107th Street Ct E
Bonney Lake, WA 98391
|
2,143 sq. feet
|
2 baths 3 beds |
show details | |

|
#42
214th Ave E
Bonney Lake, WA 98391
|
520 sq. feet
|
1 baths 1 beds |
show details | |

|
#43
192nd Ave E
Bonney Lake, WA 98391
|
1,146 sq. feet
|
2 baths 3 beds |
show details | |

|
#44
171st Avenue Ct E
Bonney Lake, WA 98391
|
1,794 sq. feet
|
2 baths 3 beds |
show details | |

|
#45
209th Ave E
Bonney Lake, WA 98391
|
- sq. feet
|
2 baths 3 beds |
show details | |

|
#46
214th Ave E
Bonney Lake, WA 98391
|
- sq. feet
|
- baths - beds |
show details | |

|
#47
170th St E
Bonney Lake, WA 98391
|
- sq. feet
|
- baths - beds |
show details | |

|
#48
82nd Street Ct E
Bonney Lake, WA 98391
|
- sq. feet
|
- baths - beds |
show details | |

|
#49
185th Ave E
Bonney Lake, WA 98391
|
- sq. feet
|
- baths - beds |
show details | |

|
Check over 1 million property listings on Foreclosure.com!
|
browse all offers | |||


- 16,77873.6%White alone
- 2,59211.4%Hispanic
- 1,8898.3%Two or more races
- 8803.9%Asian alone
- 2871.3%Black alone
- 940.4%American Indian alone
- 280.1%Other race alone
- 190.08%Native Hawaiian and Other
Pacific Islander alone
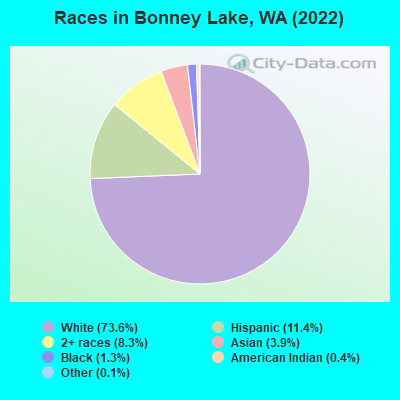
Races in Bonney Lake detailed stats: ancestries, foreign born residents, place of birth
According to our research of Washington and other state lists, there were 12 registered sex offenders living in Bonney Lake, Washington as of April 27, 2024.
The ratio of all residents to sex offenders in Bonney Lake is 1,639 to 1.
The ratio of registered sex offenders to all residents in this city is lower than the state average.
Type |
2009 |
2010 |
2011 |
2012 |
2013 |
2014 |
2015 |
2016 |
2017 |
2018 |
2019 |
2020 |
2021 |
2022 |
|---|---|---|---|---|---|---|---|---|---|---|---|---|---|---|
| Murders (per 100,000) | 0 (0.0) | 0 (0.0) | 1 (5.7) | 1 (5.6) | 0 (0.0) | 0 (0.0) | 0 (0.0) | 0 (0.0) | 0 (0.0) | 0 (0.0) | 0 (0.0) | 1 (4.6) | 0 (0.0) | 0 (0.0) |
| Rapes (per 100,000) | 5 (28.6) | 3 (17.3) | 2 (11.3) | 1 (5.6) | 3 (16.5) | 6 (32.4) | 3 (15.6) | 6 (29.3) | 5 (24.0) | 10 (47.2) | 12 (55.6) | 4 (18.5) | 6 (25.9) | 5 (21.8) |
| Robberies (per 100,000) | 8 (45.8) | 10 (57.6) | 4 (22.7) | 6 (33.8) | 8 (44.1) | 7 (37.8) | 5 (26.1) | 5 (24.5) | 5 (24.0) | 2 (9.4) | 7 (32.4) | 4 (18.5) | 12 (51.9) | 13 (56.8) |
| Assaults (per 100,000) | 14 (80.2) | 18 (103.6) | 24 (136.0) | 12 (67.6) | 17 (93.6) | 7 (37.8) | 18 (93.8) | 21 (102.7) | 28 (134.3) | 21 (99.1) | 18 (83.4) | 25 (115.8) | 28 (121.0) | 32 (139.8) |
| Burglaries (per 100,000) | 71 (406.6) | 85 (489.2) | 93 (527.0) | 121 (681.7) | 97 (534.3) | 119 (642.6) | 100 (521.4) | 120 (586.8) | 112 (537.3) | 77 (363.3) | 62 (287.4) | 56 (259.5) | 78 (337.0) | 96 (419.3) |
| Thefts (per 100,000) | 296 (1,695) | 352 (2,026) | 382 (2,165) | 372 (2,096) | 400 (2,203) | 353 (1,906) | 334 (1,741) | 402 (1,966) | 386 (1,852) | 330 (1,557) | 267 (1,238) | 356 (1,649) | 531 (2,295) | 537 (2,345) |
| Auto thefts (per 100,000) | 26 (148.9) | 34 (195.7) | 26 (147.3) | 38 (214.1) | 50 (275.4) | 39 (210.6) | 23 (119.9) | 43 (210.3) | 58 (278.3) | 44 (207.6) | 32 (148.3) | 32 (148.3) | 69 (298.2) | 78 (340.6) |
| Arson (per 100,000) | 0 (0.0) | 5 (28.8) | 2 (11.3) | 5 (28.2) | 5 (27.5) | 1 (5.4) | 2 (10.4) | 0 (0.0) | 2 (9.6) | 3 (14.2) | 2 (9.3) | 8 (37.1) | 0 (0.0) | 2 (8.7) |
| City-Data.com crime index | 160.9 | 182.7 | 189.7 | 188.1 | 192.7 | 182.9 | 154.8 | 187.9 | 187.2 | 164.7 | 152.4 | 148.8 | 199.7 | 212.9 |
The City-Data.com crime index weighs serious crimes and violent crimes more heavily. Higher means more crime, U.S. average is 246.1. It adjusts for the number of visitors and daily workers commuting into cities.
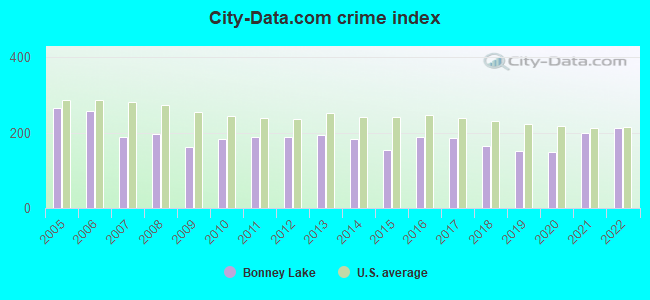
Crime rate in Bonney Lake detailed stats: murders, rapes, robberies, assaults, burglaries, thefts, arson
Full-time law enforcement employees in 2021, including police officers: 37 (31 officers - 28 male; 3 female).
| Officers per 1,000 residents here: | 1.34 |
| Washington average: | 1.35 |
 Recent articles from our blog. Our writers, many of them Ph.D. graduates or candidates, create easy-to-read articles on a wide variety of topics.


Latest news from Bonney Lake, WA collected exclusively by city-data.com from local newspapers, TV, and radio stations
Ancestries: German (10.8%), European (10.7%), English (7.6%), Irish (5.5%), Norwegian (4.8%), Italian (3.9%).
Current Local Time: PST time zone
Incorporated in 1949
Elevation: 605 feet
Land area: 5.44 square miles.
Population density: 4,207 people per square mile (average).
1,221 residents are foreign born (1.8% Latin America, 1.7% Asia, 1.2% Europe).
| This city: | 5.4% |
| Washington: | 14.9% |
Median real estate property taxes paid for housing units with mortgages in 2022: $5,038 (0.8%)
Median real estate property taxes paid for housing units with no mortgage in 2022: $4,967 (0.8%)
Nearest city with pop. 50,000+: Graham-Thrift, WA (11.3 miles  , pop. 56,970).
Nearest city with pop. 200,000+: East Seattle, WA (29.7 miles , pop. 480,100).
Nearest city with pop. 1,000,000+: Los Angeles, CA (927.5 miles , pop. 3,694,820).
Nearest cities:
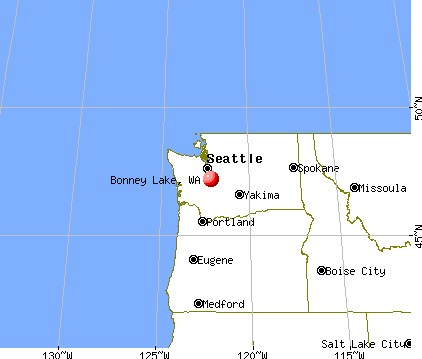
), ), ), ), ), )Latitude: 47.19 N, Longitude: 122.17 W
Daytime population change due to commuting: -3,827 (-16.8%)
Workers who live and work in this city: 3,255 (27.6%)
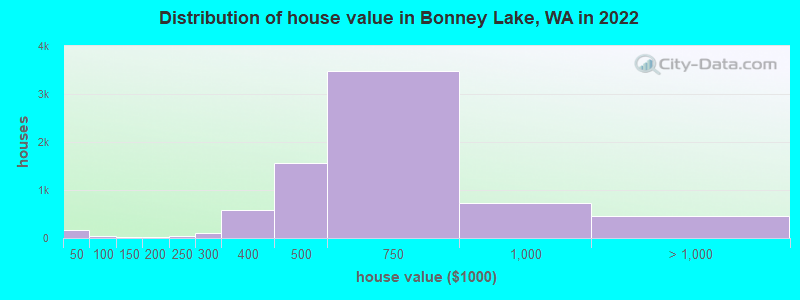
Property values in Bonney Lake, WA
Bonney Lake, Washington accommodation & food services, waste management - Economy and Business Data
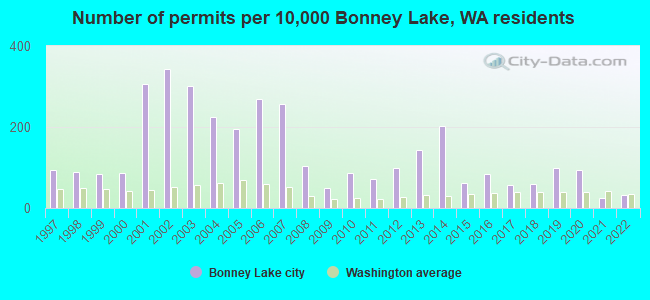
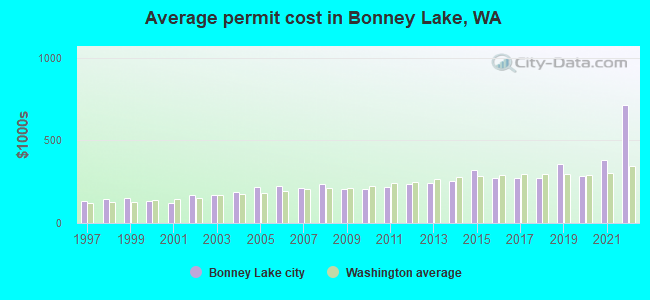
Single-family new house construction building permits:
- 2022: 31 buildings, average cost: $713,400
- 2021: 24 buildings, average cost: $382,700
- 2020: 92 buildings, average cost: $286,400
- 2019: 97 buildings, average cost: $357,900
- 2018: 57 buildings, average cost: $270,500
- 2017: 54 buildings, average cost: $273,900
- 2016: 80 buildings, average cost: $271,800
- 2015: 60 buildings, average cost: $319,400
- 2014: 197 buildings, average cost: $255,700
- 2013: 138 buildings, average cost: $244,100
- 2012: 97 buildings, average cost: $237,600
- 2011: 70 buildings, average cost: $217,300
- 2010: 83 buildings, average cost: $205,600
- 2009: 47 buildings, average cost: $206,600
- 2008: 101 buildings, average cost: $233,300
- 2007: 248 buildings, average cost: $214,300
- 2006: 262 buildings, average cost: $225,400
- 2005: 190 buildings, average cost: $215,800
- 2004: 217 buildings, average cost: $186,500
- 2003: 291 buildings, average cost: $171,700
- 2002: 331 buildings, average cost: $168,400
- 2001: 295 buildings, average cost: $122,500
- 2000: 83 buildings, average cost: $132,000
- 1999: 80 buildings, average cost: $149,200
- 1998: 86 buildings, average cost: $142,600
- 1997: 91 buildings, average cost: $133,200
| Here: | 5.5% |
| Washington: | 4.6% |
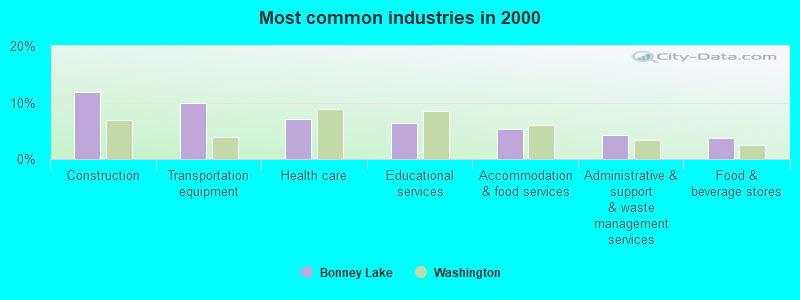
- Construction (11.9%)
- Transportation equipment (10.0%)
- Health care (7.0%)
- Educational services (6.3%)
- Accommodation & food services (5.2%)
- Administrative & support & waste management services (4.3%)
- Food & beverage stores (3.6%)
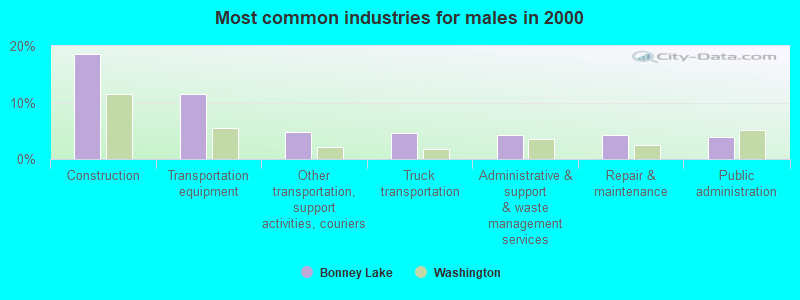
- Construction (18.5%)
- Transportation equipment (11.5%)
- Other transportation, support activities, couriers (4.8%)
- Truck transportation (4.6%)
- Administrative & support & waste management services (4.3%)
- Repair & maintenance (4.2%)
- Public administration (3.9%)
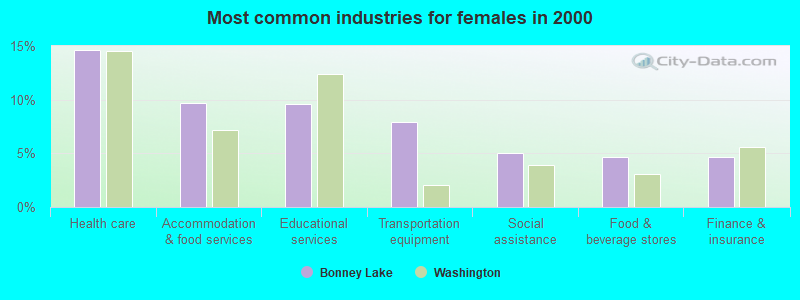
- Health care (14.6%)
- Accommodation & food services (9.7%)
- Educational services (9.6%)
- Transportation equipment (7.9%)
- Social assistance (5.1%)
- Food & beverage stores (4.7%)
- Finance & insurance (4.6%)
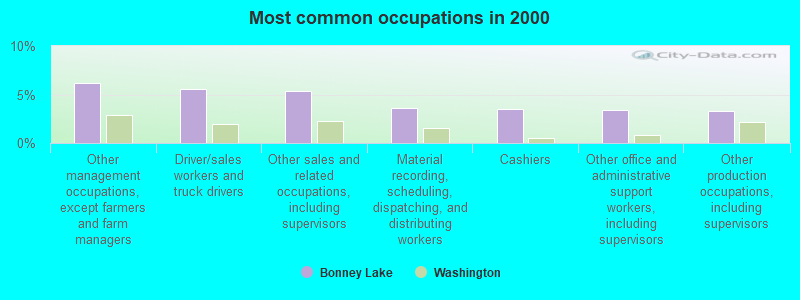
- Other management occupations, except farmers and farm managers (6.2%)
- Driver/sales workers and truck drivers (5.5%)
- Other sales and related occupations, including supervisors (5.4%)
- Material recording, scheduling, dispatching, and distributing workers (3.6%)
- Cashiers (3.5%)
- Other office and administrative support workers, including supervisors (3.4%)
- Other production occupations, including supervisors (3.3%)
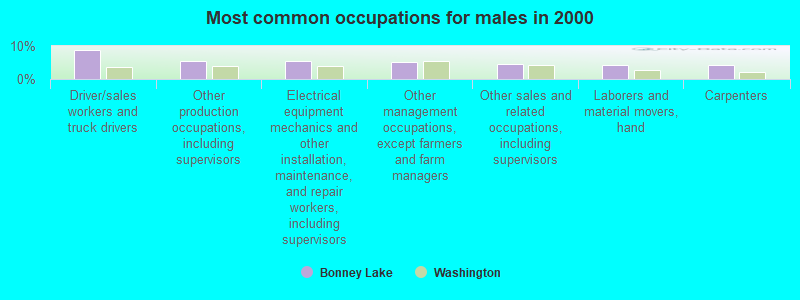
- Driver/sales workers and truck drivers (8.9%)
- Other production occupations, including supervisors (5.4%)
- Electrical equipment mechanics and other installation, maintenance, and repair workers, including supervisors (5.3%)
- Other management occupations, except farmers and farm managers (5.1%)
- Other sales and related occupations, including supervisors (4.5%)
- Laborers and material movers, hand (4.3%)
- Carpenters (4.2%)
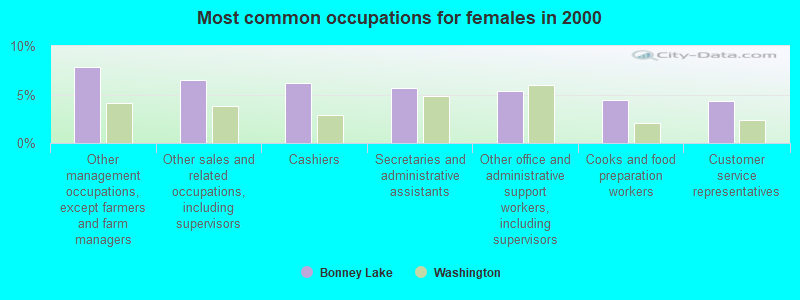
- Other management occupations, except farmers and farm managers (7.8%)
- Other sales and related occupations, including supervisors (6.5%)
- Cashiers (6.2%)
- Secretaries and administrative assistants (5.7%)
- Other office and administrative support workers, including supervisors (5.3%)
- Cooks and food preparation workers (4.4%)
- Customer service representatives (4.3%)
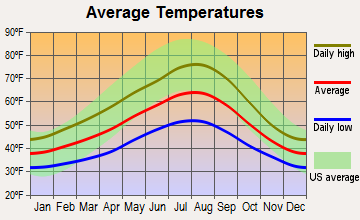
Average climate in Bonney Lake, Washington
Based on data reported by over 4,000 weather stations


|
|

(lower is better)
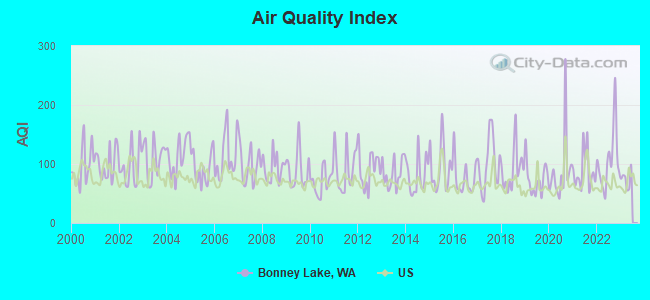
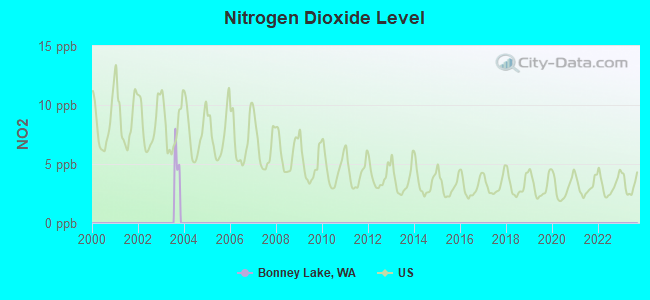
Air Quality Index (AQI) level in 2022 was 107. This is significantly worse than average.
| City: | 107 |
| U.S.: | 73 |
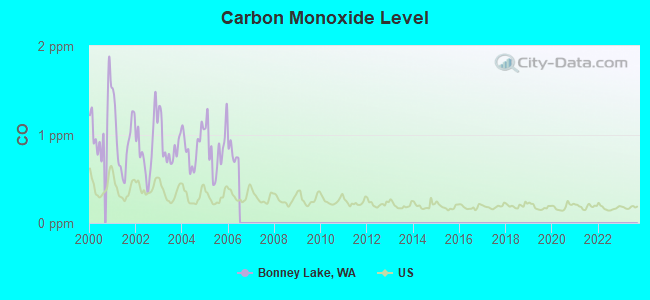
Carbon Monoxide (CO) [ppm] level in 2005 was 0.848. This is significantly worse than average. Closest monitor was 5.5 miles away from the city center.
| City: | 0.848 |
| U.S.: | 0.251 |
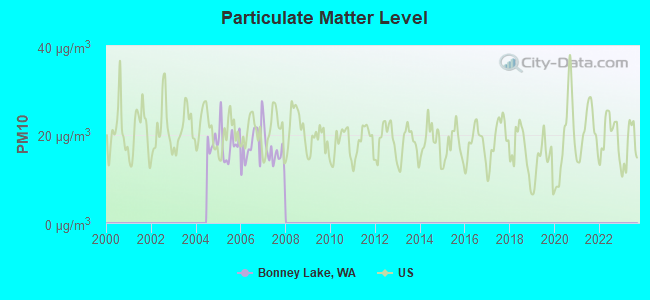
Particulate Matter (PM10) [µg/m3] level in 2007 was 16.0. This is better than average. Closest monitor was 6.9 miles away from the city center.
| City: | 16.0 |
| U.S.: | 19.2 |
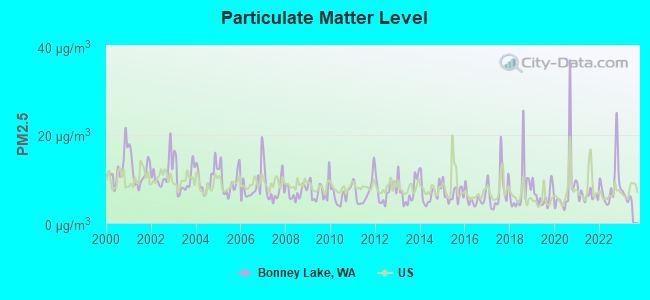
Particulate Matter (PM2.5) [µg/m3] level in 2022 was 8.92. This is about average. Closest monitor was 6.9 miles away from the city center.
| City: | 8.92 |
| U.S.: | 8.11 |
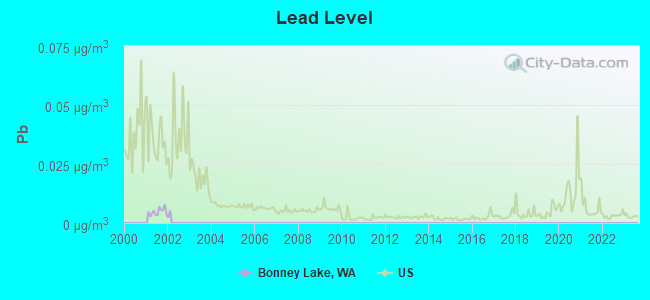
Lead (Pb) [µg/m3] level in 2001 was 0.00477. This is significantly better than average. Closest monitor was 13.3 miles away from the city center.
| City: | 0.00477 |
| U.S.: | 0.00931 |
Earthquake activity:
Bonney Lake-area historical earthquake activity is significantly above Washington state average. It is 1397% greater than the overall U.S. average.On 4/13/1949 at 19:55:42, a magnitude 7.0 (7.0 UK, Class: Major, Intensity: VIII - XII) earthquake occurred 16.1 miles away from the city center, causing $80,000,000 total damage
On 2/28/2001 at 18:54:32, a magnitude 6.8 (6.5 MB, 6.6 MS, 6.8 MW, Class: Strong, Intensity: VII - IX) earthquake occurred 20.4 miles away from the city center, causing $2,000,000,000 total damage and $305,000,000 insured losses
On 2/28/2001 at 18:54:32, a magnitude 6.8 (6.8 MD, Depth: 32.2 mi) earthquake occurred 26.3 miles away from the city center
On 4/29/1965 at 15:28:43, a magnitude 6.6 (6.6 UK) earthquake occurred 11.8 miles away from Bonney Lake center, causing $28,000,000 total damage
On 7/3/1999 at 01:43:54, a magnitude 5.8 (5.4 MB, 5.5 MS, 5.8 MW, 5.3 ME, Depth: 25.2 mi, Class: Moderate, Intensity: VI - VII) earthquake occurred 50.8 miles away from Bonney Lake center
On 5/3/1996 at 04:04:22, a magnitude 5.5 (5.2 MB, 5.3 MD, 5.5 ML, Depth: 2.5 mi) earthquake occurred 49.0 miles away from Bonney Lake center
Magnitude types: body-wave magnitude (MB), duration magnitude (MD), energy magnitude (ME), local magnitude (ML), surface-wave magnitude (MS), moment magnitude (MW)
Natural disasters:
The number of natural disasters in Pierce County (21) is greater than the US average (15).Major Disasters (Presidential) Declared: 20
Emergencies Declared: 1
Causes of natural disasters: Floods: 13, Storms: 10, Mudslides: 5, Landslides: 4, Winter Storms: 4, Earthquakes: 2, Heavy Rains: 2, Winds: 2, Hurricane: 1, Volcanic Eruption: 1, Other: 1 (Note: some incidents may be assigned to more than one category).
Hospitals and medical centers near Bonney Lake:
- SUMNER CARE CENTER (Nursing Home, about 4 miles away; SUMNER, WA)
- LINDEN GROVE (Nursing Home, about 4 miles away; PUYALLUP, WA)
- LINDEN GROVE HEALTH CARE CTR (Nursing Home, about 4 miles away; PUYALLUP, WA)
- KINDRED TRANSITIONAL CARE AND REHAB - RAINIER VISTA (Nursing Home, about 6 miles away; PUYALLUP, WA)
- LIFE CARE CENTER OF PUYALLUP (Nursing Home, about 6 miles away; PUYALLUP, WA)
- MULTICARE GOOD SAMARITAN HOSPITAL Acute Care Hospitals (about 6 miles away; PUYALLUP, WA)
- REGENCY AT PUYALLUP REHABILITATION CENTER (Nursing Home, about 6 miles away; PUYALLUP, WA)
Amtrak station near Bonney Lake:
- 13 miles: TACOMA (1001 PUYALLUP AVE.) . Services: ticket office, partially wheelchair accessible, enclosed waiting area, public restrooms, public payphones, full-service food facilities, free short-term parking, free long-term parking, call for taxi service, intercity bus service, public transit connection.
Colleges/universities with over 2000 students nearest to Bonney Lake:
- Pierce College at Puyallup (about 6 miles; Puyallup, WA; Full-time enrollment: 2,529)
- Green River Community College (about 9 miles; Auburn, WA; FT enrollment: 7,425)
- University of Washington-Tacoma Campus (about 14 miles; Tacoma, WA; FT enrollment: 3,788)
- Pacific Lutheran University (about 14 miles; Tacoma, WA; FT enrollment: 3,548)
- Bates Technical College (about 14 miles; Tacoma, WA; FT enrollment: 4,929)
- Highline Community College (about 16 miles; Des Moines, WA; FT enrollment: 6,074)
- Clover Park Technical College (about 16 miles; Lakewood, WA; FT enrollment: 4,185)
Public elementary/middle schools in Bonney Lake:
- EVERGREEN ELEMENTARY (Location: 1820 KEY PENINSULA HWY KPS, Grades: PK-5)
- KEY PENINSULA MIDDLE SCHOOL (Location: 5510 KEY PENINSULA HWY N, Grades: 6-8)
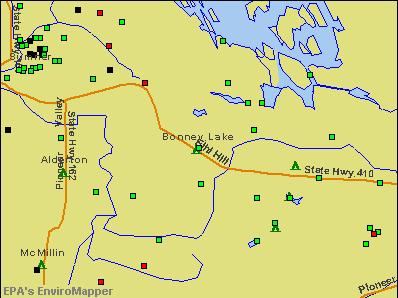
Points of interest:
Notable locations in Bonney Lake: East Pierce Fire Protection District 22 East Pierce Fire and Rescue Station 113 Bonney Lake (A), East Pierce Fire Protection District 22 East Pierce Fire and Rescue Station 11 Headquarters (B). Display/hide their locations on the map
Shopping Center: Sunridge Village Shopping Center (1). Display/hide its location on the map
Church in Bonney Lake: Living Hope Community Church (A). Display/hide its location on the map
Lakes: Bonney Lake (A), Debra Jane Lake (B). Display/hide their locations on the map
Park in Bonney Lake: Allan Yorke City Park (1). Display/hide its location on the map
Birthplace of: Cory Devela - Martial artist.
Drinking water stations with addresses in Bonney Lake and their reported violations in the past:
BONNEY LAKE WATER DEPARTMENT, CITY (Population served: 35,123, Purch surface water):Past monitoring violations:EAST END LAKE TAPPS ROD AND GUN CL (Population served: 32, Groundwater):
- 155 regular monitoring violations
Past monitoring violations:
- 3 routine major monitoring violations
- 2 regular monitoring violations
| This city: | 2.9 people |
| Washington: | 2.5 people |
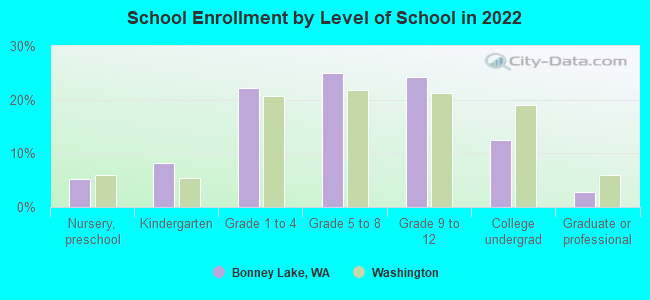
| This city: | 77.3% |
| Whole state: | 64.4% |
| This city: | 8.7% |
| Whole state: | 7.7% |
Likely homosexual households (counted as self-reported same-sex unmarried-partner households)
- Lesbian couples: 0.4% of all households
- Gay men: 0.2% of all households
5 people in other noninstitutional group quarters in 2000
Banks with branches in Bonney Lake (2011 data):
- Bank of America, National Association: Bonney Lake Branch at 19321 State Route 410 E, branch established on 1971/03/15. Info updated 2009/11/18: Bank assets: $1,451,969.3 mil, Deposits: $1,077,176.8 mil, headquarters in Charlotte, NC, positive income, 5782 total offices, Holding Company: Bank Of America Corporation
- JPMorgan Chase Bank, National Association: Bonney Lake Branch at 21003 State Route 410, branch established on 1995/01/17. Info updated 2011/11/10: Bank assets: $1,811,678.0 mil, Deposits: $1,190,738.0 mil, headquarters in Columbus, OH, positive income, International Specialization, 5577 total offices, Holding Company: Jpmorgan Chase & Co.
- Kitsap Bank: Bonney Lake at 19371 State Route 410 East, branch established on 2002/12/16. Info updated 2009/05/11: Bank assets: $903.9 mil, Deposits: $775.3 mil, headquarters in Port Orchard, WA, positive income, Commercial Lending Specialization, 22 total offices, Holding Company: Olympic Bancorp, Inc.
- U.S. Bank National Association: Bonney Lake Branch at 21125 Highway 410 E, branch established on 1993/07/26. Info updated 2012/01/30: Bank assets: $330,470.8 mil, Deposits: $236,091.5 mil, headquarters in Cincinnati, OH, positive income, 3121 total offices, Holding Company: U.S. Bancorp
- KeyBank National Association: Bonney Lake Branch at 19649 Highway 410 East, branch established on 1987/04/27. Info updated 2008/03/03: Bank assets: $86,198.8 mil, Deposits: $64,214.8 mil, headquarters in Cleveland, OH, positive income, Commercial Lending Specialization, 1067 total offices, Holding Company: Keycorp
- Columbia State Bank: Bonney Lake at 19925 State Route 410 E, branch established on 2001/10/01. Info updated 2011/08/09: Bank assets: $4,785.2 mil, Deposits: $3,892.8 mil, headquarters in Tacoma, WA, positive income, Commercial Lending Specialization, 104 total offices, Holding Company: Columbia Banking System, Inc.
For population 15 years and over in Bonney Lake:
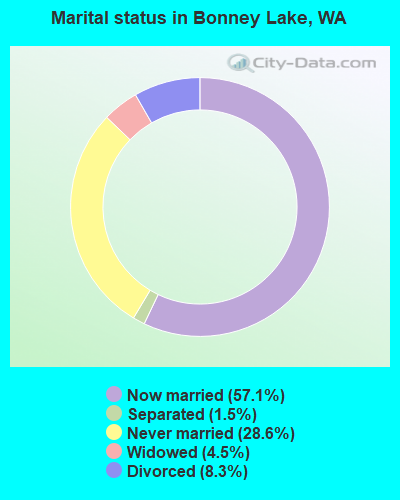
- Never married: 28.6%
- Now married: 57.1%
- Separated: 1.5%
- Widowed: 4.5%
- Divorced: 8.3%
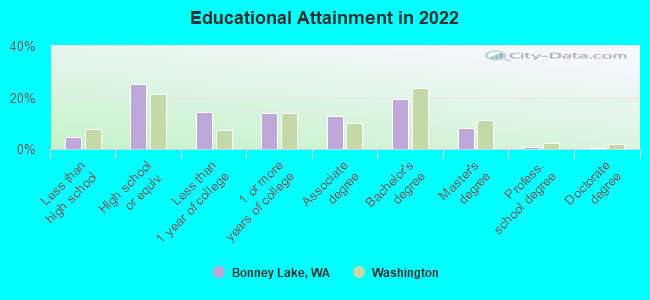
For population 25 years and over in Bonney Lake:
- High school or higher: 95.4%
- Bachelor's degree or higher: 28.5%
- Graduate or professional degree: 8.6%
- Unemployed: 4.7%
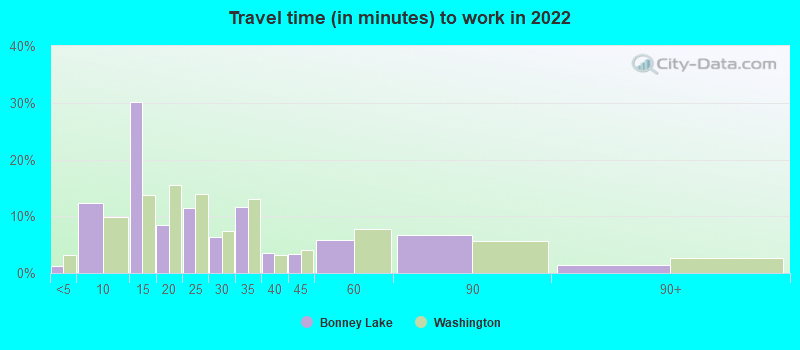
- Mean travel time to work (commute): 27.9 minutes
| Here: | 9.0 |
| Washington average: | 11.6 |
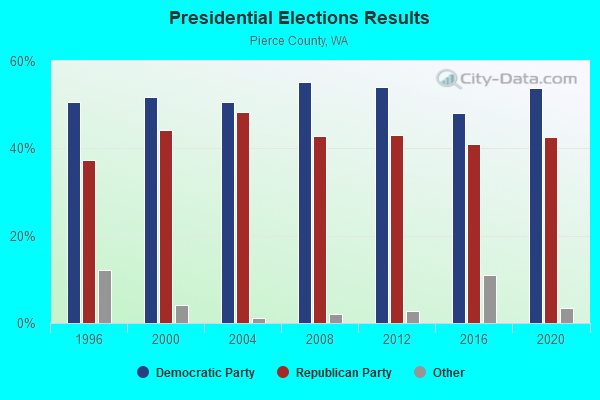
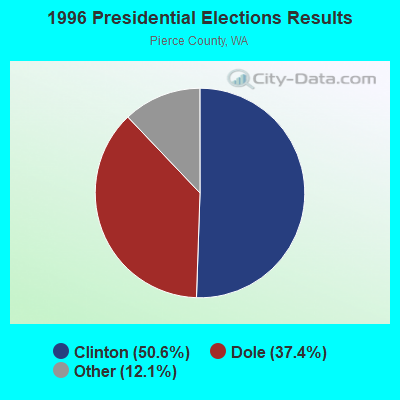
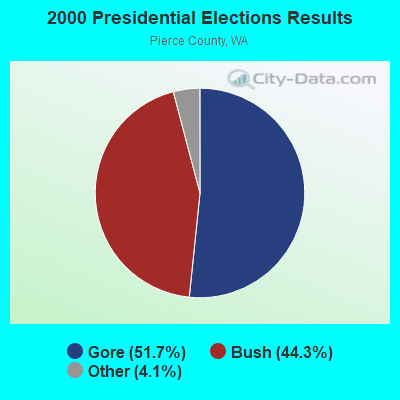
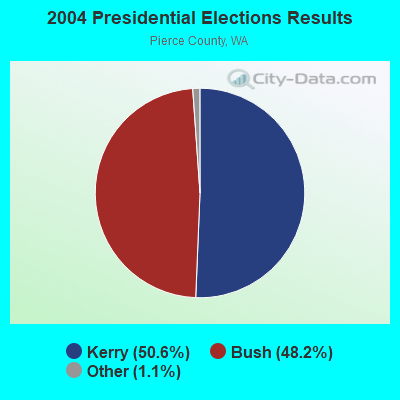
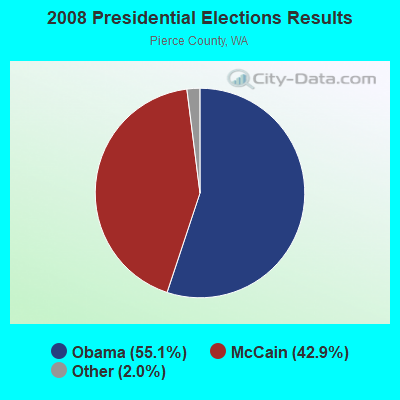
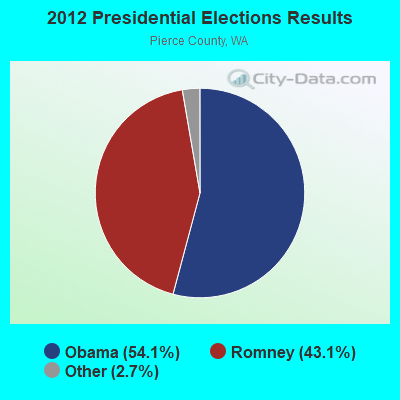
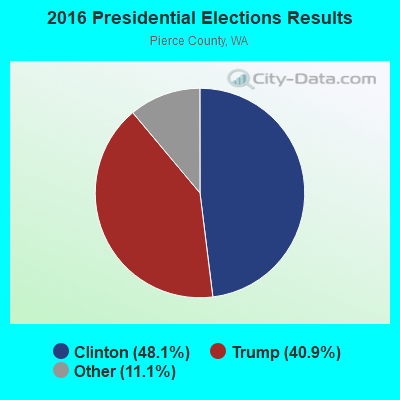
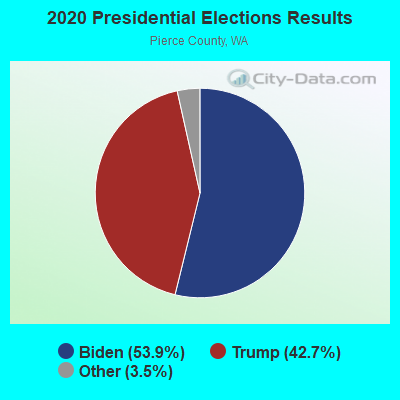
Graphs represent county-level data. Detailed 2008 Election Results
Religion statistics for Bonney Lake, WA (based on Pierce County data)
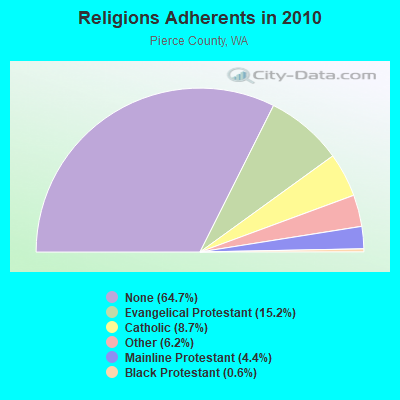
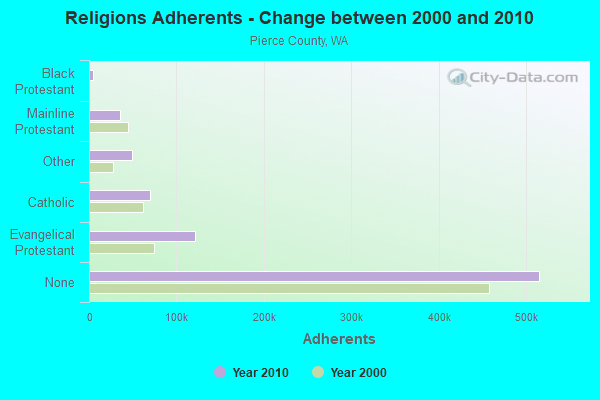
| Religion | Adherents | Congregations |
|---|---|---|
| Evangelical Protestant | 121,041 | 365 |
| Catholic | 69,558 | 26 |
| Other | 49,446 | 109 |
| Mainline Protestant | 34,906 | 123 |
| Black Protestant | 4,817 | 17 |
| Orthodox | 605 | 4 |
| None | 514,852 | - |
Food Environment Statistics:
| Pierce County: | 1.71 / 10,000 pop. |
| Washington: | 2.06 / 10,000 pop. |
| Pierce County: | 0.17 / 10,000 pop. |
| Washington: | 0.19 / 10,000 pop. |
| Pierce County: | 1.36 / 10,000 pop. |
| State: | 1.18 / 10,000 pop. |
| Pierce County: | 1.97 / 10,000 pop. |
| Washington: | 2.67 / 10,000 pop. |
| Pierce County: | 6.61 / 10,000 pop. |
| Washington: | 8.26 / 10,000 pop. |
| Pierce County: | 8.4% |
| Washington: | 7.7% |
| This county: | 29.3% |
| Washington: | 25.7% |
| Here: | 14.1% |
| Washington: | 13.9% |
Health and Nutrition:
| This city: | 49.7% |
| Washington: | 49.9% |
| Bonney Lake: | 48.5% |
| Washington: | 47.2% |
| This city: | 28.7 |
| State: | 28.4 |
| Bonney Lake: | 22.3% |
| Washington: | 20.9% |
| Here: | 8.5% |
| Washington: | 10.5% |
| Bonney Lake: | 6.8 |
| Washington: | 6.8 |
| This city: | 34.7% |
| State: | 32.8% |
| This city: | 58.3% |
| State: | 56.8% |
| This city: | 80.9% |
| State: | 79.4% |
More about Health and Nutrition of Bonney Lake, WA Residents
| Local government employment and payroll (March 2022) | |||||
| Function | Full-time employees | Monthly full-time payroll | Average yearly full-time wage | Part-time employees | Monthly part-time payroll |
|---|---|---|---|---|---|
| Police Protection - Officers | 30 | $289,638 | $115,855 | 0 | $0 |
| Water Supply | 16 | $106,619 | $79,964 | 0 | $0 |
| Other Government Administration | 14 | $104,956 | $89,962 | 14 | $8,350 |
| Streets and Highways | 14 | $113,775 | $97,521 | 0 | $0 |
| Judicial and Legal | 12 | $85,752 | $85,752 | 1 | $2,794 |
| Financial Administration | 11 | $87,815 | $95,798 | 0 | $0 |
| Sewerage | 11 | $78,862 | $86,031 | 0 | $0 |
| Housing and Community Development (Local) | 11 | $51,146 | $55,796 | 0 | $0 |
| Other and Unallocable | 10 | $60,878 | $73,054 | 4 | $6,301 |
| Welfare | 9 | $17,227 | $22,969 | 0 | $0 |
| Parks and Recreation | 7 | $47,001 | $80,573 | 0 | $0 |
| Police - Other | 5 | $29,054 | $69,730 | 0 | $0 |
| Solid Waste Management | 1 | $6,308 | $75,696 | 0 | $0 |
| Correction | 1 | $7,627 | $91,524 | 0 | $0 |
| Natural Resources | 1 | $5,176 | $62,112 | 0 | $0 |
| Totals for Government | 153 | $1,091,834 | $85,634 | 19 | $17,445 |
Bonney Lake government finances - Expenditure in 2017 (per resident):
- Construction - Regular Highways: $5,069,000 ($221.50)
Parks and Recreation: $477,000 ($20.84)
Central Staff Services: $69,000 ($3.02)
General - Other: $39,000 ($1.70)
- Current Operations - Police Protection: $4,933,000 ($215.56)
Water Utilities: $3,204,000 ($140.00)
Sewerage: $2,275,000 ($99.41)
Central Staff Services: $2,267,000 ($99.06)
General - Other: $2,236,000 ($97.71)
Financial Administration: $1,609,000 ($70.31)
Judicial and Legal Services: $1,115,000 ($48.72)
Parks and Recreation: $956,000 ($41.77)
Regular Highways: $879,000 ($38.41)
Corrections - Other: $109,000 ($4.76)
Correctional Institutions: $7,000 ($0.31)
- General - Interest on Debt: $508,000 ($22.20)
- Intergovernmental to Local - Other - Sewerage: $2,645,000 ($115.58)
Other - Water Utilities: $2,119,000 ($92.59)
Other - General - Other: $1,563,000 ($68.30)
Other - Police Protection: $494,000 ($21.59)
Other - Correctional Institutions: $177,000 ($7.73)
Other - Central Staff Services: $22,000 ($0.96)
Other - Health - Other: $13,000 ($0.57)
- Other Capital Outlay - Sewerage: $473,000 ($20.67)
Water Utilities: $414,000 ($18.09)
General - Other: $127,000 ($5.55)
- Total Salaries and Wages: $10,139,000 ($443.04)
- Water Utilities - Interest on Debt: $766,000 ($33.47)
Bonney Lake government finances - Revenue in 2017 (per resident):
- Charges - Sewerage: $7,171,000 ($313.35)
Other: $2,675,000 ($116.89)
Housing and Community Development: $180,000 ($7.87)
Parks and Recreation: $41,000 ($1.79)
- Federal Intergovernmental - Other: $1,000 ($0.04)
- Local Intergovernmental - Other: $181,000 ($7.91)
- Miscellaneous - Donations From Private Sources: $2,036,000 ($88.97)
Special Assessments: $1,961,000 ($85.69)
Fines and Forfeits: $540,000 ($23.60)
Rents: $295,000 ($12.89)
General Revenue - Other: $281,000 ($12.28)
Interest Earnings: $163,000 ($7.12)
- Revenue - Water Utilities: $8,080,000 ($353.07)
- State Intergovernmental - Other: $924,000 ($40.38)
Highways: $439,000 ($19.18)
General Local Government Support: $261,000 ($11.40)
Health and Hospitals: $3,000 ($0.13)
- Tax - General Sales and Gross Receipts: $4,590,000 ($200.57)
Public Utilities Sales: $3,861,000 ($168.71)
Property: $2,941,000 ($128.51)
Documentary and Stock Transfer: $962,000 ($42.04)
Other License: $654,000 ($28.58)
Amusements Sales: $148,000 ($6.47)
Occupation and Business License - Other: $82,000 ($3.58)
Bonney Lake government finances - Debt in 2017 (per resident):
- Long Term Debt - Outstanding Unspecified Public Purpose: $45,282,000 ($1978.68)
Beginning Outstanding - Unspecified Public Purpose: $31,848,000 ($1391.65)
Issue, Unspecified Public Purpose: $16,447,000 ($718.68)
Retired Unspecified Public Purpose: $3,013,000 ($131.66)
Bonney Lake government finances - Cash and Securities in 2017 (per resident):
- Bond Funds - Cash and Securities: $6,766,000 ($295.65)
8.45% of this county's 2021 resident taxpayers lived in other counties in 2020 ($69,857 average adjusted gross income)
| Here: | 8.45% |
| Washington average: | 7.53% |
0.15% of residents moved from foreign countries ($1,028 average AGI)
Pierce County: 0.15% Washington average: 0.05%
Top counties from which taxpayers relocated into this county between 2020 and 2021:
| from King County, WA | |
| from Thurston County, WA | |
| from Kitsap County, WA |
8.36% of this county's 2020 resident taxpayers moved to other counties in 2021 ($66,301 average adjusted gross income)
| Here: | 8.36% |
| Washington average: | 7.40% |
0.12% of residents moved to foreign countries ($853 average AGI)
Pierce County: 0.12% Washington average: 0.04%
Top counties to which taxpayers relocated from this county between 2020 and 2021:
| to King County, WA | |
| to Thurston County, WA | |
| to Kitsap County, WA |
| Businesses in Bonney Lake, WA | ||||
| Name | Count | Name | Count | |
|---|---|---|---|---|
| AT&T | 1 | McDonald's | 2 | |
| Applebee's | 1 | Nike | 3 | |
| AutoZone | 1 | Office Depot | 1 | |
| Baskin-Robbins | 1 | Papa John's Pizza | 1 | |
| Blockbuster | 1 | Payless | 1 | |
| Burger King | 1 | Pizza Hut | 1 | |
| Dairy Queen | 1 | Quiznos | 1 | |
| Discount Tire | 1 | RadioShack | 1 | |
| Domino's Pizza | 1 | Rite Aid | 1 | |
| Famous Footwear | 1 | SONIC Drive-In | 1 | |
| FedEx | 1 | Sprint Nextel | 1 | |
| GNC | 1 | Starbucks | 4 | |
| GameStop | 1 | T-Mobile | 3 | |
| H&R Block | 1 | Taco Bell | 1 | |
| Home Depot | 1 | Target | 1 | |
| Jamba Juice | 1 | U-Haul | 1 | |
| KFC | 1 | UPS | 3 | |
| Kroger | 2 | Vons | 1 | |
| Lowe's | 1 | Walmart | 1 | |
| Marshalls | 1 | Wendy's | 1 | |
Strongest AM radio stations in Bonney Lake:
- KJR (950 AM; 50 kW; SEATTLE, WA)
- KNWX (1210 AM; 28 kW; AUBURN-FEDERAL WAY, WA; Owner: ENTERCOM SEATTLE LICENSE, LLC)
- KIRO (710 AM; 50 kW; SEATTLE, WA; Owner: ENTERCOM SEATTLE LICENSE, LLC)
- KTTH (770 AM; 50 kW; SEATTLE, WA; Owner: ENTERCOM SEATTLE LICENSE, LLC)
- KZIZ (1560 AM; 5 kW; SUMNER, WA; Owner: KRIZ BROADCASTING, INC.)
- KYCW (1090 AM; 50 kW; SEATTLE, WA; Owner: INFINITY RADIO SUBSIDIARY OPERATIONS INC.)
- KGNW (820 AM; 50 kW; BURIEN-SEATTLE, WA; Owner: INSPIRATION MEDIA, INC.)
- KHHO (850 AM; 10 kW; TACOMA, WA; Owner: ACKERLEY MEDIA GROUP, INC.)
- KOMO (1000 AM; 50 kW; SEATTLE, WA; Owner: FISHER BROADCASTING - SEATTLE RADIO, L.L.C.)
- KIXI (880 AM; 50 kW; MERCER ISLAND/SEATTL, WA; Owner: BELLEVUE RADIO, INC.)
- KLAY (1180 AM; 5 kW; LAKEWOOD, WA; Owner: CLAY FRANK HUNTINGTON)
- KKOL (1300 AM; 50 kW; SEATTLE, WA; Owner: INSPIRATION MEDIA, INC.)
- KSUH (1450 AM; 1 kW; PUYALLUP, WA; Owner: RADIO HANKOOK, INC.)
Strongest FM radio stations in Bonney Lake:
- K201EX (88.1 FM; GREENWATER, WA; Owner: CALVARY CHAPEL OF TWIN FALLS, INC.)
- KGRG (89.9 FM; AUBURN, WA; Owner: GREEN RIVER COMMUNITY COLLEGE)
- KBSG-FM (97.3 FM; TACOMA, WA; Owner: ENTERCOM SEATTLE LICENSE, LLC)
- KBKS (106.1 FM; TACOMA, WA; Owner: INFINITY RADIO SUBSIDIARY OPERATIONS INC.)
- KING-FM (98.1 FM; SEATTLE, WA; Owner: CLASSIC RADIO, INC.)
- KLSY-FM (92.5 FM; BELLEVUE, WA; Owner: BELLEVUE RADIO INC.)
- KPLU-FM (88.5 FM; TACOMA, WA; Owner: PACIFIC LUTHERAN UNIVERSITY, INC.)
- KWJZ (98.9 FM; SEATTLE, WA; Owner: ORCA RADIO, INC.)
- KZOK-FM (102.5 FM; SEATTLE, WA; Owner: INFINITY RADIO SUBSIDIARY OPERATIONS INC.)
- KMPS-FM (94.1 FM; SEATTLE, WA; Owner: INFINITY RADIO SUBSIDIARY OPERATIONS INC.)
- KMTT (103.7 FM; TACOMA, WA; Owner: ENTERCOM SEATTLE LICENSE, LLC)
- KNDD (107.7 FM; SEATTLE, WA; Owner: ENTERCOM SEATTLE LICENSE, LLC)
- KYPT (96.5 FM; SEATTLE, WA; Owner: INFINITY RADIO SUBSIDIARY OPERATIONS INC.)
- KQBZ (100.7 FM; SEATTLE, WA; Owner: ENTERCOM SEATTLE LICENSE, LLC)
- KISW (99.9 FM; SEATTLE, WA; Owner: ENTERCOM SEATTLE LICENSE, LLC)
- KJR-FM (95.7 FM; SEATTLE, WA; Owner: ACKERLEY MEDIA GROUP, INC.)
- KUBE (93.3 FM; SEATTLE, WA; Owner: ACKERLEY MEDIA GROUP, INC.)
- KBTC-FM (91.7 FM; TACOMA, WA; Owner: BATES TECHNICAL COLLEGE)
- KPLZ-FM (101.5 FM; SEATTLE, WA; Owner: FISHER BROADCASTING - SEATTLE RADIO, L.L.C.)
- KNHC (89.5 FM; SEATTLE, WA; Owner: SEATTLE PUBLIC SCHOOLS)
TV broadcast stations around Bonney Lake:
- KHCV (Channel 45; SEATTLE, WA; Owner: NORTH PACIFIC INTERNATIONAL TELEVISION, INC.)
- KWPX (Channel 33; BELLEVUE, WA; Owner: PAXSON COMMUNICATIONS LICENSE COMPANY, LLC)
- KSTW (Channel 11; TACOMA, WA; Owner: UPN TELEVISION STATIONS INC.)
- KING-TV (Channel 5; SEATTLE, WA; Owner: KING BROADCASTING COMPANY)
- KBTC-TV (Channel 28; TACOMA, WA; Owner: BATES TECHNICAL COLLEGE)
- K54GS (Channel 54; PUYALLUP, WA; Owner: KIRO-TV HOLDINGS, INC.)
- K58DP (Channel 58; SEATTLE, WA; Owner: WORD OF GOD FELLOWSHIP, INC.)
- KTWB-TV (Channel 22; SEATTLE, WA; Owner: TRIBUNE TELEVISION HOLDINGS, INC.)
- KWDK (Channel 56; TACOMA, WA; Owner: PUGET SOUND EDUCATIONAL TV, INC.)
- KOMO-TV (Channel 4; SEATTLE, WA; Owner: FISHER BROADCASTING - SEATTLE TV, L.L.C.)
- KCTS-TV (Channel 9; SEATTLE, WA; Owner: KCTS TELEVISION)
- KIRO-TV (Channel 7; SEATTLE, WA; Owner: KIRO-TV HOLDINGS, INC.)
- KCPQ (Channel 13; TACOMA, WA; Owner: TRIBUNE TELEVISION NORTHWEST, INC.)
- K57HB (Channel 57; EUREKA, CA; Owner: MS COMMUNICATIONS, LLC)
- KWOG (Channel 51; BELLEVUE, WA; Owner: AFRICAN-AMERICAN BROADCASTING CO.OF BELLEVUE, INC.)
- K25CH (Channel 25; NORTH BEND, WA; Owner: TRIBUNE TELEVISION HOLDINGS, INC.)
- National Bridge Inventory (NBI) Statistics
- 6Number of bridges
- 79ft / 24.0mTotal length
- $20,805,000Total costs
- 68,084Total average daily traffic
- 4,291Total average daily truck traffic
- 103,284Total future (year 2039) average daily traffic
FCC Registered Cell Phone Towers:
1 (See the full list of FCC Registered Cell Phone Towers in Bonney Lake)FCC Registered Antenna Towers:
39 (See the full list of FCC Registered Antenna Towers)FCC Registered Broadcast Land Mobile Towers:
14 (See the full list of FCC Registered Broadcast Land Mobile Towers in Bonney Lake, WA)FCC Registered Microwave Towers:
7- BONNEY LAKE, Lat: 47.050000 Lon: -121.998611, Call Sign: WPXH413, Licensee ID: L00106820,
Assigned Frequencies: 956.393 MHz, Grant Date: 03/30/2023, Expiration Date: 04/04/2033, Certifier: Richard R Shannon, Registrant: City Of Bonney Lake
- Bonney Lake WA, 20008 S. Praire Road (Lat: 47.168306 Lon: -122.159056), Type: Tower, Structure height: 35.6 m, Overall height: 41.1 m, Call Sign: WQIK688,
Assigned Frequencies: 6197.24 MHz, Grant Date: 03/05/2008, Expiration Date: 03/05/2018, Cancellation Date: 09/05/2009, Certifier: William Chastain, Registrant: Radio Dynamics Corporation, 774 Mays Blvd., #10-465, Silver Spring, MD 20914, Phone: (301) 493-5171, Fax: (301) 576-4553, Email:
- PONDEROSA, 19808 106th St E (Lat: 47.158889 Lon: -122.165417), Type: Tank, Structure height: 32 m, Overall height: 35.1 m, Call Sign: WQKU274,
Assigned Frequencies: 11055.0 MHz, 11095.0 MHz, 11055.0 MHz, 11095.0 MHz, 11055.0 MHz, 11095.0 MHz, 11055.0 MHz, 11095.0 MHz, 11055.0 MHz, 11095.0 MHz, 10622.5 MHz, Grant Date: 07/06/2019, Expiration Date: 09/14/2029, Certifier: Ron Tiedeman, Registrant: Micronet Communications, Inc., 812 Lexington Dr, Plano, TX 75075, Phone: (972) 422-7200, Email:
- MEYERS ROAD WA, 6723 Myers Rd E (Lat: 47.196000 Lon: -122.191028), Type: Pole, Structure height: 37.8 m, Overall height: 39.7 m, Call Sign: WQXC234,
Assigned Frequencies: 11075.0 MHz, 11075.0 MHz, 11075.0 MHz, 11075.0 MHz, 11075.0 MHz, Grant Date: 01/27/2016, Expiration Date: 01/27/2026, Cancellation Date: 03/29/2016, Certifier: Steven A Regitz, Registrant: Verizon Wireless, 1120 Sanctuary Pkwy #150 Gasa5reg, Alpharetta, GA 30009-7630, Phone: (770) 797-1070, Fax: (770) 797-1036, Email:
- CHURCH LAKE, 7203 West Tapps Highway (Lat: 47.189778 Lon: -122.165917), Type: Mtower, Structure height: 45.8 m, Call Sign: WRFC439,
Assigned Frequencies: 11345.0 MHz, 11345.0 MHz, 11345.0 MHz, 11345.0 MHz, Grant Date: 01/29/2020, Expiration Date: 01/29/2030, Certifier: Laurie Gebhardt, Registrant: Cellco Partnership, 5055 North Point Pkwy, Np2ne Network Engineering, Alpharetta, GA 30022, Phone: (770) 797-1070, Email:
- PRAIRIE RIDGE, 19001 Cascadia Blvd East (Lat: 47.135000 Lon: -122.170750), Type: Mtower, Structure height: 45.8 m, Call Sign: WRFC441,
Assigned Frequencies: 10855.0 MHz, 10855.0 MHz, 10855.0 MHz, 10855.0 MHz, Grant Date: 01/29/2020, Expiration Date: 01/29/2030, Certifier: Laurie Gebhardt, Registrant: Cellco Partnership, 5055 North Point Pkwy, Np2ne Network Engineering, Alpharetta, GA 30022, Phone: (770) 797-1070, Email:
- SE04199A, 13380 Overlook Drive East (Lat: 47.134972 Lon: -122.170722), Type: Ltower, Structure height: 45.7 m, Call Sign: WRYN277,
Assigned Frequencies: 17820.0 MHz, 17980.0 MHz, 17820.0 MHz, 17980.0 MHz, 17820.0 MHz, 17980.0 MHz, 17820.0 MHz, 17980.0 MHz, 17820.0 MHz, 17980.0 MHz... (+10 more), Grant Date: 08/29/2023, Expiration Date: 08/29/2033, Certifier: Robert Nichols, Registrant: Startouch, Inc., 454 West Stuart Road, Bellingham, WA 98226, Phone: (360) 543-5679, Fax: (360) 738-6601, Email:
FCC Registered Amateur Radio Licenses:
408 (See the full list of FCC Registered Amateur Radio Licenses in Bonney Lake)FAA Registered Aircraft:
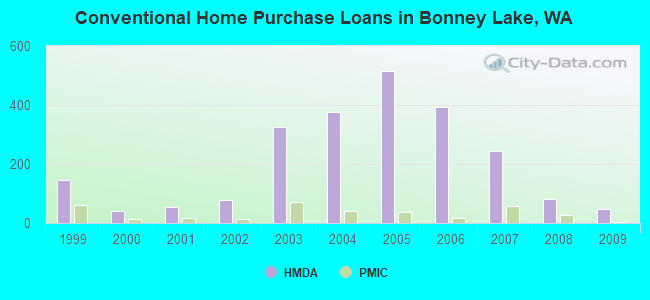
22 (See the full list of FAA Registered Aircraft in Bonney Lake)| Home Mortgage Disclosure Act Aggregated Statistics For Year 2009 (Based on 1 full and 6 partial tracts) | ||||||||||||
| A) FHA, FSA/RHS & VA Home Purchase Loans | B) Conventional Home Purchase Loans | C) Refinancings | D) Home Improvement Loans | F) Non-occupant Loans on < 5 Family Dwellings (A B C & D) | G) Loans On Manufactured Home Dwelling (A B C & D) | |||||||
|---|---|---|---|---|---|---|---|---|---|---|---|---|
| Number | Average Value | Number | Average Value | Number | Average Value | Number | Average Value | Number | Average Value | Number | Average Value | |
| LOANS ORIGINATED | 83 | $258,946 | 48 | $250,571 | 403 | $240,413 | 10 | $166,879 | 13 | $223,187 | 14 | $157,044 |
| APPLICATIONS APPROVED, NOT ACCEPTED | 9 | $230,247 | 5 | $271,768 | 57 | $249,561 | 2 | $9,110 | 4 | $166,035 | 3 | $122,823 |
| APPLICATIONS DENIED | 14 | $261,302 | 13 | $262,383 | 136 | $251,977 | 5 | $105,072 | 9 | $204,229 | 10 | $131,976 |
| APPLICATIONS WITHDRAWN | 9 | $278,389 | 7 | $286,059 | 97 | $251,920 | 2 | $160,510 | 5 | $212,788 | 3 | $171,663 |
| FILES CLOSED FOR INCOMPLETENESS | 1 | $212,930 | 1 | $213,470 | 21 | $239,167 | 1 | $283,650 | 1 | $323,680 | 2 | $122,455 |
Detailed HMDA statistics for the following Tracts: 0702.03 , 0703.03, 0703.06, 0703.08, 0703.09, 0703.10
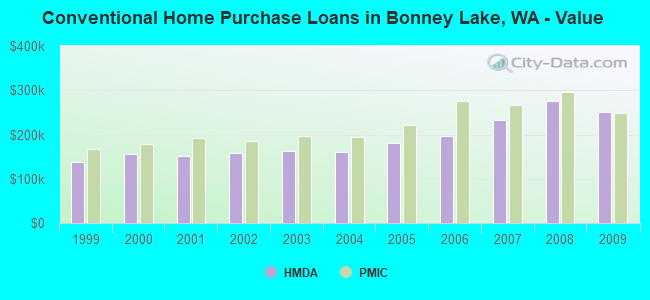
| Private Mortgage Insurance Companies Aggregated Statistics For Year 2009 (Based on 1 full and 6 partial tracts) | ||||
| A) Conventional Home Purchase Loans | B) Refinancings | |||
|---|---|---|---|---|
| Number | Average Value | Number | Average Value | |
| LOANS ORIGINATED | 5 | $247,784 | 9 | $266,410 |
| APPLICATIONS APPROVED, NOT ACCEPTED | 1 | $155,700 | 6 | $289,893 |
| APPLICATIONS DENIED | 2 | $318,695 | 5 | $303,180 |
| APPLICATIONS WITHDRAWN | 0 | $0 | 1 | $190,050 |
| FILES CLOSED FOR INCOMPLETENESS | 0 | $0 | 0 | $0 |
Detailed PMIC statistics for the following Tracts: 0702.03 , 0703.03, 0703.06, 0703.08, 0703.09, 0703.10
2002 - 2018 National Fire Incident Reporting System (NFIRS) incidents
- Fire incident types reported to NFIRS in Bonney Lake, WA
- 80738.9%Outside Fires
- 79738.4%Structure Fires
- 36417.5%Mobile Property/Vehicle Fires
- 1075.2%Other
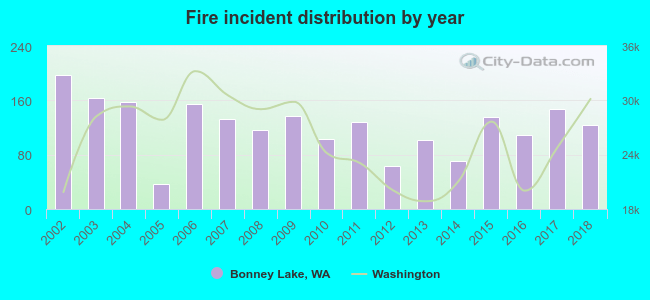 Based on the data from the years 2002 - 2018 the average number of fires per year is 122. The highest number of reported fire incidents - 197 took place in 2002, and the least - 37 in 2005. The data has a declining trend.
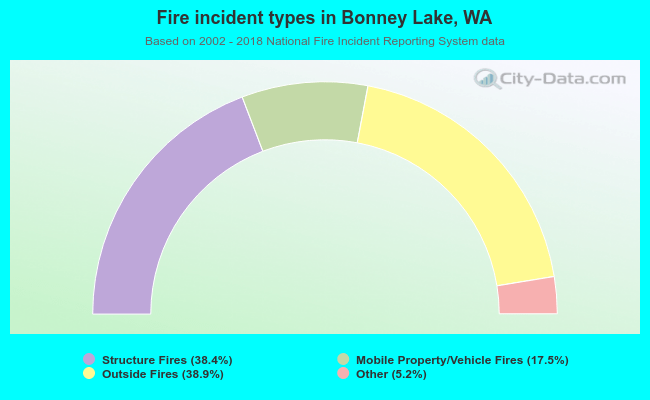 When looking into fire subcategories, the most incidents belonged to: Outside Fires (38.9%), and Structure Fires (38.4%).
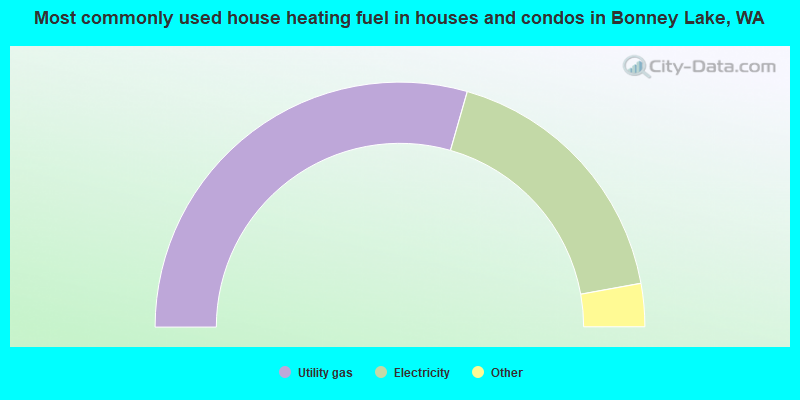
- 58.8%Utility gas
- 35.4%Electricity
- 2.5%Wood
- 1.8%Bottled, tank, or LP gas
- 1.0%Other fuel
- 0.3%Coal or coke
- 0.2%Solar energy
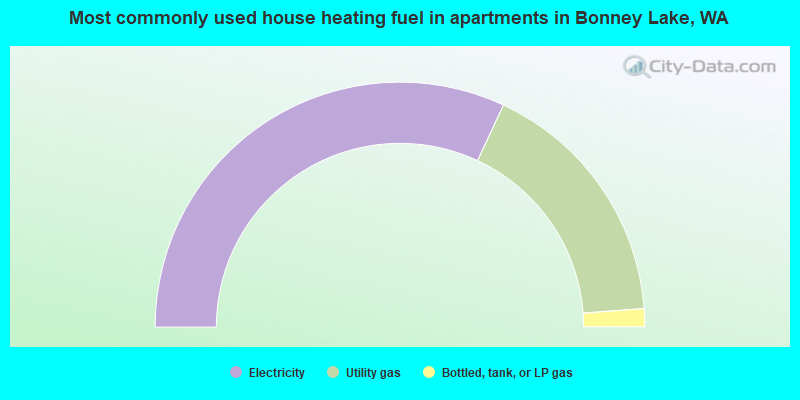
- 63.9%Electricity
- 33.7%Utility gas
- 2.4%Bottled, tank, or LP gas
Bonney Lake compared to Washington state average:
- Unemployed percentage significantly below state average.
- Hispanic race population percentage above state average.
- Renting percentage below state average.
- Length of stay since moving in significantly above state average.
- House age below state average.

|
|
Total of 171 patent applications in 2008-2024.