Butler, Pennsylvania
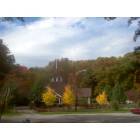
Butler: Alameda Park In the fall
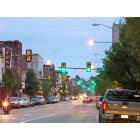
Butler: Downtown Butler, PA
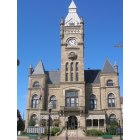
Butler: Butler County Courthouse, Butler, Pennsylvania
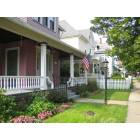
Butler: Along West Pearl Street
- add
your
Submit your own pictures of this city and show them to the world
- OSM Map
- General Map
- Google Map
- MSN Map
Population change since 2000: -12.9%
 |
| Males: 6,685 | |
| Females: 6,491 |
| Median resident age: | 38.4 years |
| Pennsylvania median age: | 40.9 years |
Zip codes: 16001, 16002, 16045.
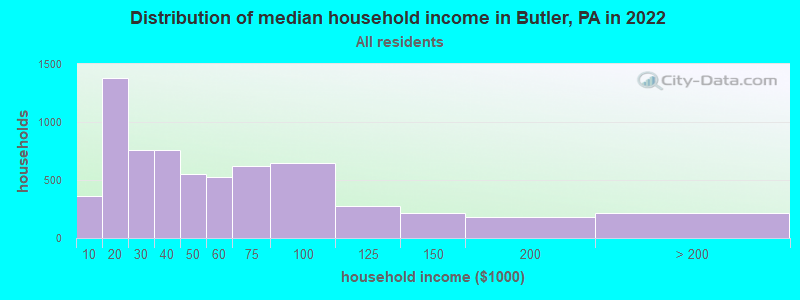
Butler Zip Code Map| Butler: | $38,793 |
| PA: | $71,798 |
Estimated per capita income in 2022: $25,606 (it was $16,457 in 2000)
Butler city income, earnings, and wages data
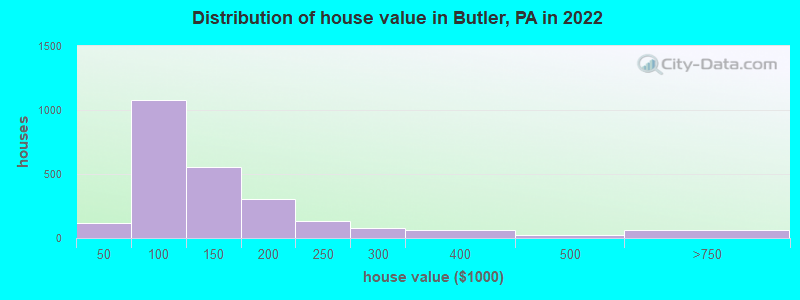
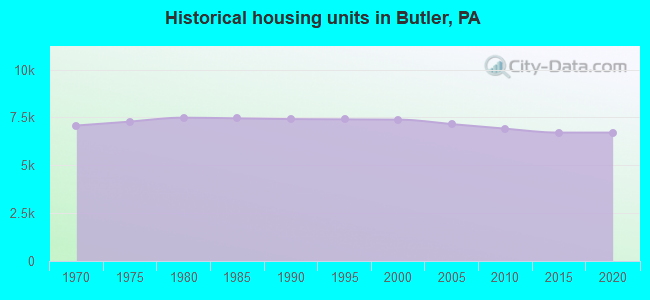
Estimated median house or condo value in 2022: $116,945 (it was $68,600 in 2000)
| Butler: | $116,945 |
| PA: | $245,500 |
Mean prices in 2022: all housing units: $312,164; detached houses: $329,405; townhouses or other attached units: $330,960; in 2-unit structures: $402,210; in 3-to-4-unit structures: $191,608; in 5-or-more-unit structures: $190,492; mobile homes: $77,817
Median gross rent in 2022: $757.
(18.6% for White Non-Hispanic residents, 56.2% for Black residents, 51.8% for Hispanic or Latino residents, 61.3% for other race residents, 37.3% for two or more races residents)
Detailed information about poverty and poor residents in Butler, PA


Compare current foreclosures in Butler, PA:
| Photo | Address | Area | Beds / Baths | Price | Details |
|---|---|---|---|---|---|

|
#1
Negley Ave
Butler, PA 16001
|
1,225 sq. feet
|
1 baths 3 beds |
$149,900
|
show details |

|
#2
Greenhill Dr
Butler, PA 16001
|
1,936 sq. feet
|
2 baths 3 beds |
show details | |

|
#3
Mcclain Ave
Butler, PA 16001
|
- sq. feet
|
1 baths 3 beds |
show details | |

|
#4
W Diamond St
Butler, PA 16001
|
- sq. feet
|
1 baths 4 beds |
show details | |

|
#5
Artlee Ave
Butler, PA 16001
|
- sq. feet
|
1 baths 3 beds |
show details | |

|
#6
Chestnut Dr
Butler, PA 16001
|
- sq. feet
|
1 baths 2 beds |
show details | |

|
#7
Standard Ave Apt 1b
Butler, PA 16001
|
- sq. feet
|
- baths - beds |
show details | |

|
#8
Saxonburg Rd
Butler, PA 16002
|
- sq. feet
|
- baths - beds |
show details | |

|
#9
Rothen Ave
Butler, PA 16001
|
- sq. feet
|
- baths - beds |
show details | |

|
#10
N Cliff St
Butler, PA 16001
|
- sq. feet
|
- baths - beds |
show details |
| Photo | Address | Area | Beds / Baths | Price | Details |
|---|---|---|---|---|---|

|
#11
Old Plank Rd
Butler, PA 16002
|
- sq. feet
|
- baths - beds |
show details | |

|
#12
Mcgrady Hollow Rd
Butler, PA 16002
|
- sq. feet
|
- baths - beds |
show details | |

|
#13
Pinecrest Ct
Butler, PA 16001
|
- sq. feet
|
- baths - beds |
show details | |

|
#14
Center Ave
Butler, PA 16001
|
- sq. feet
|
- baths - beds |
show details | |

|
#15
Bay Tree Ln
Butler, PA 16002
|
- sq. feet
|
- baths - beds |
show details | |

|
#16
N Chestnut St # 3
Butler, PA 16001
|
- sq. feet
|
- baths - beds |
show details | |

|
#17
New Castle St Apt 1
Butler, PA 16001
|
- sq. feet
|
- baths - beds |
show details | |

|
#18
W North St
Butler, PA 16001
|
- sq. feet
|
- baths - beds |
show details | |

|
#19
Stonecrest Dr
Butler, PA 16001
|
- sq. feet
|
- baths - beds |
show details | |

|
#20
Villa Dr Apt H
Butler, PA 16001
|
- sq. feet
|
- baths - beds |
show details |
| Photo | Address | Area | Beds / Baths | Price | Details |
|---|---|---|---|---|---|

|
#21
Litman Grove Ln
Butler, PA 16001
|
- sq. feet
|
- baths - beds |
show details | |

|
#22
E Pearl St Apt 1
Butler, PA 16001
|
- sq. feet
|
- baths - beds |
show details | |

|
#23
Saint Wendelin Rd
Butler, PA 16002
|
- sq. feet
|
- baths - beds |
show details | |

|
#24
N Duffy Rd # 55
Butler, PA 16001
|
- sq. feet
|
- baths - beds |
show details | |

|
#25
Evans City Rd
Butler, PA 16001
|
- sq. feet
|
- baths - beds |
show details | |

|
#26
W Fulton St
Butler, PA 16001
|
- sq. feet
|
- baths - beds |
show details | |

|
#27
4th Ave
Butler, PA 16001
|
- sq. feet
|
- baths - beds |
show details | |

|
#28
Cottonwood Dr
Butler, PA 16001
|
- sq. feet
|
- baths - beds |
show details | |

|
#29
Cherokee Dr
Butler, PA 16001
|
- sq. feet
|
- baths - beds |
show details | |

|
#30
Oak St
Butler, PA 16001
|
- sq. feet
|
- baths - beds |
show details |
| Photo | Address | Area | Beds / Baths | Price | Details |
|---|---|---|---|---|---|

|
#31
S Eberhart Rd
Butler, PA 16001
|
- sq. feet
|
- baths - beds |
show details | |

|
#32
E Pearl St # B
Butler, PA 16001
|
- sq. feet
|
- baths - beds |
show details | |

|
#33
W Pearl St
Butler, PA 16001
|
- sq. feet
|
- baths - beds |
show details | |

|
#34
Cherokee Dr
Butler, PA 16001
|
- sq. feet
|
- baths - beds |
show details | |

|
#35
Mohawk Dr
Butler, PA 16001
|
- sq. feet
|
- baths - beds |
show details | |

|
#36
Wallula Ave
Butler, PA 16001
|
- sq. feet
|
- baths - beds |
show details | |

|
#37
Shady Ave
Butler, PA 16001
|
- sq. feet
|
- baths - beds |
show details | |

|
#38
Grandview Blvd
Butler, PA 16001
|
- sq. feet
|
- baths - beds |
show details | |

|
#39
Wallula Ave
Butler, PA 16001
|
- sq. feet
|
- baths - beds |
show details | |

|
#40
W Boyd Ave
Butler, PA 16001
|
- sq. feet
|
- baths - beds |
show details |
| Photo | Address | Area | Beds / Baths | Price | Details |
|---|---|---|---|---|---|

|
#41
Arlington Ave
Butler, PA 16001
|
- sq. feet
|
- baths - beds |
show details | |

|
#42
Saxonburg Rd
Butler, PA 16002
|
- sq. feet
|
- baths - beds |
show details | |

|
#43
1st St
Butler, PA 16001
|
- sq. feet
|
- baths - beds |
show details | |

|
#44
Great Belt Rd
Butler, PA 16002
|
- sq. feet
|
- baths - beds |
show details | |

|
#45
Lesney Ln
Butler, PA 16001
|
- sq. feet
|
- baths - beds |
show details | |

|
#46
Franklin St
Butler, PA 16001
|
- sq. feet
|
- baths - beds |
show details | |

|
#47
Fairlane Dr
Butler, PA 16001
|
- sq. feet
|
- baths - beds |
show details | |

|
#48
Belleshire Dr
Butler, PA 16001
|
- sq. feet
|
- baths - beds |
show details | |

|
#49
Oakdale Rd
Butler, PA 16001
|
- sq. feet
|
- baths - beds |
show details | |

|
Check over 1 million property listings on Foreclosure.com!
|
browse all offers | |||


- 11,85387.3%White alone
- 1,0497.7%Two or more races
- 4323.2%Black alone
- 4143.0%Hispanic
- 1491.1%Other race alone
- 510.4%Asian alone
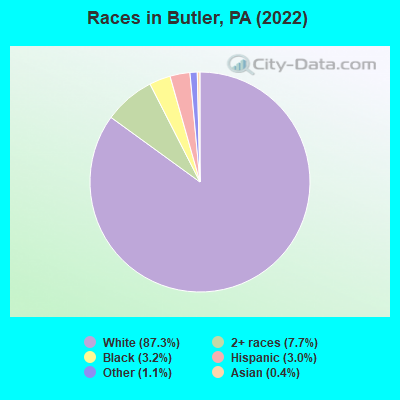
Races in Butler detailed stats: ancestries, foreign born residents, place of birth
According to our research of Pennsylvania and other state lists, there were 121 registered sex offenders living in Butler, Pennsylvania as of April 27, 2024.
The ratio of all residents to sex offenders in Butler is 111 to 1.
Type |
2009 |
2010 |
2011 |
2012 |
2013 |
2014 |
2015 |
2016 |
2017 |
2018 |
2019 |
2020 |
2021 |
2022 |
|---|---|---|---|---|---|---|---|---|---|---|---|---|---|---|
| Murders (per 100,000) | 0 (0.0) | 0 (0.0) | 0 (0.0) | 2 (14.4) | 0 (0.0) | 0 (0.0) | 0 (0.0) | 0 (0.0) | 2 (15.3) | 3 (23.0) | 0 (0.0) | 1 (7.8) | 1 (7.8) | 0 (0.0) |
| Rapes (per 100,000) | 0 (0.0) | 0 (0.0) | 0 (0.0) | 0 (0.0) | 0 (0.0) | 0 (0.0) | 0 (0.0) | 0 (0.0) | 0 (0.0) | 1 (7.7) | 0 (0.0) | 0 (0.0) | 0 (0.0) | 0 (0.0) |
| Robberies (per 100,000) | 25 (181.0) | 35 (254.4) | 29 (210.1) | 30 (216.6) | 25 (184.1) | 22 (162.8) | 24 (180.8) | 32 (242.5) | 25 (191.5) | 8 (61.5) | 9 (69.8) | 10 (78.2) | 0 (0.0) | 5 (38.1) |
| Assaults (per 100,000) | 75 (543.1) | 47 (341.6) | 56 (405.8) | 55 (397.0) | 25 (184.1) | 32 (236.8) | 37 (278.7) | 32 (242.5) | 39 (298.7) | 28 (215.1) | 40 (310.1) | 41 (320.5) | 3 (23.5) | 15 (114.4) |
| Burglaries (per 100,000) | 111 (803.8) | 111 (806.9) | 98 (710.1) | 101 (729.1) | 118 (869.1) | 122 (902.7) | 165 (1,243) | 127 (962.3) | 99 (758.2) | 56 (430.2) | 38 (294.6) | 29 (226.7) | 4 (31.3) | 8 (61.0) |
| Thefts (per 100,000) | 463 (3,353) | 481 (3,496) | 464 (3,362) | 497 (3,588) | 487 (3,587) | 432 (3,196) | 409 (3,081) | 476 (3,607) | 359 (2,749) | 271 (2,082) | 181 (1,403) | 126 (985.0) | 12 (94.0) | 27 (205.9) |
| Auto thefts (per 100,000) | 13 (94.1) | 10 (72.7) | 9 (65.2) | 14 (101.1) | 14 (103.1) | 15 (111.0) | 17 (128.1) | 12 (90.9) | 17 (130.2) | 20 (153.6) | 10 (77.5) | 5 (39.1) | 1 (7.8) | 1 (7.6) |
| Arson (per 100,000) | 6 (43.4) | 2 (14.5) | 7 (50.7) | 5 (36.1) | 9 (66.3) | 6 (44.4) | 7 (52.7) | 4 (30.3) | 1 (7.7) | 2 (15.4) | 2 (15.5) | 0 (0.0) | 0 (0.0) | 0 (0.0) |
| City-Data.com crime index | 360.9 | 346.8 | 333.6 | 375.9 | 304.6 | 296.1 | 330.5 | 340.1 | 321.3 | 239.4 | 165.9 | 161.6 | 27.0 | 47.4 |
The City-Data.com crime index weighs serious crimes and violent crimes more heavily. Higher means more crime, U.S. average is 246.1. It adjusts for the number of visitors and daily workers commuting into cities.
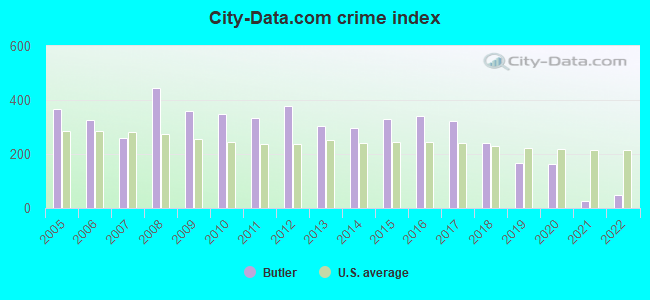
Crime rate in Butler detailed stats: murders, rapes, robberies, assaults, burglaries, thefts, arson
Full-time law enforcement employees in 2021, including police officers: 24 (22 officers - 21 male; 1 female).
| Officers per 1,000 residents here: | 1.35 |
| Pennsylvania average: | 2.55 |
 Recent articles from our blog. Our writers, many of them Ph.D. graduates or candidates, create easy-to-read articles on a wide variety of topics.

 | Hazleton, PA (14 replies) |
| Is Stroudsburg the new New Jack City? (7 replies) |
| What is the best restaurant city in NEPA? (75 replies) |
| Are Pa. property taxes high (38 replies) |
| Need to Escape From NY state - What Do I Need to Know? (42 replies) |
| Would Carbondale work for me? (5 replies) |
Latest news from Butler, PA collected exclusively by city-data.com from local newspapers, TV, and radio stations
Ancestries: German (23.8%), Irish (15.5%), Italian (14.0%), American (8.2%), English (6.3%), Polish (3.7%).
Current Local Time: EST time zone
Elevation: 1040 feet
Land area: 2.69 square miles.
Population density: 4,890 people per square mile (average).
294 residents are foreign born (0.8% Asia, 0.5% Europe, 0.4% North America, 0.3% Latin America).
| This city: | 2.2% |
| Pennsylvania: | 7.3% |
Median real estate property taxes paid for housing units with mortgages in 2022: $1,616 (1.3%)
Median real estate property taxes paid for housing units with no mortgage in 2022: $1,565 (1.5%)
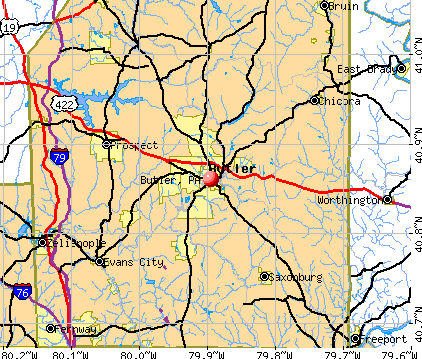
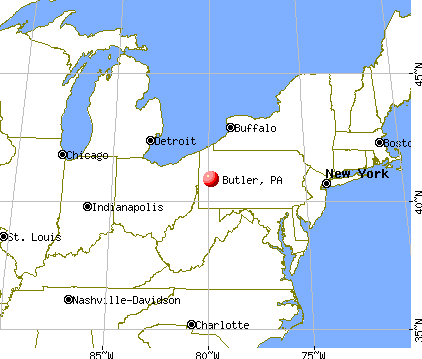
Nearest city with pop. 50,000+: Pittsburgh, PA  (29.3 miles , pop. 334,563).
Nearest city with pop. 1,000,000+: Philadelphia, PA (257.1 miles , pop. 1,517,550).
Nearest cities:
), ), ), ), ), ), ), Latitude: 40.86 N, Longitude: 79.89 W
Daytime population change due to commuting: +3,983 (+29.3%)
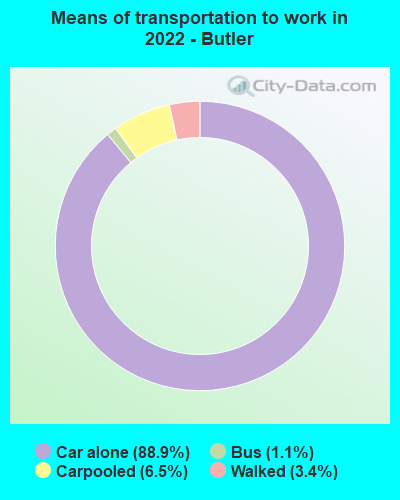
Workers who live and work in this city: 1,742 (29.6%)
Area codes: 724, 412

Butler tourist attractions:
Butler, Pennsylvania accommodation & food services, waste management - Economy and Business Data
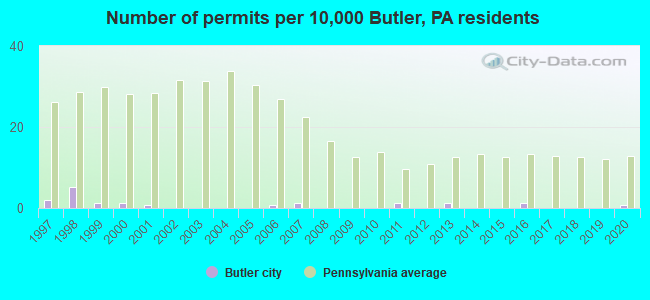
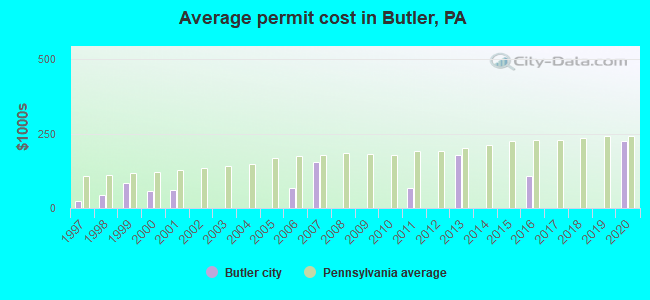
Single-family new house construction building permits:
- 2020: 1 building, cost: $225,000
- 2016: 2 buildings, average cost: $109,000
- 2013: 2 buildings, average cost: $179,000
- 2011: 2 buildings, average cost: $67,000
- 2007: 2 buildings, average cost: $154,600
- 2006: 1 building, cost: $66,200
- 2001: 1 building, cost: $60,000
- 2000: 2 buildings, average cost: $55,900
- 1999: 2 buildings, average cost: $83,500
- 1998: 8 buildings, average cost: $43,200
- 1997: 3 buildings, average cost: $24,000
| Here: | 2.6% |
| Pennsylvania: | 2.9% |

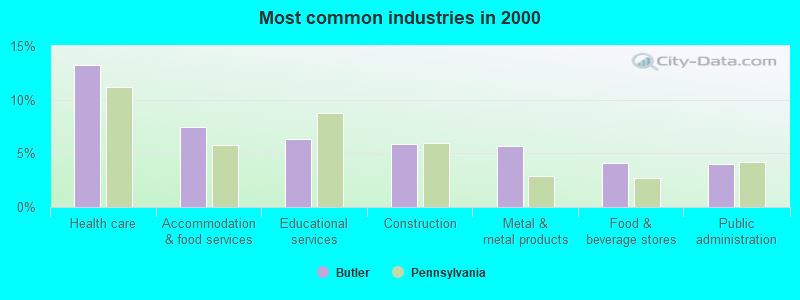
- Health care (13.2%)
- Accommodation & food services (7.5%)
- Educational services (6.3%)
- Construction (5.9%)
- Metal & metal products (5.7%)
- Food & beverage stores (4.1%)
- Public administration (4.0%)
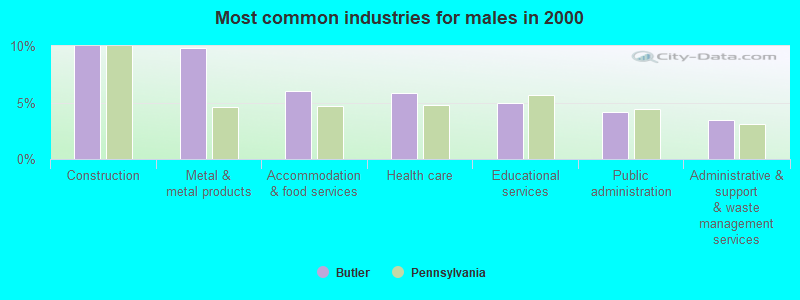
- Construction (10.0%)
- Metal & metal products (9.8%)
- Accommodation & food services (6.0%)
- Health care (5.9%)
- Educational services (5.0%)
- Public administration (4.2%)
- Administrative & support & waste management services (3.4%)
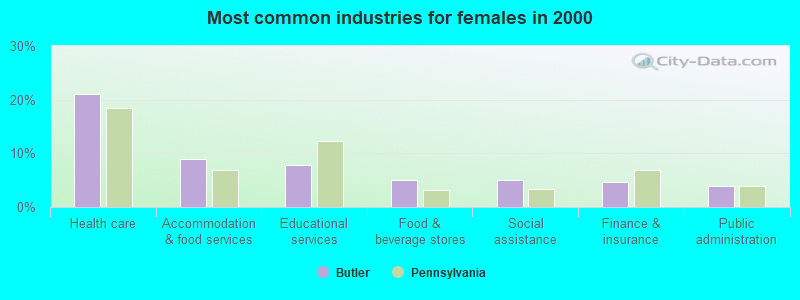
- Health care (21.0%)
- Accommodation & food services (9.0%)
- Educational services (7.8%)
- Food & beverage stores (5.1%)
- Social assistance (5.0%)
- Finance & insurance (4.7%)
- Public administration (3.8%)
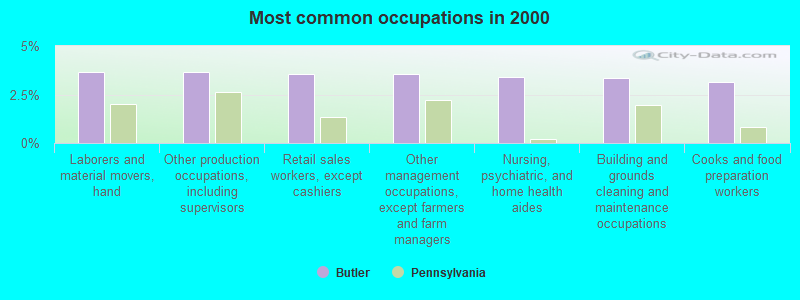
- Laborers and material movers, hand (3.7%)
- Other production occupations, including supervisors (3.6%)
- Retail sales workers, except cashiers (3.6%)
- Other management occupations, except farmers and farm managers (3.5%)
- Nursing, psychiatric, and home health aides (3.4%)
- Building and grounds cleaning and maintenance occupations (3.3%)
- Cooks and food preparation workers (3.2%)
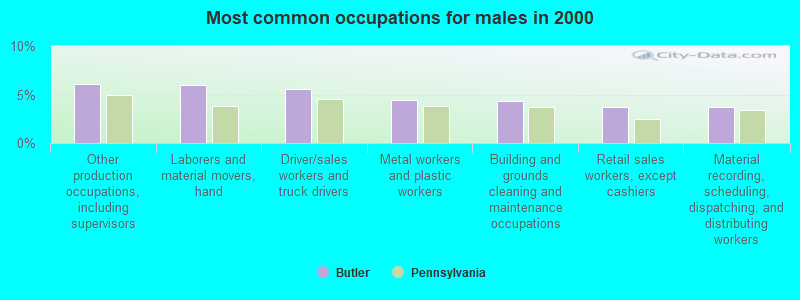
- Other production occupations, including supervisors (6.1%)
- Laborers and material movers, hand (6.0%)
- Driver/sales workers and truck drivers (5.5%)
- Metal workers and plastic workers (4.5%)
- Building and grounds cleaning and maintenance occupations (4.3%)
- Retail sales workers, except cashiers (3.8%)
- Material recording, scheduling, dispatching, and distributing workers (3.8%)
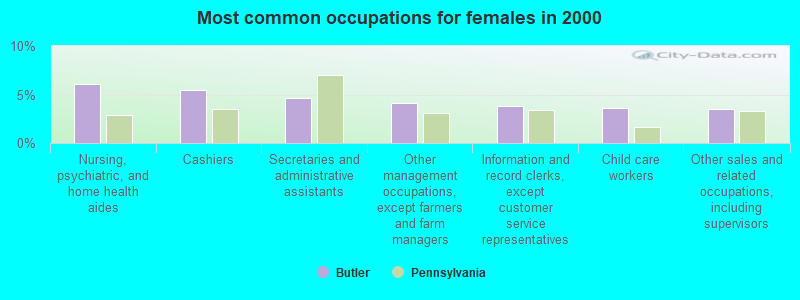
- Nursing, psychiatric, and home health aides (6.0%)
- Cashiers (5.5%)
- Secretaries and administrative assistants (4.6%)
- Other management occupations, except farmers and farm managers (4.2%)
- Information and record clerks, except customer service representatives (3.8%)
- Child care workers (3.6%)
- Other sales and related occupations, including supervisors (3.5%)
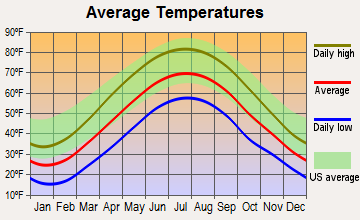
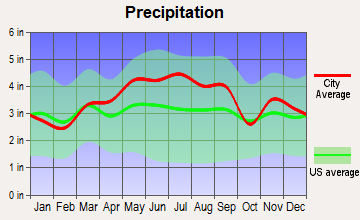
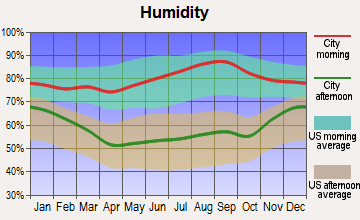
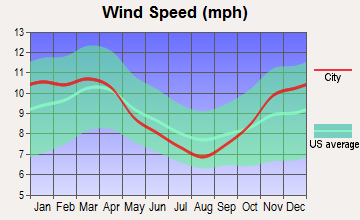
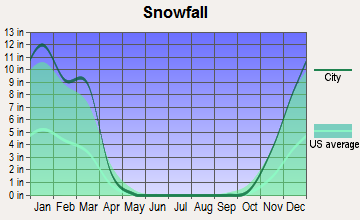
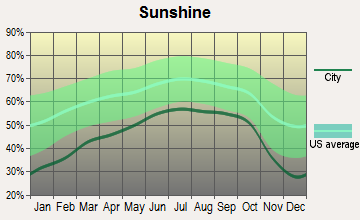
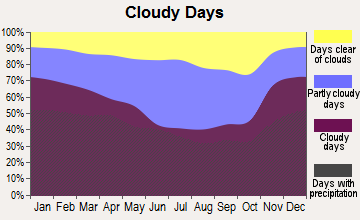
Average climate in Butler, Pennsylvania
Based on data reported by over 4,000 weather stations
|
|


(lower is better)
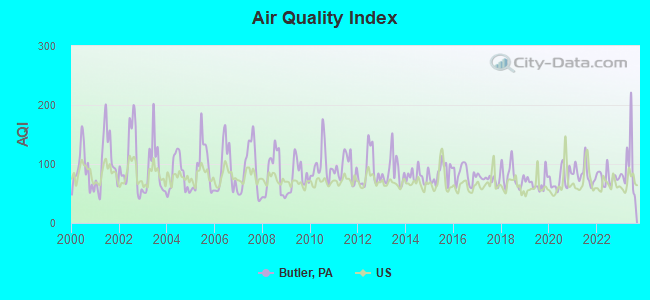
Air Quality Index (AQI) level in 2023 was 96.6. This is worse than average.
| City: | 96.6 |
| U.S.: | 72.6 |
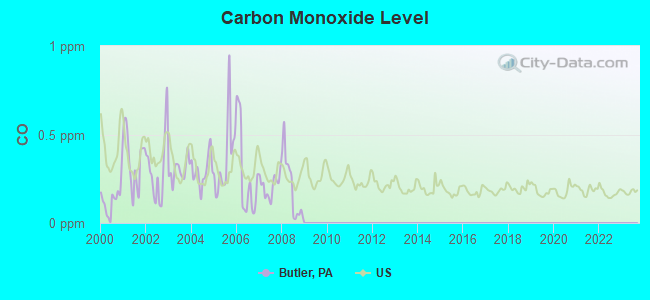
Carbon Monoxide (CO) [ppm] level in 2008 was 0.205. This is better than average. Closest monitor was 23.4 miles away from the city center.
| City: | 0.205 |
| U.S.: | 0.251 |
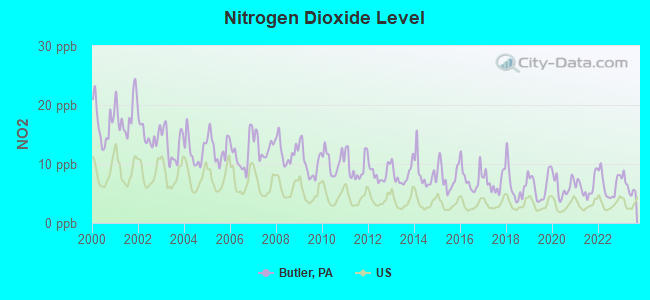
Nitrogen Dioxide (NO2) [ppb] level in 2023 was 6.29. This is worse than average. Closest monitor was 19.0 miles away from the city center.
| City: | 6.29 |
| U.S.: | 5.11 |
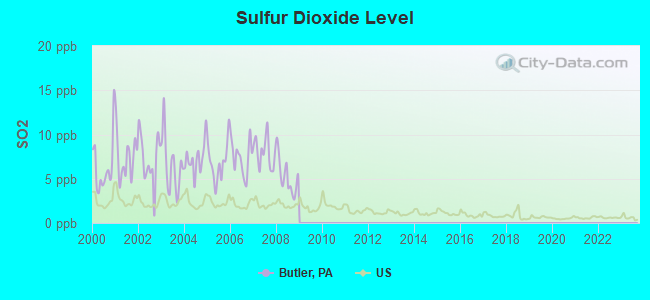
Sulfur Dioxide (SO2) [ppb] level in 2008 was 5.23. This is significantly worse than average. Closest monitor was 0.1 miles away from the city center.
| City: | 5.23 |
| U.S.: | 1.51 |
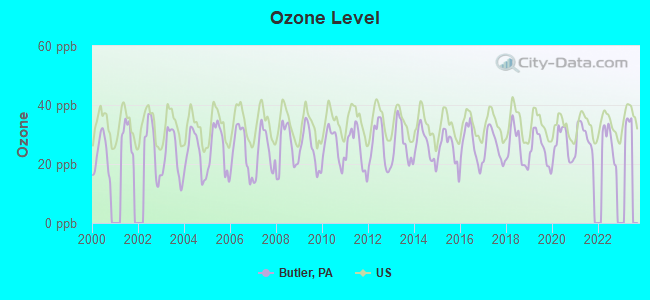
Ozone [ppb] level in 2022 was 27.9. This is about average. Closest monitor was 13.7 miles away from the city center.
| City: | 27.9 |
| U.S.: | 33.3 |
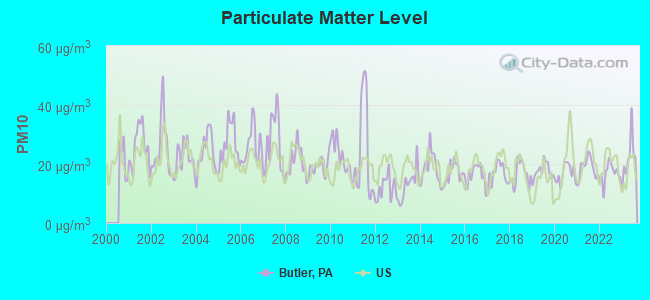
Particulate Matter (PM10) [µg/m3] level in 2023 was 22.2. This is about average. Closest monitor was 18.8 miles away from the city center.
| City: | 22.2 |
| U.S.: | 19.2 |
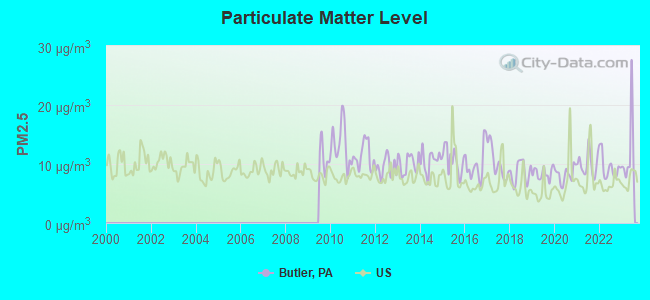
Particulate Matter (PM2.5) [µg/m3] level in 2023 was 11.9. This is significantly worse than average. Closest monitor was 17.6 miles away from the city center.
| City: | 11.9 |
| U.S.: | 8.1 |
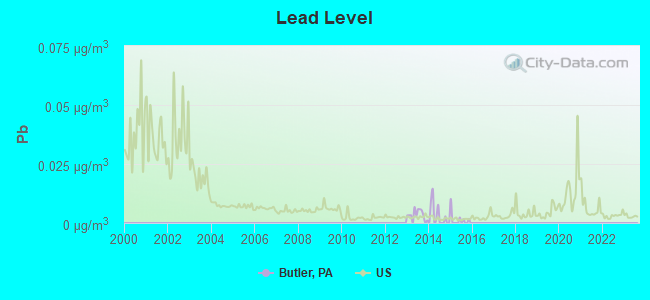
Lead (Pb) [µg/m3] level in 2015 was 0.00133. This is significantly better than average. Closest monitor was 15.7 miles away from the city center.
| City: | 0.00133 |
| U.S.: | 0.00931 |
Tornado activity:
Butler-area historical tornado activity is near Pennsylvania state average. It is 7% smaller than the overall U.S. average.
On 5/31/1985, a category F5 (max. wind speeds 261-318 mph) tornado 31.6 miles away from the Butler city center killed 18 people and injured 310 people and caused between $50,000,000 and $500,000,000 in damages.
On 6/3/1980, a category F4 (max. wind speeds 207-260 mph) tornado 16.9 miles away from the city center injured 140 people and caused between $50,000,000 and $500,000,000 in damages.
Earthquake activity:
Butler-area historical earthquake activity is significantly above Pennsylvania state average. It is 58% smaller than the overall U.S. average.On 9/25/1998 at 19:52:52, a magnitude 5.2 (4.8 MB, 4.3 MS, 5.2 LG, 4.5 MW, Depth: 3.1 mi, Class: Moderate, Intensity: VI - VII) earthquake occurred 50.8 miles away from the city center
On 8/23/2011 at 17:51:04, a magnitude 5.8 (5.8 MW, Depth: 3.7 mi) earthquake occurred 229.4 miles away from Butler center
On 1/31/1986 at 16:46:43, a magnitude 5.0 (5.0 MB) earthquake occurred 83.4 miles away from Butler center
On 12/31/2011 at 20:05:01, a magnitude 4.0 (4.0 ML, Depth: 3.1 mi, Class: Light, Intensity: IV - V) earthquake occurred 45.0 miles away from the city center
On 7/27/1980 at 18:52:21, a magnitude 5.2 (5.1 MB, 4.7 MS, 5.0 UK, 5.2 UK) earthquake occurred 283.5 miles away from Butler center
On 1/16/1994 at 01:49:16, a magnitude 4.6 (4.6 MB, 4.6 LG, Depth: 3.1 mi) earthquake occurred 205.9 miles away from the city center
Magnitude types: regional Lg-wave magnitude (LG), body-wave magnitude (MB), local magnitude (ML), surface-wave magnitude (MS), moment magnitude (MW)
Natural disasters:
The number of natural disasters in Butler County (10) is smaller than the US average (15).Major Disasters (Presidential) Declared: 7
Emergencies Declared: 3
Causes of natural disasters: Floods: 3, Hurricanes: 2, Storms: 2, Tropical Depressions: 2, Winter Storms: 2, Snowfall: 1, Snowstorm: 1, Tropical Storm: 1, Other: 1 (Note: some incidents may be assigned to more than one category).

Hospitals and medical centers in Butler:
- BUTLER MEMORIAL HOSPITAL (Voluntary non-profit - Private, provides emergency services, ONE HOSPITAL WAY)
- BUTLER CO HOME SUNNYVIEW (711 MORTON AVE EXT)
- SUNNYVIEW NURSING AND REHABILITATION CENTER (107 SUNNYVIEW CIRCLE)
- BUTLER COUNTY DIALYSIS CENTER (229 WEST DIAMOND STREET)
- AMEDISYS HOME HEALTH (240 PULLMAN SQUARE SUITE 255)
- VNA OF WESTERN PA (154 HINDMAN RD)
Airports and heliports located in Butler:
- Butler County/K W Scholter Field Airport (BTP) (Runways: 1, Air Taxi Ops: 1,328, Itinerant Ops: 12,623, Local Ops: 60,375, Military Ops: 30)
- Butler Farm Show Airport (3G9) (Runways: 1, Itinerant Ops: 700, Local Ops: 5,000, Military Ops: 4)
- Butler Memorial Hospital Heliport (PA41)
Colleges/Universities in Butler:
Other colleges/universities with over 2000 students near Butler:
- Slippery Rock University of Pennsylvania (about 17 miles; Slippery Rock, PA; Full-time enrollment: 8,424)
- Grove City College (about 23 miles; Grove City, PA; FT enrollment: 2,560)
- Robert Morris University (about 29 miles; Moon Township, PA; FT enrollment: 4,823)
- Carnegie Mellon University (about 29 miles; Pittsburgh, PA; FT enrollment: 14,186)
- University of Pittsburgh-Pittsburgh Campus (about 29 miles; Pittsburgh, PA; FT enrollment: 27,137)
- The Art Institute of Pittsburgh-Online Division (about 29 miles; Pittsburgh, PA; FT enrollment: 11,040)
- Community College of Allegheny County (about 30 miles; Pittsburgh, PA; FT enrollment: 13,486)
Public high schools in Butler:
- BUTLER AREA SHS (Students: 1,335, Location: 120 CAMPUS LANE, Grades: 11-12)
- BUTLER AREA IHS (Students: 1,278, Location: 551 FAIRGROUND HILL ROAD, Grades: 9-10)
- BUTLER COUNTY AVTS (Students: 924, Location: 210 CAMPUS LANE, Grades: 9-12)
Private high schools in Butler:
- FIRST BAPTIST CHRISTIAN SCHOOL (Students: 129, Location: 221 NEW CASTLE ST, Grades: PK-12)
- BUTLER WESLEYAN ACADEMY (Students: 21, Location: 590 PROTZMAN RD, Grades: 3-12)
Biggest public elementary/middle schools in Butler:
- BUTLER AREA JHS (Students: 1,344, Location: 225 EAST NORTH STREET, Grades: 7-8)
- CENTER TWP SCH (Students: 747, Location: 950 MERCER ROAD, Grades: KG-6)
- MCQUISTION EL SCH (Students: 506, Location: 210 MECHLING DRIVE, Grades: KG-6)
- NORTHWEST SCH (Students: 457, Location: 124 STALEY AVENUE, Grades: KG-6)
- MERIDIAN SCH (Students: 454, Location: 135 SPARKS AVENUE, Grades: KG-6)
- EMILY BRITTAIN EL SCH (Students: 423, Location: 338 NORTH WASHINGTON STREET, Grades: KG-6)
- OAKLAND TWP SCH (Students: 298, Location: 545 CHICORA ROAD, Grades: KG-6)
- BROAD ST SCH (Students: 278, Location: 200 BROAD STREET, Grades: KG-6)
- SUMMIT EL SCH (Students: 262, Location: 351 BRINKER ROAD, Grades: KG-6)
- CENTER AVENUE SCH (Students: 227, Location: 102 CENTER AVENUE, Grades: KG-6)
Private elementary/middle schools in Butler:
- PENN CHRISTIAN ACADEMY (Students: 338, Location: 199 AIRPORT RD, Grades: PK-6)
- BUTLER CATHOLIC SCHOOL (Students: 221, Location: 515 E LOCUST ST, Grades: KG-8)
- HOLY SEPULCHER ELEMENTARY SCHOOL (Students: 163, Location: 6515 OLD ROUTE 8 N, Grades: PK-8)
- ST WENDELIN CATHOLIC SCHOOL (Students: 89, Location: 211 SAINT WENDELIN RD, Grades: PK-8)
- HIS KIDS CHRISTIAN SCHOOL (Students: 50, Location: 650 SAXONBURG RD, Grades: PK-4)
Libraries in Butler:
- BUTLER AREA PUBLIC LIBRARY (Operating income: $889,356; Location: 218 NORTH MCKEAN ST; 88,536 books; 3,528 audio materials; 3,855 video materials; 1 local licensed databases; 41 state licensed databases; 132 print serial subscriptions; 1 electronic serial subscriptions)
- BUTLER COUNTY FED LIB SYSTEM (Operating income: $498,338; Location: 218 N. MCKEAN ST.; 26,376 books; 1,067 audio materials; 1,069 video materials; 3 local licensed databases; 41 state licensed databases; 13 print serial subscriptions; 3 electronic serial subscriptions)
User-submitted facts and corrections:
- 1920 Picture Baptist Church Bible Class
- 1920 Picture Baptist Church Bible Class
added by Arthur Morneweck
Points of interest:
Notable location: Butler Bureau of Fire Station 1 (A). Display/hide its location on the map
Cemeteries: Butler Memorial Park (1), South Cemetery (2), North Cemetery (3). Display/hide their locations on the map
Streams, rivers, and creeks: Sullivan Run (A), Coal Run (B). Display/hide their locations on the map
Tourist attractions: Butler County Heritage & Industrial Museum (119 New Castle Street), Butler County Historical Society (Historical Places & Services; 106 South Main Street), Americade Gaming Center (Amusement & Theme Parks; 310 New Castle Road), Aladdin's Castle (Amusement & Theme Parks; 152 North Main Street), Bowler's Edge Professional Shop (Amusement & Theme Parks; 333 Meridian Road), Family Bowlaway (Amusement & Theme Parks; 540 Fairground Hill Road), Eracers Go-Kart Bumper-Boat Park (Amusement & Theme Parks; 640 Evans City Road), Bus Charter Service (Tours & Charters; 210 South Monroe Street).
Hotels: Comfort Inn Butler (1 Comfort Lane), Colonial Motel (193 New Castle Road), Conley's Resort Inn (740 Pittsburgh Rd Route 8), Eastwood Village Apartments and Hotel (105 Chicora Road), Days Inn Butler PA (139 Pittsburgh Road).
Courts: English Phil Congressman (101 East Diamond Street Suite 213), Butler-County - Judges Chambers- Court Administrator (124 West Diamond Street), Butler County - District Justices Offices- District Court 50-1-01- O'Donnell Kev (121 Sunnyview Circle).
Birthplace of: Big John Studd - Professional wrestler, Brian Minto - Boxer, Jonathan W. Greenert - Admiral, Khalil Greene - 2005 Major League Baseball player (San Diego Padres, born: Oct 21, 1979), Marc Blucas - Actor, Matt Clement - 2005 Major League Baseball player (Boston Red Sox, born: Aug 12, 1974), Paul Posluszny - College football pllayer, Woody Widenhofer - Football player and coach, Bret Michaels - (of rock group Poison), Jerry Meals - Baseball umpire.
Drinking water stations with addresses in Butler and their reported violations in the past:
ST MARYS CHURCH (Population served: 800, Groundwater):Past monitoring violations:BRANDON MAINTENANCE REPAIR INC (Population served: 300, Groundwater):
- Monitoring and Reporting (DBP) - Between JAN-2007 and MAR-2007, Contaminant: Chlorine. Follow-up actions: St Violation/Reminder Notice (AUG-20-2007), St Compliance achieved (AUG-20-2007)
- Monitoring and Reporting (DBP) - Between APR-2006 and JUN-2006, Contaminant: Chlorine. Follow-up actions: St Compliance Meeting conducted (OCT-18-2006), St Compliance achieved (OCT-18-2006)
- Monitoring and Reporting (DBP) - Between JAN-2006 and MAR-2006, Contaminant: Chlorine. Follow-up actions: St Compliance Meeting conducted (OCT-18-2006), St Compliance achieved (OCT-18-2006)
- Monitoring and Reporting (DBP) - Between OCT-2005 and DEC-2005, Contaminant: Chlorine. Follow-up actions: St Compliance Meeting conducted (OCT-18-2006), St Compliance achieved (OCT-18-2006)
- Monitoring and Reporting (DBP) - Between JUL-2005 and SEP-2005, Contaminant: Chlorine. Follow-up actions: St Compliance Meeting conducted (OCT-18-2006), St Compliance achieved (OCT-18-2006)
- 2 routine major monitoring violations
- 2 other older monitoring violations
Past health violations:SMITHGROVE CAMPGROUND (Population served: 200, Groundwater):Past monitoring violations:
- MCL, Monthly (TCR) - Between APR-2011 and JUN-2011, Contaminant: Coliform. Follow-up actions: St Public Notif requested (AUG-01-2011), St Compliance achieved (AUG-01-2011), St Violation/Reminder Notice (AUG-01-2011)
- MCL, Acute (TCR) - Between APR-2011 and JUN-2011, Contaminant: Coliform. Follow-up actions: St Public Notif requested (AUG-01-2011), St Compliance achieved (AUG-01-2011), St Violation/Reminder Notice (AUG-01-2011)
- Monitoring and Reporting (DBP) - Between JAN-2014 and MAR-2014, Contaminant: Chlorine. Follow-up actions: St Violation/Reminder Notice (MAY-02-2014), St Compliance achieved (MAY-02-2014)
Past monitoring violations:VOCELLI PIZZA VALENCIA (Population served: 200, Groundwater):
- One minor monitoring violation
- 2 regular monitoring violations
Past monitoring violations:MT CHESTNUT NAZARENE DIST CTR (Population served: 150, Groundwater):
- One routine major monitoring violation
Past monitoring violations:MCBRIDES STATION (Population served: 150, Groundwater):
- One regular monitoring violation
Past monitoring violations:YMCA CAMP ARMCO PARK (Population served: 100, Groundwater):
- Monitoring, Repeat Major (TCR) - Between APR-2006 and JUN-2006, Contaminant: Coliform (TCR). Follow-up actions: St Public Notif requested (AUG-08-2006), St Formal NOV issued (AUG-08-2006), St Compliance achieved (AUG-25-2006), St Public Notif received (AUG-25-2006)
- 3 routine major monitoring violations
Past monitoring violations:LEES PLACE (Population served: 100, Groundwater):
- 2 regular monitoring violations
Past monitoring violations:
- 7 routine major monitoring violations
Drinking water stations with addresses in Butler that have no violations reported:
- SUNCREST GOLF COURSE (Population served: 200, Primary Water Source Type: Groundwater)
- HILAND GOLF COURSE (Population served: 100, Primary Water Source Type: Groundwater)
- LAKEVUE NORTH GOLF COURSE (Population served: 75, Primary Water Source Type: Groundwater)
- CARAVAN COURT MHP (Population served: 67, Primary Water Source Type: Groundwater)
- MICHAELS RESTAURANT & MOTEL (Population served: 40, Primary Water Source Type: Groundwater)
- HERMAN MINI MART (Population served: 25, Primary Water Source Type: Groundwater)
- SERENE VALLEY GOLF COURSE (Population served: 25, Primary Water Source Type: Groundwater)
- RUNWAY RESTAURANT & LOUNGE (Population served: 25, Primary Water Source Type: Groundwater)
- PORKYS SMOKEHOUSE (Population served: 25, Primary Water Source Type: Groundwater)
| This city: | 2.2 people |
| Pennsylvania: | 2.5 people |
| This city: | 51.3% |
| Whole state: | 65.0% |
| This city: | 8.9% |
| Whole state: | 6.6% |
Likely homosexual households (counted as self-reported same-sex unmarried-partner households)
- Lesbian couples: 0.5% of all households
- Gay men: 0.4% of all households
People in group quarters in Butler in 2010:
- 205 people in local jails and other municipal confinement facilities
- 154 people in other noninstitutional facilities
- 136 people in emergency and transitional shelters (with sleeping facilities) for people experiencing homelessness
- 27 people in group homes intended for adults
- 27 people in residential treatment centers for adults
- 13 people in group homes for juveniles (non-correctional)
People in group quarters in Butler in 2000:
- 151 people in hospitals/wards and hospices for chronically ill
- 151 people in other hospitals or wards for chronically ill
- 132 people in local jails and other confinement facilities (including police lockups)
- 108 people in other noninstitutional group quarters
- 21 people in other types of correctional institutions
- 16 people in homes for the mentally ill
- 13 people in homes for the mentally retarded
- 8 people in wards in general hospitals for patients who have no usual home elsewhere
- 8 people in religious group quarters
Banks with most branches in Butler (2011 data):
- PNC Bank, National Association: Moraine Pointe Branch, Clearview Mall Branch, Butler Main Branch, Butler Du Branch. Info updated 2012/03/20: Bank assets: $263,309.6 mil, Deposits: $197,343.0 mil, headquarters in Wilmington, DE, positive income, Commercial Lending Specialization, 3085 total offices, Holding Company: Pnc Financial Services Group, Inc., The
- Nextier Bank, National Association: Butler Branch, North Main Street Branch, Moraine Pointe Branch. Info updated 2006/11/03: Bank assets: $496.6 mil, Deposits: $429.9 mil, headquarters in Evans City, PA, negative income in the last year, Commercial Lending Specialization, 17 total offices, Holding Company: Nextier Incorporated
- Citizens Bank of Pennsylvania: Butler Branch, Clearview Mall Giant Eagle Branch, Moraine Point Plaza Giant Eagle Bran. Info updated 2010/09/24: Bank assets: $32,316.9 mil, Deposits: $25,297.1 mil, headquarters in Philadelphia, PA, positive income, 396 total offices, Holding Company: Uk Financial Investments Limited
- The Farmers National Bank of Emlenton: Bon Aire Branch at 1101 North Main Street, branch established on 1996/05/20; Meridian Branch at 101 Meridian Road, branch established on 2003/01/24. Info updated 2008/11/05: Bank assets: $490.2 mil, Deposits: $416.5 mil, headquarters in Emlenton, PA, positive income, Commercial Lending Specialization, 13 total offices, Holding Company: Emclaire Financial Corp
- First Commonwealth Bank: Butler Branch at 100 North Main Street, branch established on 1942/04/28; Butler Crossing Branch at 520 Butler Crossing, branch established on 2009/03/02. Info updated 2010/11/23: Bank assets: $5,779.0 mil, Deposits: $4,511.6 mil, headquarters in Indiana, PA, positive income, Commercial Lending Specialization, 112 total offices, Holding Company: First Commonwealth Financial Corporation
- The Huntington National Bank: Stirling Village Branch at 500 Stirling Village, branch established on 1991/05/20; South Main Branch at 127 South Main Street, branch established on 1975/05/12. Info updated 2012/04/02: Bank assets: $54,183.4 mil, Deposits: $44,300.3 mil, headquarters in Columbus, OH, positive income, Commercial Lending Specialization, 878 total offices, Holding Company: Huntington Bancshares Incorporated
- First National Bank of Pennsylvania: Butler Commons Branch at 110 Butler Commons, branch established on 2011/09/06. Info updated 2012/01/10: Bank assets: $9,581.0 mil, Deposits: $7,462.2 mil, headquarters in Greenville, PA, positive income, Commercial Lending Specialization, 291 total offices, Holding Company: F.N.b. Corporation
- Northwest Savings Bank: Butler Township Branch at 151 Pittsburgh Road, branch established on 1998/10/08. Info updated 2009/11/23: Bank assets: $7,975.9 mil, Deposits: $5,985.6 mil, headquarters in Warren, PA, positive income, Mortgage Lending Specialization, 172 total offices
- Woodforest National Bank: Butler Walmart Branch at 400 Butler Commons, branch established on 2008/01/05. Info updated 2011/05/10: Bank assets: $3,488.9 mil, Deposits: $3,097.6 mil, headquarters in Houston, TX, positive income, Commercial Lending Specialization, 766 total offices, Holding Company: Woodforest Financial Group Employee Stock Ownership Plan (With 401(K) Provisions)
- 3 other banks with 3 local branches
For population 15 years and over in Butler:
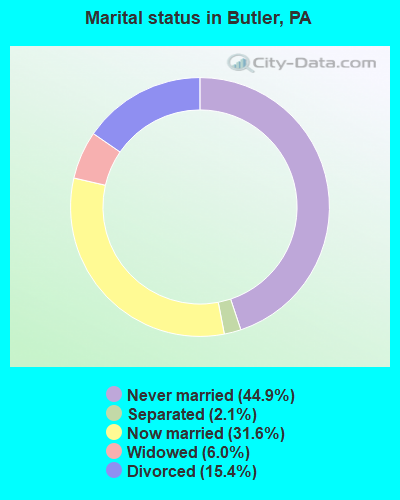
- Never married: 44.9%
- Now married: 31.6%
- Separated: 2.1%
- Widowed: 6.0%
- Divorced: 15.4%
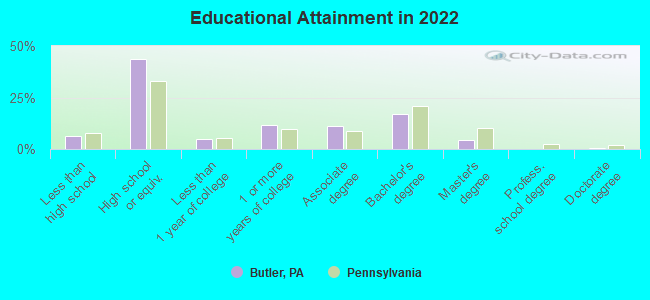
For population 25 years and over in Butler:
- High school or higher: 93.1%
- Bachelor's degree or higher: 22.3%
- Graduate or professional degree: 5.0%
- Unemployed: 5.9%
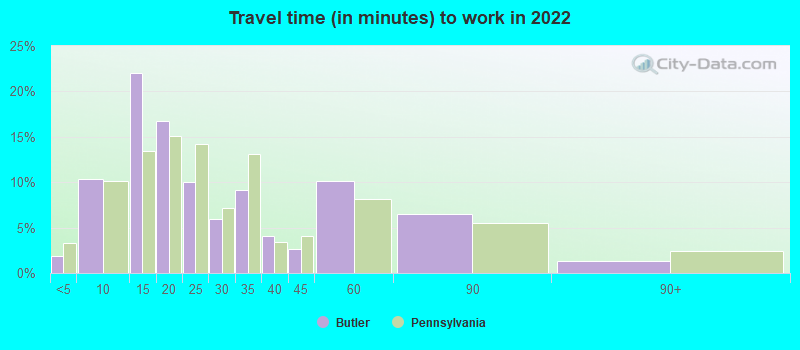
- Mean travel time to work (commute): 18.5 minutes
| Here: | 8.2 |
| Pennsylvania average: | 11.4 |
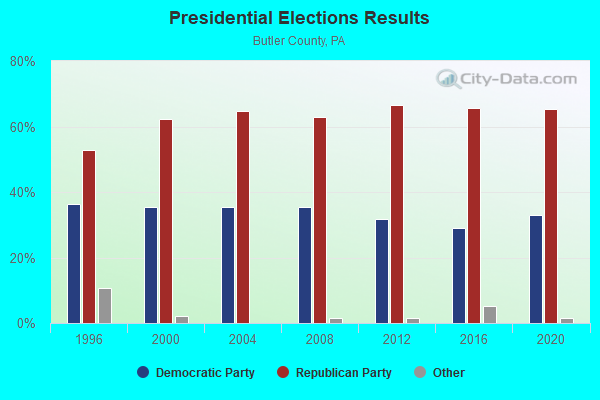
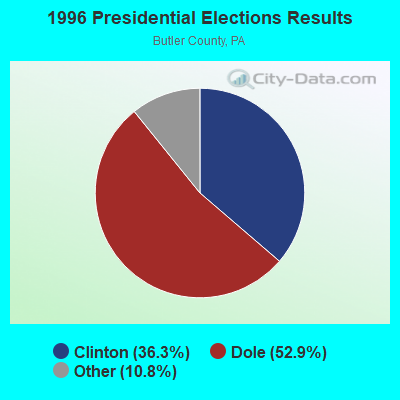
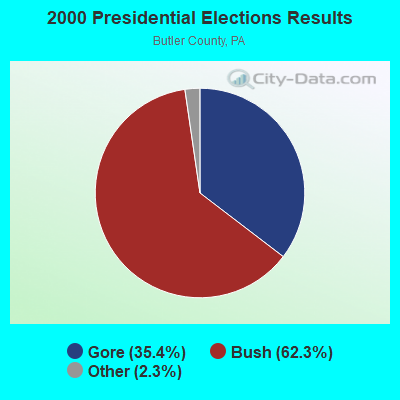
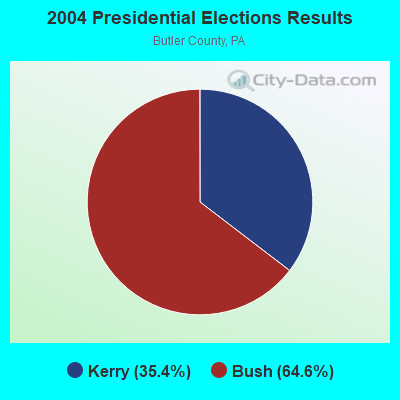
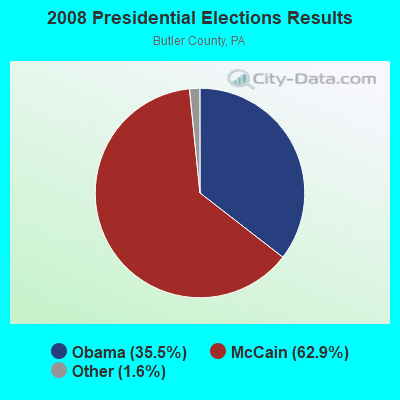
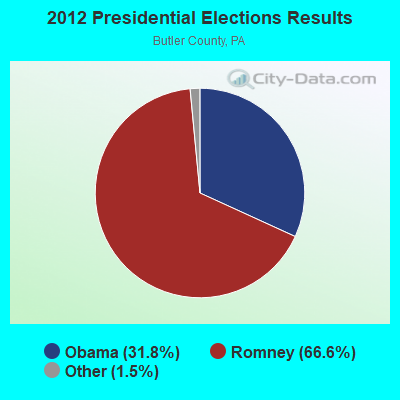
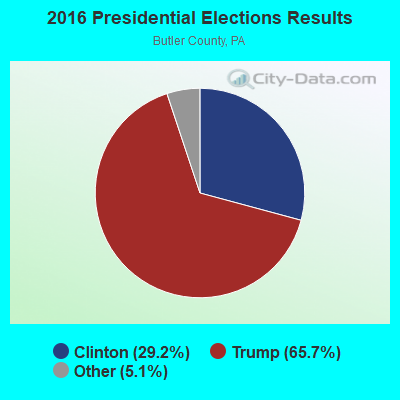

Graphs represent county-level data. Detailed 2008 Election Results
Religion statistics for Butler, PA (based on Butler County data)
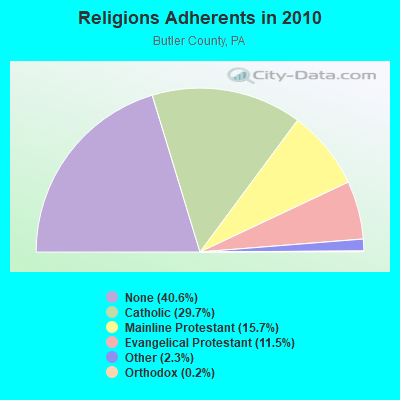
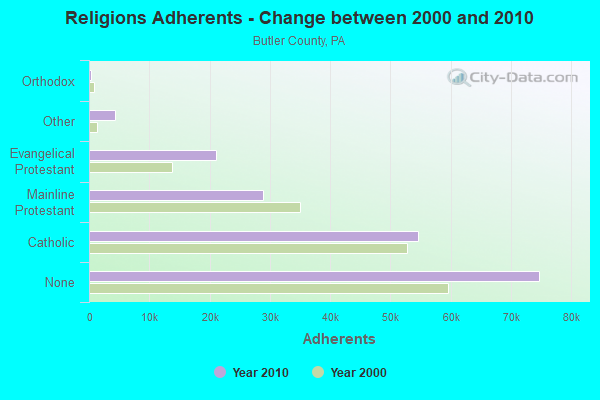
| Religion | Adherents | Congregations |
|---|---|---|
| Catholic | 54,600 | 25 |
| Mainline Protestant | 28,835 | 95 |
| Evangelical Protestant | 21,100 | 92 |
| Other | 4,288 | 11 |
| Orthodox | 310 | 4 |
| None | 74,729 | - |
Food Environment Statistics:
| This county: | 1.87 / 10,000 pop. |
| Pennsylvania: | 2.04 / 10,000 pop. |
| Butler County: | 0.17 / 10,000 pop. |
| Pennsylvania: | 0.09 / 10,000 pop. |
| Here: | 0.55 / 10,000 pop. |
| Pennsylvania: | 0.88 / 10,000 pop. |
| This county: | 3.30 / 10,000 pop. |
| Pennsylvania: | 2.52 / 10,000 pop. |
| This county: | 6.49 / 10,000 pop. |
| Pennsylvania: | 7.12 / 10,000 pop. |
| This county: | 8.0% |
| State: | 9.1% |
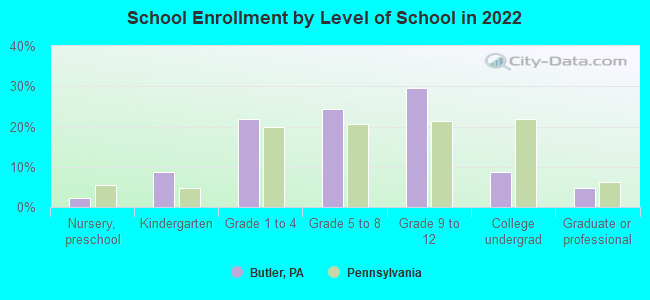
| Here: | 25.1% |
| Pennsylvania: | 27.2% |
| Here: | 10.4% |
| State: | 11.5% |
Health and Nutrition:
| This city: | 49.9% |
| Pennsylvania: | 50.2% |
| Butler: | 47.4% |
| Pennsylvania: | 47.1% |
| This city: | 29.1 |
| Pennsylvania: | 28.7 |
| Butler: | 22.3% |
| Pennsylvania: | 20.8% |
| Here: | 12.0% |
| Pennsylvania: | 10.9% |
| Butler: | 6.8 |
| State: | 6.8 |
| Butler: | 36.5% |
| Pennsylvania: | 34.3% |
| Butler: | 56.6% |
| State: | 56.2% |
| This city: | 78.1% |
| Pennsylvania: | 78.3% |
More about Health and Nutrition of Butler, PA Residents
| Local government employment and payroll (March 2022) | |||||
| Function | Full-time employees | Monthly full-time payroll | Average yearly full-time wage | Part-time employees | Monthly part-time payroll |
|---|---|---|---|---|---|
| Police Protection - Officers | 22 | $143,366 | $78,200 | 0 | $0 |
| Firefighters | 17 | $130,375 | $92,029 | 0 | $0 |
| Streets and Highways | 5 | $32,304 | $77,530 | 0 | $0 |
| Other Government Administration | 4 | $17,677 | $53,031 | 7 | $6,479 |
| Other and Unallocable | 3 | $14,838 | $59,352 | 1 | $635 |
| Parks and Recreation | 3 | $21,242 | $84,968 | 0 | $0 |
| Financial Administration | 2 | $7,852 | $47,112 | 3 | $3,319 |
| Judicial and Legal | 0 | $0 | 1 | $6,406 | |
| Totals for Government | 56 | $367,653 | $78,783 | 12 | $16,839 |
Butler government finances - Expenditure in 2021 (per resident):
- Construction - Sewerage: $229,000 ($17.38)
General Public Buildings: $108,000 ($8.20)
- Current Operations - Regular Highways: $2,668,000 ($202.49)
Police Protection: $2,572,000 ($195.20)
Local Fire Protection: $2,525,000 ($191.64)
Central Staff Services: $680,000 ($51.61)
Housing and Community Development: $442,000 ($33.55)
Parks and Recreation: $334,000 ($25.35)
General - Other: $288,000 ($21.86)
Financial Administration: $178,000 ($13.51)
Parking Facilities: $160,000 ($12.14)
Protective Inspection and Regulation - Other: $133,000 ($10.09)
General Public Buildings: $110,000 ($8.35)
Judicial and Legal Services: $66,000 ($5.01)
Libraries: $31,000 ($2.35)
Health - Other: $12,000 ($0.91)
Natural Resources - Other: $8,000 ($0.61)
- General - Interest on Debt: $282,000 ($21.40)
- Other Capital Outlay - Police Protection: $41,000 ($3.11)
Central Staff Services: $39,000 ($2.96)
- Total Salaries and Wages: $3,987,000 ($302.60)
Butler government finances - Revenue in 2021 (per resident):
- Charges - Parking Facilities: $793,000 ($60.19)
Other: $117,000 ($8.88)
- Federal Intergovernmental - Housing and Community Development: $424,000 ($32.18)
Other: $274,000 ($20.80)
- Local Intergovernmental - Other: $572,000 ($43.41)
General Local Government Support: $31,000 ($2.35)
- Miscellaneous - General Revenue - Other: $288,000 ($21.86)
Fines and Forfeits: $87,000 ($6.60)
Donations From Private Sources: $43,000 ($3.26)
Interest Earnings: $17,000 ($1.29)
Rents: $14,000 ($1.06)
Sale of Property: $3,000 ($0.23)
- State Intergovernmental - Other: $603,000 ($45.77)
Highways: $437,000 ($33.17)
Housing and Community Development: $30,000 ($2.28)
General Local Government Support: $10,000 ($0.76)
- Tax - Property: $2,828,000 ($214.63)
Occupation and Business License - Other: $1,886,000 ($143.14)
Individual Income: $1,001,000 ($75.97)
Public Utility License: $176,000 ($13.36)
Documentary and Stock Transfer: $142,000 ($10.78)
Butler government finances - Debt in 2021 (per resident):
- Long Term Debt - Beginning Outstanding - Unspecified Public Purpose: $8,889,000 ($674.64)
Outstanding Unspecified Public Purpose: $8,554,000 ($649.21)
Retired Unspecified Public Purpose: $3,500,000 ($265.63)
Issue, Unspecified Public Purpose: $3,165,000 ($240.21)
Butler government finances - Cash and Securities in 2021 (per resident):
- Bond Funds - Cash and Securities: $466,000 ($35.37)
- Other Funds - Cash and Securities: $877,000 ($66.56)
| Businesses in Butler, PA | ||||
| Name | Count | Name | Count | |
|---|---|---|---|---|
| 7-Eleven | 2 | Lowe's | 1 | |
| ALDI | 1 | Marriott | 1 | |
| AT&T | 2 | MasterBrand Cabinets | 3 | |
| Advance Auto Parts | 3 | Mazda | 1 | |
| Aeropostale | 1 | McDonald's | 4 | |
| American Eagle Outfitters | 1 | Motherhood Maternity | 1 | |
| Applebee's | 1 | New Balance | 2 | |
| Arby's | 2 | Nike | 7 | |
| AutoZone | 1 | Old Country Buffet | 1 | |
| Bath & Body Works | 1 | Panera Bread | 1 | |
| Blockbuster | 1 | Papa John's Pizza | 1 | |
| Burger King | 1 | Payless | 1 | |
| Carson Pirie Scott | 1 | Penske | 1 | |
| Chevrolet | 1 | Pizza Hut | 2 | |
| Chuck E. Cheese's | 1 | RadioShack | 2 | |
| Comfort Inn | 1 | Red Lobster | 1 | |
| Cricket Wireless | 1 | Rite Aid | 4 | |
| Curves | 1 | Rue21 | 1 | |
| Dairy Queen | 4 | SAS Shoes | 1 | |
| Days Inn | 1 | Sam's Club | 1 | |
| Deb | 1 | Sears | 2 | |
| Dunkin Donuts | 1 | Shoe Carnival | 1 | |
| Famous Footwear | 1 | Spencer Gifts | 1 | |
| FedEx | 5 | Sprint Nextel | 1 | |
| Finish Line | 1 | Staples | 1 | |
| Ford | 1 | Subaru | 1 | |
| GNC | 3 | Subway | 5 | |
| GameStop | 2 | Super 8 | 2 | |
| Goodwill | 1 | T-Mobile | 3 | |
| H&R Block | 3 | T.J.Maxx | 1 | |
| Home Depot | 1 | Taco Bell | 1 | |
| Honda | 1 | Target | 1 | |
| Hot Topic | 1 | Toyota | 1 | |
| Hyundai | 1 | Toys"R"Us | 1 | |
| JCPenney | 1 | U-Haul | 4 | |
| Jones New York | 3 | UPS | 8 | |
| Justice | 1 | Vans | 2 | |
| KFC | 1 | Verizon Wireless | 2 | |
| Kmart | 1 | Volkswagen | 1 | |
| Kohl's | 1 | Walgreens | 1 | |
| La-Z-Boy | 2 | Walmart | 1 | |
| Lane Furniture | 3 | Wendy's | 2 | |
| Little Caesars Pizza | 2 | YMCA | 2 | |
| Long John Silver's | 1 | |||
Strongest AM radio stations in Butler:
- WISR (680 AM; 0 kW; BUTLER, PA; Owner: WBUT, INCORPORATED)
- KDKA (1020 AM; 50 kW; PITTSBURGH, PA; Owner: INFINITY BROADCASTING OPERATIONS, INC.)
- WBUT (1050 AM; 0 kW; BUTLER, PA; Owner: WBUT, INC.)
- WPIT (730 AM; 5 kW; PITTSBURGH, PA; Owner: PENNSYLVANIA MEDIA ASSOCIATES, INC.)
- WWVA (1170 AM; 53 kW; WHEELING, WV; Owner: CAPSTAR TX LIMITED PARTNERSHIP)
- WBGG (970 AM; 5 kW; PITTSBURGH, PA; Owner: AMFM RADIO LICENSES, L.L.C.)
- WBZY (1280 AM; 5 kW; NEW CASTLE, PA; Owner: CITICASTERS LICENSES, L.P.)
- WAVL (910 AM; 5 kW; APOLLO, PA; Owner: EVANGEL HEIGHTS ASSEMBLY OF GOD)
- KQV (1410 AM; 5 kW; PITTSBURGH, PA; Owner: CALVARY, INC.)
- WKST (1200 AM; 5 kW; NEW CASTLE, PA; Owner: CITICASTERS LICENSES, L.P.)
- WKBN (570 AM; 5 kW; YOUNGSTOWN, OH; Owner: CITICASTERS LICENSES, L.P.)
- WKNR (850 AM; 50 kW; CLEVELAND, OH; Owner: CARON BROADCASTING, INC.)
- WTAM (1100 AM; 50 kW; CLEVELAND, OH; Owner: JACOR BROADCASTING CORPORATION)
Strongest FM radio stations in Butler:
- WLER-FM (97.7 FM; BUTLER, PA; Owner: WBUT, INC.)
- WZPT (100.7 FM; NEW KENSINGTON, PA; Owner: INFINITY RADIO SUBSIDIARY OPERATIONS INC.)
- WLTJ (92.9 FM; PITTSBURGH, PA; Owner: WPNT, INC.)
- WSHH (99.7 FM; PITTSBURGH, PA; Owner: RENDA B/CING CORP. OF NEVADA)
- WJJJ (104.7 FM; PITTSBURGH, PA; Owner: CAPSTAR TX LIMITED PARTNERSHIP)
- WDVE (102.5 FM; PITTSBURGH, PA; Owner: CAPSTAR TX LIMITED PARTNERSHIP)
- WDSY-FM (107.9 FM; PITTSBURGH, PA; Owner: INFINITY RADIO SUBSIDIARY OPERATIONS INC.)
- WMXY (98.9 FM; YOUNGSTOWN, OH; Owner: CITICASTERS LICENSES, L.P.)
- WWSW-FM (94.5 FM; PITTSBURGH, PA; Owner: AMFM RADIO LICENSES, L.L.C.)
- WAMO-FM (106.7 FM; BEAVER FALLS, PA; Owner: MCL/MCM-INC)
- WQED-FM (89.3 FM; PITTSBURGH, PA; Owner: WQED MULTIMEDIA)
- WICT (95.1 FM; GROVE CITY, PA; Owner: YOUNGSTOWN RADIO LICENSE, L.L.C.)
- WOGF (104.3 FM; EAST LIVERPOOL, OH; Owner: KEYMARKET LICENSES, LLC)
- WORD-FM (101.5 FM; PITTSBURGH, PA; Owner: PENNSYLVANIA MEDIA ASSOCIATES, INC.)
- WBZZ (93.7 FM; PITTSBURGH, PA; Owner: INFINITY RADIO SUBSIDIARY OPERATIONS INC.)
- WXDX-FM (105.9 FM; PITTSBURGH, PA; Owner: CAPSTAR TX LIMITED PARTNERSHIP)
- WRRK (96.9 FM; BRADDOCK, PA; Owner: WPNT INC)
- WOGI (98.3 FM; DUQUESNE, PA; Owner: KEYMARKET LICENSES, LLC)
- WJST (92.1 FM; ELLWOOD CITY, PA; Owner: CITICASTERS LICENSES, L.P.)
- WPTS-FM (92.1 FM; PITTSBURGH, PA; Owner: UNIV. OF PITTSBURGH COMMONWEALTH SYS)
TV broadcast stations around Butler:
- WPXI (Channel 11; PITTSBURGH, PA; Owner: WPXI-TV HOLDINGS, INC.)
- KDKA-TV (Channel 2; PITTSBURGH, PA; Owner: CBS BROADCASTING INC.)
- WKBN-TV (Channel 27; YOUNGSTOWN, OH; Owner: PIEDMONT TELEVISION OF YOUNGSTOWN LICENSE LLC)
- WBGN-LP (Channel 59; PITTSBURGH, PA; Owner: BRUNO GOODWORTH NETWORK, INC.)
- WPTG-LP (Channel 69; PITTSBURGH, PA; Owner: ABACUS TELEVISION)
- WPGH-TV (Channel 53; PITTSBURGH, PA; Owner: WPGH LICENSEE, LLC)
- WQEX (Channel 16; PITTSBURGH, PA; Owner: WQED MULTIMEDIA)
- WCWB (Channel 22; PITTSBURGH, PA; Owner: WCWB LICENSEE, LLC)
- W65CG (Channel 65; PITTSBURGH, PA; Owner: TRINITY BROADCASTING NETWORK)
- WPCB-TV (Channel 40; GREENSBURG, PA; Owner: CORNERSTONE TELEVISION, INC.)
- W25AX (Channel 25; KITTANNING, PA; Owner: TURNPIKE TELEVISION)
- WTAE-TV (Channel 4; PITTSBURGH, PA; Owner: WTAE HEARST-ARGYLE TV, INC. (CA CORP.))
- WBPA-LP (Channel 29; PITTSBURGH, PA; Owner: VENTURE TECHNOLOGIES GROUP, LLC)
- W66BQ (Channel 66; BEAVER, PA; Owner: BRUNO-GOODWORTH NETWORK, INC.)
- WFMJ-TV (Channel 21; YOUNGSTOWN, OH; Owner: WFMJ TELEVISION, INC.)
- W56CL (Channel 56; NEW CASTLE, PA; Owner: BRUNO-GOODWORTH NETWORK, INC.)
- WQED (Channel 13; PITTSBURGH, PA; Owner: WQED MULTIMEDIA)
- W61CC (Channel 61; PITTSBURGH, PA; Owner: THE VIDEOHOUSE, INC.)
- W60BL (Channel 60; BUTLER, PA; Owner: TURNPIKE TELEVISION)
- WIIC-LP (Channel 29; PITTSBURGH, PA; Owner: ABACUS TELEVISION)
- WBOA-LP (Channel 64; KITTANNING, PA; Owner: ABACUS TELEVISION)
- National Bridge Inventory (NBI) Statistics
- 15Number of bridges
- 240ft / 73.0mTotal length
- $1,604,000Total costs
- 64,977Total average daily traffic
- 4,424Total average daily truck traffic
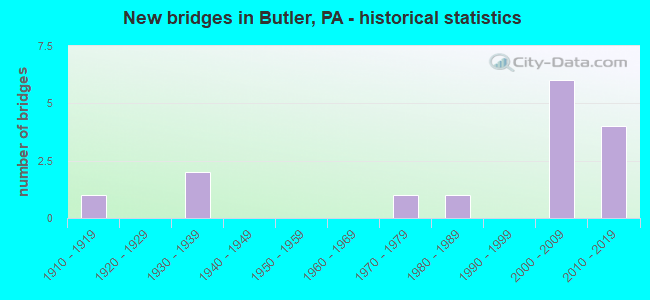
- New bridges - historical statistics
- 11910-1919
- 21930-1939
- 11970-1979
- 11980-1989
- 62000-2009
- 42010-2019
FCC Registered Antenna Towers: 139 (See the full list of FCC Registered Antenna Towers)
FCC Registered Commercial Land Mobile Towers: 1 (See the full list of FCC Registered Commercial Land Mobile Towers in Butler, PA)
FCC Registered Private Land Mobile Towers: 3 (See the full list of FCC Registered Private Land Mobile Towers)
FCC Registered Broadcast Land Mobile Towers: 55 (See the full list of FCC Registered Broadcast Land Mobile Towers)
FCC Registered Microwave Towers: 29 (See the full list of FCC Registered Microwave Towers in this town)
FCC Registered Paging Towers: 8 (See the full list of FCC Registered Paging Towers)
FCC Registered Maritime Coast & Aviation Ground Towers: 4 (See the full list of FCC Registered Maritime Coast & Aviation Ground Towers)
FCC Registered Amateur Radio Licenses: 303 (See the full list of FCC Registered Amateur Radio Licenses in Butler)
FAA Registered Aircraft Manufacturers and Dealers: 2 (See the full list of FAA Registered Manufacturers and Dealers in Butler)
FAA Registered Aircraft: 52 (See the full list of FAA Registered Aircraft)
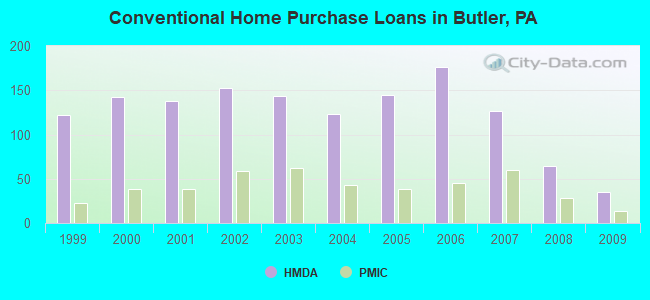
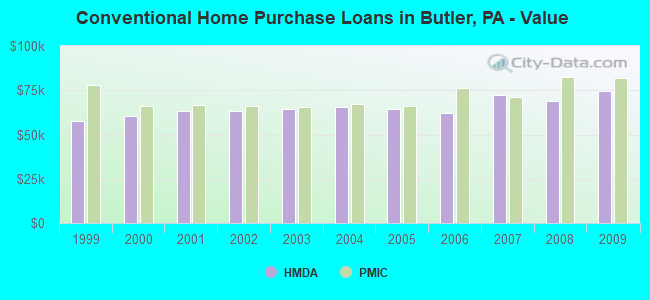
| Home Mortgage Disclosure Act Aggregated Statistics For Year 2009 (Based on 5 full tracts) | ||||||||||||
| A) FHA, FSA/RHS & VA Home Purchase Loans | B) Conventional Home Purchase Loans | C) Refinancings | D) Home Improvement Loans | E) Loans on Dwellings For 5+ Families | F) Non-occupant Loans on < 5 Family Dwellings (A B C & D) | |||||||
|---|---|---|---|---|---|---|---|---|---|---|---|---|
| Number | Average Value | Number | Average Value | Number | Average Value | Number | Average Value | Number | Average Value | Number | Average Value | |
| LOANS ORIGINATED | 54 | $87,704 | 35 | $74,743 | 93 | $72,914 | 31 | $20,903 | 1 | $532,000 | 8 | $50,375 |
| APPLICATIONS APPROVED, NOT ACCEPTED | 0 | $0 | 0 | $0 | 8 | $65,125 | 3 | $11,333 | 2 | $290,000 | 2 | $70,000 |
| APPLICATIONS DENIED | 11 | $70,182 | 10 | $48,700 | 66 | $93,682 | 26 | $28,577 | 2 | $45,000 | 7 | $29,429 |
| APPLICATIONS WITHDRAWN | 3 | $57,000 | 6 | $61,333 | 34 | $86,676 | 10 | $32,100 | 0 | $0 | 5 | $44,200 |
| FILES CLOSED FOR INCOMPLETENESS | 1 | $72,000 | 0 | $0 | 7 | $82,857 | 0 | $0 | 1 | $528,000 | 0 | $0 |
Detailed HMDA statistics for the following Tracts: 9021.00 , 9022.00, 9023.00, 9024.00, 9025.00
| Private Mortgage Insurance Companies Aggregated Statistics For Year 2009 (Based on 5 full tracts) | ||||
| A) Conventional Home Purchase Loans | B) Refinancings | |||
|---|---|---|---|---|
| Number | Average Value | Number | Average Value | |
| LOANS ORIGINATED | 14 | $81,786 | 1 | $130,000 |
| APPLICATIONS APPROVED, NOT ACCEPTED | 4 | $86,250 | 2 | $86,000 |
| APPLICATIONS DENIED | 0 | $0 | 0 | $0 |
| APPLICATIONS WITHDRAWN | 2 | $76,000 | 1 | $188,000 |
| FILES CLOSED FOR INCOMPLETENESS | 0 | $0 | 0 | $0 |
Detailed PMIC statistics for the following Tracts: 9021.00 , 9022.00, 9023.00, 9024.00, 9025.00
2003 - 2018 National Fire Incident Reporting System (NFIRS) incidents
- Fire incident types reported to NFIRS in Butler, PA
- 51751.6%Structure Fires
- 22922.9%Outside Fires
- 16816.8%Other
- 888.8%Mobile Property/Vehicle Fires
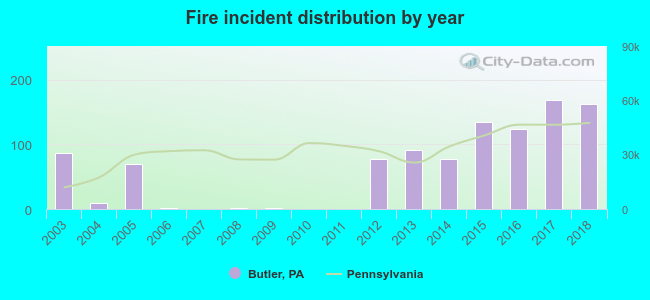 According to the data from the years 2003 - 2018 the average number of fire incidents per year is 63. The highest number of fires - 168 took place in 2017, and the least - 0 in 2007. The data has a rising trend.
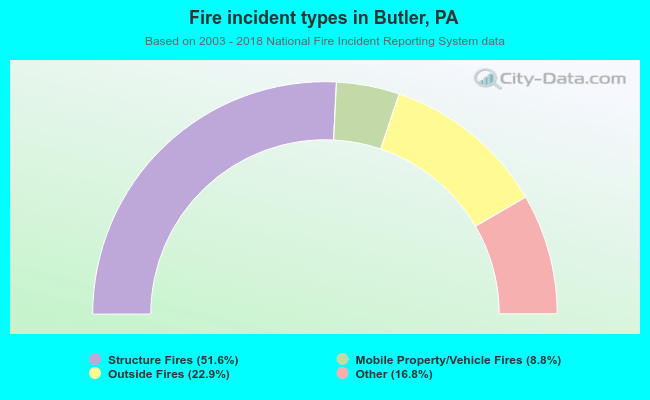 When looking into fire subcategories, the most reports belonged to: Structure Fires (51.6%), and Outside Fires (22.9%).
Fire-safe hotels and motels in Butler, Pennsylvania:
- Holiday Inn Express And Suites, 203 N Duffy Rd, Butler, Pennsylvania 16001 , Phone: (724) 841-0103
- Hampton Inn Butler, 610 Butler Xing, Butler, Pennsylvania 16001 , Phone: (724) 431-2400, Fax: (724) 431-2401
- SpringHill Suites Butler Centre City, 125 E Jefferson St, Butler, Pennsylvania 16001 , Phone: (724) 256-9844, Fax: (724) 256-9845
| Most common first names in Butler, PA among deceased individuals | ||
| Name | Count | Lived (average) |
|---|---|---|
| John | 701 | 75.0 years |
| Mary | 665 | 80.6 years |
| William | 542 | 73.8 years |
| Robert | 375 | 69.2 years |
| James | 347 | 71.4 years |
| Joseph | 335 | 74.4 years |
| Helen | 313 | 79.1 years |
| Charles | 302 | 75.3 years |
| Margaret | 291 | 79.7 years |
| George | 285 | 76.2 years |
| Most common last names in Butler, PA among deceased individuals | ||
| Last name | Count | Lived (average) |
|---|---|---|
| Miller | 204 | 76.7 years |
| Smith | 156 | 74.6 years |
| Thompson | 92 | 76.3 years |
| Brown | 84 | 75.7 years |
| Campbell | 80 | 78.7 years |
| Graham | 76 | 75.8 years |
| Green | 68 | 76.1 years |
| Stewart | 67 | 72.1 years |
| Snyder | 67 | 76.6 years |
| Bowser | 61 | 71.7 years |
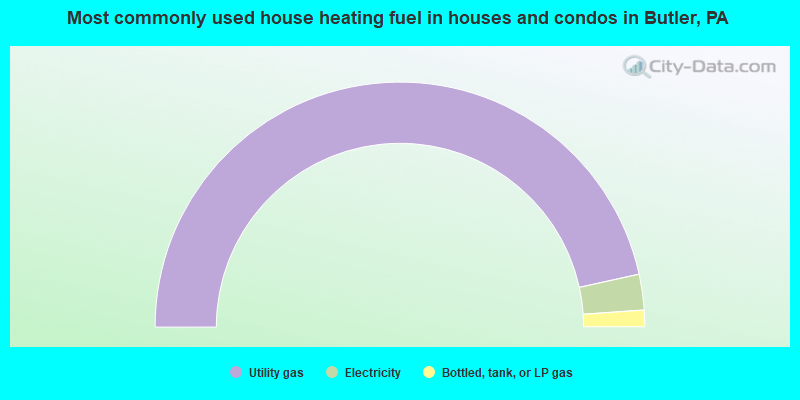
- 93.0%Utility gas
- 4.7%Electricity
- 2.2%Bottled, tank, or LP gas
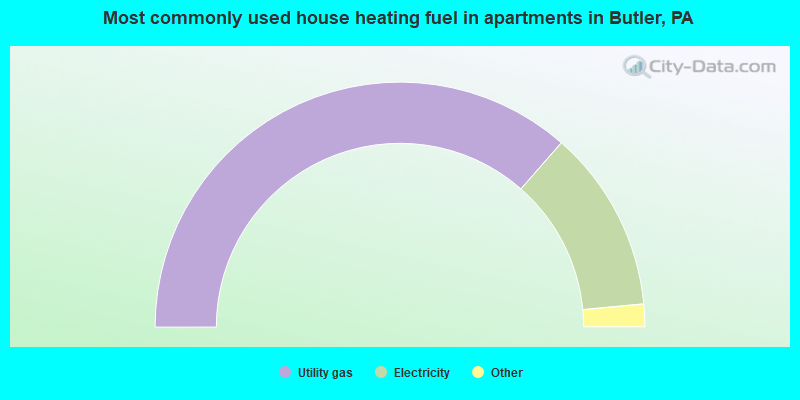
- 72.9%Utility gas
- 24.1%Electricity
- 1.3%Bottled, tank, or LP gas
- 1.2%Other fuel
- 0.5%No fuel used
Butler compared to Pennsylvania state average:
- Median household income below state average.
- Median house value below state average.
- Unemployed percentage below state average.
- Black race population percentage significantly below state average.
- Hispanic race population percentage significantly below state average.
- Foreign-born population percentage significantly below state average.
- Renting percentage above state average.
- Length of stay since moving in above state average.
- Number of college students below state average.
Butler on our top lists:
- #34 on the list of "Top 100 high-educated but low-earning cities (pop. 5,000+)"
- #37 on the list of "Top 101 cities with the largest percentage of people in other hospitals or wards for chronically ill (population 1,000+)"
- #45 on the list of "Top 101 cities with the largest percentage of people in hospitals/wards and hospices for chronically ill (population 1,000+)"
- #49 on the list of "Top 100 cities with oldest houses (pop. 5,000+)"
- #64 on the list of "Top 100 cities with old houses but young residents (pop. 5,000+)"
- #51 on the list of "Top 101 counties with the lowest number of births per 1000 residents 2007-2013"
- #66 on the list of "Top 101 counties with the largest decrease in the number of births per 1000 residents 2000-2006 to 2007-2013 (pop 50,000+)"

|
|
Total of 263 patent applications in 2008-2024.